Introduction
Cancer is caused by the accumulation of genomic
alterations and consequent disruption of biological processes
(1). The rapid progression and wide
application of sequencing technologies has enabled the
identification of hundreds of thousands of somatic variants in
cancer (2). A significant issue in
cancer genomics is the distinction of driver mutations, critical to
oncogenesis, from passenger ones, which have little role in cancer
initiation and progression (3). The
development of reliable and efficient approaches to functionally
annotate variants has been a consistent research focus in
cancer-associated studies, and multiple computational tools have
been investigated and widely utilized for the prediction of
pathogenic mutations in the coding portion of the human genome,
including the ‘sorting tolerant from intolerant’ algorithm
(4) and the ‘polymorphism
phenotyping’ tool (5). As an
increasing number of non-coding pathogenic variants have been
detected and annotated, there exists a great demand for the
development of computational tools to prioritize non-coding drivers
in the cancer genome (6,7). However, there have been few studies
conducted in this field.
The recent completion of high-throughput projects,
including the Encyclopedia of DNA Elements (ENCODE) (8), 29 Mammals Project (9) and Health Roadmap Epigenomics Project
(10), has made non-coding variants
interpretable. In particular, the ENCODE project has provided
researchers with a genome-wide map of histone modification, DNase I
hypersensitive sites, formaldehyde-assisted isolation of regulatory
elements, transcription factor binding sites, RNA-seq and
replication timing data across a number of cell lines (8). An increasing number of studies have
taken advantage of these annotations of human functional elements
to investigate non-coding disease-implicated variants or drivers in
cancer, including RegulomeDB (11),
HaploReg (12) and Funseq (13); the scoring systems that these
approaches rely on are primarily empirical scoring algorithms,
which are not scientifically rigorous and stringent (14).
Previous studies have taken advantage of
machine-learning algorithms to better predict and score the
functionality of non-coding variants (15–17).
Kircher et al (18) contrasted
the annotations of fixed or nearly fixed derived alleles in humans
with those of simulated variants, and developed Combined
Annotation-Dependent Depletion (CADD). CADD evaluates
deleteriousness, which can be measured systematically across the
genome assembly. Implementation of CADD as a support vector machine
has successfully differentiated 14.7 million high-frequency
human-derived alleles from 14.7 million simulated variants
(18). Fu et al (19) developed a computational framework,
FunSeq2, which processed large-scale genomics (including 1000
Genomes and ENCODE data) and cancer resources, and combined a
high-throughput variant prioritization pipeline to annotate and
prioritize somatic alterations, particularly regulatory non-coding
mutations.
LncRNAs are a class of mRNA-like transcripts ranging
from 200 bp to 100 kbp. They were regarded as transcription noise
in the human genome, due to their lack of capability of protein
translation. Over the previous decade, an increasing amount of
evidence has indicated that lncRNAs have a variety of roles in
numerous physiological processes (19–25).
Despite a lack of capability of encoding proteins, lncRNAs may
function through regulating gene expression at various levels,
including chromatin architecture, transcription, RNA splicing, and
protein translation and turnover (26,27). As a
consequence, deregulation of lncRNAs may have a significant role in
carcinogenesis (28–31).
In the present study, data concerning conservation
information, regulatory features, expression and replication timing
was collected, primarily from the ENCODE project, to create lung
cancer-specific annotation and construct a logistic regression
model based on ClinVar and HGMD pathogenic variants with the aim of
functionally scoring non-coding variants in the lung cancer genome.
This scoring system was applied to prioritize potential
cancer-associated lncRNA candidates.
Materials and methods
Cancer mutation and pathogenic variant
data
A total of 1,623,250 somatic mutations detected by
whole genome sequencing of 24 pairs of lung cancer and normal
specimens were obtained from the supplementary data files of a
previous study (32). Recurrent
mutation represents two or more mutations that have the same
mutation site across multiple samples (n=14,515 mutations).
Non-recurrent mutation denotes mutations that only occur once in
all patients. Germline polymorphism data comprising 38,248,779
single nucleotide polymorphisms (SNPs) was downloaded from the 1000
Genome project pilot 1 (www.1000genomes.org) (33). SNPs with derived allele frequencies
>0.01 were considered to be neutral SNPs; rare SNPs denote those
whose allele frequencies were <0.01. Disease-associated variants
data from ClinVar (www.ncbi.nlm.nih.gov/clinvar) and the Human Gene
Mutation Database (HGMD; www.hgmd.cf.ac.uk) are known (published) gene variants
responsible for human inherited diseases (34,35). Trait
or disease-associated SNPs were obtained from genome-wide
association studies (GWAS; www.gwascentral.org) (36).
Genome-wide data resources
Human genome annotations were obtained from Gencode
(www.gencodegenes.org/) (37), including protein coding genes, exons,
introns, untranslated regions (UTRs) and non-coding exons (37). lncRNA annotation was primarily
acquired from three different sources, Gencode (37), Human Body Map large intergenic
non-coding RNAs and transcripts of uncertain coding potential
generated from 4 billion RNA-seq reads across 24 tissues and cell
types (38) and Refseq annotation
(www.ncbi.nlm.nih.gov/refseq/)
(39). In total, there were 39,952
lncRNA annotations collected from these three different databases.
The 5′ splicing sites were 10 nucleotides from the 5′ end of
introns of genes (40). The 3′
splicing sites were 50 nucleotides from the 3′ end of introns of
genes (41). Evolutionarily conserved
bases were identified using a recently published analysis of 46
mammalian genomes (42). A
genome-wide phastCons score was obtained from Siepel et al's
study (16) (hgdownload.cse.ucsc.edu/goldenPath/phastConsPaper/vertebrate-scores/).
Sensitive regions from Khurana et al (13) consisted of binding sites or motifs of
important transcription factors and contained an increased fraction
of rare SNPs. Evolutionarily conserved structures were RNA
secondary structures predicted using comparative structure
prediction algorithms based on multiple genomes (42). Promoters, defined as regions 2.5 kb
from transcription start sites (TSS), were generated from the
Gerstein lab (http://funseq.gersteinlab.org/data) (13). RNA-seq data in bam format,
transcription factor binding sites (TFBS), DNase I hypersensitive
sites and histone modification data (H3K4me1, H3K9ac and others) of
the A549 cell line were acquired from ENCODE (8). Conserved TFBS were transcription factor
binding sites conserved in the human/mouse/rat alignment and
obtained from University of California, Santa Cruz directly
(41). The expression level was
calculated by counting the number of reads per kilobase per million
reads (RPKM) for each protein coding gene and lncRNA. Genes whose
RPKM was >20 or <0.25 were defined as high and low expressed
regions, respectively. A wavelet-smoothed, weighted average signal
was used, and the high and low signal values corresponded with
early and late replication during the S phase, respectively
(genome.ucsc.edu/ENCODE, ‘Repli-seq
track’) (8). Genome-wide replication
timing was mapped to protein coding genes and lncRNAs. An
early-to-late ratio was calculated as (G1b+S1)/(S4+G2) for each
protein coding gene and lncRNA (43).
When the ratio (G1b+S1)/(S4+G2) was >1, genes were considered to
be early replicated, while late replicated genes had an
early-to-late ratio <1.
Cancer lncRNAs containing 25 lncRNAs are a
collection of mammalian long non-coding transcripts that have been
experimentally demonstrated to be associated with a variety of
cancer types. A list of cancer census genes was obtained from the
current release of the catalogue of somatic mutations in cancer
version 71 (COSMIC; cancer.sanger.ac.uk/cosmic) (44).
Logistic regression model training and
validation
The disease-implicated set of variants was composed
of 19,153 non-coding pathogenic variants from the ClinVar and HGMD
databases. For the control sets, the present study used neutral
variants whose minor allele frequency was ≥1% to reduce the
possibility of including functional rare SNPs. A total of
15,789,242 potential control SNPs were included in the model. In
the logistic regression model, a matrix of 425,565 rows was formed
throughout the non-coding genome, and each row represented one
unique combination of features. Disease-causing variants from HGMD
and ClinVar databases and neutral SNPs were used as the binary
response variables, and the 25 genomic features served as the
predictor variables to predict the likelihood of a variant being
disease-associated. The logistic regression model was constructed
with the general linear model. The receiver operating
characteristic (ROC) curve was generated with a R script (version
2.15.3; www.r-project.org). Scores were
predicted with the model for GWAS, neutral SNPs, and non-recurrent
and recurrent somatic mutations of lung cancer and subsequently
scaled using the following formula: scaled score=log(predicted
score × 106).
Prioritization of cancer-associated
lncRNA candidates
Cancer-associated lncRNA candidates were determined
with the following criteria. Firstly, the logistic regression model
was used to score each nucleotide of the lncRNAs and the average
score was calculated for each lncRNA. Secondly, 100 Mb non-coding
regions whose scores were >8.4149 were defined as high scoring
regions, and the fraction of high scoring regions for each lncRNA
was calculated. Subsequently, the final subset of lncRNA candidates
was determined by identifying the overlap between the top 10% of
lncRNAs with the highest average score and the top 10% of lncRNAs
with the highest fraction of high scoring regions.
RNA-seq data processing and expression
analyses of lncRNAs
A total of 161 RNA-seq data samples, including 76
normal lung samples and 85 cancerous samples, were obtained from
the Ju et al (45) study at
the European Bioinformatics Institute. Reads were mapped to the
hg19 genome using the Star aligner (https://github.com/alexdobin/STAR/releases) (46). Read counts were calculated with
bedtools version 2.22.1 (bedtools.readthedocs.org/en/latest/#) for each lncRNA
(47). The expression level in FPKM
was calculated with Cufflinks version 2.2.1 (cole-trapnell-lab.github.io/cufflinks/) (48) and log scaled for each lncRNA. DESeq2
Release version 3.0 (bioconductor.org/packages/release/bioc/html/DESeq2.html)
(49) was used to identify
differentially expressed transcripts between tumor and normal
pairs, with a cutoff of false discovery rate (FDR) ≤10−4
and absolute fold change ≥2.
Statistical analyses
Data are presented as the mean ± standard deviation.
Differences between different groups were drawn with the two-sided
Mann-Whitney U test or Fisher's exact test in R (version 2.15.3;
www.r-project.org). P<0.05 was considered to
indicate a statistically significant difference.
Results
Distinction of disease-associated
non-coding variants from neutral ones with the logistic regression
model
Estimates of the densities of ClinVar and HGMD
disease-causing variants revealed that the densities of
disease-associated variants varied greatly across various
non-coding features (Fig. 1A).
Certain features, including conserved regions, conserved TFBS,
UTRs, promoters and highly-expressed regions, demonstrated the
highest enrichment of pathogenic variants; however, features
including H3K9me3, late replicated regions, H3K27me3,
evolutionarily conserved structures and H2az had low densities of
disease-causing variants, suggesting that different non-coding
features have importance to the functionality of non-coding
variants. It was observed that conserved regions, early replicated
regions, promoters, H3K36me3 and conserved TFBSs most positively
contributed to the model, while H3K79me2, H3K4me2, H3K9me3, H3K9ac
and low-expressed regions were the most negatively informative for
the model (Fig. 1B). It was
demonstrated that the area under the ROC curve was 0.89 for the
logistic regression model (Fig. 1C),
which indicated that the model was able to discriminate between
disease-implicated and control variants with a high specificity and
sensitivity.
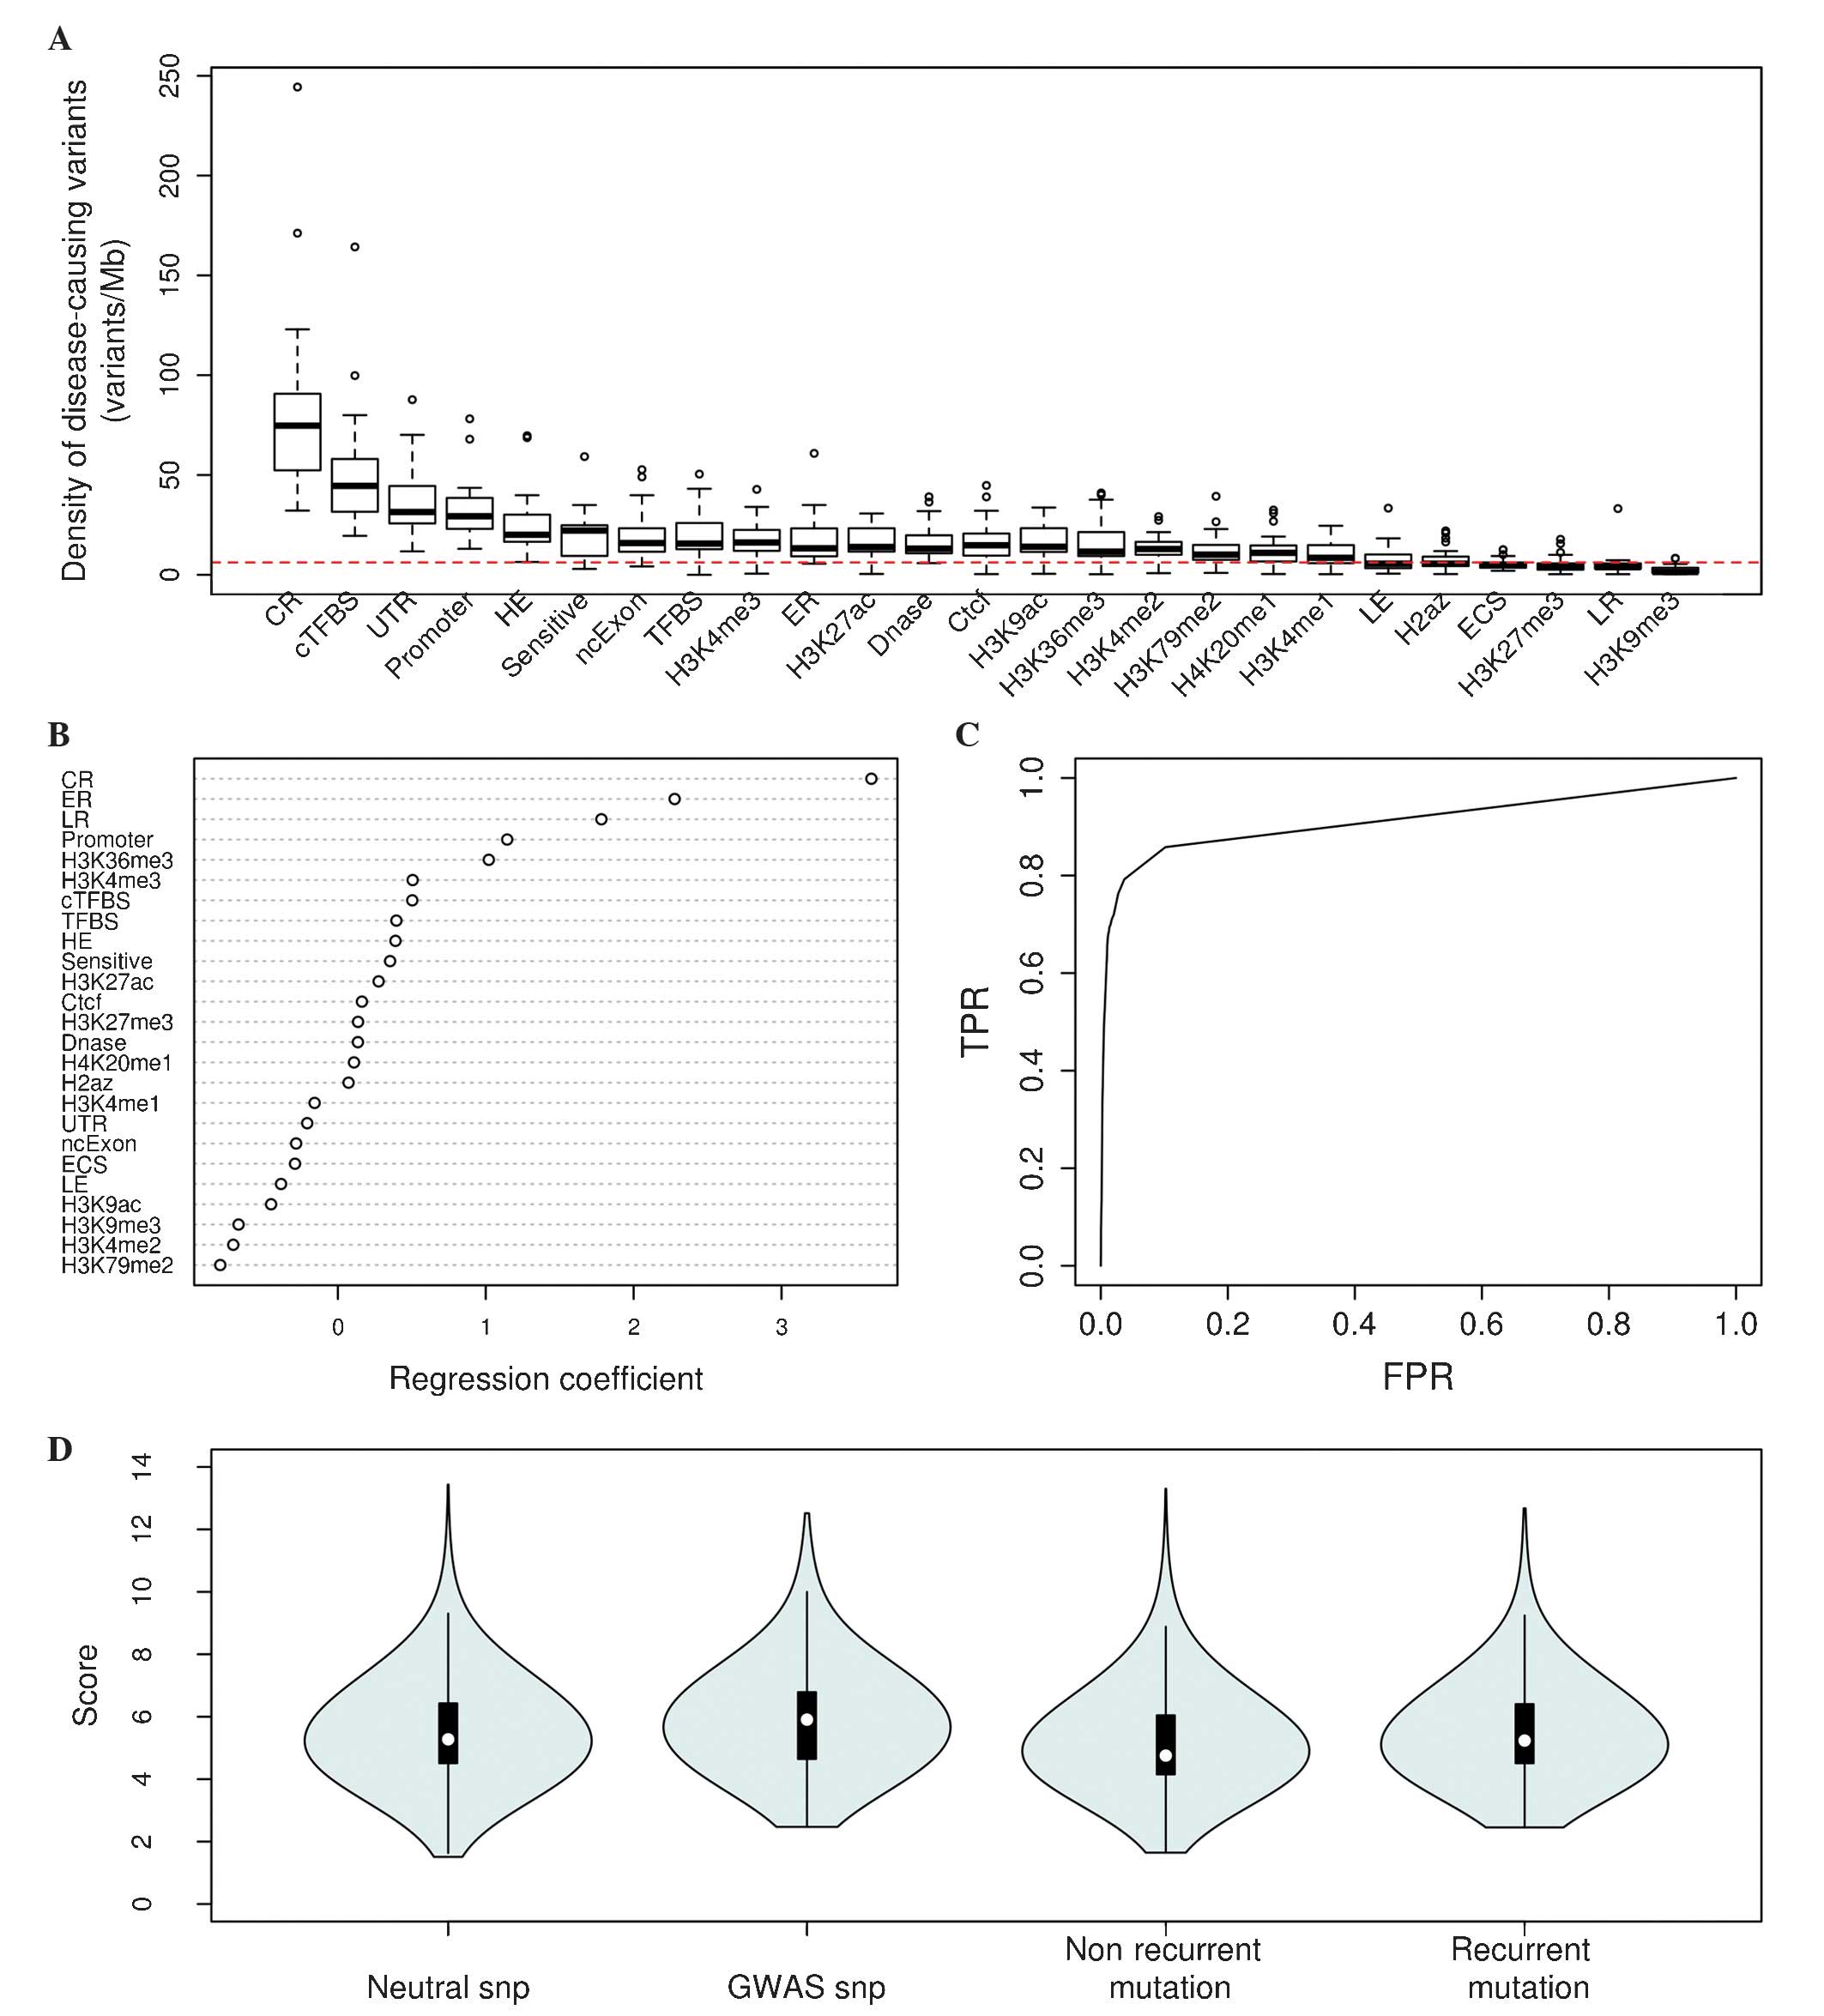 | Figure 1.Fitting and validation of the
logistic regression model. (A) Densities of ClinVar and Human Gene
Mutation Database pathogenic variants for all 25 non-coding
features (red line, average density in the human genome). (B)
Regression estimates for all features used in the logistic
regression model. (C) Receiver operating characteristic curve for
the model. (D) Scaled scores for GWAS, neutral SNPs (1 million
random neutral SNPs), non-recurrent and recurrent mutations of lung
cancer. CR, conserved region; TFBS, transcription factor binding
site; cTFBS, conserved TFBS; UTR, untranslated region; HE, highly
expressed region; SNP, single nucleotide polymorphism; Sensitive,
known binding sites or motifs of transcription factors with high
ratio of rare SNPs (allele frequency <0.01); ncExon, non coding
Exon; H3K4me1, H3K9ac, etc., histone modification data; ER, early
replicated region; Dnase, Dnase I hypersensitive site; LE, low
expressed region; ECS, evolutionarily conserved structure; LR, late
replicated region; TPR, true positive rate; FPR, false positive
rate; GWAS, genome-wide association study. |
To investigate whether the present model could be
applied to prioritize candidate functional variants, the disease or
trait-associated variants from GWAS were selected for an
independent validation. It was observed that non-coding GWAS SNPs
had a significantly higher average score compared with 1 million
random, neutral SNP control variants (mean, 5.9012 vs. 5.5238;
P<0.001, two-sided Mann-Whitney U test; Fig. 1D). Recurrence is considered to be a
potential sign of positive selection among tumors and is more
likely to be associated with driver events (50). Subsequently, the present study
evaluated recurrent mutations that occurred at the exact same site
across >2 samples, as well as non-recurrent mutations,
identified by whole-genome sequencing of 24 lung cancer samples. It
was identified that the same-site recurrent mutations (n=14,515
mutations) had significantly higher scores compared with the
non-recurrent mutations (mean, 5.4677 vs. 5.2277; P<0.001,
Mann-Whitney U test; Fig. 1D), which
suggested that this approach may be useful for the identification
of non-coding driver mutations in lung cancer.
Definition and characterization of
high-scoring regions in the non-coding genome
The present study defined 100 Mb non-coding regions,
which were scored >8.4149 as high-scoring regions, and analyzed
fractions of high-scoring regions in a variety of feature types.
The 5′ and 3′ splice sites and UTRs were among the features that
contained the highest fraction of high-scoring regions; by
contrast, intergenic regions, lncRNA introns and lncRNA
demonstrated the lowest fraction of high-scoring regions (Fig. 2A). The present model assigned a higher
average score to splicing sites compared with adjacent intronic
regions in protein coding genes (mean, 9.4374 vs. 8.3959;
P<0.001, Mann-Whitney U test; Fig.
2B) and lncRNAs (mean, 8.1802 vs. 7.8146; P<0.001,
Mann-Whitney U test; Fig. 2B).
Subsequently, the present study sought gene classes with various
fractions of high-scoring regions and identified that known cancer
genes from COSMIC had a significantly increased fraction of
high-scoring regions compared with non-cancerous ones (mean, 0.0817
vs. 0.0596; P<0.001, Fisher's exact test; Fig. 2C). Cancer-associated lncRNAs that were
collected from recent publications demonstrated a significantly
increased fraction of high-scoring regions compared with
non-cancerous ones (mean, 0.1112 vs. 0.0590; P<0.001, Fisher's
exact test; Fig. 2C), for example,
HOX transcript antisense RNA (HOTAIR), metastasis associated lung
adenocarcinoma transcript 1 (MALAT1), growth arrest-specific 5
(GAS5) and lung cancer associated transcript 1 are among the top
10% of lncRNAs with respect to high-scoring coverage (Fig. 2D).
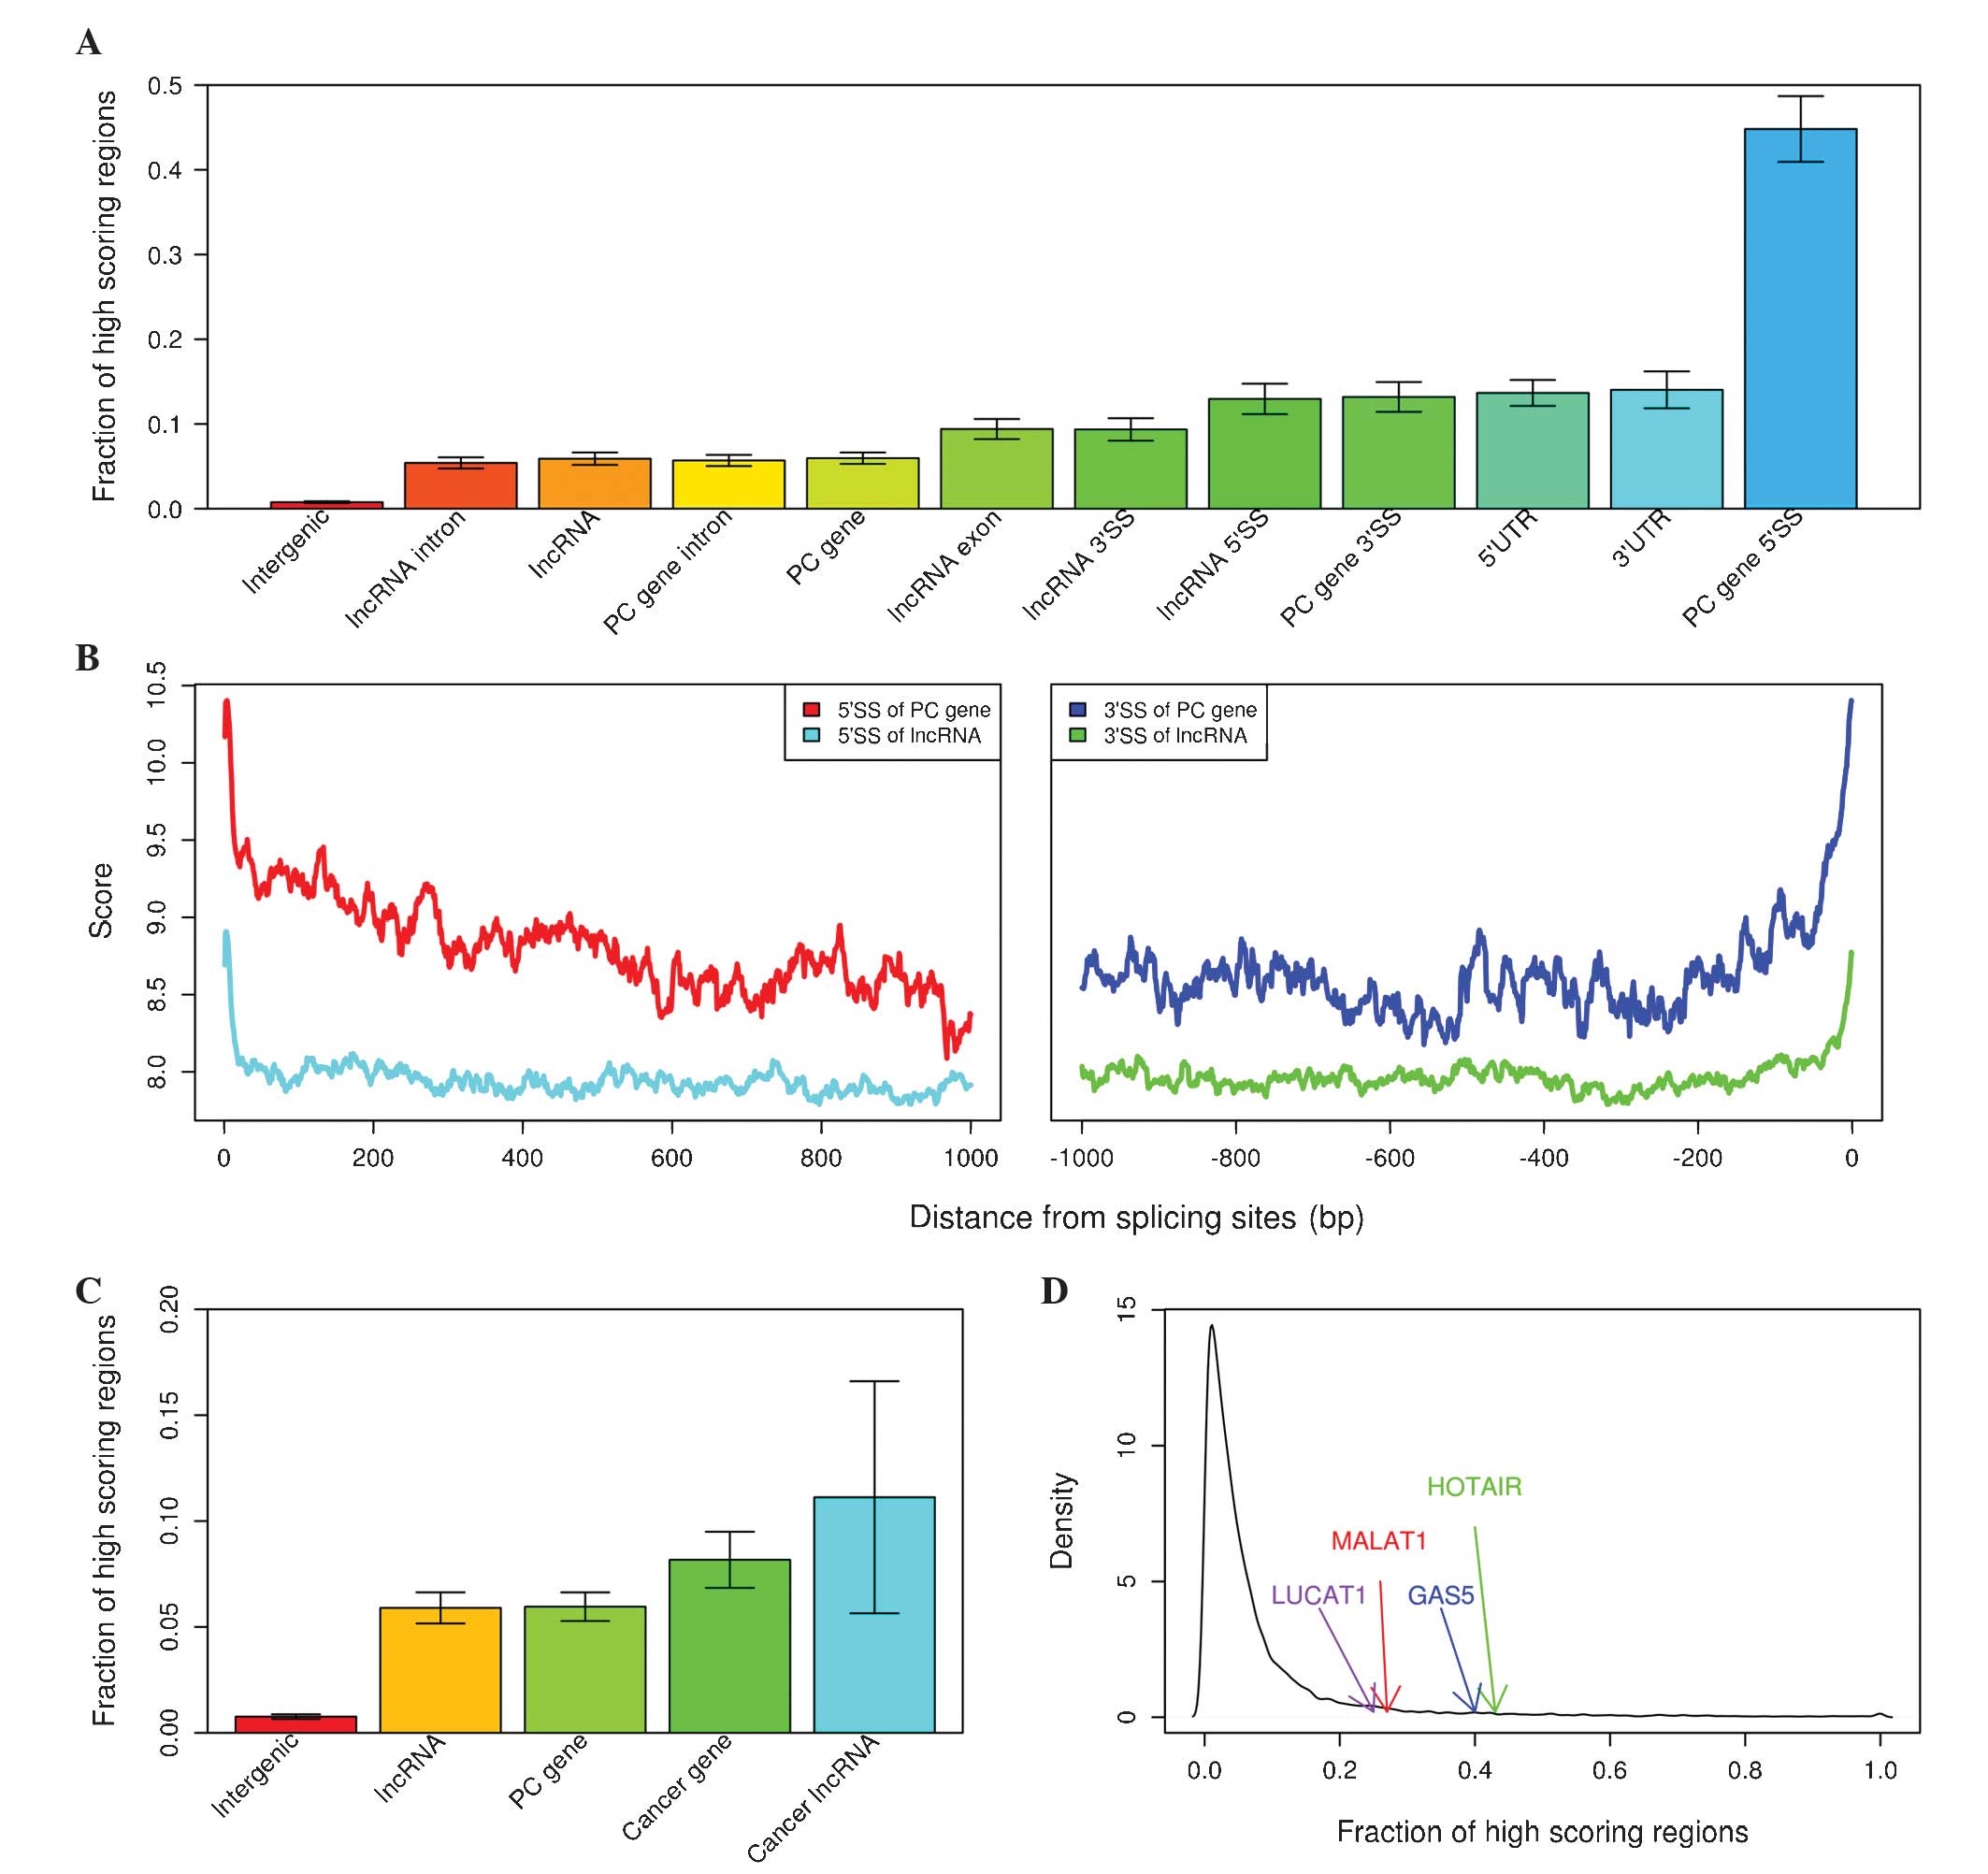 | Figure 2.Characterization of high-scoring
regions in lung cancer. (A) Fraction of high-scoring regions in
various non-coding features. (B) Average score in protein-coding
gene and lncRNA introns near 5′ splice site (left panel) and 3′
splice site (right panel). (C) Fraction of high-scoring regions in
various gene classes. (D) Density plot of fraction of high-scoring
regions in lncRNAs. lncRNA, long non-coding RNA; PC,
protein-coding; 5′SS, 5′ splice site, 10 nucleotides from the 5′
end of introns of genes; 3′SS, 3′ splice site, 50 nucleotides from
the 3′ end of introns of genes; UTR, untranslated region; LUCAT1,
lung cancer associated transcript 1; MALAT1, metastasis associated
lung adenocarcinoma transcript 1; GAS5, growth arrest-specific 5;
HOTAIR, HOX transcript antisense RNA. |
Prioritization of lung
cancer-associated lncRNAs with the scoring system
Regarding prioritization of lung cancer-implicated
lncRNAs, the fraction of high-scoring regions and average score
were calculated for each lncRNA. Subsequently, overlapping lncRNAs
were determined between the top 10% of lncRNAs with the highest
fraction of high scoring regions and the top 10% of lncRNAs with
the highest average score. A total of 2,679 lncRNAs were filtered
out as functional candidates, including some experimentally
characterized cancer-associated lncRNAs, including MALAT1, HOTAIR
and GAS5. In the present study it was demonstrated that this subset
of lncRNA candidates had a significantly increased fraction of
conserved regions (mean, 0.1741 vs. 0.0528; P<0.001,
Mann-Whitney U test; Fig. 3A) and
average phastCons score (mean, 0.2770 vs. 0.2602; P<0.001,
Mann-Whitney U test; Fig. 3B)
compared with control lncRNAs, indicating that they were more
conserved relative to control lncRNAs. It was additionally observed
that this subset of lncRNAs had an increased enrichment of disease
or trait-associated GWAS SNPs (mean, 6.2106 vs. 4.0618 SNPs/Mb;
P<0.001, Fisher's exact test; Fig.
3C) and a lower somatic mutation density compared with the
control lncRNAs (mean, 329.8380 vs. 573.2742 mutations/Mb;
P<0.001, Fisher's exact test; Fig.
3D). RNA-seq data of 76 normal lung samples and 85 cancer
samples were obtained from Ju et al's (45) study, which is publicly available from
the European Bioinformatics Institute. Read alignment was conducted
with a Star aligner and coverage was calculated for each lncRNA
with bedtools software. DESeq2 was used to investigate the
differential expression of lncRNAs between lung cancer and normal
samples. It was observed that the lncRNA candidates showed
significantly increased expression compared with control lncRNAs in
cancerous and normal samples (log scaled FPKM, 1.8924 vs. 1.1386;
P<2.2e-16, Mann-Whitney U test; Fig.
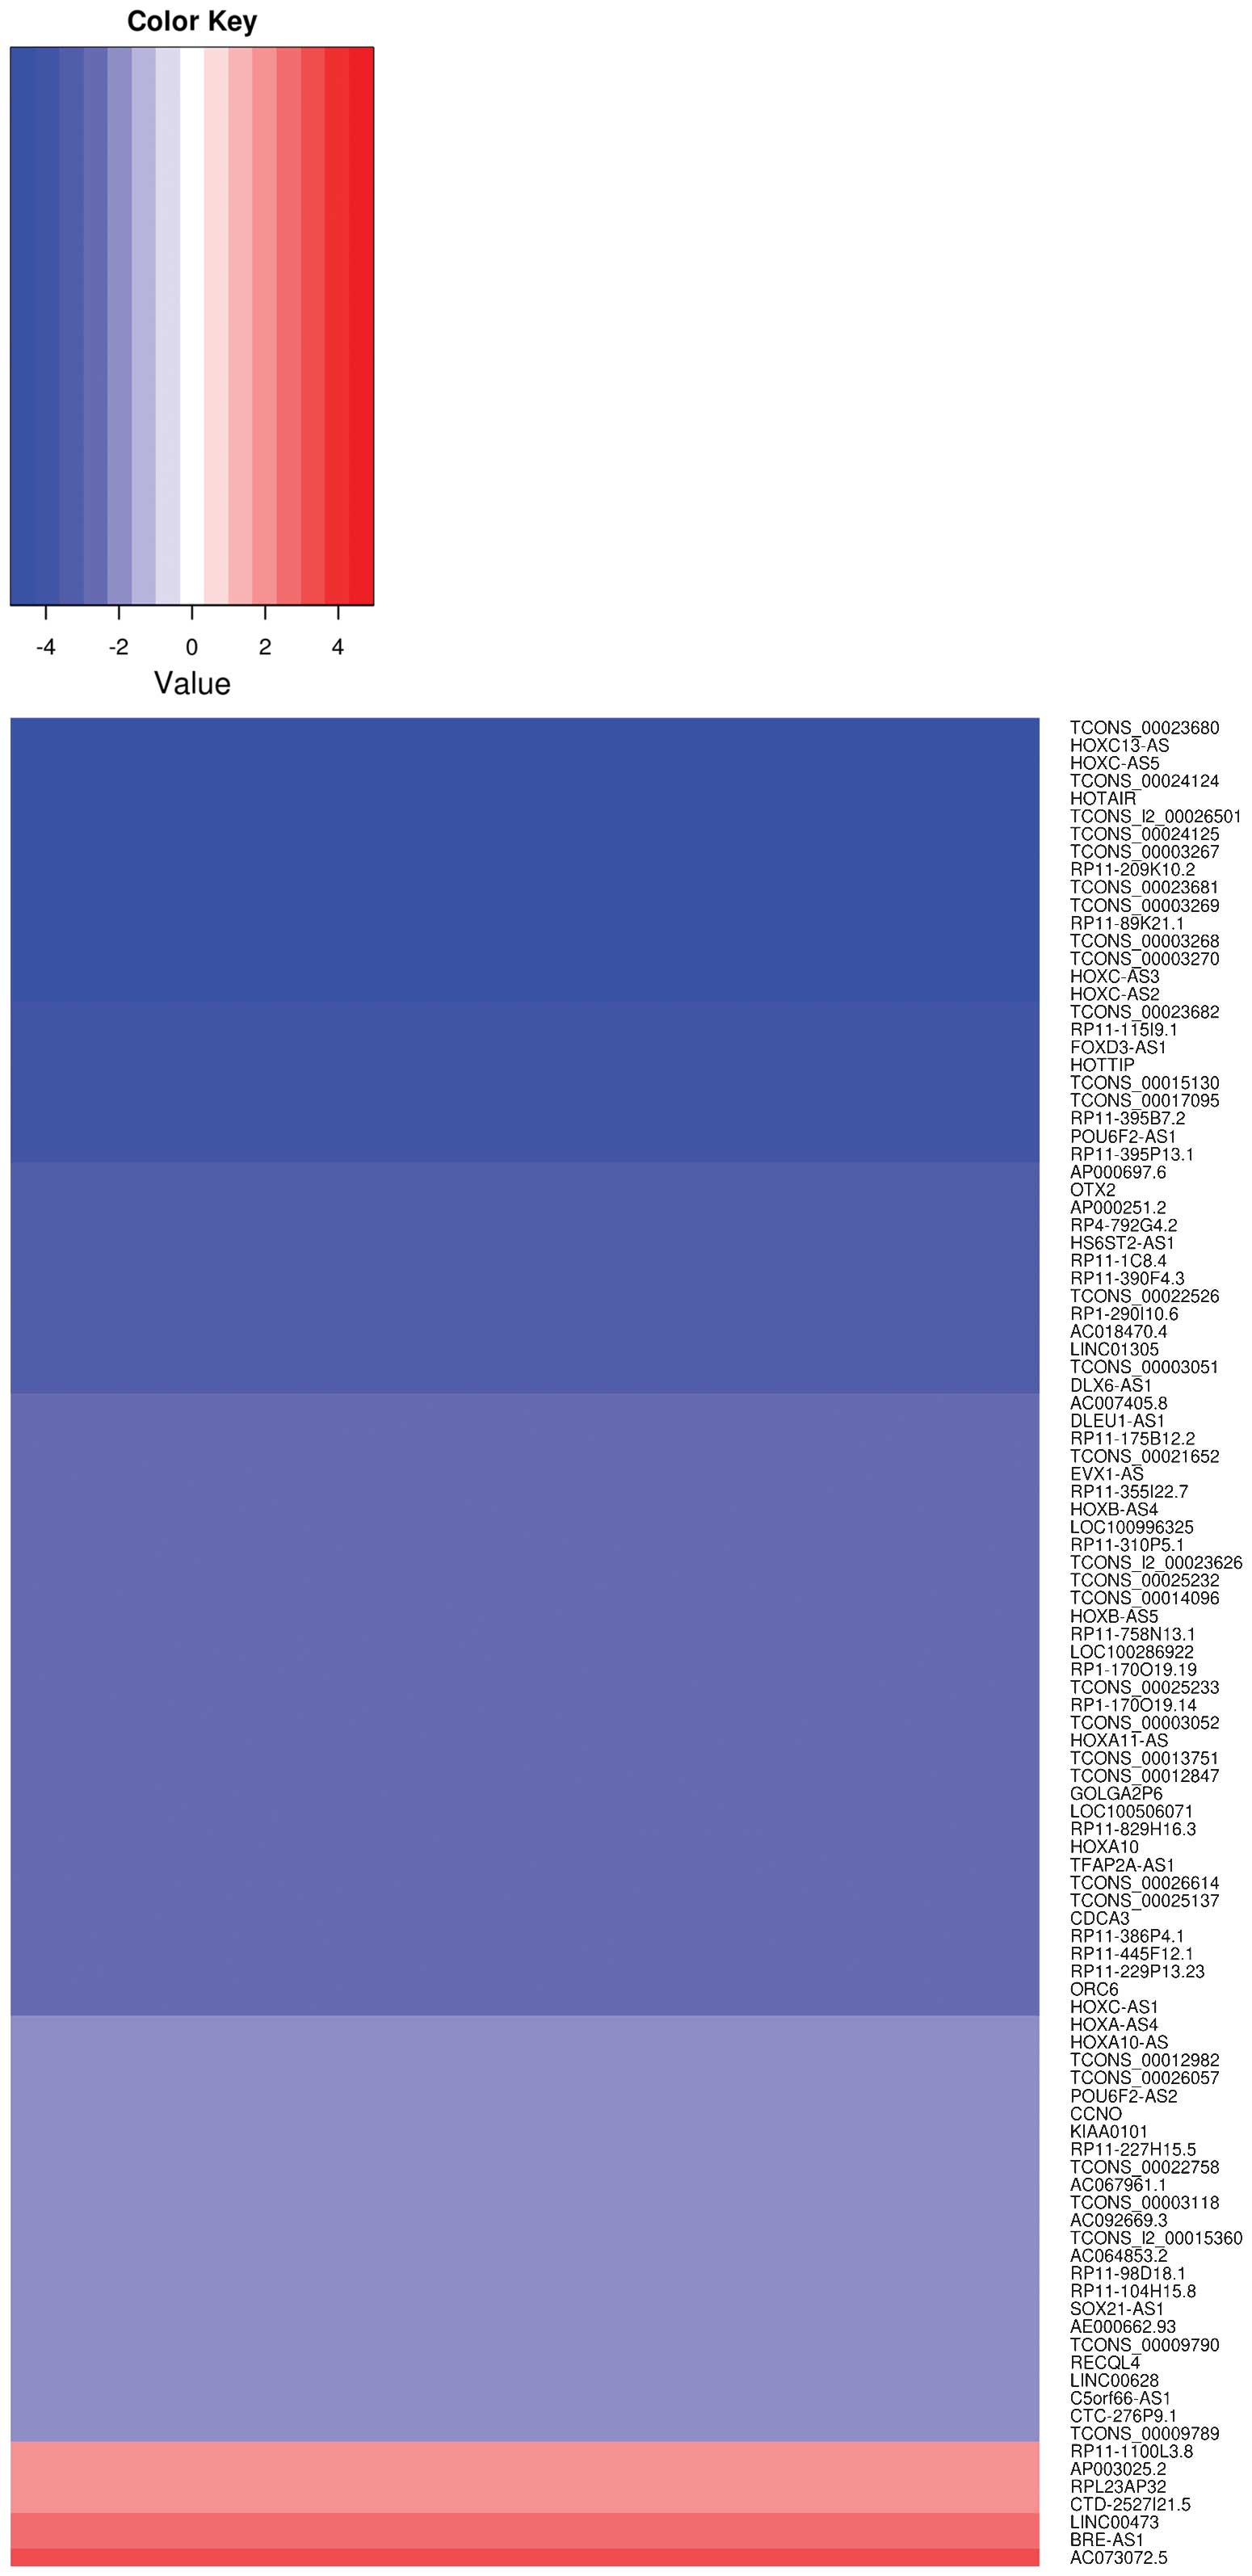
3E). Differentially expressed lncRNAs were determined based on
the criteria that lncRNAs have cutoff FDR <10−4 and
absolute fold change >2. The number of differentially expressed
lncRNAs was 2,208, and 104 of them were among the list of
potentially cancer-associated lncRNAs (Fig. 4).
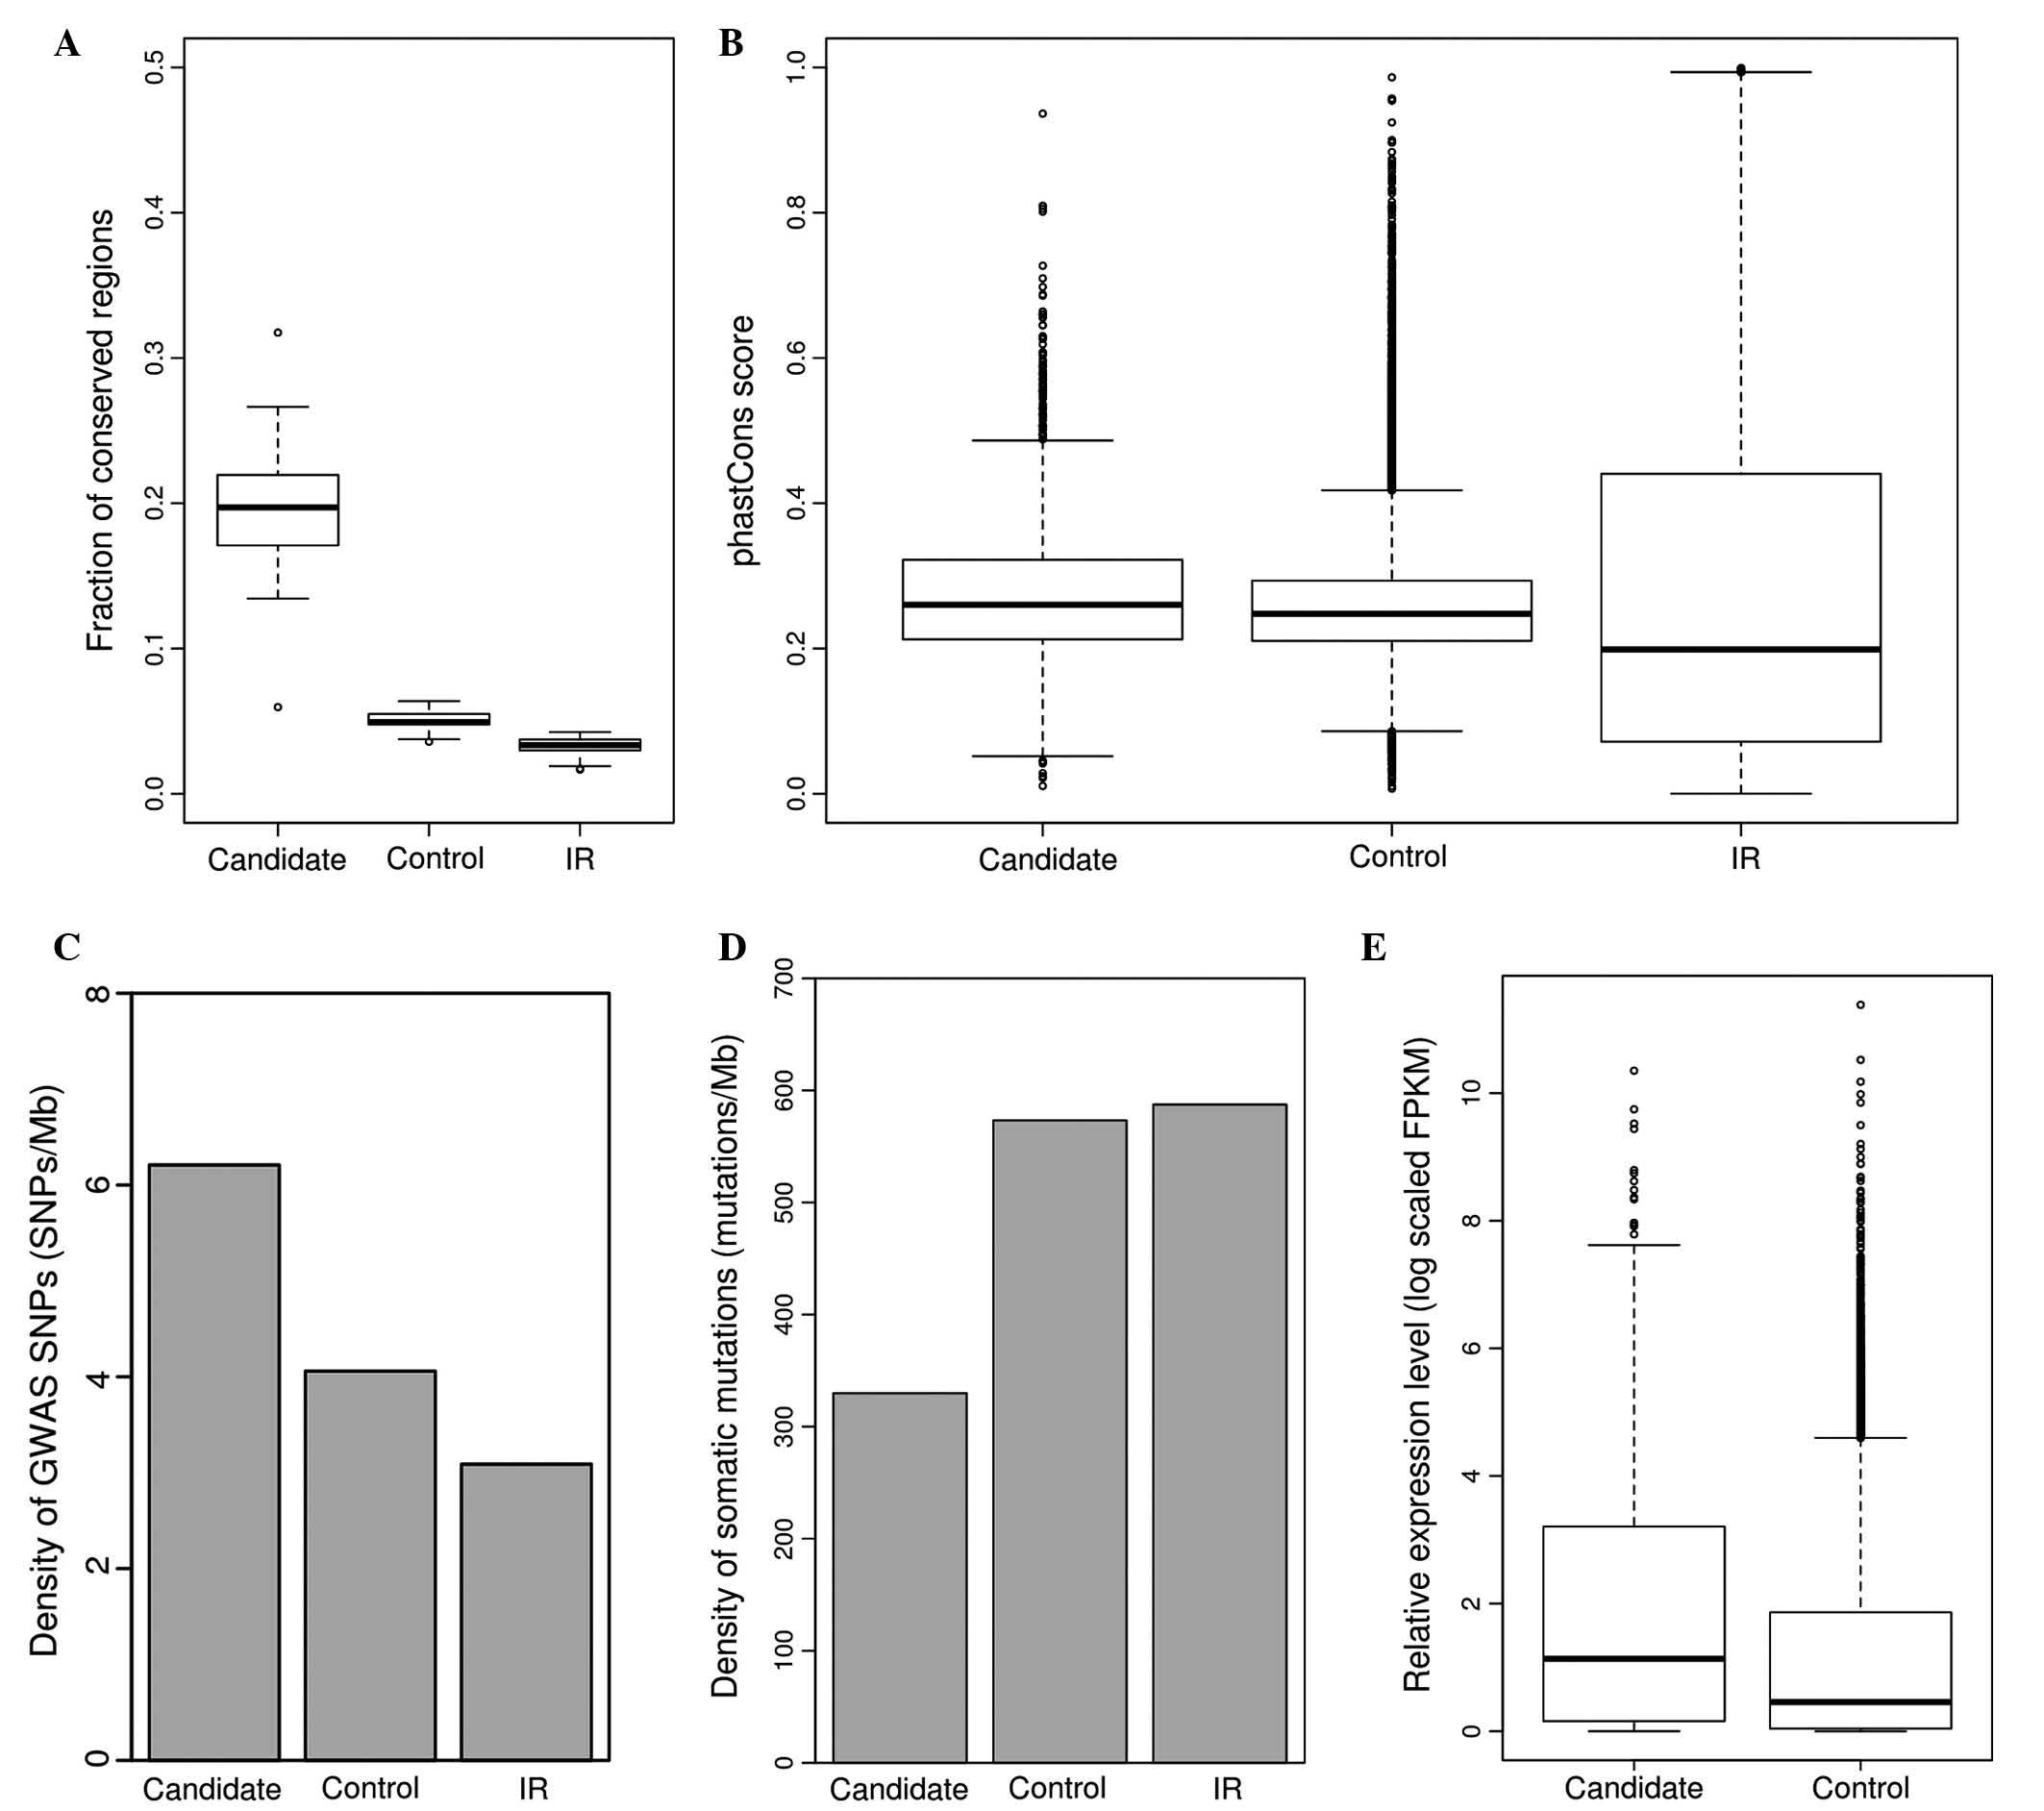 | Figure 3.Characterization of functional lncRNA
candidates in lung cancer. (A) Fraction of conserved regions in
functional lncRNA candidates (candidate), control lncRNAs (control)
and IR. (B) Average phastCons scores for functional lncRNA
candidates (candidate), control lncRNAs (control) and IR. (C)
Average densities of GWAS disease or trait-related SNPs for
functional lncRNA candidates (candidate), control lncRNAs (control)
and IR. (D) Average densities of somatic mutations for functional
lncRNA candidates (candidate), control lncRNAs (control) and IR.
(E) Relative expression (log scaled FPKM) for functional lncRNA
candidates (candidate), control lncRNAs (control) and IR. lncRNA,
long non-coding RNA; IR, intergenic regions; GWAS, genome-wide
association studies; SNP, single nucleotide polymorphism; FPKM,
fragments per kilobase. |
Discussion
In the present study, a logistic regression model
was presented and used to predict ‘high-impact’ somatic
alterations, combining pathogenic variants from ClinVar and HGMD
databases and lung-cancer specific features. There are two main
advantages of the present scoring model: Firstly, the logistic
regression model took into account all non-coding pathogenic
variants from HGMD and ClinVar databases, which are two well-known
databases of disease-associated variants worldwide, allowing for a
complete assessment of the damaging impact of any non-coding
variant in the human genome. Furthermore, a large number of
features used in the annotation are lung-cancer specific, including
histone modifications, TFBSs, replication timing and expression
data, which facilitates the scoring of variants in a lung
cancer-specific manner.
Non-coding features that most positively contributed
to the model include conserved regions, early replicated regions,
promoter, H3K36me3, H3K4me3, conserved TFBS, TFBS and sensitive
regions. Among these features, H3K36me3 is associated with actively
transcribed genes, and H3K4me3 is a hallmark of actively
transcribed protein-coding promoters in eukaryotes (51). These findings support the fact that
conserved and regulatory elements are critical to the formation and
functionality of pathogenic variants in the non-coding genome
(52). The area under the ROC curve
was 0.89, which outperformed two well-known tools CADD and funSeq2
(14), however, more stringent
comparison must be conducted to obtain a final conclusion.
Furthermore, the present model successfully distinguished GWAS
variants and recurrent cancer mutations from benign SNPs and
non-recurrent mutations, demonstrating the reliability and
efficient performance of the model.
Given that splicing sites and UTRs are more
evolutionarily conserved across mammals (53), it was observed that these regions have
a higher fraction of high-scoring regions and splicing sites have a
higher score compared with intronic regions. With respect to the
distribution of high-scoring regions in various gene classes, it
was observed that known cancer genes and cancer-associated lncRNAs
demonstrated increased enrichment of high-scoring regions compared
with non-cancerous genes. Based on these findings, the present
study combined the fraction of high-scoring regions and average
score of each lncRNA to filter out a subset of functional lncRNA
candidates, which contained a number of well-characterized cancer
lncRNAs, for example, HOTAIR, the expression of which is elevated
in lung cancer and correlated with metastasis and poor prognosis
(54). MALAT1 has been implicated in
tumorigenesis and progression in a variety of cancer types
(55–57). A total of 104 functional lncRNA
candidates were are differentially expressed in lung cancer and
normal samples. This group of lncRNAs are important candidates for
cancer researchers to conduct additional experimental validation
and characterization in future studies.
In conclusion, the present scoring system provides
an opportunity to identify cancer-driving mutations in the vast
non-coding human genome, as well as prioritizes a number of lncRNA
candidates for cancer research. This scoring system may assist with
the identification of driver non-coding genes for improved clinical
decision-making in the future.
Acknowledgements
The present research was made possible with
financial support from the National Natural Sciences Foundation of
China (Beijing, China; grant no., 81272142).
References
|
1
|
Roschke AV and Rozenblum E: Multi-layered
cancer chromosomal instability phenotype. Front Oncol. 3:1–13.
2013. View Article : Google Scholar : PubMed/NCBI
|
|
2
|
Robison K: Application of
second-generation sequencing to cancer genomics. Brief Bioinform.
11:524–534. 2010. View Article : Google Scholar : PubMed/NCBI
|
|
3
|
Greenman C, Stephens P, Smith R, Dalgliesh
GL, Hunter C, Bignell G, Davies H, Teague J, Butler A, Stevens C,
et al: Patterns of somatic mutation in human cancer genomes.
Nature. 446:153–158. 2007. View Article : Google Scholar : PubMed/NCBI
|
|
4
|
Sim NL, Kumar P, Hu J, Henikoff S,
Schneider G and Ng PC: SIFT web server: Predicting effects of amino
acid substitutions on proteins. Nucleic Acids Res. 40:W452–W457.
2012. View Article : Google Scholar : PubMed/NCBI
|
|
5
|
Adzhubei IA, Schmidt S, Peshkin L,
Ramensky VE, Gerasimova A, Bork P, Kondrashov AS and Sunyaev SR: A
method and server for predicting damaging missense mutations. Nat
Methods. 7:248–249. 2010. View Article : Google Scholar : PubMed/NCBI
|
|
6
|
Huang FW, Hodis E, Xu MJ, Kryukov GV, Chin
L and Garraway LA: Highly recurrent TERT promoter mutations in
human melanoma. Science. 339:957–959. 2013. View Article : Google Scholar : PubMed/NCBI
|
|
7
|
Horn S, Figl A, Rachakonda PS, Fischer C,
Sucker A, Gast A, Kadel S, Moll I, Nagore E, Hemminki K, et al:
TERT promoter mutations in familial and sporadic melanoma. Science.
339:959–961. 2013. View Article : Google Scholar : PubMed/NCBI
|
|
8
|
ENCODE Project Consortium: An integrated
encyclopedia of DNA elements in the human genome. Nature.
489:57–74. 2012. View Article : Google Scholar : PubMed/NCBI
|
|
9
|
Lowe CB and Haussler D: 29 mammalian
genomes reveal novel exaptations of mobile elements for likely
regulatory functions in the human genome. PLoS One. 7:e431282012.
View Article : Google Scholar : PubMed/NCBI
|
|
10
|
Bernstein BE, Stamatoyannopoulos JA,
Costello JF, Ren B, Milosavljevic A, Meissner A, Kellis M, Marra
MA, Beaudet AL, Ecker JR, et al: The NIH roadmap epigenomics
mapping consortium. Nat Biotechnol. 28:1045–1048. 2010. View Article : Google Scholar : PubMed/NCBI
|
|
11
|
Boyle AP, Hong EL, Hariharan M, Cheng Y,
Schaub MA, Kasowski M, Karczewski KJ, Park J, Hitz BC, Weng S, et
al: Annotation of functional variation in personal genomes using
RegulomeDB. Genome Res. 22:1790–1797. 2012. View Article : Google Scholar : PubMed/NCBI
|
|
12
|
Ward LD and Kellis M: HaploReg: A resource
for exploring chromatin states, conservation, and regulatory motif
alterations within sets of genetically linked variants. Nucleic
Acids Res. 40:D930–D934. 2012. View Article : Google Scholar : PubMed/NCBI
|
|
13
|
Khurana E, Fu Y, Colonna V, Mu XJ, Kang
HM, Lappalainen T, Sboner A, Lochovsky L, Chen J, Harmanci A, et
al: Integrative annotation of variants from 1092 humans:
Application to cancer genomics. Science. 342:12355872013.
View Article : Google Scholar : PubMed/NCBI
|
|
14
|
Li J, Drubay D, Michiels S and Gautheret
D: Mining the coding and non-coding genome for cancer drivers.
Cancer Lett. 369:307–315. 2015. View Article : Google Scholar : PubMed/NCBI
|
|
15
|
Cooper GM, Stone EA and Asimenos G: NISC
Comparative Sequencing Program, Green ED, Batzoglou S and Sidow A:
Distribution and intensity of constraint in mammalian genomic
sequence. Genome Res. 15:901–913. 2005. View Article : Google Scholar : PubMed/NCBI
|
|
16
|
Siepel A, Bejerano G, Pedersen JS,
Hinrichs AS, Hou M, Rosenbloom K, Clawson H, Spieth J, Hillier LW,
Richards S, et al: Evolutionarily conserved elements in vertebrate,
insect, worm and yeast genomes. Genome Res. 15:1034–1050. 2005.
View Article : Google Scholar : PubMed/NCBI
|
|
17
|
Pollard KS, Hubisz MJ, Rosenbloom KR and
Siepel A: Detection of nonneutral substitution rates on mammalian
phylogenies. Genome Res. 20:110–121. 2010. View Article : Google Scholar : PubMed/NCBI
|
|
18
|
Kircher M, Witten DM, Jain P, O'Roak BJ,
Cooper GM and Shendure J: A general framework for estimating the
relative pathogenicity of human genetic variants. Nat Genet.
46:310–315. 2014. View
Article : Google Scholar : PubMed/NCBI
|
|
19
|
Fu Y, Liu Z, Lou S, Bedford J, Mu XJ, Yip
KY, Khurana E and Gerstein M: FunSeq2: A framework for prioritizing
noncoding regulatory variants in cancer. Genome Biol. 15:4802014.
View Article : Google Scholar : PubMed/NCBI
|
|
20
|
Jeon Y, Sarma K and Lee JT: New and
Xisting regulatory mechanisms of X chromosome inactivation. Curr
Opin Genet Dev. 22:62–71. 2012. View Article : Google Scholar : PubMed/NCBI
|
|
21
|
Mattick JS, Amaral PP, Dinger ME, Mercer
TR and Mehler MF: RNA regulation of epigenetic processes.
Bioessays. 31:51–59. 2009. View Article : Google Scholar : PubMed/NCBI
|
|
22
|
Wapinski O and Chang HY: Long noncoding
RNAs and human disease. Trends Cell Biol. 21:354–361. 2011.
View Article : Google Scholar : PubMed/NCBI
|
|
23
|
Ørom UA, Derrien T, Beringer M, Gumireddy
K, Gardini A, Bussotti G, Lai F, Zytnicki M, Notredame C, Huang Q,
et al: Long noncoding RNAs with enhancer-like function in human
cells. Cell. 143:46–58. 2010. View Article : Google Scholar : PubMed/NCBI
|
|
24
|
Clark MB and Mattick JS: Long noncoding
RNAs in cell biology. Semin Cell Dev Biol. 22:366–376. 2011.
View Article : Google Scholar : PubMed/NCBI
|
|
25
|
Rando TA and Chang HY: Aging,
rejuvenation, and epigenetic reprogramming: Resetting the aging
clock. Cell. 148:46–57. 2012. View Article : Google Scholar : PubMed/NCBI
|
|
26
|
Nie L, Wu HJ, Hsu JM, Chang SS, Labaff AM,
Li CW, Wang Y, Hsu JL and Hung MC: Long non-coding RNAs: Versatile
master regulators of gene expression and crucial players in cancer.
Am J Transl Res. 4:127–150. 2012.PubMed/NCBI
|
|
27
|
Gutschner T and Diederichs S: The
hallmarks of cancer: A long non-coding RNA point of view. RNA Biol.
9:703–719. 2012. View Article : Google Scholar : PubMed/NCBI
|
|
28
|
Fang Z, Wu L, Wang L, Yang Y, Meng Y and
Yang H: Increased expression of the long non-coding RNA UCA1 in
tongue squamous cell carcinomas: A possible correlation with cancer
metastasis. Oral Surg Oral Med Oral Pathol Oral Radiol. 117:89–95.
2014. View Article : Google Scholar : PubMed/NCBI
|
|
29
|
Gupta RA, Shah N, Wang KC, Kim J, Horlings
HM, Wong DJ, Tsai MC, Hung T, Argani P, Rinn JL, et al: Long
non-coding RNA HOTAIR reprograms chromatin state to promote cancer
metastasis. Nature. 464:1071–1076. 2010. View Article : Google Scholar : PubMed/NCBI
|
|
30
|
Guffanti A, Iacono M, Pelucchi P, Kim N,
Soldà G, Croft LJ, Taft RJ, Rizzi E, Askarian-Amiri M, Bonnal RJ,
et al: A transcriptional sketch of a primary human breast cancer by
454 deep sequencing. BMC Genomics. 10:1632009. View Article : Google Scholar : PubMed/NCBI
|
|
31
|
Garding A, Bhattacharya N, Claus R, Ruppel
M, Tschuch C, Filarsky K, Idler I, Zucknick M, Caudron-Herger M,
Oakes C, et al: Epigenetic upregulation of lncRNAs at 13q14.3 in
leukemia is linked to the ln Cis downregulation of a gene cluster
that targets NF-kB. PLoS Genet. 9:e10033732013. View Article : Google Scholar : PubMed/NCBI
|
|
32
|
Alexandrov LB, Nik-Zainal S, Wedge DC,
Aparicio SA, Behjati S, Biankin AV, Bignell GR, Bolli N, Borg A,
Børresen-Dale AL, et al: Signatures of mutational processes in
human cancer. Nature. 500:415–421. 2013. View Article : Google Scholar : PubMed/NCBI
|
|
33
|
1000 Genomes Project Consortium. Abecasis
GR, Auton A, Brooks LD, DePristo MA, Durbin RM, Handsaker RE, Kang
HM, Marth GT and McVean GA: An integrated map of genetic variation
from 1,092 human genomes. Nature. 491:56–65. 2012. View Article : Google Scholar : PubMed/NCBI
|
|
34
|
Landrum MJ, Lee JM, Riley GR, Jang W,
Rubinstein WS, Church DM and Maglott DR: ClinVar: Public archive of
relationships among sequence variation and human phenotype. Nucleic
Acids Res. 42:D980–D985. 2014. View Article : Google Scholar : PubMed/NCBI
|
|
35
|
Stenson PD, Mort M, Ball EV, Howells K,
Phillips AD, Thomas NS and Cooper DN: The human gene mutation
database: 2008 update. Genome Med. 1:132009. View Article : Google Scholar : PubMed/NCBI
|
|
36
|
Beck T, Hastings RK, Gollapudi S, Free RC
and Brookes AJ: GWAS central: A comprehensive resource for the
comparison and interrogation of genome-wide association studies.
Eur J Hum Genet. 22:949–952. 2014. View Article : Google Scholar : PubMed/NCBI
|
|
37
|
Harrow J, Frankish A, Gonzalez JM,
Tapanari E, Diekhans M, Kokocinski F, Aken BL, Barrell D, Zadissa
A, Searle S, et al: GENCODE: The reference human genome annotation
for the ENCODE project. Genome Res. 22:1760–1774. 2012. View Article : Google Scholar : PubMed/NCBI
|
|
38
|
Cabili MN, Trapnell C, Goff L, Koziol M,
Tazon-Vega B, Regev A and Rinn JL: Integrative annotation of human
large intergenic noncoding RNAs reveals global properties and
specific subclasses. Genes Dev. 25:1915–1927. 2011. View Article : Google Scholar : PubMed/NCBI
|
|
39
|
Pruitt KD, Tatusova T and Maglott DR: NCBI
reference sequences (RefSeq): A curated non-redundant sequence
database of genomes, transcripts and proteins. Nucleic Acids Res.
35:D61–D65. 2007. View Article : Google Scholar : PubMed/NCBI
|
|
40
|
Ward AJ and Cooper TA: The pathobiology of
splicing. J Pathol. 220:152–163. 2010.PubMed/NCBI
|
|
41
|
Karolchik D, Barber GP, Casper J, Clawson
H, Cline MS, Diekhans M, Dreszer TR, Fujita PA, Guruvadoo L,
Haeussler M, et al: The UCSC genome browser database: 2014 update.
Nucleic Acids Res. 42:D764–D770. 2014. View Article : Google Scholar : PubMed/NCBI
|
|
42
|
Smith MA, Gesell T, Stadler PF and Mattick
JS: Widespread purifying selection on RNA structure in mammals.
Nucleic Acids Res. 41:8220–8236. 2013. View Article : Google Scholar : PubMed/NCBI
|
|
43
|
Schuster-Böckler B and Lehner B: Chromatin
organization is a major influence on regional mutation rates in
human cancer cells. Nature. 488:504–507. 2012. View Article : Google Scholar : PubMed/NCBI
|
|
44
|
Forbes SA, Bindal N, Bamford S, Cole C,
Kok CY, Beare D, Jia M, Shepherd R, Leung K, Menzies A, et al:
COSMIC: Mining complete cancer genomes in the catalogue of somatic
mutations in cancer. Nucleic Acids Res. 39:D945–D950. 2011.
View Article : Google Scholar : PubMed/NCBI
|
|
45
|
Ju YS, Lee WC, Shin JY, Lee S, Bleazard T,
Won JK, Kim YT, Kim JI, Kang JH and Seo JS: Fusion of KIF5B and RET
transforming gene in lung adenocarcinoma revealed from whole-genome
and transcriptome sequencing. Genome Res. 22:436–445. 2012.
View Article : Google Scholar : PubMed/NCBI
|
|
46
|
Dobin A, Davis CA, Schlesinger F, Drenkow
J, Zaleski C, Jha S, Batut P, Chaisson M and Gingeras TR: STAR:
Ultrafast universal RNA-seq aligner. Bioinformatics. 29:15–21.
2013. View Article : Google Scholar : PubMed/NCBI
|
|
47
|
Quinlan AR and Hall IM: BEDTools: A
flexible suite of utilities for comparing genomic features.
Bioinformatics. 26:841–842. 2010. View Article : Google Scholar : PubMed/NCBI
|
|
48
|
Trapnell C, Roberts A, Goff L, Pertea G,
Kim D, Kelley DR, Pimentel H, Salzberg SL, Rinn JL and Pachter L:
Differential gene and transcript expression analysis of RNA-seq
experiments with TopHat and Cufflinks. Nat Protoc. 7:562–578. 2012.
View Article : Google Scholar : PubMed/NCBI
|
|
49
|
Love MI, Huber W and Anders S: Moderated
estimation of fold change and dispersion for RNA-Seq data with
DESeq2. Genome Biol. 15:5502014. View Article : Google Scholar : PubMed/NCBI
|
|
50
|
Dees ND, Zhang Q, Kandoth C, Wendl MC,
Schierding W, Koboldt DC, Mooney TB, Callaway MB, Dooling D, Mardis
ER, et al: MuSiC: Identifying mutational significance in cancer
genomes. Genome Res. 22:1589–1598. 2012. View Article : Google Scholar : PubMed/NCBI
|
|
51
|
Hon GC, Hawkins RD and Ren B: Predictive
chromatin signatures in the mammalian genome. Hum Mol Genet.
18:R195–R201. 2009. View Article : Google Scholar : PubMed/NCBI
|
|
52
|
Ritchie GRS, Dunham I, Zeggini E and
Flicek P: Functional annotation of noncoding sequence variants. Nat
Methods. 11:294–296. 2014. View Article : Google Scholar : PubMed/NCBI
|
|
53
|
Washietl S, Kellis M and Garber M:
Evolutionary dynamics and tissue specificity of human long
noncoding. RNAs in six mammals. 616–628. 2014.
|
|
54
|
Loewen G, Jayawickramarajah J, Zhuo Y and
Shan B: Functions of lncRNA HOTAIR in lung cancer. J Hematol Oncol.
7:902014. View Article : Google Scholar : PubMed/NCBI
|
|
55
|
Yang MH, Hu ZY, Xu C, Xie LY, Wang XY,
Chen SY and Li ZG: MALAT1 promotes colorectal cancer cell
proliferation/migration/invasion via PRKA kinase anchor protein 9.
Biochim Biophys Acta. 1852:166–174. 2015. View Article : Google Scholar : PubMed/NCBI
|
|
56
|
Shen L, Chen L, Wang Y, Jiang X, Xia H and
Zhuang Z: Long noncoding RNA MALAT1 promotes brain metastasis by
inducing epithelial-mesenchymal transition in lung cancer. J
Neurooncol. 121:101–108. 2015. View Article : Google Scholar : PubMed/NCBI
|
|
57
|
Okugawa Y, Toiyama Y, Hur K, Toden S,
Saigusa S, Tanaka K, Inoue Y, Mohri Y, Kusunoki M, Boland CR and
Goel A: Metastasis-associated long non-coding RNA drives gastric
cancer development and promotes peritoneal metastasis.
Carcinogenesis. 35:2731–2739. 2014. View Article : Google Scholar : PubMed/NCBI
|