Introduction
Hepatocellular cancer (HCC) is one of the most
common malignant tumors with an annually increasing incidence and
mortality rate in China (1).
Approximately 394,770 estimated liver cancer cases were newly
diagnosed in 2012, and the number continues to increase annually
(1). Patients diagnosed with HCC
typically present with tumors that are more aggressive and
advanced, and they also present with more frequent distant
metastases. Although surgical resection and liver transplantation
provide a certain chance to cure it, the prognosis of HCC remains
unfavorable due to the high risk of recurrence and distant
metastasis postoperatively (2).
Therefore, it is important to find convincing molecular markers
that correlate with poor prognosis to tailor the treatment for the
high-risk patients.
Transcription factor specificity protein 1 (Sp1) is
a sequence specific DNA binding protein, which has been reported to
be abnormally expressed and activated in tumor tissues in a
previous study (3). Sp1 is involved
in the regulation of tumor cell proliferation, invasion,
angiogenesis, and other biological functions (3,4). Recently,
Sp1 has been proposed as an indicator for poor prognosis in
patients with gastric, pancreatic, breast and thyroid tumor cells
in certain studies (5–7). Meanwhile, hypoxia-inducible factor 1
(HIF1), composed of one α and one β subunit, has been suggested to
be an important molecule in cell response to hypoxia involving in
the regulation of angiogenesis, cell adhesion, energy metabolism,
and apoptosis (8). HIF1-inducing
angiogenesis serves an important role in tumor growth (8); HIF1 expression is elevated in HCC
tissues and highly associated with poor prognosis (9). However, the combined expression of Sp1
and HIF1 in HCC and its impact on prognosis have not previously
been reported in HCC.
The present study aimed to evaluate whether the
expression levels of Sp1 and HIF1 are correlated with each other
and other clinicopathological factors using The Cancer Genome Atlas
(TCGA) database, and to investigate the prognostic impact of
combination testing in HCC.
Materials and methods
Patients and samples
The data files were used to analyze Sp1 and HIF1
expression, and the level 3 clinical data of 351 HCC patients were
initially downloaded from the TCGA (http://cancergenome.nih.gov/) data portal website, by
using the data matrix link to access RNASeq data for liver HCC
dataset and by using the UNC (IlluminaHiSeq_RNAseqV2) data
platform. The reads per kilobase per million mapped reads value was
used to represent the expression level of each gene. The gene
expression data above for each individual TCGA sample with hepatic
cancer during 1996–2013 were organized into an Excel file [system
object model (SOM) file, labeled SOM Butler complete gene express
set]. Samples were excluded for any of the following reasons: If
they possessed in situ or incomplete tumor-node-metastasis
(TNM) staging, no evaluation on lymph nodes or differentiation
grade or histological type pathologically, died within 10 days
following surgery, or had multiple primary malignant neoplasms as
determined by Extent of Disease Codes (10). Clinicopathological parameters,
including age, height, weight, sex, race, ethnicity, relative
family cancer history, serum α-fetoprotein (AFP), surgical
procedures, and TNM stage were also assessed. These data were then
used to determine the correlations between HIF1α, Sp1 RNA levels
and prognosis, as indicated in the results. The guidance of the
2010 TNM classification of American Joint Committee on Cancer
(AJCC)/International Union Against Cancer (11,12) was
followed for postoperative evaluation of staging.
The paraffin-embedded HCC specimens of 50 patients
(25 succumbed to hepatic cancer and 25 survived in the follow-up
period) who underwent a surgical procedure were obtained form Fudan
University Shanghai Cancer Center in Shanghai, China. All cases
were histologically confirmed. Patients were regularly followed up
every 3–6 months. Events, such as tumor recurrence, progression,
metastasis, and mortality, were recorded. The study was approved by
Ethics Committee of Fudan University Shanghai Cancer Center, and
written informed consent was obtained from all patients.
Immunohistochemical staining
(IHC)
IHC was performed according to a standard protocol.
Briefly, paraffin-embedded samples were cut into 4-µm sections and
placed on polylysine-coated slides. Paraffin sections were baked
overnight at 58°C, deparaffinized in xylene, rehydrated through
graded ethanol, quenched for endogenous peroxidase activity in 0.3%
hydrogen peroxide (diluted in methanol; #216763, Sigma-Aldrich, St.
Louis, MO, USA) at 37°C for 15 min, and processed for antigen
retrieval by high pressure cooking in citrate antigen retrieval
solution (pH 6.0; #MVS-0066, MXB, Fuzhou, Fujian, China) for ~10
min. Sections were incubated at 37°C for 1.5 h with rabbit
polyclonal antibodies against Sp1 (1:3,200, #07-645, Millipore,
Temecula, CA, USA) and HIF1α (1:200, ab114977, Abcam, Cambridge,
MA, USA) in a moist chamber. Immunostaining was performed using the
GTVision™ III Detection System/Mo & Rb kit (Gene Tech,
Shanghai, China), which resulted in a brown-colored precipitate at
the antigen site. Subsequently, sections were counterstained with
hematoxylin (Sigma-Aldrich) and mounted in a non-aqueous mounting
medium. All repetitions included a no primary antibody control. The
immunohistochemically stained tissue sections were scored
separately by two pathologists blinded to the clinical parameters.
The staining intensity was scored as 0 (negative, -), 1 (weak, +),
2 (medium, ++) or 3 (strong, +++). The extent of staining was
scored as (0, <5%; 1, 5–25%; 2, 26–50%; 3, 51–75%; and 4,
>75%) according to the percentages of the positive staining
areas in relation to the whole carcinoma area. Scores for staining
intensity and percentage positivity of cells were then multiplied
to generate the immunoreactivity score for each case. Tumors with a
final immunoreactivity score of <4 were considered to be low
(−), and those with a score of ≥4 were considered to be high [4, +;
6, ++; or ≥8, +++].
Statistical analysis
R 3.1.2 software (Institute for Statistics and
Mathematics, Vienna, Austria) was used to organize and process the
data downloaded from the TCGA to analyze the correlation between
specific gene expression and prognosis. Statistical analyses were
performed using SPSS 13.0 (SPSS Inc., Chicago, IL, USA). Student's
t-test, χ2 test, or Mann-Whitney test, were performed as
appropriate. Patients who were alive and did not relapse were
censored at the date of their last follow-up visit. Cancer-specific
survival (CSS) was defined as the time between the date of initial
surgery and the cancer-specific mortality. Survival rates were
estimated by the Kaplan-Meier method (13). The hazard ratio (HR) for relationships
between each variable and recurrence were calculated using binary
Cox regression model (14). Receiver
operating characteristic (ROC) curves for CSS prediction were
plotted to verify the prediction ability of co-expression of Sp1
and HIF1α and each single gene. The correlations between Sp1 and
HIF1α expression (scores derived from staining intensity by IHC in
HCC specimens) and vital status in HCC patients
(succumbed/survived) were analyzed by χ2 test. A
P<0.05 was considered to indicate a statistically significant
difference. All confidence intervals (CIs) were stated at the 95%
confidence level.
Results
Patient characteristics
A total of 214 eligible patients with hepatic cancer
were identified in the TCGA database during the 17-year study
period. There were 146 (68.2%) males and 68 (31.8%) females. The
median age was 64 (range, 20–88) years, and the median follow-up
period was 414 (range, 10–3,258) days. Patient demographics and
clinicopathological features are summarized in Table I.
 | Table I.Characteristics of subjects with
hepatic cancer from The Cancer Genome Atlas database by vital
status. |
Table I.
Characteristics of subjects with
hepatic cancer from The Cancer Genome Atlas database by vital
status.
|
| Vital status |
|
|---|
|
|
|
|
|---|
| Variables | Alive (n=141) | Cancer mortality
(n=73) | P-value |
|---|
| Total number of
patients (n=214) |
|
| Male patients | 104 (71.2) | 42 (58.5) | NS |
| Age at diagnosis
(years) | 61.0±12.0 | 61.0±13.0 | NS |
| Height (cm) | 168.5±9.1 | 166.9±15.8 |
|
| Weight (kg) | 87.9±111.0 | 88.2±109.8 |
|
| Race |
|
| NS |
|
White | 69
(48.9) | 44 (60.3) |
|
| Black
or African American | 8
(5.7) | 5 (6.8) |
|
|
Asian | 59
(41.8) | 19 (26.0) |
|
|
Other | 5
(3.5) | 5 (6.8) |
|
| Ethnicity |
|
| NS |
|
Hispanic or Latino | 4
(2.8) | 4 (5.5) |
|
|
Other | 137 (97.2) | 69 (94.5) |
|
| Relative family
cancer history | 41
(29.1) | 34 (46.6) | 0.011 |
| History of risk
factors |
|
| NS |
|
Hepatitis B/C | 58
(41.1) | 26 (35.6) |
|
| Alcohol
consumption | 17
(12.1) | 10 (13.7) |
|
|
Both | 17
(12.1) | 5 (6.8) |
|
|
None | 49
(34.8) | 32 (43.8) |
|
| α-fetoprotein
value |
|
| NS |
| ≤400
ng/ml | 96
(68.1) | 42 (57.5) |
|
| >400
ng/ml | 22
(15.6) | 19 (26.0) |
|
|
Unknown | 23
(16.3) | 12 (16.4) |
|
| Surgery |
|
| 0.025 |
| Partial
excisiona | 90
(63.8) | 36 (49.3) |
|
|
Extended excisionb | 38
(27.0) | 33 (45.2) |
|
|
Other | 13 (9.2) | 4 (5.5) |
|
| Histology
diagnosis |
|
| NS |
|
Hepatocellular carcinoma | 137 (97.2) | 71 (97.3) |
|
|
Hepatocholangiocarcinoma | 2
(1.4) | 2 (2.7) |
|
|
Fibrolamellar carcinoma | 2
(1.4) | 0 (0.0) |
|
| Tumor grade |
|
| 0.011 |
|
G1/2 | 91
(64.5) | 34 (46.6) |
|
|
G3/4 | 50
(35.5) | 39 (53.4) |
|
| Vascular tumor
invasion |
|
| NS |
|
None | 100 (70.9) | 47 (64.4) |
|
| Micro
invasion | 32
(22.7) | 16 (21.9) |
|
| Macro
invasion | 3
(2.1) | 7 (9.6) |
|
|
Unknown | 6
(4.3) | 3 (4.1) |
|
| Residual tumor |
|
| NS |
| R0 | 129 (91.5) | 65 (89.0) |
|
| R1 | 6
(4.3) | 2 (2.7) |
|
| R2 | 0
(0.0) | 1 (1.4) |
|
| Rx | 6
(4.3) | 5 (6.8) |
|
| Child
classification |
|
| NS |
| Grade
1 | 109 (77.3) | 50 (68.5) |
|
| Grade
2 | 10 (7.1) | 7 (9.6) |
|
|
Unknown | 22
(15.6) | 16 (21.9) |
|
| Pathologic tumor
stage |
|
| 0.020 |
|
T1/2 | 88
(62.4) | 36 (49.3) |
|
|
T3/4 | 40
(35.5) | 31 (42.5) |
|
|
Unknown | 3
(2.1) | 6 (8.2) |
|
| Pathologic nodal
stage |
|
| NS |
| N0 | 98
(69.5) | 57 (78.1) |
|
| N1 | 1
(0.7) | 0 (0.0) |
|
| Nx | 42
(29.8) | 16 (21.9) |
|
| Distant
metastasis |
|
| NS |
| M0 | 109 (77.3) | 59 (80.8) |
|
| M1 | 2
(1.4) | 0 (0.0) |
|
| Mx | 30
(21.3) | 14 (19.2) |
|
| AJCC 7th stage |
|
| 0.042 |
|
I/II | 114 (80.9) | 49 (67.1) |
|
|
III/IV | 19
(13.5) | 19 (26.0) |
|
|
Unknown | 8
(5.7) | 5 (6.8) |
|
| Gene expression
(×103) |
|
HIF1α | 1.26±0.65 | 2.50±1.66 | 0.001 |
|
Sp1 | 1.51±0.39 | 1.78±0.60 | 0.001 |
Clinicopathological differences
between the two groups according to vital status
When compared with surviving patients, those
patients who succumbed to cancer were more likely to have a
relative family cancer history (P=0.011), to have received a
partial incision surgical procedure (P=0.025), to have an advanced
G3/G4 tumor grade (P=0.011), and to have an AJCC stage of advanced
stage III/IV (P=0.042). The expression levels of HIF1α and Sp1 were
significantly higher in patients who succumbed to cancer (P=0.001).
However, with regards to other clinicopathological features, no
significant differences between the two groups were found (Table I).
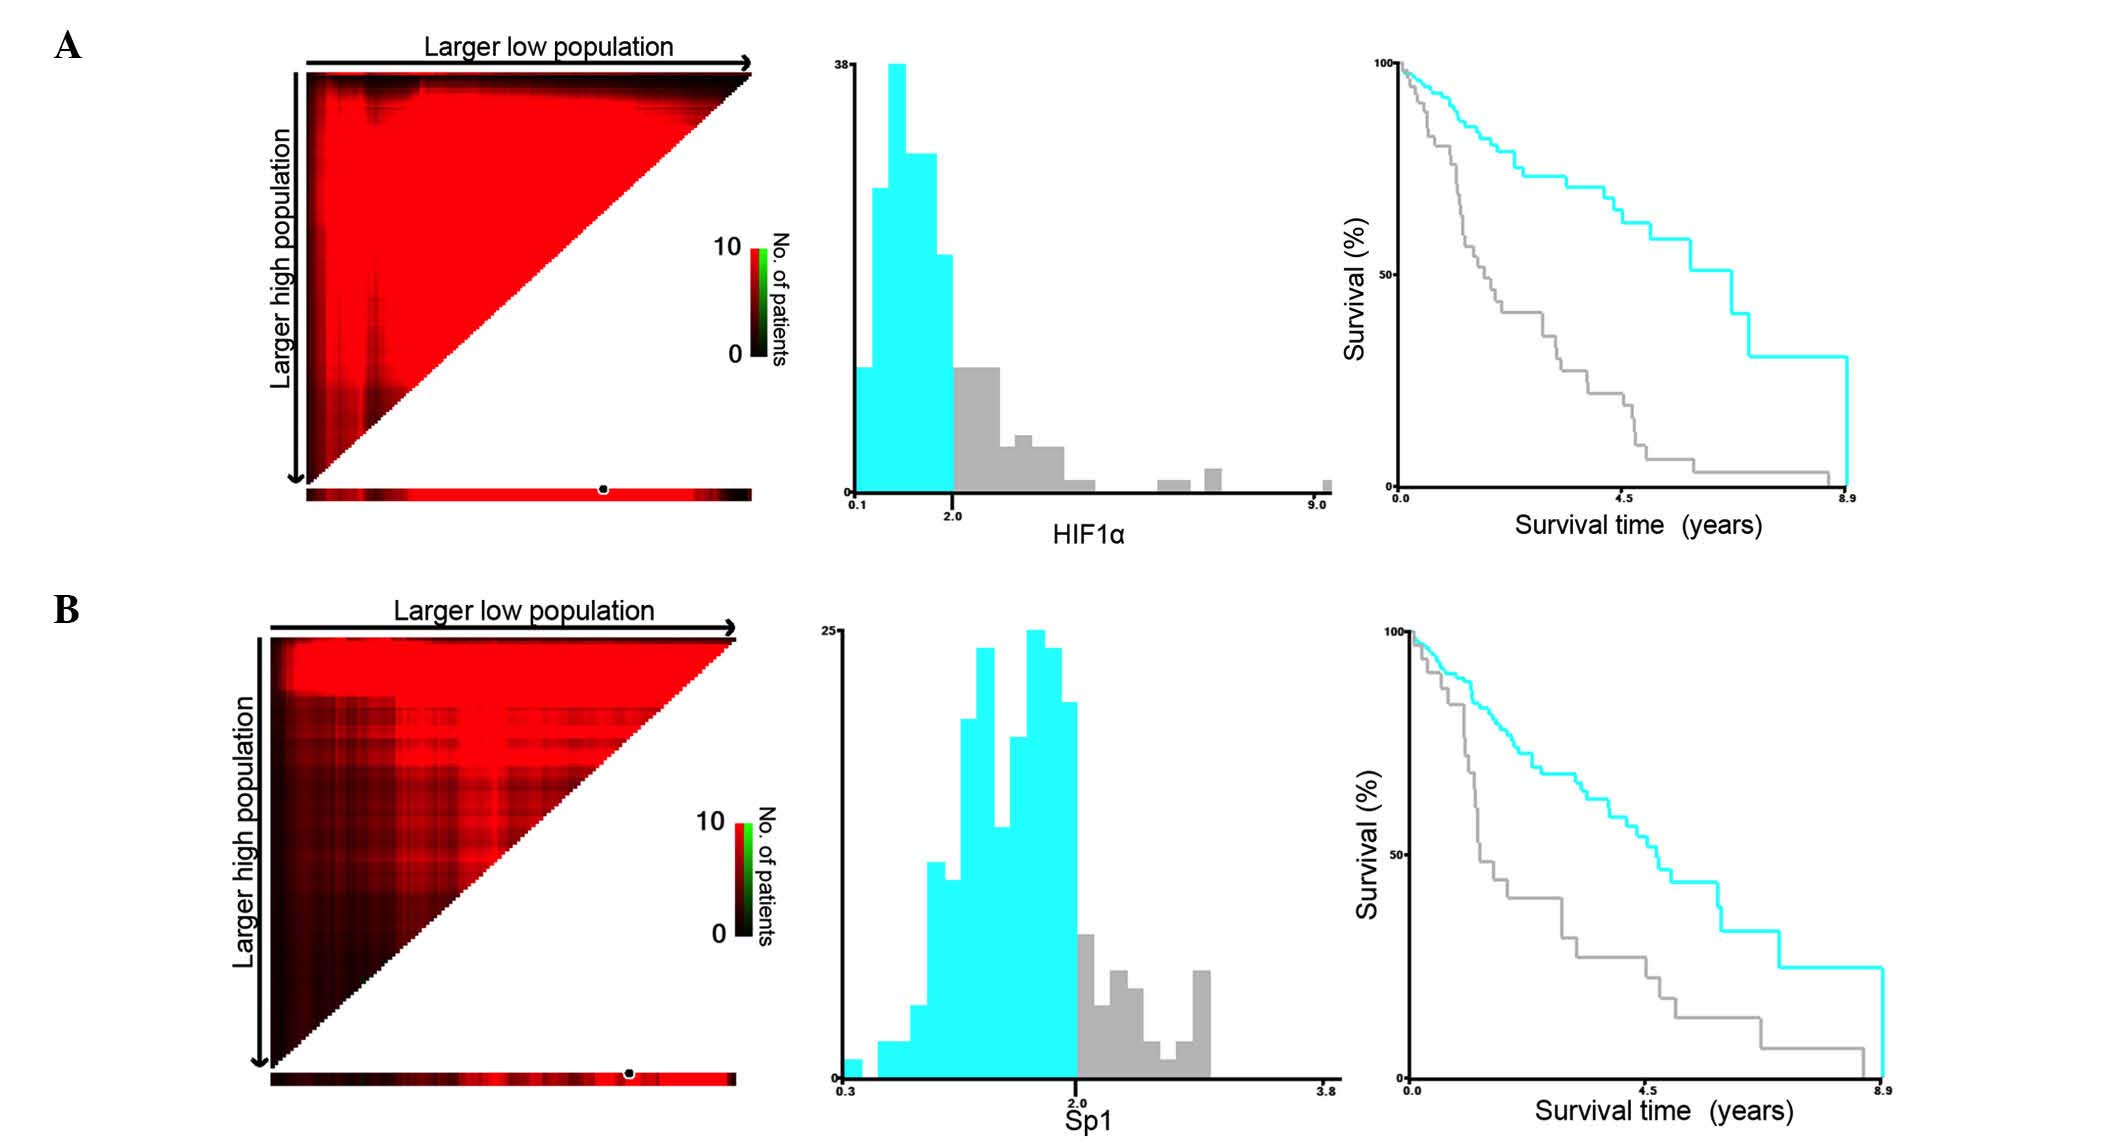
Impact of gene expression on survival
outcomes in hepatic cancer
The CSS rates were 60.1% at 3 years (1,067 days),
35.8% at 5 years (1,823 days) and 9.5% at 10 years (3,528 days).
Given the significant influences of HIF1α and Sp1 expression levels
(as continuous variables) on survival in univariate analysis, the
present study attempted to differentiate the patients with a
high-risk for cancer mortality by investigating the certain cutoff
points of expressions for both of the two genes. The X-tile program
(http://www.tissuearray.org/rimmlab/)
was applied for the analysis, by identifying the cutoff with the
minimum P-values from log-rank χ2 statistics for the
categorical value of gene expression in terms of survival (15). X-tile plots were constructed and the
maximum of χ2 log-rank values was produced applying both
of 2 (×103) as cutoff values to divide the cohort into
high and low subsets in terms of CSS according to the expressions
of Sp1 and HIF1α (Fig. 1A and B).
When the gene expression levels (as binary variables), associated
with those independent variables identified by univariate analysis,
were included in multivariate Cox regression analysis, only high
expression levels of Sp1 and HIF1α (≥2×10³) were
independent predictors for cancer mortality (Table II).
| Table II.Multivariate cox regression analyses
for the HIF1α and Sp1 on cancer-specific survival in hepatic
cancer. |
Table II.
Multivariate cox regression analyses
for the HIF1α and Sp1 on cancer-specific survival in hepatic
cancer.
| Independent
variable | HR (95% CI) | P-value |
|---|
| Sex (male vs.
female) | 0.802
(0.474–1.358) | 0.412 |
| Relative family
cancer history | 0.953
(0.548–1.658) | 0.865 |
| Surgery (extended
vs. partial excision) | 1.193
(0.700–2.035) | 0.517 |
| Histology grade
(G3/4 vs. G1/2) | 1.332
(0.783–2.266) | 0.290 |
| Pathologic tumor
stage (T3/4 vs. T1/2) | 0.754
(0.394–1.444) | 0.395 |
| AJCC 7th stage
(III/IV vs. I/II) | 1.785
(0.836–3.812) | 0.134 |
| Sp1 (≥2,000) | 1.907
(1.067–3.408) | 0.029 |
| HIF1α (≥2,000) | 2.992
(1.731–5.171) | 0.001 |
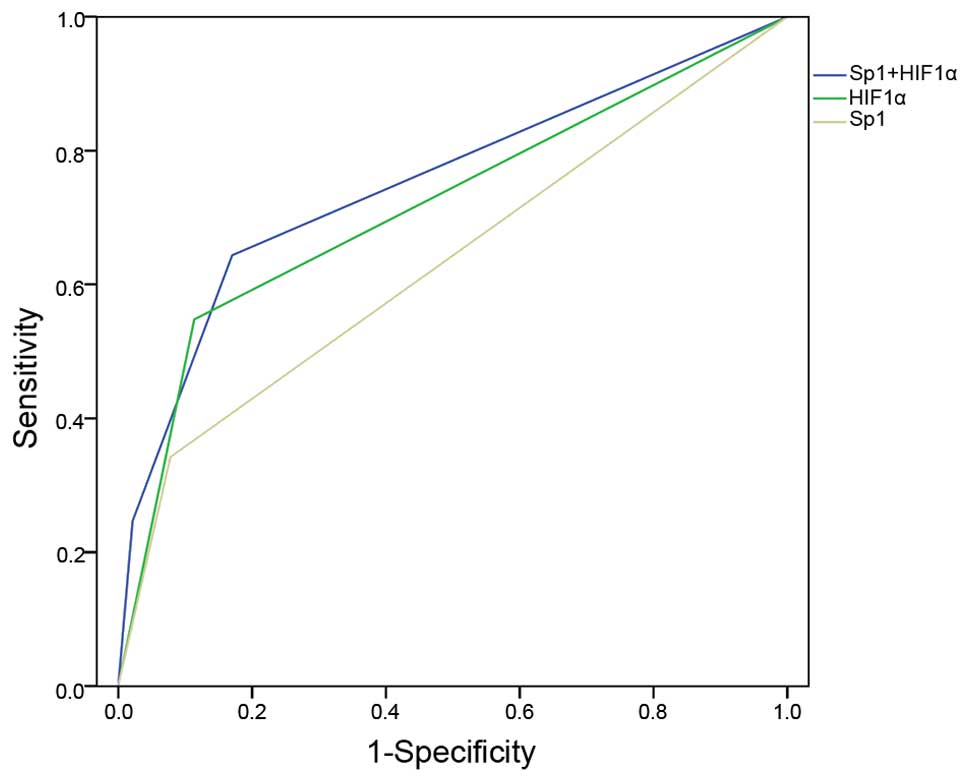
Impact of combination testing for Sp1
and HIF1 expressions on survival outcomes
When cancer mortality was analyzed as a binary
variable, an intermediate AUC for the ROC curve was found to be
higher using the combination testing for two genes (0.751) in
predicting cancer mortality, compared to either single gene (0.632
for Sp1 and 0.717 for HIF1α) (Fig.
2). This indicated that combination testing may be an
appropriate and effective approach in the prediction of poor
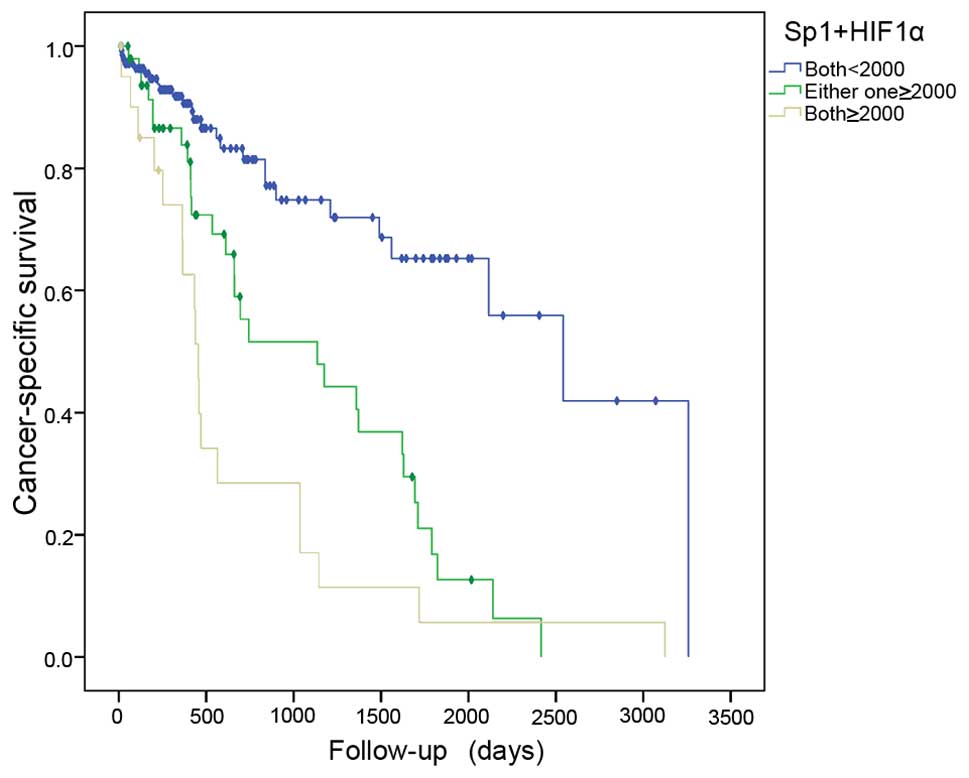
prognosis for hepatic cancer patients. Based on the cutoff points
for gene expressions, the samples were divided into 3 groups: G1
(both genes, <2×10³), G2 (either gene,
≥2×10³), and G3 (both genes, ≥2×10³). The
risk of cancer mortality increased with high expression of the two
genes, and G3 exhibited a greater risk than G2 when compared to the
G1 group (HR=5.420, 95% CI 2.767–10.616, P=0.001; HR=3.270, 95% CI
1.843–5.803, P=0.001) (Table III,
Fig. 3).
| Table III.Multivariate logistic regression
analyses for the combination of Sp1 and HIF1α on cancer-specific
survival in hepatic cancer. |
Table III.
Multivariate logistic regression
analyses for the combination of Sp1 and HIF1α on cancer-specific
survival in hepatic cancer.
| Independent
variable | HR (95% CI) | P-value |
|---|
| Sex (male vs.
female) | 0.786
(0.468–1.320) | 0.362 |
| Relative family
cancer history | 0.939
(0.544–1.619) | 0.820 |
| Surgery (extended
vs. partial excision) | 1.213
(0.716–2.055) | 0.473 |
| Histology grade
(G3/4 vs. G1/2) | 1.428
(0.844–2.416) | 0.185 |
| Pathologic tumor
stage (T3/4 vs. T1/2) | 0.767
(0.401–1.467) | 0.423 |
| AJCC 7th stage
(III/IV vs. I/II) | 1.883
(0.882–4.019) | 0.102 |
| Expression of Sp1
and HIF1α |
|
|
| Both
markers <2,000 | 1.000
(reference) |
|
| Either
one ≥2,000 | 3.270
(1.843–5.803) | 0.001 |
| Both
markers ≥2,000 | 5.420
(2.767–10.616) | 0.001 |
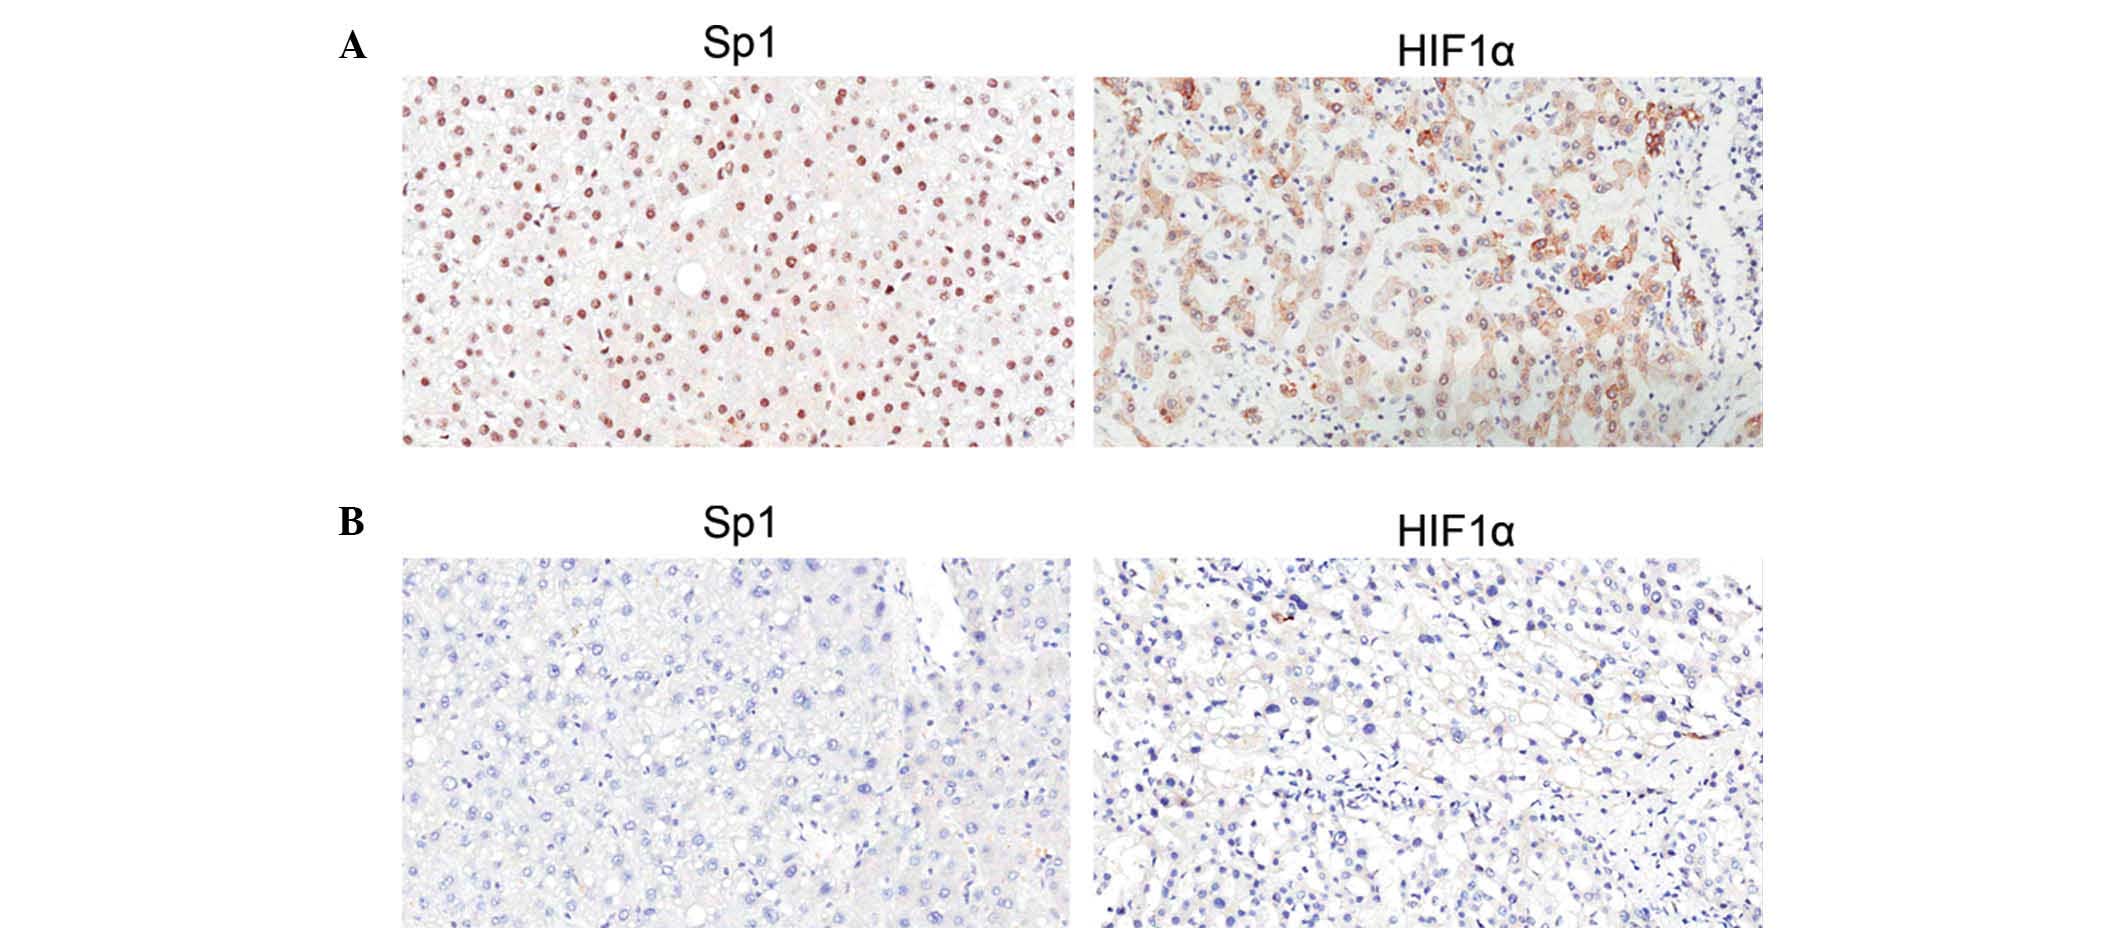
Verification by IHC staining
The expression and subcellular localization of Sp1
and HIF1α in 50 HCC tissues were then determined by IHC. As shown
in Fig. 4, Sp1 was expressed
predominantly in the nuclei of HCC cells of the tumor regions, and
HIF1α was expressed in the nuclei and plasma. The proportions of
Sp1 and HIF1α expression levels according to each score in 25
patients who survived and the remaining 25 patients who succumbed
to cancer are shown in Table IV. As
a result, patients who succumbed to HCC presented significantly
higher score proportions than the surviving patients for the two
genes according to IHC. A total of 15 samples from patients who
succumbed to cancer were evaluated as (+++) for Sp1 and HIF1α
(60.0%), while none of the patients who survived exhibited such
high scores for either gene. This phenomenon emphasized the adverse
influence of Sp1 or HIF1α on prognosis in HCC patients.
| Table IV.The association between Sp1 and HIF1α
according to immunohistochemistry and survival in 50 patients with
hepatic cancer. |
Table IV.
The association between Sp1 and HIF1α
according to immunohistochemistry and survival in 50 patients with
hepatic cancer.
|
|
Outcomesa |
|
Outcomesb |
|---|
|
|
|
|
|
|---|
|
| Alive | Cancer
mortality |
| Alive | Cancer
mortality |
|---|
|
|
|
|
|
|
|
|---|
| Tumor tissue | N | % | N | % | Tumor tissue | N | % | N | % |
|---|
| Sp1 |
|
|
|
| HIF1α |
|
|
|
|
| − | 4 | 16.0 | 1 |
4.0 | − | 6 | 24.0 | 1 |
4.0 |
| + | 15 | 60.0 | 1 |
4.0 | + | 16 | 64.0 | 2 |
8.0 |
| ++ | 3 | 12.0 | 5 | 20.0 | + | 2 |
8.0 | 4 | 16.0 |
|
+++ | 3 | 12.0 | 18 | 72.0 | +++ | 1 |
4.0 | 18 | 72.0 |
Discussion
Using a series of samples from TCGA database, the
expression of Sp1 and HIF1 in HCC cancer tissues were analyzed, and
it was demonstrated that patients with high expression of either
gene had a poorer prognosis, especially in the patients with
co-expression.
It is generally accepted that tumor recurrence and
metastasis are exclusively associated with tumor angiogenesis
following initial therapy (16).
Tumor angiogenesis may provide nutrients for the invasion of tumor
cells; it also promotes cancer cell transfer to other parts of the
body through the blood. Therefore, a biomarker that is associated
with angiogenesis in tumor cells may be more objective in
predicting the risk of recurrence and metastasis in cancer patients
following combined treatment, which may allow timely intervention
and action.
In previous studies, the expression levels of Sp1
and HIF1 were found to be crucial in the regulation and formation
of blood vessels (17–20). Jia et al (21) reported that Spl serves an important
regulatory role in human pancreatic tumor angiogenesis, which was
subsequently used as an effective target for anti-angiogenic
therapy. Similarly, Seznec et al (22) found that mithramycin competitively
inhibits Spl binding and interferes with its transcription in
glioma angiogenesis. Meanwhile, HIF1 is a transcription factor
widespread in mammals under hypoxic conditions; it mediates
cellular adaptation to hypoxic microenvironments and regulates the
survival of cells in hypoxic conditions via multiple signaling
pathways. A number of types of solid tumor have hypoxic
microenvironments, which can induce the release of a variety of
cytokines promoting angiogenesis, thereby promoting tumor growth
and metastasis (23–26). Overexpressed HIF1 protein is present
in a variety of malignant tumors, which is closely associated with
poor prognosis (27–29). HIF1 also regulates a variety of
angiogenesis-associated target genes such as vascular endothelial
growth factor (VEGF) expression (30). In the present study, the co-expression
of Sp1 and HIF1 were evaluated for predicting prognosis in HCC.
According to the findings of the present study, the cutoff value
that differentiated high expression of Sp1 and HIF1α was 2,000;
compared with low expression in HCC subjects (<2,000), the
patients who expressed these genes at a high level had
statistically worse prognosis. These results indicate that patients
with high expression of the two genes had a higher risk of
mortality compared with patients who expressed one gene at a high
level or expressed both genes at a low level. The co-expression of
these two genes may enhance tumor angiogenesis, therefore
accelerating the invasion and metastasis of tumor cells, resulting
in poor prognosis. The IHC staining results indicated that patients
who succumbed to cancer exhibited significantly higher expression
levels compared to those that survived. Therefore, testing for the
combination of two genes may better predict the prognosis of
patients with HCC.
In addition, the results of univariate analysis also
indicated that family cancer history, less-extensive surgical
approach, high tumor grade and stage were adverse prognostic
factors. Family genetic factors may be involved in the activation
of oncogenes and inactivation of tumor suppressor genes, such as
deletion of tumor suppressor genes phosphatase and tension homolog
gene (PTEN) on chromosome 10, a gene involved in tumor cell growth,
adhesion, metastasis, invasion, apoptosis and other processes
(31). Genetic predisposition may be
important in the process of HCC, and family cancer history may
exert a higher susceptibility to liver cancer. In addition, high
tumor grade and advanced staging results in severe vascular and
lymphatic invasion in patients, and less-extended resection as
initial therapy resulted in a high risk of residual tumor. All of
the above factors likely promoted intrahepatic metastasis via the
portal vein system and affected prognosis adversely.
However, in multivariate analysis, the high
co-expression of Sp1 and HIF1 conveyed more risk than any other
clinicopathological factor that was significant for poor prognosis
in univariate analysis. Notably, previous studies aimed at
investigating the association between genes and clinicopathological
features in HCC showed that Sp1 and HIF1 were not closely
associated with other factors such as age, sex, cirrhosis of the
liver, serum AFP and tumor size at the time of diagnosis (32,33).
Considering the role of these two genes in the progression of
angiogenesis, these results suggested that in HCC patients with
high expression of genes at diagnosis, the adverse effect may also
promote the recurrence and metastasis after initial therapy,
worsening the prognosis. Unfortunately, the insufficient data on
relapse in HCC patients from TCGA database limited the analysis on
the impact of gene expression for disease-free survival for the
present study. Multicenter studies with long-term follow-up are
recommended to improve our understanding of the effects of high
co-expression of Sp1 and HIF1 on prognosis in HCC patients.
The present study has several potential limitations.
First, the TCGA database does not include information regarding the
administration of chemotherapy and the quality of surgical care or
pathological technique, and all of these factors may affect the
multivariate analysis. Second, the TCGA database is a public cancer
registry data, so the mechanisms underlying the associations
between the gene expression and prognosis may not be further
studied.
In summary, the present study demonstrated that high
expression levels of Sp1 and HIF1α in HCC tissues were associated
with poor prognosis. In particular, the co-expression of two genes
increased the highest risk on cancer mortality. For survival
benefit, radical surgery and intense follow-up in the HCC patients
with the high co-expression of Sp1 and HIF1α are recommended.
Acknowledgements
The authors acknowledge the efforts of The Cancer
Genome Atlas in the creation of the database. The interpretation
and reporting of these data are the sole responsibility of the
authors.
Glossary
Abbreviations
Abbreviations:
|
HCC
|
hepatocellular cancer
|
|
Sp1
|
transcription factor specificity
protein 1
|
|
HIF1α
|
hypoxia-inducible factor 1α
|
|
TCGA
|
The Cancer Genome Atlas
|
|
AFP
|
α-fetoprotein
|
|
IHC
|
immunohistochemistry
|
|
TNM
|
tumor-node-metastasis
|
|
AJCC
|
American Joint Committee on Cancer
|
|
CSS
|
cancer-specific survival
|
|
HR
|
hazard ratio
|
|
CI
|
confidence interval
|
References
|
1
|
Tang ZY, Ye SL, Liu YK, Qin LX, Sun HC, Ye
QH, Wang L, Zhou J, Qiu SJ, Li Y, et al: A decade's studies on
metastasis of hepatocellular carcinoma. J Cancer Res Clin Oncol.
130:187–196. 2004. View Article : Google Scholar : PubMed/NCBI
|
|
2
|
Gu XQ, Zheng WP, Teng DH, Sun JS and Zheng
H: Impact of non-oncological factors on tumor recurrence after
liver transplantation in hepatocellular carcinoma patients. World J
Gastroenterol. 22:2749–2759. 2016. View Article : Google Scholar : PubMed/NCBI
|
|
3
|
Briggs MR, Kadonaga JT, Bell SP and Tjian
R: Purification and biochemical characterization of the
promoter-specific transcription factor, Sp1. Science. 234:47–52.
1986. View Article : Google Scholar : PubMed/NCBI
|
|
4
|
Ishibashi H, Nakagawa K, Onimaru M,
Castellanous EJ, Kaneda Y, Nakashima Y, Shirasuna K and Sueishi K:
Sp1 decoy transfected to carcinoma cells suppresses the expression
of vascular endothelial growth factor, transforming growth factor
beta1, and tissue factor and also cell growth and invasion
activities. Cancer Res. 60:6531–6536. 2000.PubMed/NCBI
|
|
5
|
Jiang W, Jin Z, Zhou F, Cui J and Wang L
and Wang L: High co-expression of Sp1 and HER-2 is correlated with
poor prognosis of gastric cancer patients. Surg Oncol. 24:220–225.
2015. View Article : Google Scholar : PubMed/NCBI
|
|
6
|
Wang XB, Peng WQ, Yi ZJ, Zhu SL and Gan
QH: Expression and prognostic value of transcriptional factor sp1
in breast cancer. Ai Zheng. 26:996–1000. 2007.PubMed/NCBI
|
|
7
|
Yuan P, Wang L, Wei D, Zhang J, Jia Z, Li
Q, Le X, Wang H, Yao J and Xie K: Therapeutic inhibition of Sp1
expression in growing tumors by mithramycin a correlates directly
with potent antiangiogenic effects on human pancreatic cancer.
Cancer. 110:2682–2690. 2007. View Article : Google Scholar : PubMed/NCBI
|
|
8
|
Pawlus MR and Hu CJ: Enhanceosomes as
integrators of hypoxia inducible factor (HIF) and other
transcription factors in the hypoxic transcriptional response. Cell
Signal. 25:1895–1903. 2013. View Article : Google Scholar : PubMed/NCBI
|
|
9
|
Lee H, Palm J, Grimes SM and Ji HP: The
Cancer Genome Atlas Clinical Explorer: a web and mobile interface
for identifying clinical-genomic driver associations. Genome Med.
7:1122015. View Article : Google Scholar : PubMed/NCBI
|
|
10
|
Carbajo-Pescador S, Ordoñez R, Benet M,
Jover R, García-Palomo A, Mauriz JL and González-Gallego J:
Inhibition of VEGF expression through blockade of Hif1α and STAT3
signalling mediates the anti-angiogenic effect of melatonin in
HepG2 liver cancer cells. Br J Cancer. 109:83–91. 2013. View Article : Google Scholar : PubMed/NCBI
|
|
11
|
Sobin LH, Gospodarowicz MK and Wittekind
C: UICC: TNM Classification of Malignant Tumors (7th). Wiley-Liss.
New York, USA: 1–3. 2009.
|
|
12
|
Edge SB and Compton CC: The American joint
committee on cancer: The 7th edition of the AJCC cancer staging
manual and the future of TNM. Ann Surg Oncol. 17:1471–1474. 2010.
View Article : Google Scholar : PubMed/NCBI
|
|
13
|
Dinse GE and Lagakos SW: Nonparametric
estimation of lifetime and disease onset distributions from
incomplete observations. Biometrics. 38:921–932. 1982. View Article : Google Scholar : PubMed/NCBI
|
|
14
|
Gill RD: Multistate life-tables and
regression models. Math Popul Stud. 3:259–276. 1992. View Article : Google Scholar : PubMed/NCBI
|
|
15
|
Camp RL, Dolled-Filhart M and Rimm DL:
X-tile: A new bio-informatics tool for biomarker assessment and
outcome-based cut-point optimization. Clin Cancer Res.
10:7252–7259. 2004. View Article : Google Scholar : PubMed/NCBI
|
|
16
|
Cao W, Xu X, Zhang J and Duan Y: Tumor
angiogenesis after heated lipiodol infusion via the hepatic artery
in a rabbit model of VX2 liver cancer. PLoS One. 8:e615832013.
View Article : Google Scholar : PubMed/NCBI
|
|
17
|
Fusté M, Pinacho R, Meléndez-Pérez I,
Villalmanzo N, Villalta-Gil V, Haro JM and Ramos B: Reduced
expression of SP1 and SP4 transcription factors in peripheral blood
mononuclear cells in first-episode psychosis. J Psychiatr Res.
47:1608–1614. 2013. View Article : Google Scholar : PubMed/NCBI
|
|
18
|
Villa C, Ridolfi E, Fenoglio C, Ghezzi L,
Vimercati R, Clerici F, Marcone A, Gallone S, Serpente M, Cantoni
C, et al: Expression of the transcription factor Sp1 and its
regulatory hsa-miR-29b in peripheral blood mononuclear cells from
patients with Alzheimer's disease. J Alzheimers Dis. 35:487–494.
2013.PubMed/NCBI
|
|
19
|
Sun RC and Denko NC: Hypoxic regulation of
glutamine metabolism through HIF1 and SIAH2 supports lipid
synthesis that is necessary for tumor growth. Cell Metab.
19:285–292. 2014. View Article : Google Scholar : PubMed/NCBI
|
|
20
|
Chiavarina B, Whitaker-Menezes D, Migneco
G, Martinez-Outschoorn UE, Pavlides S, Howell A, Tanowitz HB,
Casimiro MC, Wang C, Pestell RG, et al: HIF1-alpha functions as a
tumor promoter in cancer associated fibroblasts, and as a tumor
suppressor in breast cancer cells: Autophagy drives
compartment-specific oncogenesis. Cell Cycle. 9:3534–3551. 2010.
View Article : Google Scholar : PubMed/NCBI
|
|
21
|
Jia Z, Zhang J, Wei D, Wang L, Yuan P, Le
X, Li Q, Yao J and Xie K: Molecular basis of the synergistic
antiangiogenic activity of bevacizumab and mithramycin A. Cancer
Res. 67:4878–4885. 2007. View Article : Google Scholar : PubMed/NCBI
|
|
22
|
Seznec J, Silkenstedt B and Naumann U:
Therapeutic effects of the Sp1 inhibitor mithramycin A in
glioblastoma. J Neurooncol. 101:365–377. 2011. View Article : Google Scholar : PubMed/NCBI
|
|
23
|
McDonald PC, Chafe SC and Dedhar S:
Overcoming hypoxia-mediated tumor progression: combinatorial
approaches targeting pH regulation, angiogenesis and immune
dysfunction. Front Cell Dev Biol. 4:272016. View Article : Google Scholar : PubMed/NCBI
|
|
24
|
Badowska-Kozakiewicz AM, Budzik MP and
Przybylski J: Hypoxia in breast cancer. Pol J Pathol. 66:337–346.
2015. View Article : Google Scholar : PubMed/NCBI
|
|
25
|
Ulivi P, Marisi G and Passardi A:
Relationship between hypoxia and response to antiangiogenic therapy
in metastatic colorectal cancer. Oncotarget. Apr 12–2016.(E-pub
ahead of print). doi: 10.18632/oncotarget.8712.
|
|
26
|
Ye LY, Chen W, Bai XL, Xu XY, Zhang Q, Xia
XF, Sun X, Li GG, Hu QD, Fu QH and Liang TB: Hypoxia-induced
epithelial-to-mesenchymal transition in hepatocellular carcinoma
induces an immunosuppressive tumor microenvironment to promote
metastasis. Cancer Res. 76:818–830. 2016. View Article : Google Scholar : PubMed/NCBI
|
|
27
|
Berghoff AS, Ilhan-Mutlu A, Wöhrer A,
Hackl M, Widhalm G, Hainfellner JA, Dieckmann K, Melchardt T, Dome
B, Heinzl H, et al: Prognostic significance of Ki-67 proliferation
index, HIF alpha index and microvascular density in patients with
non-small cell lung cancer brain metastases. Strahlenther Onkol.
190:676–685. 2014. View Article : Google Scholar : PubMed/NCBI
|
|
28
|
Zhao H, Wu Y, Chen Y and Liu H: Clinical
significance of hypoxia-inducible factor 1 and VEGF-A in
osteosarcoma. Int J Clin Oncol. 20:1233–1243. 2015. View Article : Google Scholar : PubMed/NCBI
|
|
29
|
dos Santos M, Mercante AM, Louro ID,
Goncalves AJ, de Carvalho MB, de Silva EH and da Silva AM:
HIF1-alpha expression predicts survival of patients with squamous
cell carcinoma of the oral cavity. PLoS One. 7:e452282012.
View Article : Google Scholar : PubMed/NCBI
|
|
30
|
Wenger RH: Mammalian oxygen sensing,
signalling and gene regulation. J Exp Biol. 203:1253–1263.
2000.PubMed/NCBI
|
|
31
|
Hu TH, Huang CC, Lin PR, Chang HW, Ger LP,
Lin YW, Changchien CS, Lee CM and Tai MH: Expression and prognostic
role of tumor suppressor gene PTEN/MMAC1/TEP1 in hepatocellular
carcinoma. Cancer. 97:1929–1940. 2003. View Article : Google Scholar : PubMed/NCBI
|
|
32
|
Huang Z, Huang L, Shen S, Li J, Lu H, Mo
W, Dang Y, Luo D, Chen G and Feng Z: Sp1 cooperates with Sp3 to
upregulate MALAT1 expression in human hepatocellular carcinoma.
Oncol Rep. 34:2403–2412. 2015.PubMed/NCBI
|
|
33
|
Guo X, Li D, Chen Y, An J, Wang K, Xu Z,
Chen Z and Xing J: SNP rs2057482 in HIF1A gene predicts clinical
outcome of aggressive hepatocellular carcinoma patients after
surgery. Sci Rep. 5:118462015. View Article : Google Scholar : PubMed/NCBI
|