Introduction
S100A6 is a member of the S100 family, which is
found localized to the cytoplasm and nucleus in a wide range of
cell types (1,2). Several studies have shown that S100A6
may be involved in the regulation of cancer progression (3). At present, the deregulated expression of
S100A6 during malignant transformation has been described in human
pancreatic cancer (4), malignant
thyroid neoplasms (5), colorectal
carcinoma (6,7), malignant melanoma (8), breast cancer (9), prostate cancer (10,11)
hepatocellular carcinoma (12) and
renal cell carcinoma (13). Similar
to other S100 proteins, S100A6 may promote cancer progression by
specific involvement in cell survival and apoptotic pathways
(14). In addition, S100A6 may
interact with binding or target proteins, thereby regulating the
dynamics of cytoskeletal constituents, cell growth and
differentiation, and calcium homeostasis (1,14–17).
One possible mechanism underlying the effect of
S100A6 in primary gastric cancer cells is in cell proliferation and
DNA synthesis, which is supported by a previous study showing that
the depletion of S100A6 in vascular endothelial cells increased the
proportion of endothelial cells accumulating in the G2/M phase of
the cell cycle (17). In addition,
Joo et al (18) suggested that
nuclear factor (NF)-κB can regulate the gene expression of S100A6
in the HepG2 human hepatoblastoma cell line. Therefore, S100A6 may
be one of the downstream factors of NF-κB, which promotes
cell-cycle progression. However, the precise mechanism of S100A6 as
a key regulator of cell proliferation remains to be fully
elucidated.
S100A6 is found localized to the nucleus in a wide
range of cell types. ChIP-Chip (or ChIP-on-Chip), also known as
genome-wide location analysis, is a technology used for isolating
the genomic sites occupied by specific DNA binding proteins in
living cells. This strategy can be used to annotate promoters in
genomes by mapping the locations of the protein markers associated
with these sites (19). The function
of the eukaryotic promoter as an initiator for transcription is one
of the most complex processes in molecular biology. These elements,
including the TATA-box, GC-box, CAAT-box and the transcription
start site, are known to function as binding sites for
transcription factors and other proteins, which are involved in the
initiation process. These promoter elements are present in various
combinations separated by various distances in sequence.
In the present study, the expression and functional
properties of S100A6, a major member of the S100 family, were
investigated; primarily focusing on whether it affects cell
proliferation in gastric cancer cells. The present study also
investigated the downstream factors of S100A6.
Materials and methods
Patients and tissue specimens
In total, 196 patients with gastric cancer,
including 132 males and 64 females (mean age, 57 years; age range,
26–80 years) were included in the present study and were diagnosed
and surgically treated at Peking University Cancer Hospital
(Beijing, China) between 1999 and 2007. Primary gastric carcinoma
tissues and matched non-cancerous mucosal tissues were obtained
from the patients and were fixed with 10% formaldehyde in PBS for
immunohistochemistry. The investigations were performed following
approval by the Ethics Committee of Peking University. General
informed consent was obtained from each participant involved in the
study.
Cell culture
The AGS and KATO 3 gastric cancer cell lines were
obtained from American Type Culture Collection (Manassas, VA, USA).
The BGC823 gastric cancer cell line was obtained from the Type
Culture Collection of the Chinese Academy of Sciences (Shanghai,
China). The cell lines were routinely grown in RPMI-1640 medium
(Gibco; Thermo Fisher Scientific, Inc., Waltham, MA, USA),
supplemented with 10% (v/v) fetal calf serum (FCS; Gibco; Thermo
Fisher Scientific, Inc.) and antibiotics at 37°C in a humidified 5%
CO2 atmosphere.
Immunohistochemical analysis
Sections (4 µm) of the formalin-fixed,
paraffin-embedded tissues were mounted on poly-L-lysine-coated
slides, deparaffinized in xylene, rehydrated with alcohol and
rinsed with distilled water. Endogenous peroxidase activity was
blocked with 3% hydrogen peroxide for 15 min at room temperature.
Following heating the slides under pressure (120°C and 103 kPa/15
psi) in 10 mmol/l EDTA (pH 8.0) for 3 min, the sections were
incubated overnight at 4°C with mouse anti-S100A6 monoclonal
antibody (1:500; cat. no. H00006277-M16; Abnova, Taipai, Taiwan),
or mouse Ki-67 monoclonal antibody (1:100; cat. no. MS-1794-S0;
LabVision, Fremont, CA, USA). Primary antibodies were detected
using a two-step EnVision system (Dako, Glostrup, Denmark). As a
negative control, the primary antibody was replaced with nonimmune
mouse serum (Dako) to confirm its specificity.
Evaluation of slides
Evaluation of the S100A6 staining was performed
using previously described scoring criteria (20). The recorded information included the
subcellular location of the S100A6 staining (nuclear and/or
cytoplasmic), the intensity of staining (negative, weak, moderate
and strong) and the percentage of cells demonstrating positive
immunoreactivity.
The reactivity of Ki-67 was evaluated by counting
the number of positive and negative tumor cell nuclei in at least
four randomly selected fields in each section under a light
microscope. The slides were visualized by two pathologists with no
knowledge of the clinical data. Reproducibility of the scoring
method between the two observers was >90%. In the remaining
cases, if discrepancies were noted, the differences were settled
through consensus following a review of the corresponding
slides.
Laser confocal scanning
For double staining, mouse anti-human S100A6
antibody (1:500; Abnova) and rabbit anti-human Ki-67 antibody
(1:100; cat. no. RM-9106-S0; LabVision) were used as the primary
antibodies. The secondary antibodies used for double staining were
fluorescein isothiocyanate (FITC)-conjugated goat anti-mouse
antibody and rhodamine (TRITC)-conjugated goat anti-rabbit antibody
(Jackson ImmunoResearch Laboratories, Inc., West Grove, PA, USA).
Confocal images were captured using a Leica TCS SP5 confocal
microscope (Leica Microsystems GmbH, Mannheim, Germany). The
excitation wavelength for TRITC was 586 and for FITC was 488 nm. In
addition, the nuclei of specimens were simultaneously stained with
DAPI, with excitation at 358 nm.
Immunoelectron microscopy
The post-embedding immunogold method was used to
detect the S100A6 proteins. The anti-S100A6 antibody, obtained from
Abnova, was used at a dilution of 1:40. The gastric cancer tissues
(1 mm3 in size) were immersed for 6 h in fresh
glutaraldehyde fixative solution, following which the tissues were
washed in 0.2 M sucrose and fixed in 1% osmium tetroxide for 4 h at
4°C. Subsequently, the tissues were dehydrated using a graded
acetone series (−4°C), embedded in epoxy resin, and polymerized at
37°C for 24 h and 60°C for 48 h. Ultrathin sections (60 nm) were
obtained on an ultramicrotome and collected on nickel grids. All
sections were incubated in 10% H2O2, rinsed
with phosphate-buffered saline enriched with 1% bovine serum
albumin (Gibco; Thermo Fisher Scientific, Inc.) and 0.5% powdered
skim milk three times (5 min each), and then incubated with the
primary antibodies at 4°C overnight. Following incubation, the
sections were washed three times in TBS (pH 7.6), following which
the sections were incubated with goat anti-mouse IgG antibody
conjugated to 10 nm gold particles (Sigma-Aldrich; Merck Millipore,
Darmstadt, Germany) at a dilution of 1:100 in TBS (pH 7.6). The
sections were rinsed three times (10 min each) in enriched TBS,
rinsed three times (10 min each) in distilled water, and then
stained with uranyl acetate and lead citrate. The sections were
visualized and images were captured using a Zeiss 900 transmission
electron microscope (Zeiss GmbH, Oberkochen, Germany).
Plasmids and S100A6 transfection
The cDNAs encoding human S100A6 were generated from
human tissues using polymerase chain reaction (PCR) with the
following forward and reverse primers containing BamHI and
XhoI sites: Forward 5′-AAGGATCCTACCGCTCCAAGCCCAGC-3′ and
reverse 5′-CTCGAGCGCCCTTGAGGGCTTCATTGTAGAT-3′. The PCR products
were digested with BamHI and XhoI, and then directly
subcloned into the BamHI and XhoI sites of
pcDNA.3.1/myc-His C vectors (Invitrogen; Thermo Fisher Scientific,
Inc.), which produce fusion proteins.
The AGS and BGC823 human gastric cancer cell lines
were maintained in high-glucose Dulbecco's modified Eagle's medium
(Gibco; Thermo Fisher Scientific, Inc.) containing 10% FCS. At the
time of transfection, the cells were 90% confluent. The cells in
6-well plates (8×10⁵) were transfected with a total of
4.0 µg of plasmid DNAs using Lipofectamine™ 2000 reagent
(Invitrogen; Thermo Fisher Scientific, Inc.). The medium was
replaced 6 h later. The cells were incubated at 37°C in a
CO2 incubator for 48 h prior to assessment of transgene
expression. G418 (300 ng/ml; Gibco; Thermo Fisher Scientific, Inc.)
was used to screen and isolate the resistant colonies. The
efficiency of stable transfection was confirmed using PCR and
western blot analyses.
Reverse transcription-quantitative PCR
(RT-qPCR) analysis
RT-qPCR was performed to confirm successful
transfection of the cell lines with S100A6 and to determine the
expression levels of interleukin (IL)-8, IL-2, IL-13, IL-6R,
cyclin-dependent kinase (CDK) 4, CDK5, minichromosome maintenance
complex component 7 (MCM7), B-cell lymphoma 2 (Bcl2) and MYC. Total
RNA was extracted using TRIzol reagent (Invitrogen; Thermo Fisher
Scientific, Inc.), according to the manufacturer's protocol. Total
RNA (1 µg) was reverse transcribed using the GoScript™ Reverse
Transcription System (Promega Corporation, Madison, WI, USA). qPCR
was performed using the SYBR Green PCR Master Mix kit (Applied
Biosystems; Thermo Fisher Scientific, Inc.) with the following
cycling conditions: 95°C for 10 min, followed by 40 cycles at 95°C
for 15 sec, 60°C for 10 sec and 72°C for 60 sec. Each sample was
run thrice. The primer sequences were as follows: S100A6 forward,
5′-AAGCTGCAGGATGCTGAAAT-3′ and reverse, 5′-CCCTTGAGGGCTTCATTGTA-3′;
IL-8 forward, 5′-ACTGAGAGTGATTGAGAGTGGAC-3′ and reverse,
5′-AACCCTCTGCACCCAGTTTTC-3′; IL-2 forward,
5′-AACTCCTGTCTTGCATTGCAC-3′ and reverse,
5′-GCTCCAGTTGTAGCTGTGTTT-3′; IL-13 forward,
5′-CCTCATGGCGCTTTTGTTGAC-3′ and reverse,
5′-TCTGGTTCTGGGTGATGTTGA-3′; IL-6R forward,
5′-CCCCTCAGCAATGTTGTTTGT-3′ and reverse, 5′-CTCCGGGACTGCTAACTGG-3′;
CDK4 forward, 5′-ATGGCTACCTCTCGATATGAGC-3′ and reverse,
5′-CATTGGGGACTCTCACACTCT-3′; CDK5 forward,
5′-GGAAGGCACCTACGGAACTG-3′ and reverse, 5′-GGCACACCCTCATCATCGT-3′;
MCM7 forward, 5′-CCTACCAGCCGATCCAGTCT-3′ and reverse,
5′-CCTCCTGAGCGGTTGGTTT-3′; Bcl2 forward, 5′-GGTGGGGTCATGTGTGTGG-3′
and reverse 5′-CGGTTCAGGTACTCAGTCATCC-3′; MYC forward,
5′-GGCTCCTGGCAAAAGGTCA-3′ and reverse, 5′-CTGCGTAGTTGTGCTGATGT-3′;
and β-actin forward, 5′-AAATCTGGCACCACACCTTC-3′ and reverse,
5′-GGGGTGTTGAAGGTCTCAAA-3′. The expression of each gene was
determined as the ratio of the mRNA expression of each target gene
to that of β-actin, using the 2−ΔΔCq method (21).
Western blot analysis
Total proteins were extracted using TRIzol reagent,
according to the manufacturer's protocol. Protein concentration was
determined using a Bicinchoninic Acid Protein Assay kit (Thermo
Fisher Scientific, Inc.). Samples were denatured in SDS sample
loading buffer by heating at 100°C for 3 min and resolved by 12%
SDS-PAGE, followed by transfer to polyvinylidene difluoride
membranes. Blots were blocked with 5% nonfat milk in PBS for 30 min
and then incubated with the mouse anti-S100A6 monoclonal antibody
(1:2,000) and mouse anti-tubulin monoclonal antibody (1:5,000; cat.
no. T5168; Sigma-Aldrich; Merck Millipore) for 2 h at room
temperature. After washing, the membranes were incubated with the
horseradish peroxidase-conjugated anti-mouse antibody (1:1,000;
cat. no. sc-2005; Santa Cruz Biotechnology, Inc., Santa Cruz, CA,
USA). Protein-antibody complexes were visualized using the
SuperSignal West Pico Chemiluminescent Substrate (Thermo Fisher
Scientific, Inc.).
Cell proliferation assay
The BGC823, AGS, BGC823 cells transfected with
pcDNA.3.1/myc-His C plasmid (BGC823/control), AGS cells transfected
with pcDNA.3.1/myc-His C plasmid (AGS/control), BGC823 cells
transfected with S100A6/pcDNA.3.1/myc-His C plasmid (BGC823/S100A6)
and AGS cells transfected with S100A6/pcDNA.3.1/myc-His C plasmid
(AGS/S100A6) were digested with trypsin-EDTA buffer (Gibco; Thermo
Fisher Scientific, Inc.). A suspension of 2×10³ cells/90
µl medium was added to each well of 96-well plates and allowed to
grow; each concentration had three duplicate wells. The plates were
incubated for 1, 2, 3, 4, 5 and 6 days following which 10 µl of
Cell Counting Kit-8 (CCK8) solution (Dojindo Molecular
Technologies, Inc., Kumamoto, Japan) was added to each well and the
plates were incubated for another 2 h at 37°C. Subsequently, the
absorbance was read at 450 nm using a Model 680 microplate reader
(Bio-Rad Laboratories, Inc., Hercules, CA, USA) (22).
ChIP-Chip assay. KATO3 cells (10,000,000) were
prepared, crosslinked with 1% formaldehyde and lysed with lysate
buffer. Sonication was used to break genomic DNA into small DNA
fragments. Anti-S100A6 (Abnova) was added and used to
immunoprecipitate DNA fragments corresponding to the promoter
regions. IgG was used as a control. The DNA fragments bound by
proteins were then isolated, and DNA was hybridized to the
GLAS-H20K-Chip (Aviva Systems Biology, Corp., San Diego, CA, USA),
with the transcription starting point approximately in the −800 to
+200 regions. The microarray was then scanned, and two images
corresponding to anti-S100A6 and IgG (control) were captured.
Subsequently, the ratio between anti-S100A6 and IgG was calculated.
The factors for which the ratio was >2 were selected. Gene
Ontology (GO) analysis was then performed to clarify the gene
function (http://geneontology.org).
Statistical analysis
Spearman's rank correlation was performed to analyze
the correlation between the mRNA expression of S100A6 and Ki67.
Two-way analysis of variance was performed to analyze the results
of the CCK8 assay. P<0.05 was considered to indicate a
statistically significant difference and all tests were two-tailed.
The statistical analysis was performed using SPSS V16.0 software
(SPSS, Inc., Chicago, IL, USA).
Results
Expression of S100A6 and its
localization in gastric cancer tissues
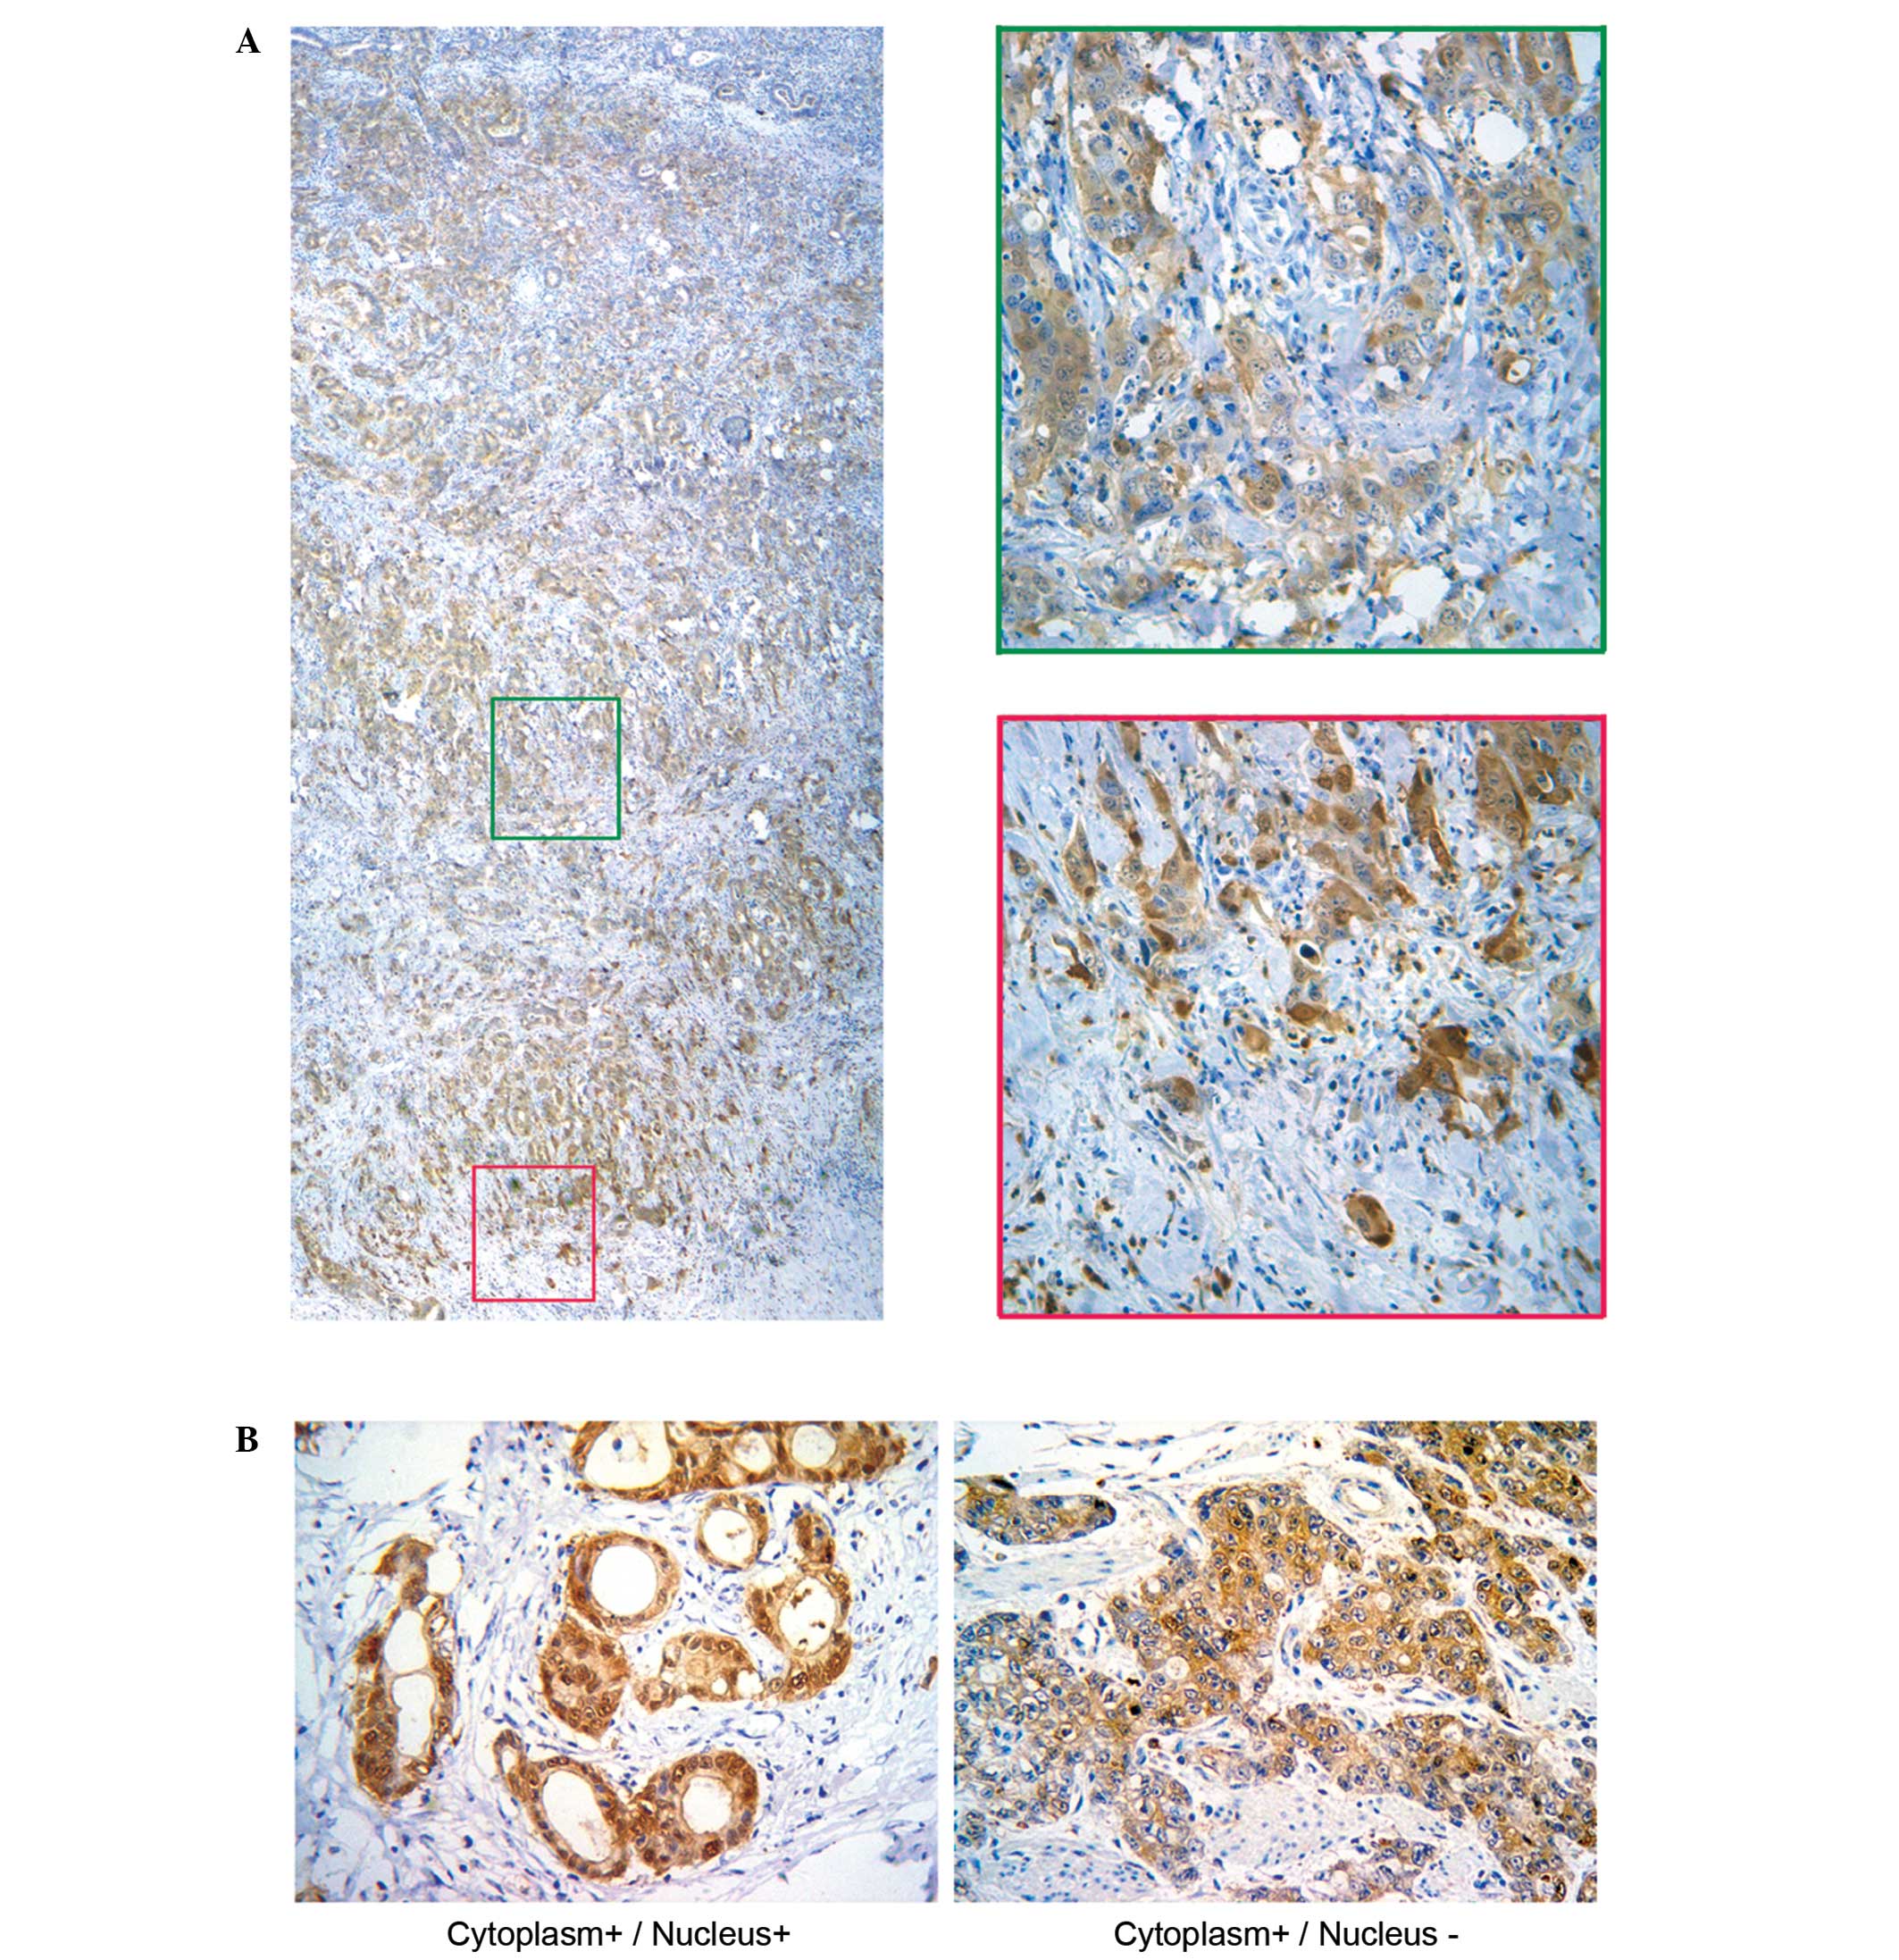
A comparison between primary gastric carcinoma
tissues and matched non-cancerous mucosal tissues revealed
significant differences in the protein levels of S100A6 in these
tissues. In the primary gastric carcinoma tissues, the intensity of
S100A6 staining was markedly higher in the cytoplasm and nucleus of
primary gastric carcinoma tissues, compared with the matched
non-cancerous mucosa, which had either no or weak cytoplasmic
staining. The S100A6 nuclear staining was significantly higher in
the invading fronts with structural atypia, compared with the
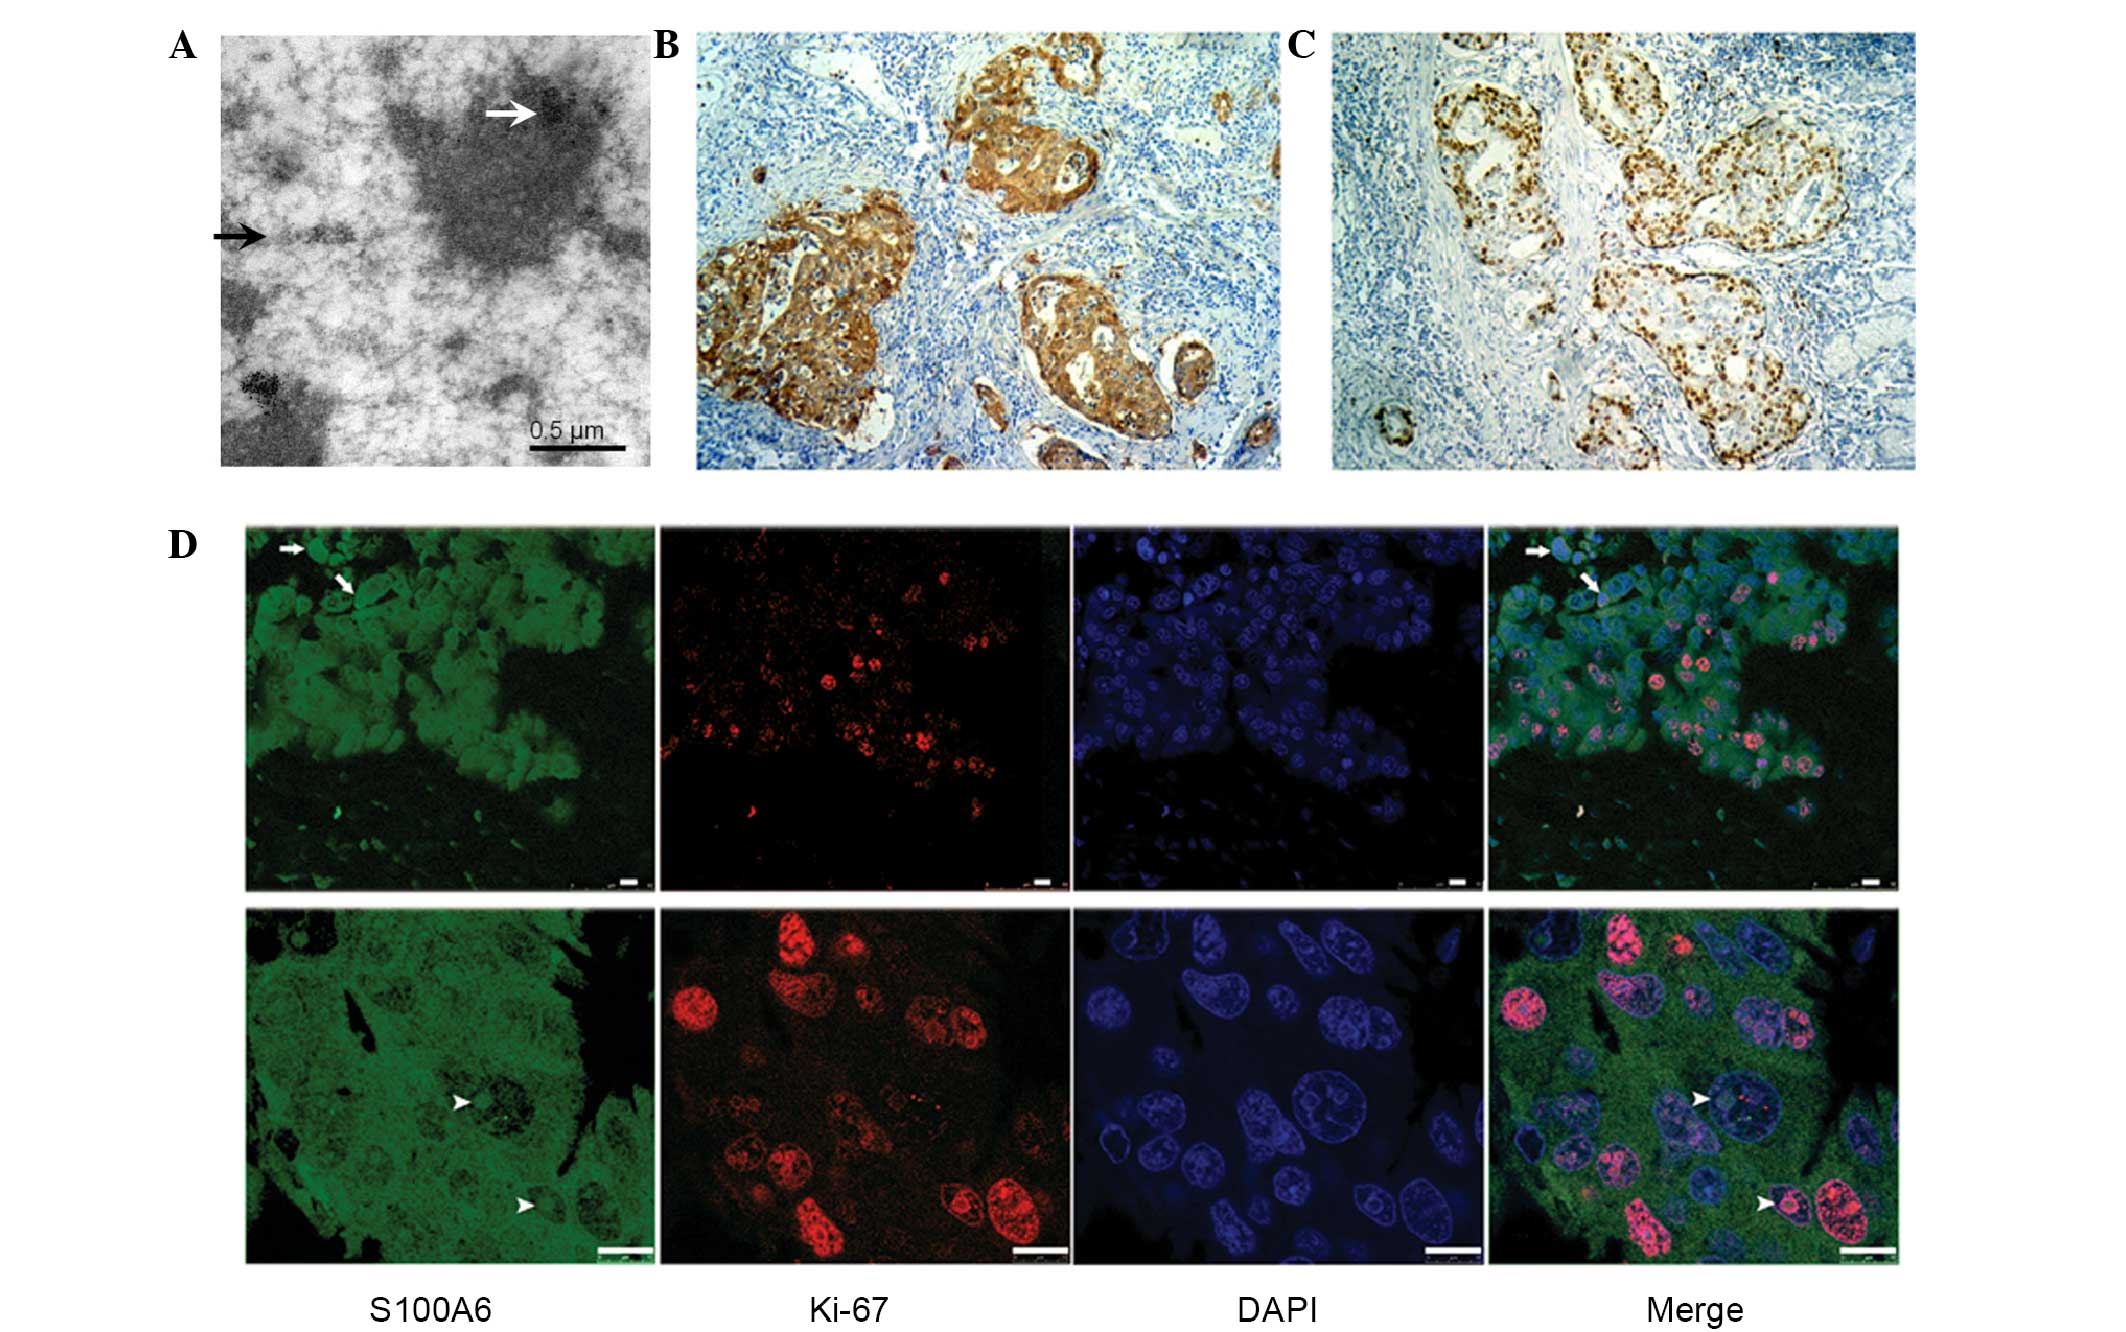
central portions with glandular structures (Fig. 1A and B). The ultrastructural images
captured using an immunoelectron microscope showed that S100A6 was
deposited within the cytoplasm and nucleus, whereas it was
distributed in the nucleoplasmic and nucleolar structures in
gastric cancer cells (Fig. 2A).
Expression of S100A6 is associated
with the Ki-67 labeling index
To investigate whether the expression of S100A6 was
associated with in vivo cell proliferation, 108 samples
underwent Ki-67 and S100A6 immunohistochemical staining,
respectively. Statistical analysis revealed a positive correlation
between high expression of S100A6 and a high Ki-67 labeling index
(P=0.043; Fig. 2B and C). In total,
10 representative slides were selected for immunofluorescence
staining and consecutive laser confocal scanning, which showed that
the Ki-67 antigen was found localized to the nuclear region
(Fig. 2D).
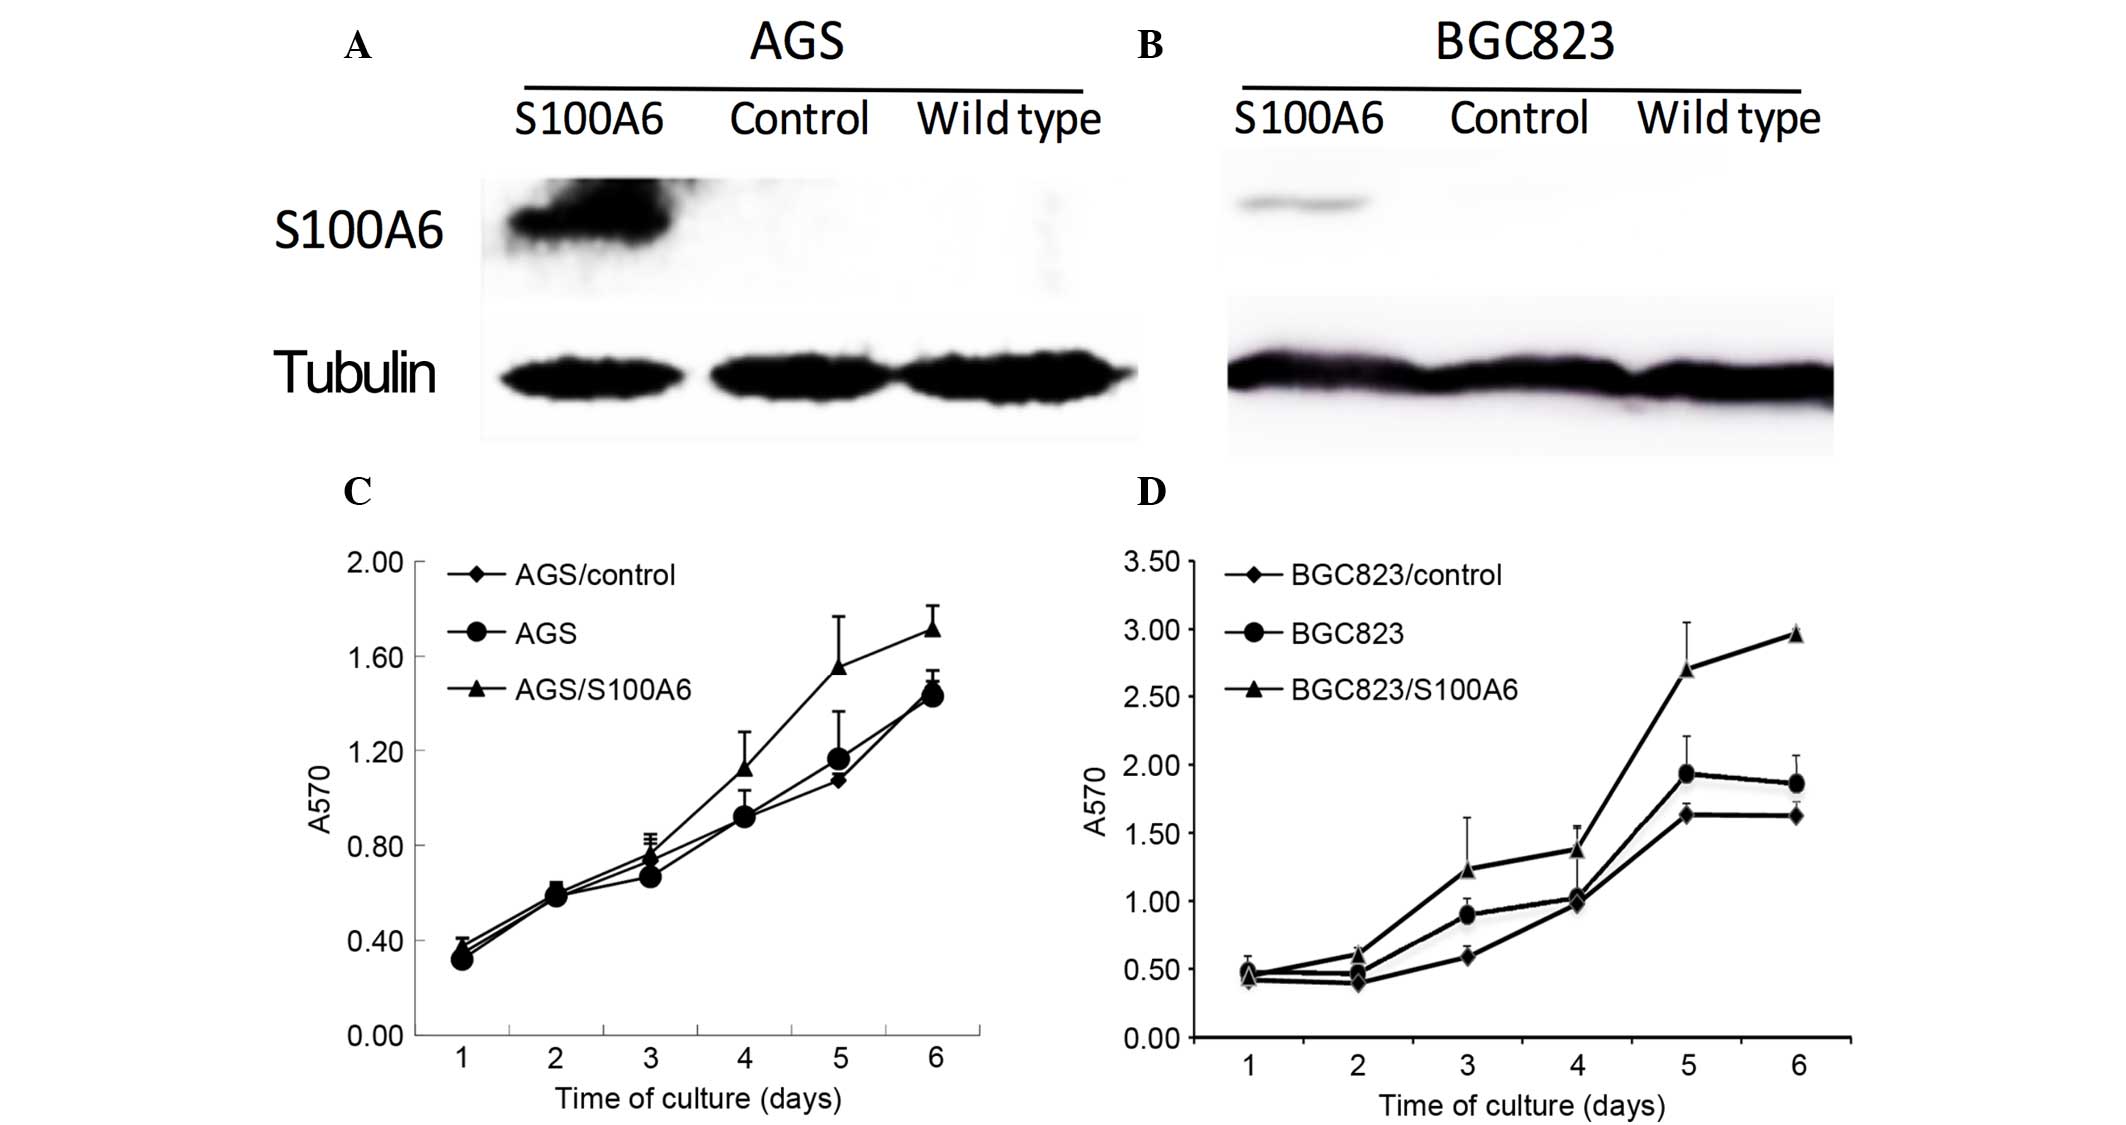
Effect of S100A6 transfection on cell
proliferation
The correlation between S100A6 and cell
proliferation was also investigated in vitro. Successful
transfection of AGS and BGC823 cells with S100A6 was confirmed by
western blotting (Fig. 3A and B). The
present study examined whether S100A6 transfection promoted cell
proliferation. The AGS, AGS/control, AGS/S100A6, BGC823,
BGC823/control and BGC823/S100A6 cells were incubated for 1, 2, 3,
4, 5 and 6 days, and the growth rates were calculated using a CCK8
assay. The results suggested that the cell proliferation rate
increased gradually and reached its highest level following 6 days
of incubation. The proliferative abilities of the AGS/S100A6 and
BGC823/S100A6 cells were markedly increased compared with those of
the controls (Fig. 3C and D).
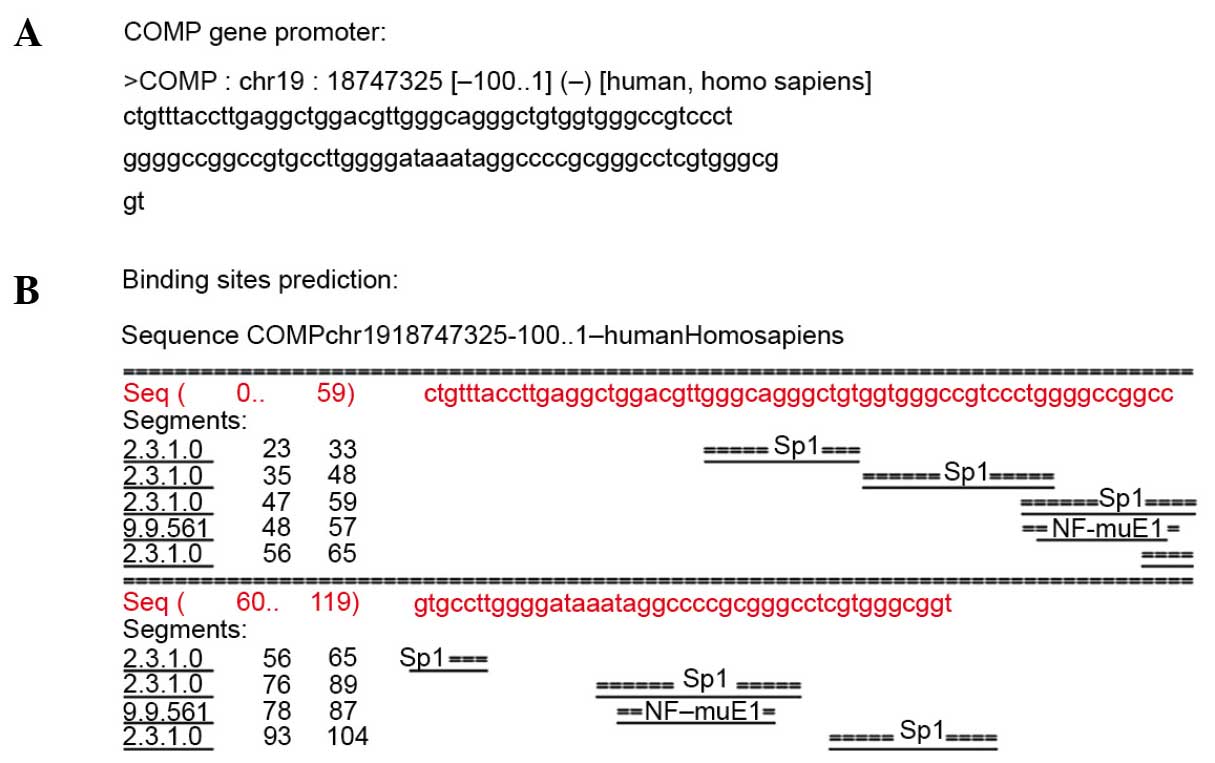
S100A6 combines with the gene promoter
region and promotes the expression of the downstream
cancer-associated genes
Based on the above results, it was concluded that
S100A6 was located at nucleolar structures and that it regulated
cell proliferation. Subsequently, a ChIP-Chip assay was performed,
with the promoter Chip including approximately −800 to +200 regions
around the transcription starting point. The results showed the
involvement of 1,328 genes, which regulate metabolic process, cell
proliferation, cell cycle and cell apoptosis. GO category analysis
suggested that 57 factors were associated with cell proliferation
(Table I). In addition, the common
sites of the promoter regions of the 1,328 involved genes were
analyzed using the human and mouse promoter database (−100 to +1).
The results showed that the promoter regions of the majority of
genes had SP1 protein binding sites, for example the cartilage
oligomeric matrix protein gene (Fig. 4A
and B).
 | Table I.Factors associated with cell
proliferation detected using the ChIP-Chip assay. |
Table I.
Factors associated with cell
proliferation detected using the ChIP-Chip assay.
| Accession no. | Name | Ratio Ab/IgG | Description |
|---|
| NM_007037 | ADAMTS8 | 9.76 | ADAM
metallopeptidase with thrombospondin type 1 motif, 8 |
| NM_000584 | IL-8 | 9.44 | Interleukin-8 |
| NM_000075 | CDK4 | 9.25 | Cyclin-dependent
kinase 4 |
| NM_005962 | MXI1 | 7.66 | MAX interactor
1 |
| NM_145080 | NSE1 | 5.45 | Non-SMC element 1
homolog (S. cerevisiae) |
| NM_001352 | DBP | 4.67 | Group-specific
component (vitamin D binding protein) |
| NM_145307 | PLEKHK1 | 4.62 | Pleckstrin homology
domain containing, family K member 1 |
| NM_002188 | IL-13 | 4.48 | Interleukin-13 |
| NM_002415 | MIF | 4.13 | S100 calcium
binding protein A9 (calgranulin B) |
| NM_002211 | ITGB1 | 4.03 | Integrin, β 1
(fibronectin receptor, β polypeptide, antigen CD29 includes MDF2,
MSK12) |
| NM_001282 | AP2B1 | 3.92 | Adaptor-related
protein complex 2, β 1 subunit |
| NM_006191 | PA2G4 | 3.88 |
Proliferation-associated 2G4, 38 kDa |
| NM_014366 | NS | 3.82 | Guanine nucleotide
binding protein-like 3 (nucleolar) |
| NM_000565 | IL-6R | 3.55 | Interleukin-6
receptor |
| NM_003711 | PPAP2A | 3.51 | Phosphatidic acid
phosphatase type 2A |
| NM_002457 | MUC2 | 3.45 | Mucin 2, oligomeric
mucus/gel-forming |
| NM_001565 | CXCL10 | 3.29 | Chemokine (C-X-C
motif) ligand 10 |
| NM_005880 | DNAJA2 | 3.25 | DnaJ (Hsp40)
homolog, subfamily A, member 2 |
| NM_000369 | TSHR | 3.21 | Thyroid stimulating
hormone receptor |
| NM_000633 | BCL2 | 3.18 | B-cell CLL/lymphoma
2 |
| NM_002825 | PTN | 3.15 | Pleiotrophin
(heparin binding growth factor 8, neurite growth-promoting factor
1) |
| NM_153632 | HOXA3 | 3.14 | Homeobox A3 |
| NM_182776 | MCM7 | 3.11 | MCM7 minichromosome
maintenance deficient 7 (S. cerevisiae) |
| NM_002355 | M6PR | 3.10 | Mannose-6-phosphate
receptor (cation dependent) |
| NM_004935 | CDK5 | 2.94 | Cyclin-dependent
kinase 5 |
| NM_006510 | RFP | 2.93 | Ret finger
protein |
| NM_000595 | LTA | 2.90 | Lymphotoxin α (TNF
superfamily, member 1) |
| NM_000586 | IL-2 | 2.86 | Interleukin-2 |
| NM_005438 | FOSL1 | 2.86 | FOS-like antigen
1 |
| NM_005524 | HES1 | 2.81 | Hairy and enhancer
of split 1, (Drosophila) |
| NM_198218 | ING1 | 2.79 | Inhibitor of growth
family, member 1 |
| NM_003254 | TIMP1 | 2.72 | TIMP
metallopeptidase inhibitor 1 |
| NM_005542 | INSIG1 | 2.69 | Insulin induced
gene 1 |
| NM_004236 | TRIP15 | 2.62 | COP9 constitutive
photomorphogenic homolog subunit 2 (Arabidopsis) |
| NM_016041 | F-LANa | 2.54 | Der1-like domain
family, member 2 |
| NM_001311 | CRIP1 | 2.50 | Cysteine-rich
protein 1 (intestinal) |
| NM_020310 | MNT | 2.49 | MAX binding
protein |
| NM_003255 | TIMP2 | 2.46 | TIMP
metallopeptidase inhibitor 2 |
| NM_001233 | CAV2 | 2.45 | Caveolin 2 |
| NM_173176 | PTK2B | 2.42 | PTK2B protein
tyrosine kinase 2 β |
| NM_000306 | POU1F1 | 2.40 | POU domain, class
1, transcription factor 1 (Pit1, growth hormone factor 1) |
| NM_006034 | TP53I11 | 2.40 | Tumor protein p53
inducible protein 11 |
| NM_015902 | DD5 | 2.39 | E3 ubiquitin
protein ligase, HECT domain containing, 1 |
| NM_001981 | EPS15 | 2.35 | Epidermal growth
factor receptor pathway substrate 15 |
| NM_004429 | EFNB1 | 2.35 | Ephrin-B1 |
| NM_015066 | TRIM35 | 2.33 | Tripartite
motif-containing 35 |
| NM_004356 | CD81 | 2.31 | CD81 molecule |
| NM_000508 | FGA | 2.26 | Fibrinogen α
chain |
| NM_005378 | MYCN | 2.24 | v-myc
myelocytomatosis viral related oncogene, neuroblastoma derived
(avian) |
| NM_006763 | BTG2 | 2.24 | BTG family, member
2 |
| NM_006763 | BTG2 | 2.24 | BTG family, member
2 |
| NM_006292 | TSG101 | 2.11 | Tumor
susceptibility gene 101 |
| NM_006806 | BTG3 | 2.09 | BTG family, member
3 |
| NM_033224 | PURB | 2.05 | Purine-rich element
binding protein B |
| NM_000194 | HPRT1 | 2.02 | Hypoxanthine
phosphoribosyltransferase 1 (Lesch-Nyhan syndrome) |
| NM_002467 | MYC | 2.02 | Nucleolar protein 3
(apoptosis repressor with CARD domain) |
| NM_153719 | NUP62 | 2.00 | Nucleoporin 62
kDa |
To confirm the effect of S100A6 on the expression of
factors associated with the malignant cell phenotype, the present
study compared the expression levels of IL-8, IL-2, IL-13, IL-6R,
CDK4, CDK5, MCM7, Bcl2 and MYC prior to and following S100A6
transfection of the BGC823 and AGS cell lines. RT-qPCR analysis was
performed, which revealed that, following S100A6 transfection in
the AGS cell lines, the mRNA expression levels of IL-8, CDK5, CDK4,
MCM7 and Bcl2 were increased (Fig.
5A-E, respectively).
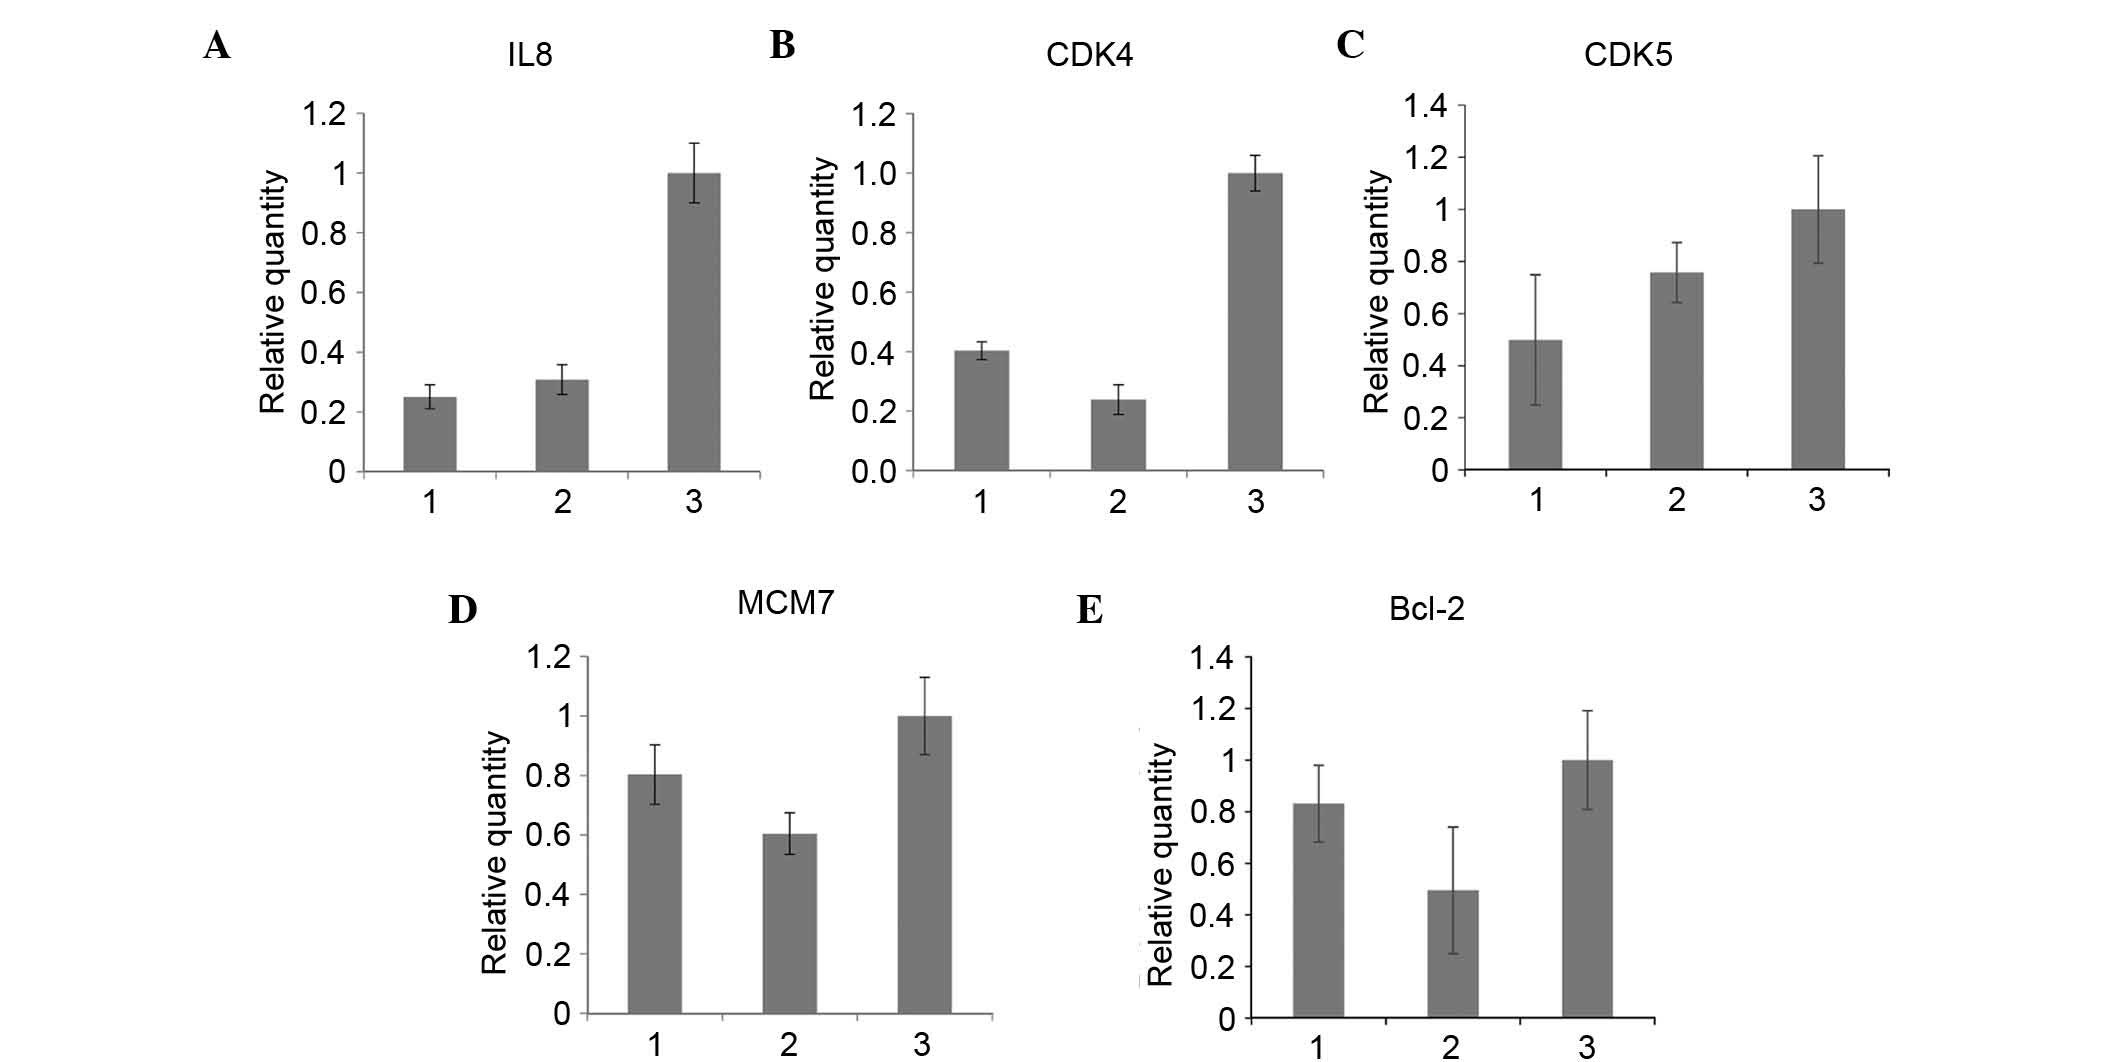 | Figure 5.Alterations in the expression levels
of downstream genes prior to and following S100A6 transfection. (A)
IL8, (B) CDK4, (C) CDK5, (D) MCM7, and (E) Bcl-2. 1, AGS cells; 2,
AGS/control cells; 3, AGS/S100A6 cells; IL-8, interleukin-8; CDK,
cyclin-dependent kinase; MCM7, minichromosome maintenance complex
component 7; Bcl2, B-cell lymphoma 2. |
Discussion
S100A6 is a member of the S100 family of proteins,
which are found localized to the cytoplasm and nucleus in a wide
range of cell types. S100A6 is identified based on its cell
cycle-dependent expression, as it is preferentially expressed in
the G1 phase of the cell cycle following mitogenic
stimuli. It has previously been suggested that the expression of
S100A6 is associated with cell proliferation; it is expressed in
several types of cancer phenotypes. S100A6 is implicated in the
regulation of different cellular processes, including cell cycle
progression, differentiation and apoptosis. However, the precise
biological or cellular functions of S100A6 remain to be fully
elucidated, and contradictory roles have been suggested (23).
Localization experiments suggested that S100A6 was
present in the cytoplasm and nucleus, where it distributed to
nucleoplasmic and nucleolar structures in the gastric cancer cells,
and that immunostaining was significantly higher in the invading
fronts. It is possible that the S100A6 protein performs multiple
functions in the cytoplasm and nucleus of primary gastric cancer
cells.
To further investigate the role of S100A6 in gastric
cancer, the S100A6 gene was transfected into the AGS and BGC823
gastric cancer cell lines. The results of the CCK8 assay suggested
that overexpression of S100A6 promoted cell proliferation. Thus,
S100A6 affected cell proliferation in the AGS and BGC823 cell
lines. In addition, a positive correlation between high expression
levels of S100A6 and a high Ki-67 labeling index was found in
vivo. These results confirmed that S100A6 was associated with
the proliferation of gastric cancer cells.
Subsequently, the present study investigated how
S100A6 affects cell proliferation. Examination of the expression of
S100A6 in the gastric cancer cell lines revealed that the KATO3
cells had high levels of S100A6 in the cytoplasm and nucleus.
Therefore, the KATO3 cells were selected to perform a ChIP-Chip
assay. The ChIP-Chip assay was used to detect the gene promoter
regions to which S100A6 may bind directly or indirectly. The
ChIP-Chip results suggested that S100A6 may regulate the expression
of 1,328 factors. Analyses of the GO categories included several
genes, which are relevant to cell proliferation, cell migration and
invasion. As evidence has suggested that S100A6 regulates the
levels of certain genes involved in cell proliferation, including
IL-8 (24), IL-2 (25), IL-13 (26), IL-6R (27), CDK4 (28), CDK5 (29), MCM7 (30), Bcl2 (29) and MYC (31), these genes were selectively assessed.
To confirm and to evaluate their expression levels, mRNA
quantification was performed. The overexpression of S100A6 caused a
marked increase in the mRNA levels of CDK4, CDK5, IL-8, Bcl2 and
MCM7. This overexpression is a consequence of the specific
activation of the CDK4, CDK5, IL-8, Bcl2 and MCM7 gene promoters by
S100A6, as demonstrated by the ChIP-Chip assay. Thus, S100A6 may
affect the malignant cell phenotype by regulating the expression
levels of CDK4, CDK5, IL-8, Bcl2 and MCM7.
The common sites of the promoter region in the 1,328
involved genes were predicted using the human and mouse promoter
database (−100 to +1). The results showed that the promoter regions
of the majority of genes had SP1 protein binding sites. The
determination of how S100A6 binds to the gene promoters warrants
further investigation. Previous reports have suggested that there
is no DNA-binding domain in the S100A6 protein. S100A6 interacts
with p53 in the presence of calcium ion affinity chromatography and
co-immunoprecipitation (32). p53 can
mediate the promoter attenuation of the cyclin B1 promoter,
depending on the presence of functional Sp1 binding sites (33). Thus, further investigation is required
to determine whether S100A6 binds to p53 and whether it is involved
in the Sp1 binding sites.
In conclusion, the present study revealed that
S100A6 was overexpressed in gastric cancer cells, in the cytoplasm
and nucleus. Increased expression of S100A6 promoted cell
proliferation in gastric cancer cells. A promoter ChIP-Chip assay
was used to detect the gene promoter regions to which S100A6 may
bind directly or indirectly, and 1,328 factors were found,
including 57 factors associated with cell proliferation. The
overexpression of S100A6 caused a marked increase in the mRNA
expression levels of CDK4, CDK5, IL-8, Bcl2 and MCM7. In addition,
S100A6 was associated with rRNA transcription. The results
suggested that S100A6 may regulate cell proliferation by affecting
the expression levels of the above-mentioned factors.
Acknowledgements
This study was funded by the National Key Technology
R&D Program (grant nos. 2012AA02A203-B01, 2012AA02A504-B01 and
2012AA020101) and the Beijing Municipal Science & Technology
Commission (grant no. D131100005313010).
References
|
1
|
Cross SS, Hamdy FC, Deloulme JC and Rehman
I: Expression of S100 proteins in normal human tissues and common
cancers using tissue microarrays: S100A6, S100A8, S100A9 and
S100A11 are all overexpressed in common cancers. Histopathology.
46:256–269. 2005. View Article : Google Scholar : PubMed/NCBI
|
|
2
|
Wang XH, Zhang LH, Zhong XY, Xing XF, Liu
YQ, Niu ZJ, Peng Y, Du H, Zhang GG, Hu Y, et al: S100A6
overexpression is associated with poor prognosis and is
epigenetically up-regulated in gastric cancer. Am J Pathol.
177:586–597. 2010. View Article : Google Scholar : PubMed/NCBI
|
|
3
|
Filipek A and Kuźnicki J: Calcyclin-from
basic research to clinical implications. Acta Biochim Pol.
40:321–327. 1993.PubMed/NCBI
|
|
4
|
Shekouh AR, Thompson CC, Prime W, Campbell
F, Hamlett J, Herrington CS, Lemoine NR, Crnogorac-Jurcevic T,
Buechler MW, Friess H, et al: Application of laser capture
microdissection combined with two-dimensional electrophoresis for
the discovery of differentially regulated proteins in pancreatic
ductal adenocarcinoma. Proteomics. 3:1988–2001. 2003. View Article : Google Scholar : PubMed/NCBI
|
|
5
|
Brown LM, Helmke SM, Hunsucker SW,
Netea-Maier RT, Chiang SA, Heinz DE, Shroyer KR, Duncan MW and
Haugen BR: Quantitative and qualitative differences in protein
expression between papillary thyroid carcinoma and normal thyroid
tissue. Mol Carcinog. 45:613–626. 2006. View Article : Google Scholar : PubMed/NCBI
|
|
6
|
Stulik J, Osterreicher J, Koupilová K,
Knízek J, Bures J, Jandík P, Langr F, Dedic K, Schäfer BW and
Heizmann CW: Differential expression of the Ca2+ binding
S100A6 protein in normal, preneoplastic and neoplastic colon
mucosa. Eur J Cancer. 36:1050–1059. 2000. View Article : Google Scholar : PubMed/NCBI
|
|
7
|
Komatsu K, Kobune-Fujiwara Y, Andoh A,
Ishiguro S, Hunai H, Suzuki N, Kameyama M, Murata K, Miyoshi J,
Akedo H, et al: Increased expression of S100A6 at the invading
fronts of the primary lesion and liver metastasis in patients with
colorectal adenocarcinoma. Br J Cancer. 83:769–774. 2000.
View Article : Google Scholar : PubMed/NCBI
|
|
8
|
Weterman MA, Stoopen GM, van Muijen GN,
Kuznicki J, Ruiter DJ and Bloemers HP: Expression of calcyclin in
human melanoma cell lines correlates with metastatic behavior in
nude mice. Cancer Res. 52:1291–1296. 1992.PubMed/NCBI
|
|
9
|
Pedrocchi M, Schafer BW, Mueller H,
Eppenberger U and Heizmann CW: Expression of Ca
(2+)-binding proteins of the S100 family in malignant
human breast-cancer cell lines and biopsy samples. Int J Cancer.
57:684–690. 1994. View Article : Google Scholar : PubMed/NCBI
|
|
10
|
Rehman I, Cross SS, Catto JW, Leiblich A,
Mukherjee A, Azzouzi AR, Leung HY and Hamdy FC: Promoter
hyper-methylation of calcium binding proteins S100A6 and S100A2 in
human prostate cancer. Prostate. 65:322–330. 2005. View Article : Google Scholar : PubMed/NCBI
|
|
11
|
Rehman I, Cross SS, Azzouzi AR, Catto JW,
Deloulme JC, Larre S, Champigneuille J, Fromont G, Cussenot O and
Hamdy FC: S100A6 (Calcyclin) is a prostate basal cell marker absent
in prostate cancer and its precursors. Br J Cancer. 91:739–744.
2004.PubMed/NCBI
|
|
12
|
Kim J, Kim J, Yoon S, Joo J, Lee Y, Lee K,
Chung J and Choe I: S100A6 protein as a marker for differential
diagnosis of cholangiocarcinoma from hepatocellular carcinoma.
Hepatol Res. 23:2742002. View Article : Google Scholar : PubMed/NCBI
|
|
13
|
Lyu X, Li H, Ma X, Li X, Gao Y, Ni D, Shen
D, Gu L, Wang B, Zhang Y and Zhang X: High-level S100A6 promotes
metastasis and predicts the outcome of T1-T2 stage in clear cell
renal cell carcinoma. Cell Biochem Biophys. 71:279–290. 2015.
View Article : Google Scholar : PubMed/NCBI
|
|
14
|
Emberley ED, Murphy LC and Watson PH: S100
proteins and their influence on pro-survival pathways in cancer.
Biochem Cell Biol. 82:508–515. 2004. View
Article : Google Scholar : PubMed/NCBI
|
|
15
|
Golitsina NL, Kordowska J, Wang CL and
Lehrer SS: Ca2+-dependent binding of calcyclin to muscle
tropomyosin. Biochem Biophys Res Commun. 220:360–365. 1996.
View Article : Google Scholar : PubMed/NCBI
|
|
16
|
Mani RS, McCubbin WD and Kay CM:
Calcium-dependent regulation of caldesmon by an 11-kDa smooth
muscle calcium-binding protein, caltropin. Biochemistry.
31:11896–11901. 1992. View Article : Google Scholar : PubMed/NCBI
|
|
17
|
Bao L, Odell AF, Stephen SL, Wheatcroft
SB, Walker JH and Ponnambalam S: The S100A6 calcium-binding protein
regulates endothelial cell-cycle progression and senescence. FEBS
J. 279:4576–4588. 2012. View Article : Google Scholar : PubMed/NCBI
|
|
18
|
Joo JH, Kim JW, Lee Y, Yoon SY, Kim JH,
Paik SG and Choe IS: Involvement of NF-kappaB in the regulation of
S100A6 gene expression in human hepatoblastoma cell line HepG2.
Biochem Biophys Res Commun. 307:274–280. 2003. View Article : Google Scholar : PubMed/NCBI
|
|
19
|
Zheng M, Barrera LO, Ren B and Wu YN:
ChIP-chip: Data, model, and analysis. Biometrics. 63:787–796. 2007.
View Article : Google Scholar : PubMed/NCBI
|
|
20
|
Vimalachandran D, Greenhalf W, Thompson C,
Lüttges J, Prime W, Campbell F, Dodson A, Watson R,
Crnogorac-Jurcevic T, Lemoine N, et al: High nuclear S100A6
(Calcyclin) is significantly associated with poor survival in
pancreatic cancer patients. Cancer Res. 65:3218–3225.
2005.PubMed/NCBI
|
|
21
|
Livak KJ and Schmittgen TD: Analysis of
relative gene expression data using real-time quantitative PCR and
the 2(−Delta Delta C(T)) Method. Methods. 25:402–408. 2001.
View Article : Google Scholar : PubMed/NCBI
|
|
22
|
Wu H, Weng D, Weng D, Xing H, Song X, Zhu
T, Xia X, Weng Y, Xu G, Meng L, et al: Reversal of the malignant
phenotype of ovarian cancer A2780 cells through transfection with
wild-type PTEN gene. Cancer Lett. 271:205–214. 2008. View Article : Google Scholar : PubMed/NCBI
|
|
23
|
Leśniak W, Słomnicki ŁP and Filipek A:
S100A6 - new facts and features. Biochem Biophys Res Commun.
390:1087–1092. 2009. View Article : Google Scholar : PubMed/NCBI
|
|
24
|
Itoh Y, Joh T, Tanida S, Sasaki M, Kataoka
H, Itoh K, Oshima T, Ogasawara N, Togawa S, Wada T, et al: IL-8
promotes cell proliferation and migration through
metalloproteinase-cleavage proHB-EGF in human colon carcinoma
cells. Cytokine. 29:275–282. 2005.PubMed/NCBI
|
|
25
|
Lord JD, McIntosh BC, Greenberg PD and
Nelson BH: The IL-2 receptor promotes lymphocyte proliferation and
induction of the c-myc, bcl-2, and bcl-x genes through the
trans-activation domain of Stat5. J Immunol. 164:2533–2541. 2000.
View Article : Google Scholar : PubMed/NCBI
|
|
26
|
Henriksson JT, Coursey TG, Corry DB, De
Paiva CS and Pflugfelder SC: IL-13 stimulates proliferation and
expression of mucin and immunomodulatory genes in cultured
conjunctival goblet cells. Invest Ophthalmol Vis Sci. 56:4186–4197.
2015. View Article : Google Scholar : PubMed/NCBI
|
|
27
|
Liu D, Liu C, Wang X, Ingvarsson S and
Chen H: MicroRNA-451 suppresses tumor cell growth by
down-regulating IL6R gene expression. Cancer Epidemiol. 38:85–92.
2014. View Article : Google Scholar : PubMed/NCBI
|
|
28
|
Sherr CJ: The Pezcoller lecture: Cancer
cell cycles revisited. Cancer Res. 60:3689–3695. 2000.PubMed/NCBI
|
|
29
|
Brinkkoetter PT, Olivier P, Wu JS,
Henderson S, Krofft RD, Pippin JW, Hockenbery D, Roberts JM and
Shankland SJ: Cyclin I activates Cdk5 and regulates expression of
Bcl-2 and Bcl-XL in postmitotic mouse cells. J Clin Invest.
119:3089–3101. 2009. View
Article : Google Scholar : PubMed/NCBI
|
|
30
|
Padmanabhan V, Callas P, Philips G,
Trainer TD and Beatty BG: DNA replication regulation protein Mcm7
as a marker of proliferation in prostate cancer. J Clin Pathol.
57:1057–1062. 2004. View Article : Google Scholar : PubMed/NCBI
|
|
31
|
Bouchard C, Staller P and Eilers M:
Control of cell proliferation by Myc. Trends Cell Biol. 8:202–206.
1998. View Article : Google Scholar : PubMed/NCBI
|
|
32
|
Słomnicki ŁP, Nawrot B and Leśniak W:
S100A6 binds p53 and affects its activity. Int J Biochem Cell Biol.
41:784–790. 2009. View Article : Google Scholar : PubMed/NCBI
|
|
33
|
Innocente SA and Lee JM: p53 is a NF-Y-
and p21-independent, Sp1-dependent repressor of cyclin B1
transcription. FEBS Lett. 579:1001–1007. 2005. View Article : Google Scholar : PubMed/NCBI
|