Introduction
Thyroid cancer is one of the most common types of
malignancy of the endocrine system (1). Anaplastic thyroid carcinoma (ATC), one
of the four types of thyroid carcinoma, is an uncommon but
aggressive malignancy in older adults, with a morbidity rate of
1.0–7.5%, however, it accounts for 14–39% of thyroid
carcinoma-associated mortality and the mean survival duration of
ATC is usually <6 months from diagnosis (2). Although certain novel treatment methods,
including surgery, genetic therapy and differentiation therapy,
provide possibilities for the treatment of ATC (3), there is no effective systemic therapy
for ATC. Therefore, it is important to examine the molecular
mechanisms of ATC and identify several treatment methods for
patients with a diagnosis of ATC.
The etiology of ATC remains to be fully elucidated.
Previous studies have demonstrated that ionizing radiation,
abnormal iodine intake, genetic factors and autoimmune disease are
the primary factors contributing to the progression of ATC
(4). Passaro et al (5) reported that ionizing radiation enhances
the cell death of oncolytic adenovirus dl922-947 in ATC. Increased
iodine intake contributes to a lower incidence of ATC (6), and it has been reported that forkhead
box o3a enhances the proliferation of ATC cells via regulating the
transcription factor, cyclin A1 (7).
In addition, several pathways involved in the progression of ATC
have been identified, including the Notch1 signaling pathway,
phosphoinositide 3-kinase/Akt signaling pathway and the epidermal
growth factor receptor/extracellular signal-regulated kinase
pathway (8–10).
With developments in biology, several studies have
focussed on to the mechanism of ATC. Consequently, several
biomarkers have been identified for its treatment. For example,
paired-box gene 8 may be a useful biomarker for ATC (11). In a study by Kim et al
(12) L1 cell adhesion molecule was
found to be overexpressed in patients with ATC and it may be an
important therapeutic target for ATC treatment. In addition, the
mutation of TP53 and expression of SRY-box 2 are associated with
the progression from papillary thyroid carcinoma (PTC) to ATC
(13). However, the mechanism
underlying ATC remains to be fully elucidated.
Microarray analysis is an effective approach to
monitor global alterations of gene expression and identify the
genes important to ATC. Several studies have been performed using
the mRNA expression profile, GSE33630, of thyroid carcinoma. For
example, Hébrant et al (14)
found that ATC and PTC overlapped. He et al (15) analyzed 13 genes and one pathway
associated with ATC. In addition, Xu et al found nine genes
and one miscRNA, which were identified as candidates for the
progression of thyroid cancer (16).
However, the latent pathway interactions of ATC remain to be fully
elucidated. Thus, using the same samples, the present study aimed
to analyze the differentially expressed genes (DEGs) and
significant pathways of ATC. Comprehensive bioinformatics analysis
was used to enrich the significant functions and pathways of the
DEGs to provide detailed insight into the biological mechanisms of
ATC. This approach was used to predict the hub genes most likely
associated with ATC. The present study aimed to provide a basis for
further investigation of the mechanism of ATC.
Materials and methods
Data resources and data
preprocessing
The GSE33630 gene expression profile data was
downloaded from the Gene Expression Omnibus database (https://www.ncbi.nlm.nih.gov/geo/) from the
National Center for Biotechnology Information based on the platform
of the GPL570 Affymetrix Human Genome U133 Plus 2.0 array. The
present study included a total of 105 samples, which comprised 11
ATC samples, 49 PTC samples and 45 normal thyroid (NT) samples. The
11 ATC samples and 45 NT samples were selected for analysis in the
present study.
The CEL files were transformed into the expression
value matrix using the Affy package in R (17), and the probe information was then
transformed into the gene name using Bioconductor in R (18). If one gene had more than one probe,
the mean expression value of this gene was selected.
DEG screening and enrichment
analysis
The Limma package (19) in R language was used to select the
DEGs in the ATC samples, compared with the NT samples. |log2
fold-change|>2 and adjusted P<0.05 were selected as the
threshold values.
Gene Ontology (GO) analysis has become a commonly
used approach for functional investigations of large-scale genomic
or transcription data (20). The
Kyoto Encyclopedia of Genes and Genomes (KEGG) pathway database
contains information regarding how molecules or genes are
networked, which provides complementary information to the majority
of the existing molecular biology databases containing information
on individual genes (21). The
Database for Annotation, Visualization and Integrated Discovery
(DAVID) bioinformatics resources consist of an integrated
biological knowledge base and analytic tools aimed at
systematically extracting biological meaning from large gene or
protein lists (22). In the present
study, the GO functions and pathways of the selected DEGs were
enriched using DAVID in the GO (http://www.geneontology.org) and KEGG (http://www.genome.ad.jp/kegg/) databases with the
adjusted P-value (q-value) of <0.05.
PPI interaction network construction
and selection of significant modules
The PPI interactive pairs of the screened DEGs were
selected using the STRING online database (http://string-db.org/) (23). The DEG interactive pairs with a
combined score of >0.8 were selected for the PPI network
construction. Cytoscape (http://www.cytoscape.org/) was used to construct the
PPI interaction network (24). The
MCODE plugin was used to select the significant modules associated
with ATC from the PPI interaction network (25). In addition, the GO terms and pathways
of the DEGs in significant modules were enriched using DAVID
(22) with P<0.05.
Latent pathway identification analysis
(LPIA)
LPIA, developed by Pham et al (26), is a method for identifying the
interactions of pathways associated with DEGs. A significant
interaction represents a correlation between pathways and disease.
The LPIA process was as follows: i) GO biological process (BP)
terms (G) and KEGG pathways (P) of the DEGs were calculated using
clusterProfiler (27) in R. ii) A
bipartite network was constructed between G and P, one edge of the
node was G and the other edge of node was P, with an edge
representing one gene involved in G and P, the weight of the edge
was determined by the relative overlap of G and P, which was
calculated using Jaccard similarity coefficient and the mean
expression value for the expression of each DEG. The formula to
determine the weight was as follows:
WGP=|G∩PG∪P|×med{DEx:x∈G∩P}
where P represents the pathway, G represents the GO
BP term of each gene, DE represents the expression value of the
DEG,
|G∩PG∪P| is
the Jaccard similarity coefficient of G and P and G∪P is the total DEGs associated with G
and P. iii) Based on the bipartite network, the pathways connected
with at least one BP term were selected to construct the pathway
network. The formula used for the weight of the edge was as
follows:
Aij=∑k=1GwGkPi×wGkPj;
iv) The random walk method (28) was used to calculate the interaction of
each pathway pair, and the significant interactions were selected.
The transfer matrix of the random walk method was as follows:
Tij=Aij∑j=1NpAij.
Np represents the total pathways
in the network, Tij represents the probability of
one pathway between Pi and Pj.
The process was repeated using the bootstrap method
(29) steps 1–4, following which the
significant P-value of the interaction was obtained.
Results
Data preprocessing and screenong of
DEGs
A total of 19,944 expression probes were obtained
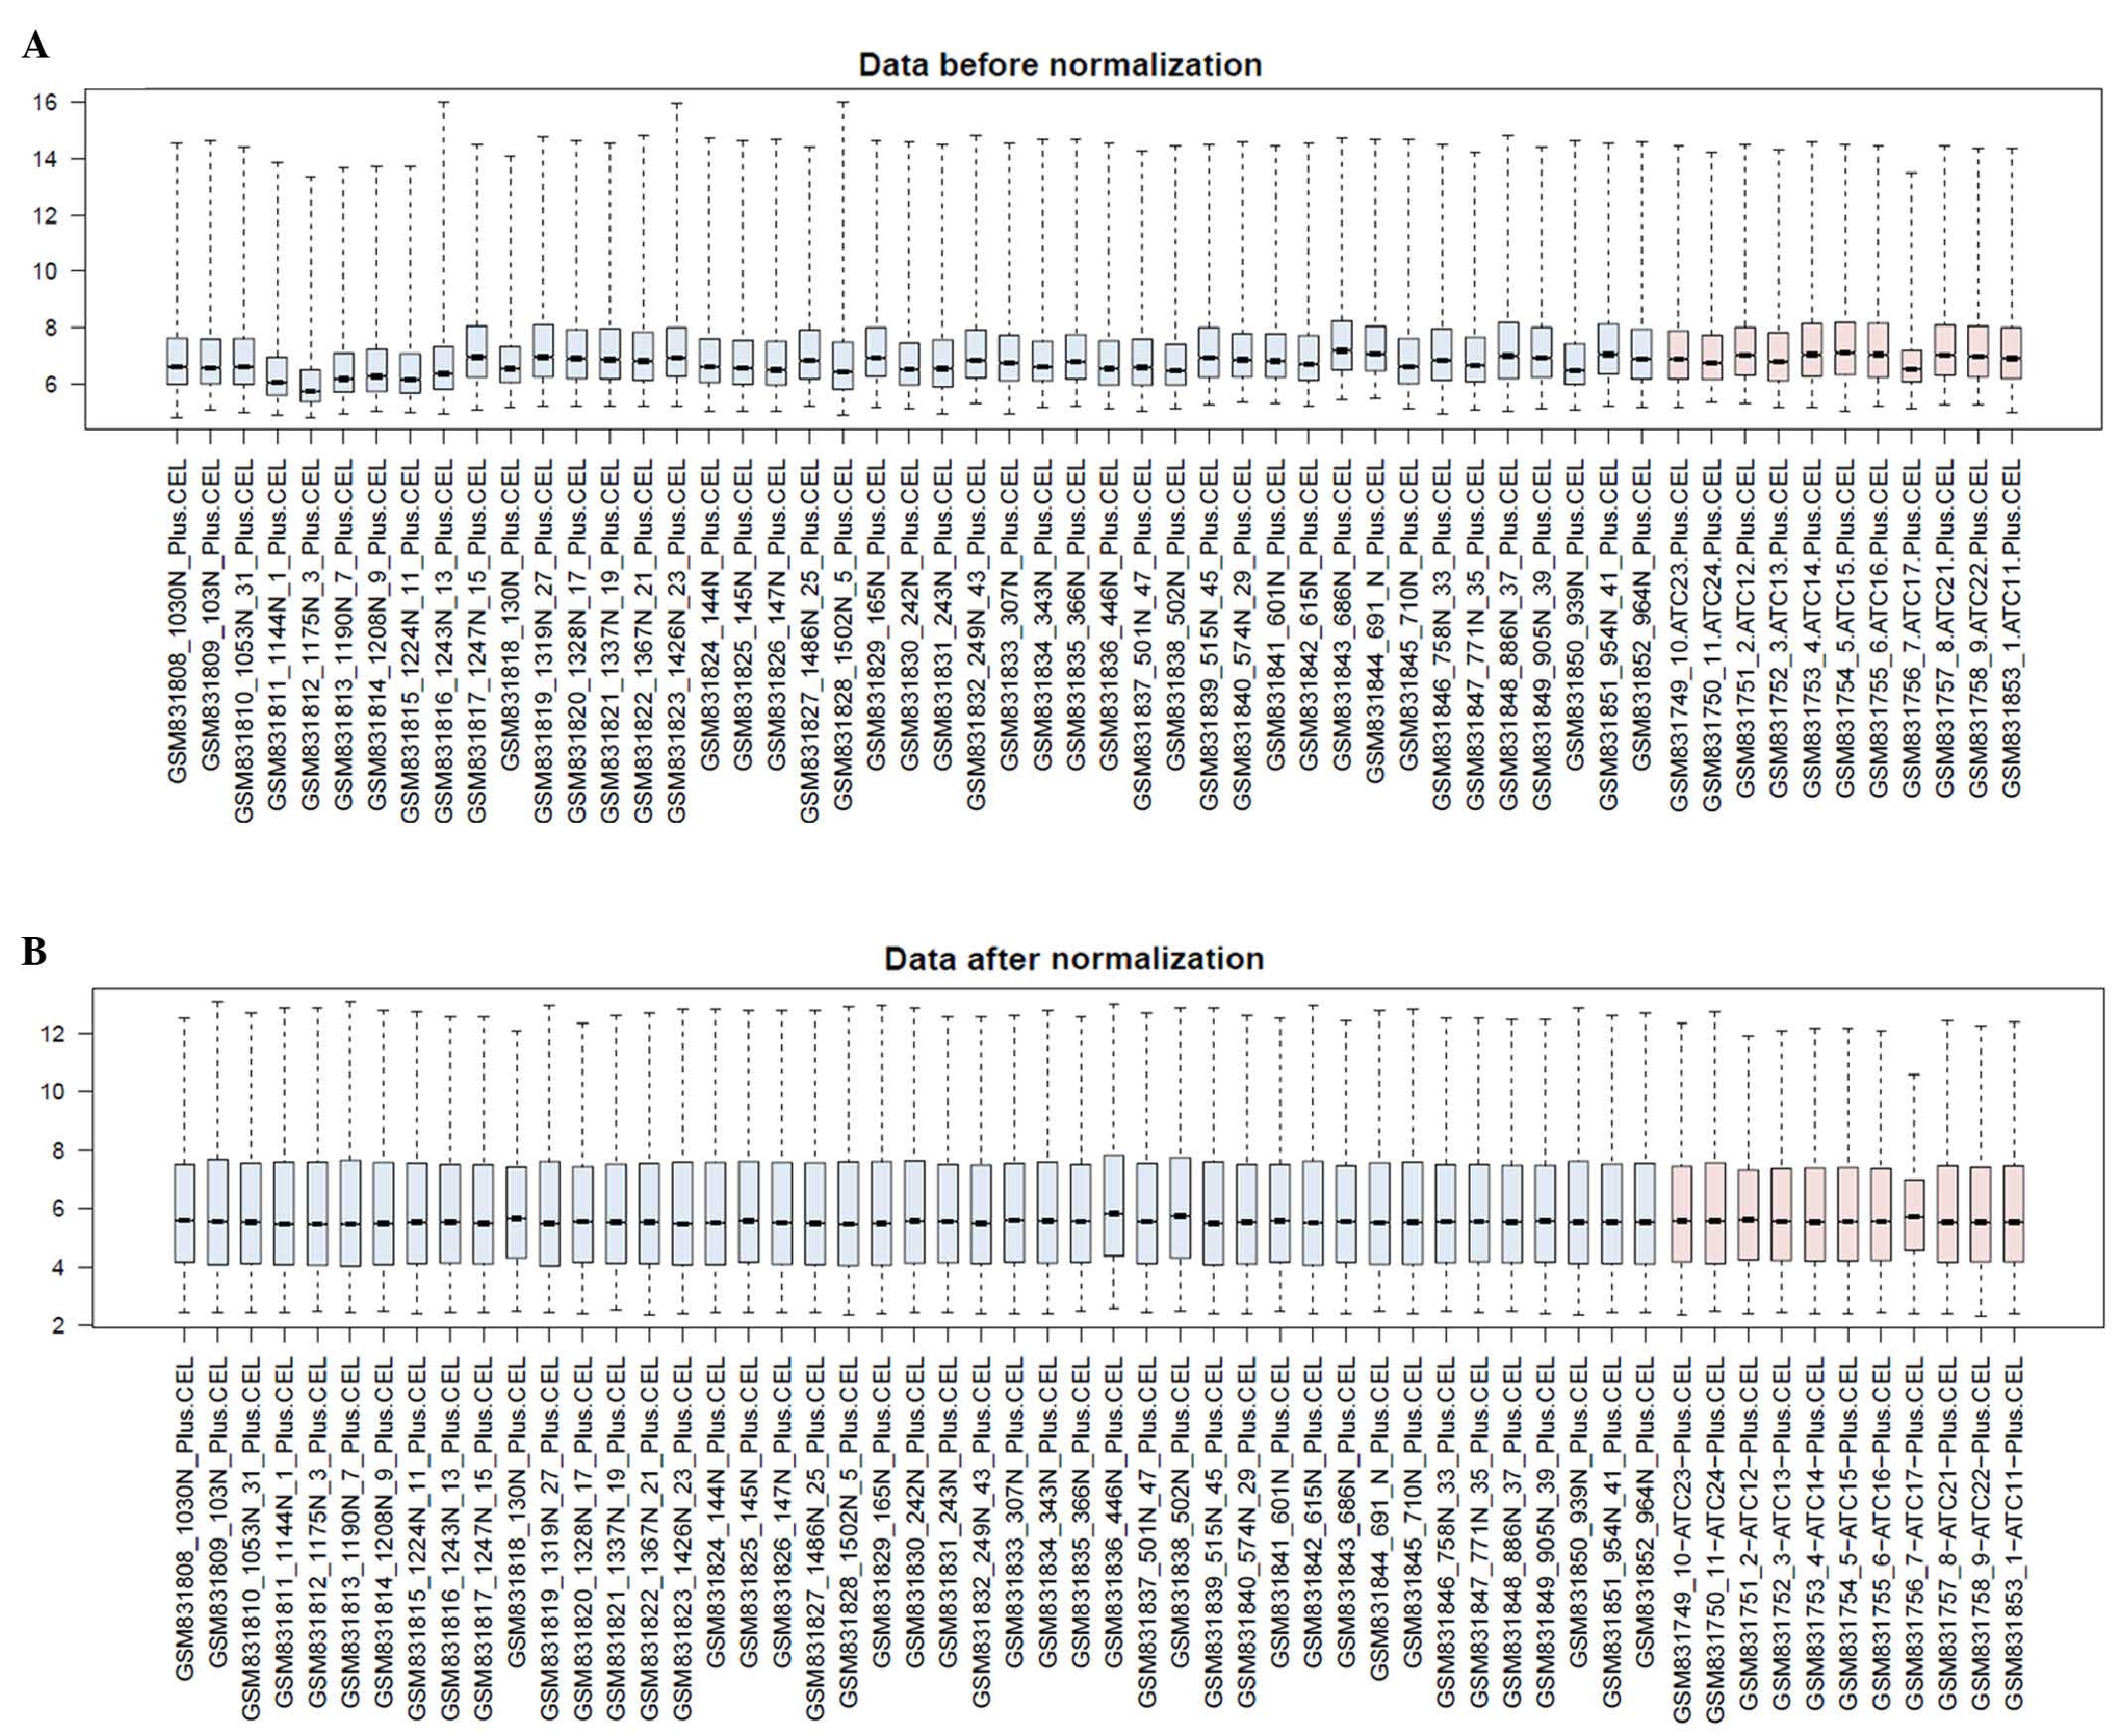
from the GSE33630 gene expression profile. The preprocessed data is
shown in Fig. 1A and B. The median
values indicated that the data were well normalized.
In addition, 665 genes in the ATC samples, which
were differentially expressed compared with the NT samples were
screened, which comprised 380 upregulated and 285 downregulated
DEGs.
GO functions and pathways enrichment
analysis of DEGs
The GO terms and pathways of all the selected DEGs
were enriched using clusterProfiler with P<0.05 (Table I). The enriched GO terms for the
upregulated DEGs in ATC included cellular processes, membrane part
and protein binding, whereas single-organism cellular process,
extracellular region part and microtubule binding were enriched
terms for the downregulated DEGs. In addition, the upregulated DEGs
were involved in glycerophospholipid metabolism and metabolic
pathways (Table IA), whereas the
downregulated DEGs were involved in cytokine-cytokine receptor
interaction and the complement and coagulation cascades pathway
(Table IB).
 | Table I.Top five enriched GO terms and
pathways of the DEGs. |
Table I.
Top five enriched GO terms and
pathways of the DEGs.
| ID | Term | Description | Count | P-value |
|---|
|
|---|
| A, Top five GO
terms and pathways of the upregulated DEGs in ACT |
|---|
| BP | GO:0008150 | Biological
process | 264 | 4.79E-21 |
| BP | GO:0044707 |
Single-multicellular organism process | 126 | 1.84E-06 |
| BP | GO:0044699 | Single-organism
process | 203 | 1.84E-06 |
| BP | GO:0009987 | Cellular
process | 230 | 1.84E-06 |
| BP | GO:0032501 | Multicellular
organismal process | 127 | 5.99E-06 |
| CC | GO:0005575 | Cellular
component | 284 | 2.26E-06 |
| CC | GO:0016020 | Membrane | 162 | 9.97E-05 |
| CC | GO:0044425 | Membrane part | 131 | 0.00042334 |
| CC | GO:0044459 | Plasma membrane
part | 54 | 0.00042334 |
| CC | GO:0005615 | Extracellular
space | 30 | 0.00042334 |
| MF | GO:0003674 | Molecular
function | 247 | 9.38E-17 |
| MF | GO:0005515 | Protein
binding | 139 | 7.67E-05 |
| MF | GO:0005488 | Binding | 195 | 0.000128045 |
| MF | GO:0016491 | Oxidoreductase
activity | 22 | 0.004818428 |
| MF | GO:0008509 | Anion transmembrane
transporter activity | 11 | 0.00600053 |
| KEGG | hsa00564 | Glycerophospholipid
metabolism | 6 | 0.005474129 |
| KEGG | hsa01100 | Metabolic
pathways | 30 | 0.009706045 |
|
| B, Top five GO
terms and pathways of the downregulated DEGs in ACT |
|
| BP | GO:0044763 | Single-organism
cellular process | 213 | 1.08E-26 |
| BP | GO:0044699 | Single-organism
process | 222 | 4.03E-26 |
| BP | GO:0000278 | Mitotic cell
cycle | 55 | 7.10E-22 |
| BP | GO:0006950 | Response to
stress | 108 | 2.27E-21 |
| BP | GO:0008150 | Biological
process | 242 | 5.54E-20 |
| CC | GO:0044421 | Extracellular
region part | 69 | 8.67E-25 |
| CC | GO:0005576 | Extracellular
region | 88 | 2.08E-20 |
| CC | GO:0031012 | Extracellular
matrix | 37 | 2.79E-18 |
| CC | GO:0005615 | Extracellular
space | 50 | 1.69E-17 |
| CC | GO:0005578 | Proteinaceous
extracellular matrix | 33 | 5.96E-17 |
| MF | GO:0003674 | Molecular
function | 234 | 4.95E-16 |
| MF | GO:0005515 | Protein
binding | 161 | 5.84E-16 |
| MF | GO:0005488 | Binding | 203 | 4.91E-12 |
| MF | GO:0008017 | Microtubule
binding | 16 | 1.28E-09 |
| MF | GO:0015631 | Tubulin
binding | 17 | 1.45E-08 |
| KEGG | hsa04512 | Extracellular
matrix-receptor interaction | 14 | 7.14E-10 |
| KEGG | hsa05150 | Staphylococcus
aureus infection |
8 | 8.10E-06 |
| KEGG | hsa04510 | Focal adhesion | 14 | 1.24E-05 |
| KEGG | hsa04060 | Cytokine-cytokine
receptor interaction | 16 | 1.44E-05 |
| KEGG | hsa04610 | Complement and
coagulation cascades |
8 | 1.56E-05 |
PPI interaction network and
significant modules
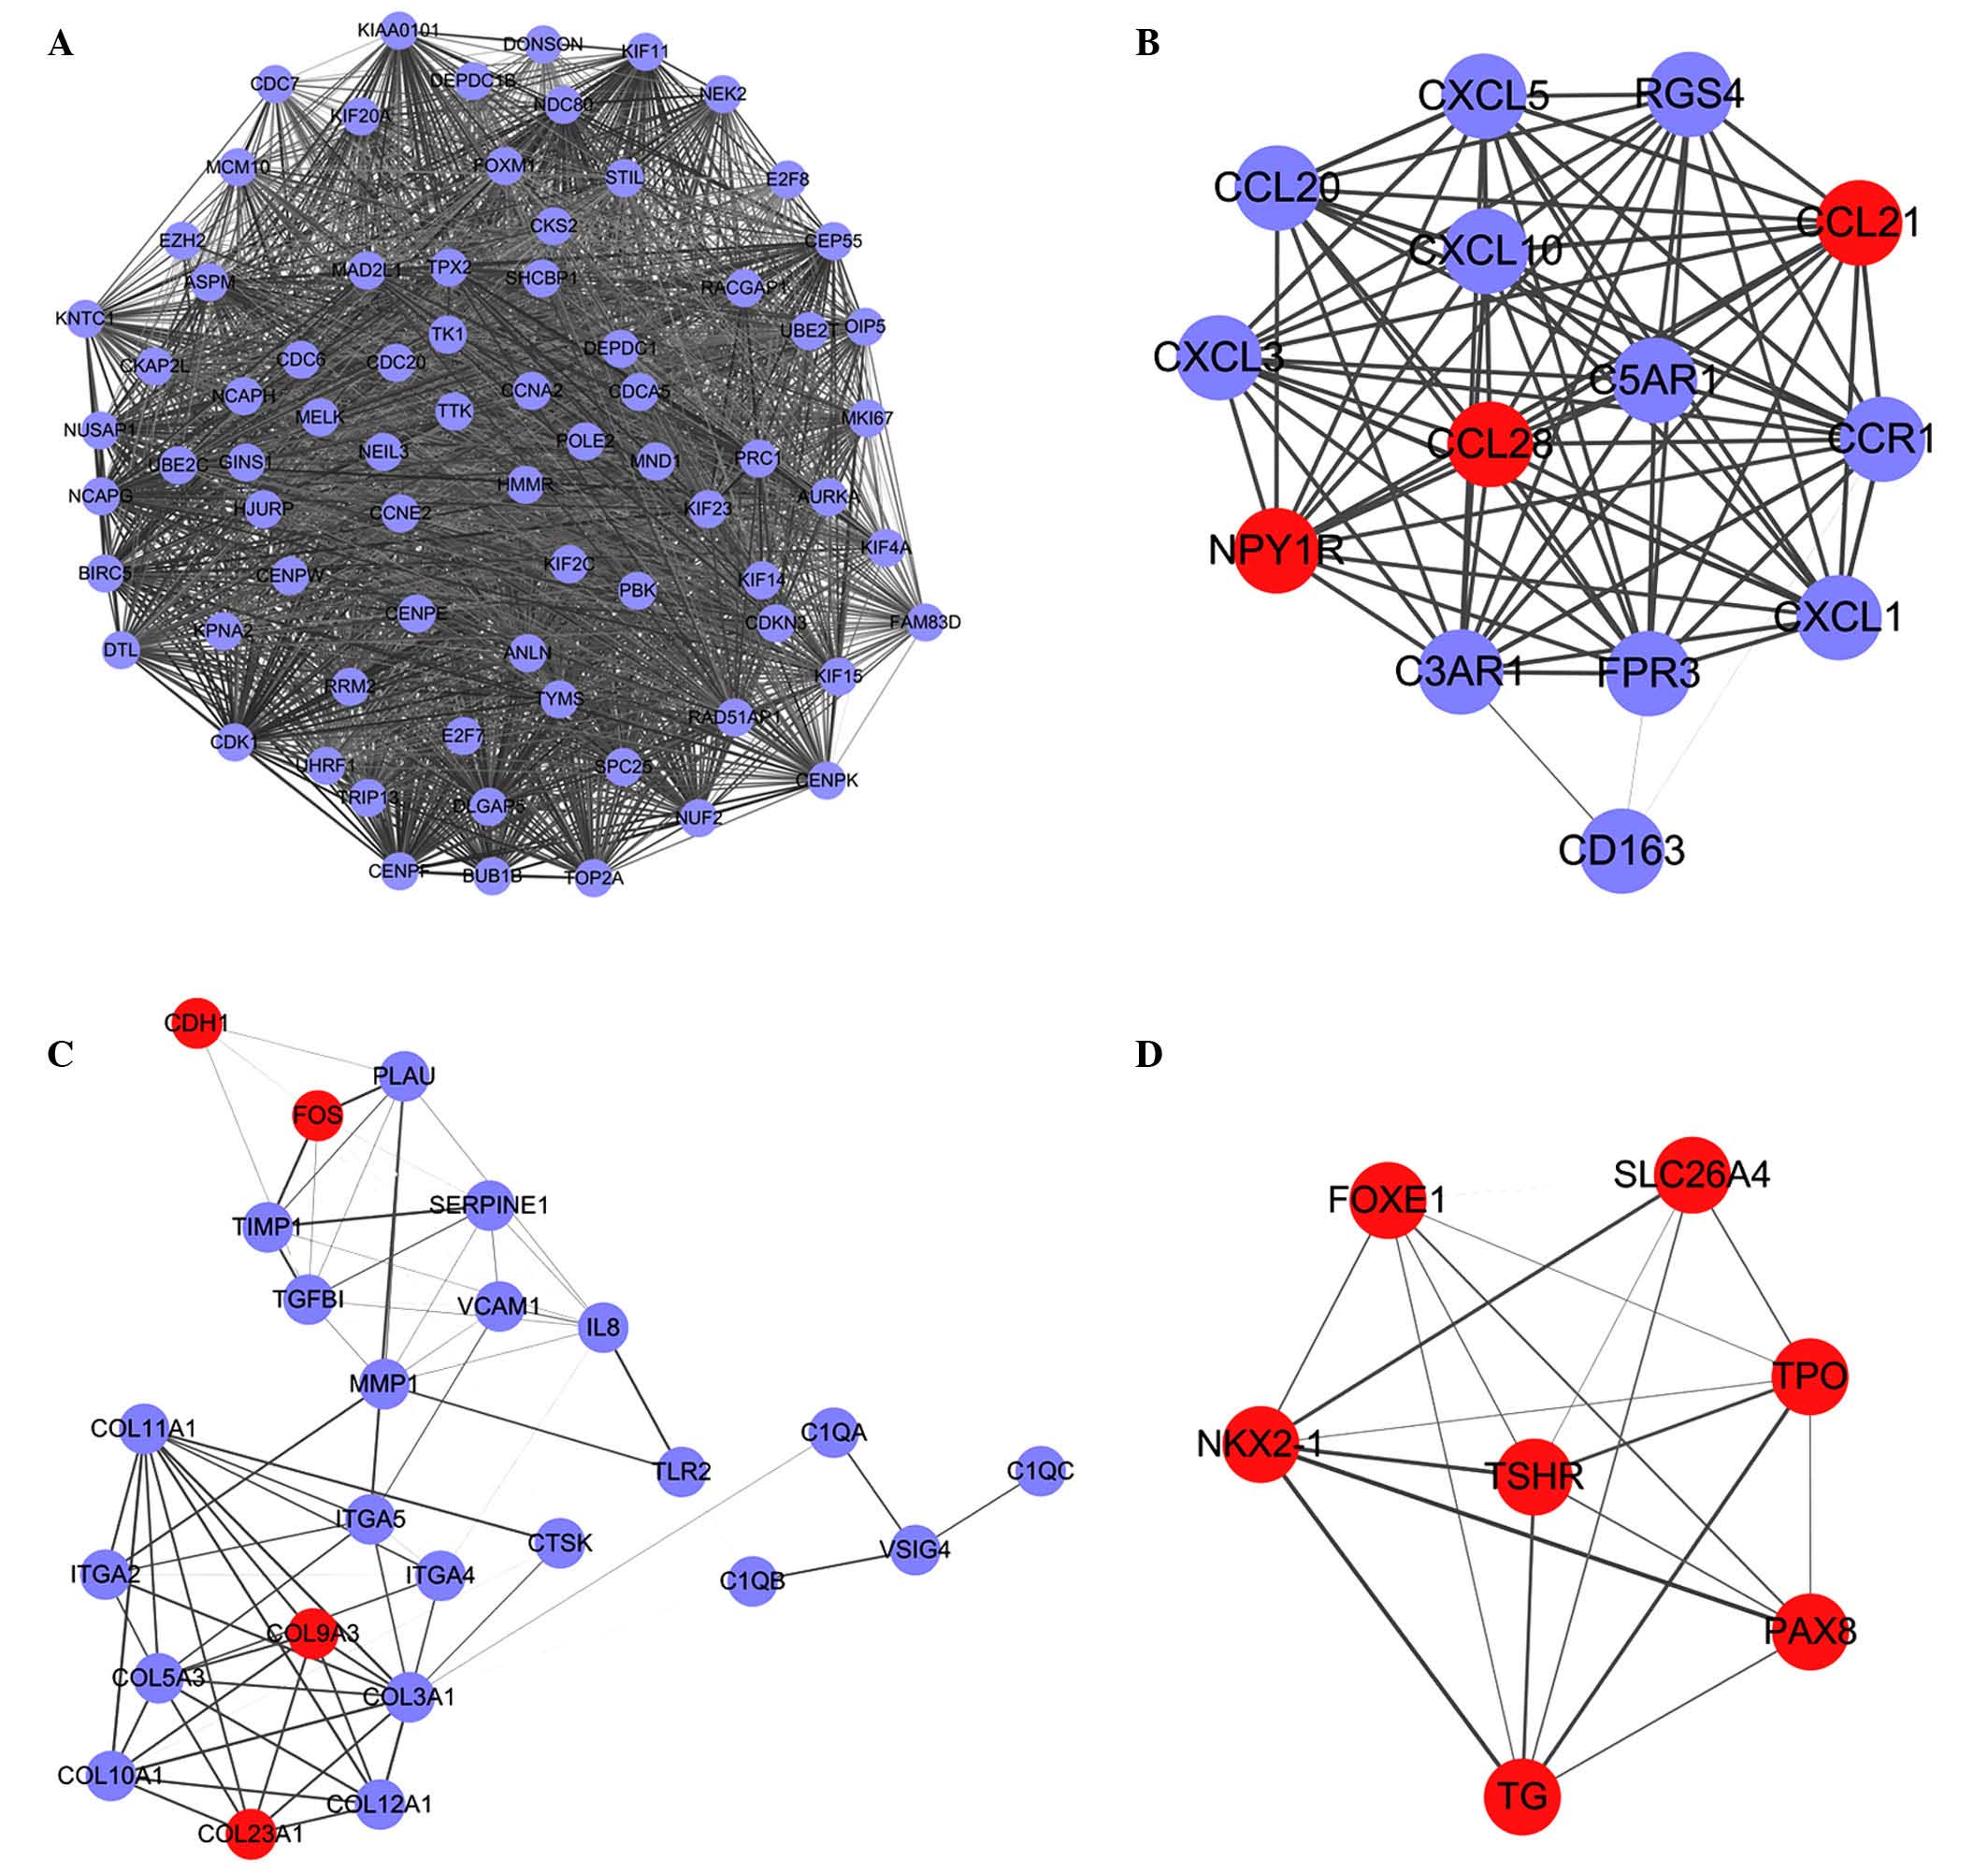
A PPI interaction network of the DEGs was
constructed using STRING. A total of four significant modules with
the top five node degree were selected (Fig. 2A-D). Functional enrichment analysis
for the four modules found that no GO term or pathway was enriched
by genes in module D. The enriched GO terms and pathways of the
DEGs in these significant modules are shown in Table II.
| Table II.Top five enriched GO terms and
pathways of differentially expressed genes in the significant
modules. |
Table II.
Top five enriched GO terms and
pathways of differentially expressed genes in the significant
modules.
| ID | Term | Description | Count | P-value |
|---|
|
|---|
| A, Top five
enriched GO terms and pathways of DEGs in module A |
|---|
| BP | GO:0007049 | Cell cycle | 57 | 5.95E-49 |
| BP | GO:0000278 | Mitotic cell
cycle | 49 | 5.95E-49 |
| BP | GO:0022402 | Cell cycle
process | 52 | 2.58E-47 |
| BP | GO:0051301 | Cell division | 36 | 7.19E-37 |
| BP | GO:0000280 | Nuclear
division | 32 | 8.81E-36 |
| CC | GO:0005819 | Spindle | 23 | 2.20E-26 |
| CC | GO:0015630 | Microtubule
cytoskeleton | 31 | 5.69E-23 |
| CC | GO:0000793 | Condensed
chromosome | 18 | 3.83E-22 |
| CC | GO:0000775 | Chromosome,
centromeric region | 16 | 8.06E-20 |
| CC | GO:0000777 | Condensed
chromosome kinetochore | 13 | 7.98E-19 |
| MF | GO:0005515 | Protein
binding | 56 | 6.33E-13 |
| MF | GO:0008017 | Microtubule
binding | 12 | 6.33E-13 |
| MF | GO:0015631 | Tubulin
binding | 12 | 1.81E-11 |
| MF | GO:0003777 | Microtubule motor
activity | 8 | 4.83E-10 |
| MF | GO:0005524 | ATP binding | 23 | 6.79E-10 |
| KEGG | hsa04110 | Cell cycle | 8 |
8.20114825913878e-10 |
|
| B, Top five
enriched GO terms and pathways of DEGs in module B |
|
| BP | GO:0006935 | Chemotaxis | 11 | 6.44E-14 |
| BP | GO:0042330 | Taxis | 11 | 6.44E-14 |
| BP | GO:0006954 | Inflammatory
response | 9 | 4.30E-11 |
| BP | GO:0040011 | Locomotion | 11 | 1.21E-10 |
| BP | GO:0009605 | Response to
external stimulus | 11 | 1.54E-10 |
| CC | GO:0005615 | Extracellular
space | 7 | 9.36E-06 |
| CC | GO:0044421 | Extracellular
region part | 7 | 3.43E-05 |
| CC | GO:0005576 | Extracellular
region | 8 | 0.000169765 |
| CC | GO:0044459 | Plasma membrane
part | 6 | 0.004168711 |
| CC | GO:0005886 | Plasma
membrane | 8 | 0.012325713 |
| MF | GO:0008009 | Chemokine
activity | 7 | 3.55E-15 |
| MF | GO:0042379 | Chemokine receptor
binding | 7 | 5.71E-15 |
| MF | GO:0001664 | G-protein coupled
receptor binding | 7 | 3.54E-11 |
| MF | GO:0005125 | Cytokine
activity | 7 | 4.17E-11 |
| MF | GO:0005126 | Cytokine receptor
binding | 7 | 4.20E-11 |
| KEGG | hsa04062 | Chemokine signaling
pathway | 8 | 7.14E-10 |
| KEGG | hsa04060 | Cytokine-cytokine
receptor interaction | 8 | 8.10E-06 |
|
| C, Top five
enriched GO terms and pathways of DEGs in module C |
|
| BP | GO:0030198 | Extracellular
matrix organization | 13 | 1.57E-16 |
| BP | GO:0043062 | Extracellular
structure organization | 13 | 1.57E-16 |
| BP | GO:0022617 | Extracellular
matrix disassembly | 9 | 5.02E-15 |
| BP | GO:0030574 | Collagen catabolic
process | 8 | 1.12E-13 |
| BP | GO:0044243 | Multicellular
organismal catabolic process | 8 | 1.93E-13 |
| CC | GO:0044421 | Extracellular
region part | 18 | 4.69E-16 |
| CC | GO:0031012 | Extracellular
matrix | 13 | 8.60E-15 |
| CC | GO:0005581 | Collagen | 9 | 8.60E-15 |
| CC | GO:0005578 | Proteinaceous
extracellular matrix | 12 | 4.04E-14 |
| CC | GO:0044420 | Extracellular
matrix part | 10 | 4.80E-14 |
| MF | GO:0005515 | Protein
binding | 17 | 0.002325685 |
| KEGG | hsa05142 | Chagas disease
(American trypanosomiasis) | 7 |
1.8408112078959e-08 |
Interaction analysis between
pathways
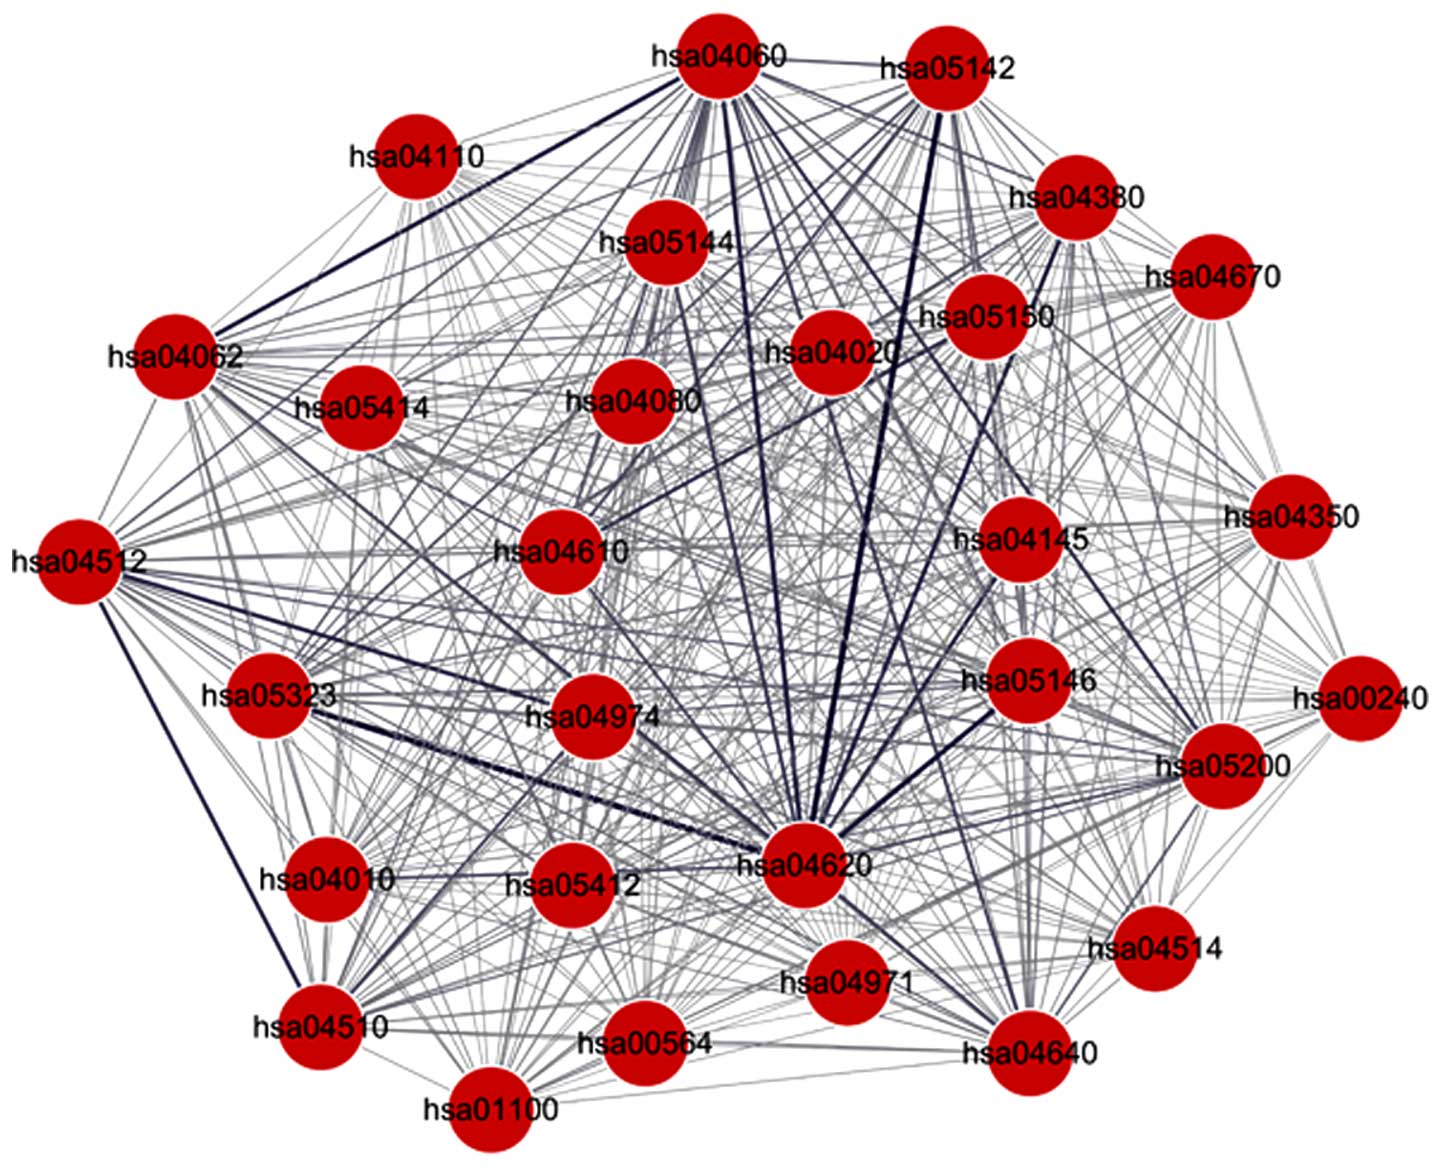
A total of 406 pathway pairs associated with the
DEGs were selected, which were involved in 29 pathways (Fig. 3; Table
III). Edges with a high weight indicated a higher level of
interaction between two pathways. The interactive pathway pairs
with the top five weights are shown in Table IV. hsa04620 interacted with several
pathways with high weights, including hsa05323, hsa05142 and
hsa05146, indicating hsa04620 was an important pathway. hsa04060
was also identified as an important pathway, which interacted with
several other pathways. As shown in Table IV, FBJ murine osteosarcoma viral
oncogene homolog (FOS) was the DEG present in hsa04620, the
Toll-like receptor (TLR) signaling pathway and COL5A1 was the DEG
present in hsa04512 (ECM-receptor interaction). Certain cytokines,
including CXCL12, CXCL3, interleukin (IL)8, CXCL10 and CCL28, were
the genes involved in hsa04060 (cytokine-cytokine receptor
interaction pathway).
| Table III.29 enriched significant pathways in
the latent pathway identification analysis network. |
Table III.
29 enriched significant pathways in
the latent pathway identification analysis network.
| Path ID | Description |
|---|
| hsa04512 | Estraceelular
matrix-receptor interaction |
| hsa04974 | Protein digestion
and absorption |
| hsa04060 | Cytokine-cytokine
receptor interaction |
| hsa05150 | Staphylococcus
aureus infection |
| hsa04610 | Complement and
coagulation cascades |
| hsa05146 | Amoebiasis |
| hsa05323 | Rheumatoid
arthritis |
| hsa04380 | Osteoclast
differentiation |
| hsa04062 | Chemokine signaling
pathway |
| hsa04620 | Toll-like receptor
signaling pathway |
| hsa04145 | Phagosome |
| hsa04640 | Hematopoietic cell
lineage |
| hsa04510 | Focal adhesion |
| hsa04670 | Leukocyte
transendothelial migration |
| hsa05144 | Malaria |
| hsa04350 | Transforming growth
factor-β signaling pathway |
| hsa05142 | Chagas disease
(American trypanosomiasis) |
| hsa04110 | Cell cycle |
| hsa04971 | Gastric acid
secretion |
| hsa05412 | Arrhythmogenic
right ventricular cardiomyopathy |
| hsa04514 | Cell adhesion
molecules |
| hsa00564 | Glycerophospholipid
metabolism |
| hsa05414 | Dilated
cardiomyopathy |
| hsa00240 | Pyrimidine
metabolism |
| hsa05200 | Pathways in
cancer |
| hsa01100 | Metabolic
pathways |
| hsa04020 | Calcium signaling
pathway |
| hsa04010 | Mitogen-activated
protein kinase signaling pathway |
| hsa04080 | Neuroactive
ligand-receptor interaction |
| Table IV.Interacting pairs of pathways with
top 10 weights. |
Table IV.
Interacting pairs of pathways with
top 10 weights.
| Pathway 1 and
description | Pathway 2 and
description | Weight | Co-genes |
|---|
| hsa05323: | hsa04620: | 0.492651941 | CTSKa/CTSOa/FOS/IL8a/TLR2a |
| Rheumatoid
arthritis | Toll-like receptor
signaling pathway |
|
|
| hsa05142: | hsa04620: | 0.464920784 | IL8a/TLR2a/FOS |
| Chagas disease
(American trypanosomiasis) | Toll-like receptor
signaling pathway |
| hsa05146: | hsa04620: | 0.37284676 | IL8a/TLR2a/CD14a |
| Amoebiasis | Toll-like receptor
signaling pathway |
|
|
| hsa04620 | hsa04060: | 0.351558647 | IL8a/CXCL10a |
| Toll-like receptor
signaling pathway | Cytokine-cytokine
receptor interaction |
|
|
| hsa04062: | hsa04060: | 0.33933744 | CCR1a/CXCL1a/CXCL3a/IL8a/ |
| Chemokine signaling
pathway | Cytokine-cytokine
receptor interaction |
| CXCL10a/CCL28/CCL8a/CCL13a/CCL18a/CCL21/CXCL5a |
| hsa04380: | hsa04620: | 0.327230722 | CTSKa/FOS |
| Osteoclast
differentiation | Toll-like receptor
signaling pathway |
|
|
| hsa04974: | hsa04512: | 0.31737287 | COL5A1a/COL6A3a/COL11A1a/ |
| Protein digestion
and absorption | ECM-receptor
interaction |
| COL5A3a |
| hsa04512: | hsa04510: | 0.307854633 | COL5A1a/COL6A3a/COL11A1a/ |
| ECM-receptor
interaction | Focal adhesion |
| COMPa/TNCa/IBSPa/ITGA2a/ITGA4a/ITGA5a/LAMB3a/COL5A3a/RELN/SPP1a/THBS2a/ |
| hsa04145: | hsa04620: | 0.305699295 | TLR2a/CD14a |
| Phagosome | Toll-like receptor
signaling pathway |
|
|
| hsa05150: | hsa04610: | 0.272281647 |
CFD/C1QAa/C1QBa/C1QCa/ |
| Staphylococcus
aureus infection | Complement and
coagulation cascades |
| C3AR1a/C5AR1a |
Discussion
ATC is an aggressive malignancy of older adults with
a low morbidity rate, but a high mortality rate (2). Investigating the mechanism of ATC is
beneficial to the treatment and diagnosis of ATC. In the present
study, the key genes and significant pathways associated with ATC
were analyzed using ATC and NT samples from the GSE33630 gene
expression profile. Several key genes, including CXCL10, FOS,
COL5A1 and IL8, and the TLR signaling pathway, ECM-receptor
interaction and cytokine-cytokine receptor interaction pathway, in
which these key genes were involved, were identified using LPIA.
However, due to the different selection methods and samples, the
findings of the present study were different from those of previous
studies, which used the same gene expression profile (GSE33630) of
thyroid cancer. Hébrant et al (14) reported that a more marked EMT was the
qualitative difference between PTC and ATC, by examining 11 ATC and
48 PTC samples in GSE33630. He et al (15) found that the p53 signaling pathway,
which included 13 genes, was important for thyroid cancer using
gene set enrichment and meta-analysis. Xu et al (16) selected the BCL2, MRPS31, ID4, RASAL2,
DLG2, MY01B, ZBTB5, PRKCQ, PPP6C genes and an miscRNA on
considering NT, ATC and PTC together. Therefore, further
experimental validation is required.
Certain types of cancer are associated with
inflammatory or infectious diseases, and inflammatory factors are
associated with ATC. CXCL10 is a chemokine, which produces a ligand
for the receptor, CXCR3, and has a paralog of CXCL9 (30). Graves' disease is an autoimmune
thyroid disorder of thyroid cancer (31). The pathogenesis of autoimmune
thyroiditis and Graves' disease have been associated with the
secretion of CXCL10 stimulated by T helper 1 lymphocytes (32). In addition, Antonelli et al
(33) confirmed that human ATC cells
produce CXCL10 under the effect of certain cytokines. Thus,
autoimmune thyroiditis may contribute to the progression of ATC via
the secretion of CXCL10. By contrast, the TLR signaling pathway may
act as the novel target for the therapy of inflammatory-associated
disease (34), however, the role of
the TLR signaling pathway in ATC remains to be fully elucidated.
Mardente et al (35) reported
that the late inflammatory cytokine, high-mobility group box 1, can
signal danger to the immune system via the TLR in PTC cell growth.
The serum levels of CXCL10 are high in patients with Graves'
disease, and CXCL10 and CXCL9 are important in the recruitment of
thyroid cells (36). The data
obtained in the present study showed that the TLR signaling pathway
interacted with the cytokine-cytokine pathway, and the
downregulated expression of CXCL10 was involved in the two
pathways. This indicated that these two pathways were important in
the progression of ATC and that CXCL10 may act as a therapeutic
target of ATC.
The present study also showed that the
downregulation of IL-8 was important in module B and in the TLR
signaling pathway, suggesting it may be important to ATC. IL-8 is a
CXC chemokine, which has the antimicrobial functions, and can
activate the chemotaxis of neutrophils, T lymphocytes and
eosnophils (37). Several cytokines
have been found to be associated with thyroid cancer. The
transfection of IL-12 in the thyroid can potentially inhibit tumor
growth and may be a potential tumor vaccine (38). In a study by Kobawala et al
(39) the serum levels of IL-8 in
patients with ATC were higher, compared with those in healthy
individuals, and it may be a target for the diagnosis and
therapeutic treatment of ATC. The findings of the present study
indicated that the downregulation of IL-8 assisted in the evasion
of immune surveillance, leading to ATC. Therefore, IL-8 may be a
biomarker for the diagnosis of ATC.
FOS is a member of the FOS family, which acts as a
regulator of cell proliferation, differentiation and apoptotic cell
death (40). The role of FOS in ATC
remains to be fully elucidated, however, studies have demonstrated
that c-FOS can bind to the promoter, cellular FLICE-inhibitory
protein, to function in prostate cancer cells (41). c-FOS signaling is regulated by protein
kinase R in the promotion of cell proliferation in hepatocellular
cancer (42). The cell proliferation
instability-related gene cluster is an important factor in ATC
transformation (43). Thus, the FOS
protein may be crucial in ATC formation. In the present study, the
upregulation of FOS was present in the TLR signaling pathway,
suggesting that FOS may be important in contributing to ATC
formation via the TLR signaling pathway.
ECM is a protein, which is crucial in thyroid tumor
invasion, metastasis and diagnosis (44). COL, a low abundance fibrillar collagen
of the COL family, is a component of ECM (45). The activity of base membrane COL4
indicates the cell proliferation and metastatic abilities of
thyroid cancer (46). Kusunoki et
al (47) showed that the level of
COL4 collagenase in patients with thyroid cancer was higher,
compared with that in the normal thyroid, and COL4 may assist in
predicting the invasion and metastasis of thyroid cancer. The
expression of COL5A1 is suppressed by microRNA-145 in anaplastic
meningionas (48). Downregulated
COL5A1 can decrease the adhesion of tumor cells via the
ECM-receptor interaction pathway, enhancing tumor metastasis
(49). COL11A1 and COL5A1 promote
cell migration and tumor progression in mice (50). In the present study, the findings
showed that COL5A1 and COL11A1 were downregulated and were present
in the ECM-receptor interaction pathway, suggesting that the two
genes may be important in the progression of ATC via the
ECM-receptor interaction pathway.
In conclusion, the present study analyzed the key
genes and significant pathways in ATC, compared with NT samples.
The TLR signaling pathway, ECM-receptor interaction and
cytokine-cytokine receptor interaction pathway were found to be
closely associated with ATC. CXCL10 may be of benefit in ATC
treatment, FOS may be involved in ATC formation, COL5A1 and COL11A1
may promote the progression of ATC, and IL8 may act as a biomarker
for the diagnosis of ATC. The results of the present study provide
a basis for further clinical molecular target therapy experiments
for ATC.
Acknowledgements
This study was supported by the National Natural
Science Foundation of China (grant no. 81372860).
References
|
1
|
Siegel R, Naishadham D and Jemal A: Cancer
statistics, 2013. CA Cancer J Clin. 63:11–30. 2013. View Article : Google Scholar : PubMed/NCBI
|
|
2
|
Neff RL, Farrar WB, Kloos RT and Burman
KD: Anaplastic thyroid cancer. Endocrinol Metab Clin North Am.
37:525–538. 2008. View Article : Google Scholar : PubMed/NCBI
|
|
3
|
Smallridge RC, Marlow LA and Copland JA:
Anaplastic thyroid cancer: Molecular pathogenesis and emerging
therapies. Endocr Relat Cancer. 16:17–44. 2009. View Article : Google Scholar : PubMed/NCBI
|
|
4
|
Are C and Shaha AR: Anaplastic thyroid
carcinoma: Biology, pathogenesis, prognostic factors, and treatment
approaches. Ann Surg Oncol. 13:453–464. 2006. View Article : Google Scholar : PubMed/NCBI
|
|
5
|
Passaro C, Abagnale A, Libertini S, Volpe
M, Botta G, Cella L, Pacelli R, Halldèn G, Gillespie D and Portella
G: Ionizing radiation enhances dl922-947-mediated cell death of
anaplastic thyroid carcinoma cells. Endocr Relat Cancer.
20:633–647. 2013. View Article : Google Scholar : PubMed/NCBI
|
|
6
|
Harach HR, Galíndez M, Campero M and
Ceballos GA: Undifferentiated (anaplastic) thyroid carcinoma and
iodine intake in Salta, Argentina. Endocr Pathol. 24:125–131. 2013.
View Article : Google Scholar : PubMed/NCBI
|
|
7
|
Marlow LA, Von Roemeling CA, Cooper SJ,
Zhang Y, Rohl SD, Arora S, Gonzales IM, Azorsa DO, Reddi HV, Tun
HW, et al: Foxo3a drives proliferation in anaplastic thyroid
carcinoma through transcriptional regulation of cyclin A1: A
paradigm shift that impacts current therapeutic strategies. J Cell
Sci. 125:4253–4263. 2012. View Article : Google Scholar : PubMed/NCBI
|
|
8
|
Kim SH, Kang JG, Kim CS, Ihm SH, Choi MG,
Yoo HJ and Lee SJ: CCAAT/enhancer-binding protein-homologous
protein sensitizes to SU5416 by modulating p21 and PI3K/Akt signal
pathway in FRO anaplastic thyroid carcinoma cells. Horm Metab Res.
45:9–14. 2013.PubMed/NCBI
|
|
9
|
Yu XM, Jaskula-Sztul R, Ahmed K, Harrison
AD, Kunnimalaiyaan M and Chen H: Resveratrol induces
differentiation markers expression in anaplastic thyroid carcinoma
via activation of Notch1 signaling and suppresses cell growth. Mol
Cancer Ther. 12:1276–1287. 2013. View Article : Google Scholar : PubMed/NCBI
|
|
10
|
Lim YC and Cha YY:
Epigallocatechin-3-gallate induces growth inhibition and apoptosis
of human anaplastic thyroid carcinoma cells through suppression of
EGFR/ERK pathway and cyclin B1/CDK1 complex. J Surg Oncol.
104:776–780. 2011. View Article : Google Scholar : PubMed/NCBI
|
|
11
|
Becker N, Chernock RD, Nussenbaum B and
Lewis JS Jr: Prognostic significance of β-human chorionic
gonadotropin and PAX8 expression in anaplastic thyroid carcinoma.
Thyroid. 24:319–326. 2014. View Article : Google Scholar : PubMed/NCBI
|
|
12
|
Kim KS, Min J-K, Liang ZL, Lee K, Lee JU,
Bae KH, Lee MH, Lee SE, Ryu MJ, Kim SJ, et al: Aberrant l1 cell
adhesion molecule affects tumor behavior and chemosensitivity in
anaplastic thyroid carcinoma. Clin Cancer Res. 18:3071–3078. 2012.
View Article : Google Scholar : PubMed/NCBI
|
|
13
|
Gauchotte G, Philippe C, Lacomme S,
Léotard B, Wissler MP, Allou L, Toussaint B, Klein M, Vignaud JM
and Bressenot A: BRAF, p53 and SOX2 in anaplastic thyroid
carcinoma: Evidence for multistep carcinogenesis. Pathology.
43:447–452. 2011. View Article : Google Scholar : PubMed/NCBI
|
|
14
|
Hébrant A, Dom G, Dewaele M, Andry G,
Trésallet C, Leteurtre E, Dumont JE and Maenhaut C: mRNA expression
in papillary and anaplastic thyroid carcinoma: Molecular anatomy of
a killing switch. PLoS One. 7:e378072012. View Article : Google Scholar : PubMed/NCBI
|
|
15
|
He W, Qi B, Zhou Q, Lu C, Huang Q, Xian L
and Chen M: Key genes and pathways in thyroid cancer based on gene
set enrichment analysis. Oncol Rep. 30:1391–1397. 2013.PubMed/NCBI
|
|
16
|
Xu Y, Deng Y, Ji Z, Liu H, Liu Y, Peng H,
Wu J and Fan J: Identification of thyroid carcinoma related genes
with mRMR and shortest path approaches. PLoS One. 9:e940222014.
View Article : Google Scholar : PubMed/NCBI
|
|
17
|
Gautier L, Cope L, Bolstad BM and Irizarry
RA: affy-analysis of Affymetrix GeneChip data at the probe level.
Bioinformatics. 20:307–315. 2004. View Article : Google Scholar : PubMed/NCBI
|
|
18
|
Gentleman RC, Carey VJ, Bates DM, Bolstad
B, Dettling M, Dudoit S, Ellis B, Gautier L, Ge Y, Gentry J, et al:
Bioconductor: Open software development for computational biology
and bioinformatics. Genome Biol. 5:R802004. View Article : Google Scholar : PubMed/NCBI
|
|
19
|
Smyth GK: Limma: Linear models for
microarray dataBioinformatics and Computational Biology Solutions
using R and Bioconductor. Gentleman R, Carey VJ, Huber W, Irizarry
RA and Dudoit S: Springer; New Yotk, NY: pp. 397–420. 2005,
View Article : Google Scholar
|
|
20
|
Hulsegge I, Kommadath A and Smits MA:
Globaltest and GOEAST: Two different approaches for gene ontology
analysis. BMC Proc. 3:(Suppl 4). S102009. View Article : Google Scholar : PubMed/NCBI
|
|
21
|
Kanehisa M and Goto S: KEGG: Kyoto
encyclopedia of genes and genomes. Nucleic Acids Res. 28:27–30.
2000. View Article : Google Scholar : PubMed/NCBI
|
|
22
|
da W Huang, Sherman BT and Lempicki RA:
Systematic and integrative analysis of large gene lists using DAVID
bioinformatics resources. Nat Protoc. 4:44–57. 2009.PubMed/NCBI
|
|
23
|
Franceschini A, Szklarczyk D, Frankild S,
Kuhn M, Simonovic M, Roth A, Lin J, Minguez P, Bork P, von Mering C
and Jensen LJ: STRING v9. 1: Protein-protein interaction networks,
with increased coverage and integration. Nucleic Acids Res.
41:(Database issue). D808–D815. 2013. View Article : Google Scholar : PubMed/NCBI
|
|
24
|
Kohl M, Wiese S and Warscheid B:
Cytoscape: Software for visualization and analysis of biological
networks. Methods Mol Biol. 696:291–303. 2011. View Article : Google Scholar : PubMed/NCBI
|
|
25
|
Niissalo A: Cytoscape and its Plugins.
Department of Computer Science University of Helsinki Finland;
2007
|
|
26
|
Pham L, Christadore L, Schaus S and
Kolaczyk ED: Network-based prediction for sources of
transcriptional dysregulation using latent pathway identification
analysis. Proc Natl Acad Sci USA. 108:13347–13352. 2011. View Article : Google Scholar : PubMed/NCBI
|
|
27
|
Yu G, Wang LG, Han Y and He QY:
clusterProfiler: An R package for comparing biological themes among
gene clusters. OMICS. 16:284–287. 2012. View Article : Google Scholar : PubMed/NCBI
|
|
28
|
Jamali M and Ester M: TrustWalker: A
random walk model for combining trust-based and item-based
recommendation. Proceedings of the 15th ACM SIGKDD International
Conference on Knowledge Discovery and Data Mining. ACM. New York,
NY. pp. 397–406. 2009;
|
|
29
|
Kim JH: Boostrap prediction intervals and
bias-corrected forecasting. http://cran.rproject.org/web/packages/BootPR/index.html2009.
|
|
30
|
Ruffilli I, Ferrari SM, Colaci M, Ferri C,
Politti U, Antonelli A and Fallahi P: CXCR3 and CXCL10 in
autoimmune thyroiditis. Clin Ter. 165:e237–e242. 2014.(In Italian).
PubMed/NCBI
|
|
31
|
Baloch ZW, Livolsi VA, Asa SL, Rosai J,
Merino MJ, Randolph G, Vielh P, DeMay RM, Sidawy MK and Frable WJ:
Diagnostic terminology and morphologic criteria for cytologic
diagnosis of thyroid lesions: A synopsis of the national cancer
institute thyroid fine-needle aspiration state of the science
conference. Diagn Cytopathol. 36:425–437. 2008. View Article : Google Scholar : PubMed/NCBI
|
|
32
|
Fallahi P, Ferrari SM, Corrado A,
Giuggioli D, Ferri C and Antonelli A: Targeting chemochine (C-X-C
motif) receptor 3 in thyroid autoimmunity. Recent Pat Endocr Metab
Immune Drug Discov. 8:95–101. 2014. View Article : Google Scholar : PubMed/NCBI
|
|
33
|
Antonelli A, Ferrari SM, Fallahi P, Piaggi
S, Di Domenicantonio A, Galleri D, Santarpia L, Basolo F,
Ferrannini E and Miccoli P: Variable modulation by cytokines and
thiazolidinediones of the prototype Th1 chemokine CXCL10 in
anaplastic thyroid cancer. Cytokine. 59:218–222. 2012. View Article : Google Scholar : PubMed/NCBI
|
|
34
|
Lin Q, Li M, Fang D, Fang J and Su SB: The
essential roles of Toll-like receptor signaling pathways in sterile
inflammatory diseases. Int Immunopharmacol. 11:1422–1432. 2011.
View Article : Google Scholar : PubMed/NCBI
|
|
35
|
Mardente S, Mari E, Consorti F, Di Gioia
C, Negri R, Etna M, Zicari A and Antonaci A: HMGB1 induces the
overexpression of miR-222 and miR-221 and increases growth and
motility in papillary thyroid cancer cells. Oncol Rep.
28:2285–2289. 2012.PubMed/NCBI
|
|
36
|
Romagnani P, Rotondi M, Lazzeri E, Lasagni
L, Francalanci M, Buonamano A, Milani S, Vitti P, Chiovato L,
Tonacchera M, et al: Expression of IP-10/CXCL10 and MIG/CXCL9 in
the thyroid and increased levels of IP-10/CXCL10 in the serum of
patients with recent-onset Graves' disease. Am J Pathol.
161:195–206. 2002. View Article : Google Scholar : PubMed/NCBI
|
|
37
|
Yousefi S, Hemmann S, Weber M, Hölzer C,
Hartung K, Blaser K and Simon HU: IL-8 is expressed by human
peripheral blood eosinophils. Evidence for increased secretion in
asthma. J Immunol. 154:5481–5490. 1995.PubMed/NCBI
|
|
38
|
Tanaka K, Towata S, Nakao K, Mizuguchi H,
Hayakawa T, Niwa M, Ishii N and Nagayama Y: Thyroid cancer
immuno-therapy with retroviral and adenoviral vectors expressing
granulocyte macrophage colony stimulating factor and interleukin-12
in a rat model. Clin Endocrinol. 59:734–742. 2003. View Article : Google Scholar
|
|
39
|
Kobawala TP, Patel GH, Gajjar DR, Patel
KN, Thakor PB, Parekh UB, Patel KM, Shukla SN and Shah PM: Clinical
utility of serum interleukin-8 and interferon-alpha in thyroid
diseases. J Thyroid Res. 2011:2701492011. View Article : Google Scholar : PubMed/NCBI
|
|
40
|
Bazhenova Elu, Kulikov AV, Tikhonova MA,
Tsybko AS and Popova NK: Effects of stress on corticosterone level,
expression of c-Fos gene and serotonin turnover in brain in mice
with genetic predisposition to catalepsy. Ross Fiziol Zh Im I M
Sechenova. 98:1070–1078. 2012.(In Russian). PubMed/NCBI
|
|
41
|
Zhang X, Zhang L, Yang H, Huang X, Otu H,
Libermann TA, DeWolf WC, Khosravi-Far R and Olumi AF: c-Fos as a
proapoptotic agent in TRAIL-induced apoptosis in prostate cancer
cells. Cancer Res. 67:9425–9434. 2007. View Article : Google Scholar : PubMed/NCBI
|
|
42
|
Watanabe T, Hiasa Y, Tokumoto Y, Hirooka
M, Abe M, Ikeda Y, Matsuura B, Chung RT and Onji M: Protein kinase
R modulates c-Fos and c-Jun signaling to promote proliferation of
hepatocellular carcinoma with hepatitis C virus infection. PLoS
One. 8:e677502013. View Article : Google Scholar : PubMed/NCBI
|
|
43
|
Salvatore G, Nappi TC, Salerno P, Jiang Y,
Garbi C, Ugolini C, Miccoli P, Basolo F, Castellone MD, Cirafici
AM, et al: A cell proliferation and chromosomal instability
signature in anaplastic thyroid carcinoma. Cancer Res.
67:10148–10158. 2007. View Article : Google Scholar : PubMed/NCBI
|
|
44
|
Ingeson-Carlsson C and Nilsson M: Dual
contribution of MAPK and PI3K in epidermal growth factor-induced
destabilization of thyroid follicular integrity and invasion of
cells into extracellular matrix. Exp Cell Res. 326:210–218. 2014.
View Article : Google Scholar : PubMed/NCBI
|
|
45
|
Brown JC, Miller CJ, Posthumus M,
Schwellnus MP and Collins M: The COL5A1 gene, ultra-marathon
running performance, and range of motion. Int J Sports Physiol
Perform. 6:485–496. 2011. View Article : Google Scholar : PubMed/NCBI
|
|
46
|
Kusunoki T, Nishida S, Kimoto-Kinoshita S,
Murata K, Satou T and Tomura T: Type IV collagenase and
immunostaining of type IV collagen in human thyroid tumors. Auris
Nasus Larynx. 27:161–165. 2000. View Article : Google Scholar : PubMed/NCBI
|
|
47
|
Kusunoki T, Nishida S, Kimoto-Kinoshita S,
Murata K, Satou T and Tomura T: Type IV collagen, type IV
collagenase activity and ability of cell proliferation in human
thyroid tumours. Asian J Surg. 25:304–308. 2002. View Article : Google Scholar : PubMed/NCBI
|
|
48
|
Kliese N, Gobrecht P, Pachow D, Andrae N,
Wilisch-Neumann A, Kirches E, Riek-Burchardt M, Angenstein F,
Reifenberger G, Riemenschneider MJ, et al: miRNA-145 is
downregulated in atypical and anaplastic meningiomas and negatively
regulates motility and proliferation of meningioma cells. Oncogene.
32:4712–4720. 2013. View Article : Google Scholar : PubMed/NCBI
|
|
49
|
Christner PJ and Ayitey S: Extracellular
matrix containing mutated fibrillin-1 (Fbn1) down regulates Col1a1,
Col1a2, Col3a1, Col5a1, and Col5a2 mRNA levels in Tsk/+ and Tsk/Tsk
embryonic fibroblasts. Amino Acids. 30:445–451. 2006. View Article : Google Scholar : PubMed/NCBI
|
|
50
|
Cheon DJ, Tong Y, Sim MS, Dering J, Berel
D, Cui X, Lester J, Beach JA, Tighiouart M, Walts AE, et al: A
collagen-remodeling gene signature regulated by TGF-β signaling is
associated with metastasis and poor survival in serous ovarian
cancer. Clin Cancer Res. 20:711–723. 2014. View Article : Google Scholar : PubMed/NCBI
|