Introduction
Schwannoma are benign tumors arising from Schwann
cells in the sheaths of peripheral nerves. Schwannoma are
homogeneous tumors and may occur in any tissue of the body. The
head and neck region is the most prevalent location for schwannoma
to occur; they are rarely observed in the gastrointestinal tract
(1). Conventional schwannoma usually
arise from peripheral skin nerves and connective tissue, whereas
gastrointestinal schwannoma tumors are derived from Schwann cells
of the Auerbach's plexus within the gastrointestinal tract wall
(1–3)
and were first reported by Daimaru et al in 1988 (1). As benign mesenchymal tumors, schwannomas
only account for 1–2% of alimentary tract mesenchymal tumors
(2,3).
By contrast, gastrointestinal stromal tumors (GISTs), another type
of mesenchymal tumor, are the most common type of submucosal tumor
in the alimentary tract. GISTs and gastrointestinal schwannomas are
typically observed in 40–60 year old patients (4,5) and
demonstrate similar computed tomography (CT) imaging
characteristics and clinical symptoms (6,7). The
biological behaviors, appropriate treatments and prognoses vary
between GIST and gastrointestinal schwannomas. Gastrointestinal
schwannomas generally grow slowly and are associated with an
excellent prognosis compared with GIST (8). The benefit of surgical resection for
benign gastrointestinal tumors remains debatable (8–10). By
contrast, GISTs are potentially malignant, and early surgical
resection is recommended, regardless of the tumor size.
Furthermore, patients with high-risk GISTs should receive imatinib
treatment subsequent to surgical resection (11). Therefore, distinguishing between
gastrointestinal schwannomas and GISTs is important to determine
whether surgical resection is required as part of treatment.
Unlike mucosal gastrointestinal tumors, including
gastric carcinoma and colorectal carcinoma, gastrointestinal
mesenchymal tumors are difficult to definitively diagnose with
endoscopy prior to surgery (9). In
patients with gastrointestinal mesenchymal tumors, endoscopy
typically reveals undamaged mucosa and an insert image suggesting
extrinsic compression of the gastrointestinal lumen. However, all
mesenchymal tumors have similar endoscopic image characteristics
(9). In addition, a biopsy guided by
endoscopy may be insufficient to collect the amount of tissue
required to inform a correct diagnosis (10–12). Thus,
endoscopy is insufficient for the specific diagnosis of
gastrointestinal mesenchymal tumors.
As modern CT imaging is associated with a rapid scan
speed, improved resolution improvement and compatibility with
contrast media, it has been demonstrated as an important and
valuable tool for preoperative diagnosis, and the staging of
gastrointestinal tract tumors (12).
However, differentiating between GISTs and gastrointestinal
schwannomas prior to surgery remains challenging due to their
similar CT appearances, and schwannomas are commonly misdiagnosed
as GISTs (6,12). To address this issue, previous
investigations have identified that certain CT features, including
the density, enhancement pattern, growth pattern and the presence
of PLNs, as well as doubling times, may assist in differentiating
gastric schwannoma from GIST (13,14).
However, the majority of previous studies have focused on certain
qualitative CT features that are highly dependent on the experience
of the attending radiologists (13,14).
Additionally, numerous previous studies had small gastrointestinal
schwannoma sample sizes. Therefore, in the present study,
qualitative and quantitative analyses were used to identify CT
features that may aid the diagnostic differentiation between
gastric schwannomas and GIST.
Materials and methods
Patients
The present study was conducted in accordance with
the ethics guidelines for human research, and was compliant with
the Health Insurance Portability and Accountability Act (China).
The present study received Institutional Review Board and ethics
committee approval of the First Affiliated Hospital of Sun Yat-Sen
University (Guangzhou, China), and written informed consent was
obtained from all patients. Complete clinical, imaging and
follow-up data of 50 patients with GIST and 15 patients with
gastrointestinal schwannomas who presented between January 2000 and
July 2014 and underwent whole abdomen CT and surgical resection
were included in the present study. Amongst the patients with
gastrointestinal schwannoma, there were 9 females; the mean age was
55.3 years; the age range was 35–74 years, 13 tumors originated in
the stomach, 1 in the duodenum and 1 in the transverse colon. Prior
to surgery, 12 gastrointestinal schwannomas were misdiagnosed as
GISTs, 2 as gastric cancer and 1 as a metastatic tumor. Amongst the
50 patients with GIST, there were 17 females; the mean age was 56.8
years; the age range was 35–39 years, 36 tumors originated in the
stomach, 8 in the duodenum, 5 in the jejunum and 1 in the ileum.
Histopathological confirmation was obtained from surgical excision
in all 65 patients, and all PLNs identified during surgery were
fully excised.
CT protocol
Patients fasted for a minimum of 12 h prior to CT
examination. On the day of examination, each patient was provided
with 1,600–2,000 ml of 2.5% oral mannite, administered at 400–500
ml each time with an interval of 15 min, and 500 ml 2.5% mannite
enema. The CT examination was performed immediately, subsequent to
the last oral administration, using the Aquilion 64 CT scanner or
the Xpress/SX Multi-detector scanner (Toshiba Medical Systems
Corporation, Tokyo, Japan). The patient was positioned supine and
scanned from the diaphragm to the level of tuberosity of ischium.
For a contrast-enhanced CT, 1.5 ml/kg iopromide (Ultravist300;
Schering, Berlin, Germany) was administrated at a rate of 3–4
ml/sec. The CT scan was obtained 34–37 sec prior to the injection
of the contrast agent and 60–70 sec subsequent to the injection of
the contrast agent. The scanning parameters were as follows: A beam
collimation of 0.5 mm × 64; tube voltage of 120 kV; 200–250 mAs;
slice thickness/interval 5 mm/5 mm.
Image analysis
The CT images were evaluated according to the
consensus of two radiologists with >5 years of experience.
Differences in opinion between the two radiologists during initial
interpretation were subjected to additional discussion to determine
a final conclusion. The masses were evaluated for size, contour
(round, quasi-circular or lobulated), growth pattern (endoluminal,
exophytic or mixed), margin (well-defined or ill-defined),
calcification, cystic change, hemorrhage, ulceration, the presence
of PLNs, invasion to other solid organs, metastasis, ascites, tumor
vessels, reoccurrence status and enhancement pattern (homogeneous
or heterogeneous).
Qualitative analysis in venous
phase
If the parameter of the intracavitary tumor extended
beyond the margin of the gastrointestinal structures profile, the
growth pattern was defined as exophytic. A tumor located within the
margin of the gastrointestinal structures was defined as exhibiting
an endoluminal growth pattern. If the parameter was across the
margins of gastrointestinal structures, it was defined as a mixed
growth pattern. A tumor with smooth-edged margins was considered to
be well-defined whereas a rough-edged tumor was considered to be
ill-defined. High-density regions were defined as 80–200 Hounsfield
units (HU) during unenhanced CT scans. Cystic change was defined as
instances where there were quasi-circular, watery density regions
exhibited in the unenhanced CT scan, and no enhancement pattern
detected during the enhanced CT scan. Hemorrhage was defined as a
patchy, high-density region detected in the unenhanced CT scan,
with CT values between 60 and 80 HU (10). Ulceration was defined as silt- or
semi-elliptical-shaped lesions of gastrointestinal mucosa extending
to the tumor, in which gas or intestinal contrast agent was
identified (11). The degree of
contrast enhancement was calculated as the difference between
venous phase and plain CT values. If the difference was <10 HU,
the tumor was considered to exhibit a mild enhancement pattern;
10–40 HU was considered to be a moderate enhancement pattern and
>40 HU to be a strong enhancement pattern (12). Positive PLNs were defined as lymph
nodes surrounding the tumor with a minor axis >1 cm, or with
clear enhancement (6). The size of
tumor was determined by measuring the maximal diameter recorded in
cross-sectional images, ≥5 cm or <5 cm.
Quantitative analysis
The center cross-section CT images of the tumor
during plain CT (Tp), arterial phase (Ta) and venous phase (Tv)
were selected, and the mean values were recorded using a region of
interest (ROI) of those with a diameter from 5 to 15 mm. Blood
vessels detectable by the naked eye, necrosis, cystic change,
calcification and artifacts were not included in the ROI drawing.
The absolute CT values of the tumor (and aorta) in the same slice
during plain scan, arterial phase and venous phase were recorded as
Tp (or aorta plain scan, Ap), Ta (aorta arterial phase scan, Aa)
and Tv (aorta venous phase scan, Av), respectively. To avoid
inaccuracy caused by different injection rates, different injected
doses and individual circulation levels in different patients, the
CT values of tumor, Tp, Ta and Tv, were divided by the
corresponding CT values of the abdominal aorta in the same layer,
Ap, Aa and Av, to produce normalized CT values, Sp (Tp/Ap), Sa
(Ta/Aa) and Sv (Tv/Av), respectively. Additionally, the difference
in CT value of the tumor between the arterial and venous phase was
calculated and recorded as Tv-a.
Statistical analysis
All statistical analyses were performed using SPSS
16.0 (SPSS, Inc., Chicago, IL, USA). Quantitative data was
presented as the mean ± standard deviation and enumeration data was
recorded as percentages. An unpaired or Satterthwaite's approximate
t-test was performed to compare quantitative data between the
groups. A χ2 test or Fisher's exact test was performed to compare
enumeration data. P<0.05 was considered to indicate a
statistically significant difference.
Receiver operating characteristic (ROC) curve
analysis, using a maximum likelihood method, was used to assess the
performance of the CT scans in differentiating between
gastrointestinal schwannomas and GISTs. The performance was
evaluated by calculating the area under the curve (AUC) of the ROC
curve. The judgment criteria were as follows: AUC value of 0.5–0.7,
low diagnostic value; AUC 0.7–0.9, medium; AUC >0.9, high. All
CT features with an AUC >0.7 were evaluated for specificity and
sensitivity. Sensitivity was defined as the true positive rate,
which reflects the ability to correctly diagnose patients with the
disease. Specificity was defined as the true negative rate, which
reflects the ability to correctly identify patients without the
disease.
Results
Clinical characteristics of
patients
Patients with gastrointestinal schwannomas or GISTs
commonly present with similar clinical symptoms (Table I). CT images of all 15 patients with
gastrointestinal schwannomas did not demonstrate the presence of
ascites, local invasion to surrounding structures or distant
metastasis. PLN in these patients were subsequently assessed,
confirming there was no histopathological evidence of metastasis.
No recurrence or metastatic lesions were detected at a mean
follow-up period of 12.6 months subsequent to surgery. In
comparison, the CT images obtained from 4 GISTs patients
demonstrated local invasion to the surrounding structures. Distant
metastasis was evident in 6 patients, 5 with liver metastasis and 1
with lymphatic metastasis. Recurrence occurred in 2 patients at 14
and 33 months follow-up, respectively.
 | Table I.Clinical symptoms of gastric
schwannomas and gastrointestinal stromal tumors. |
Table I.
Clinical symptoms of gastric
schwannomas and gastrointestinal stromal tumors.
| Symptom | Schwannomas | Gastrointestinal
stromal tumors |
|---|
| Bellyache | 4 | 7 |
| Abdominal
fullness | 5 | 9 |
| or discomfort |
|
|
| Melanemesis | 2 | 10 |
| Examination data | 1 | 3 |
| Others | 3 | 21 |
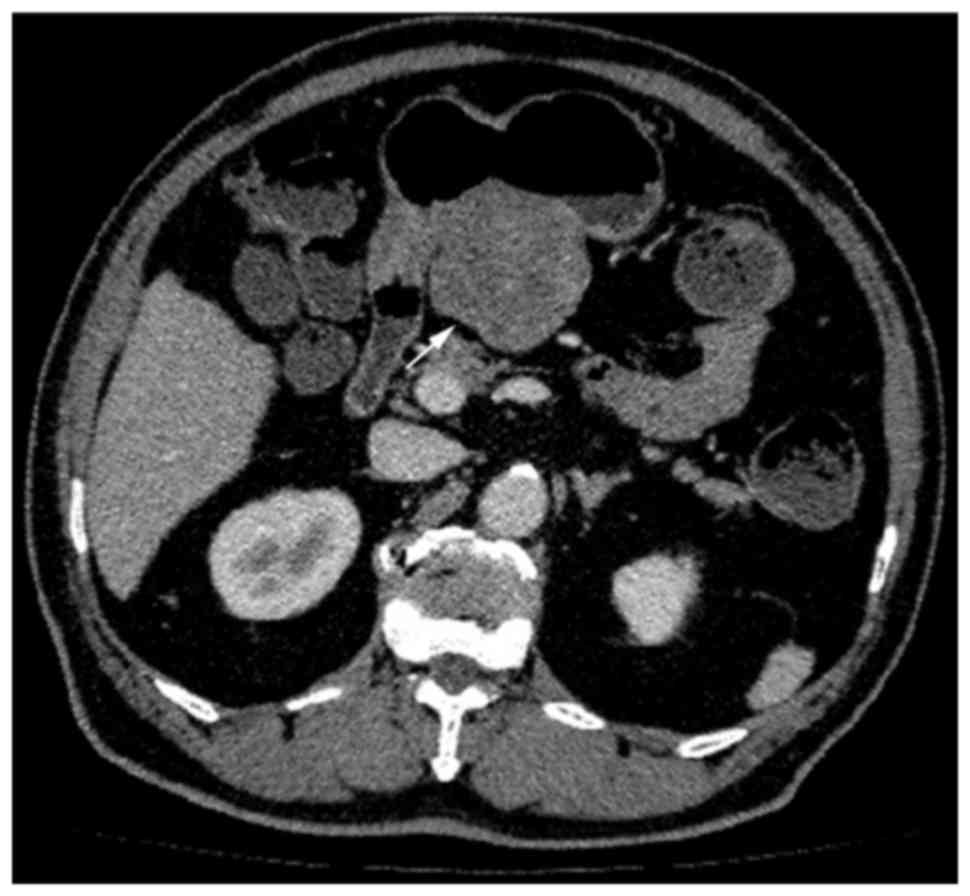
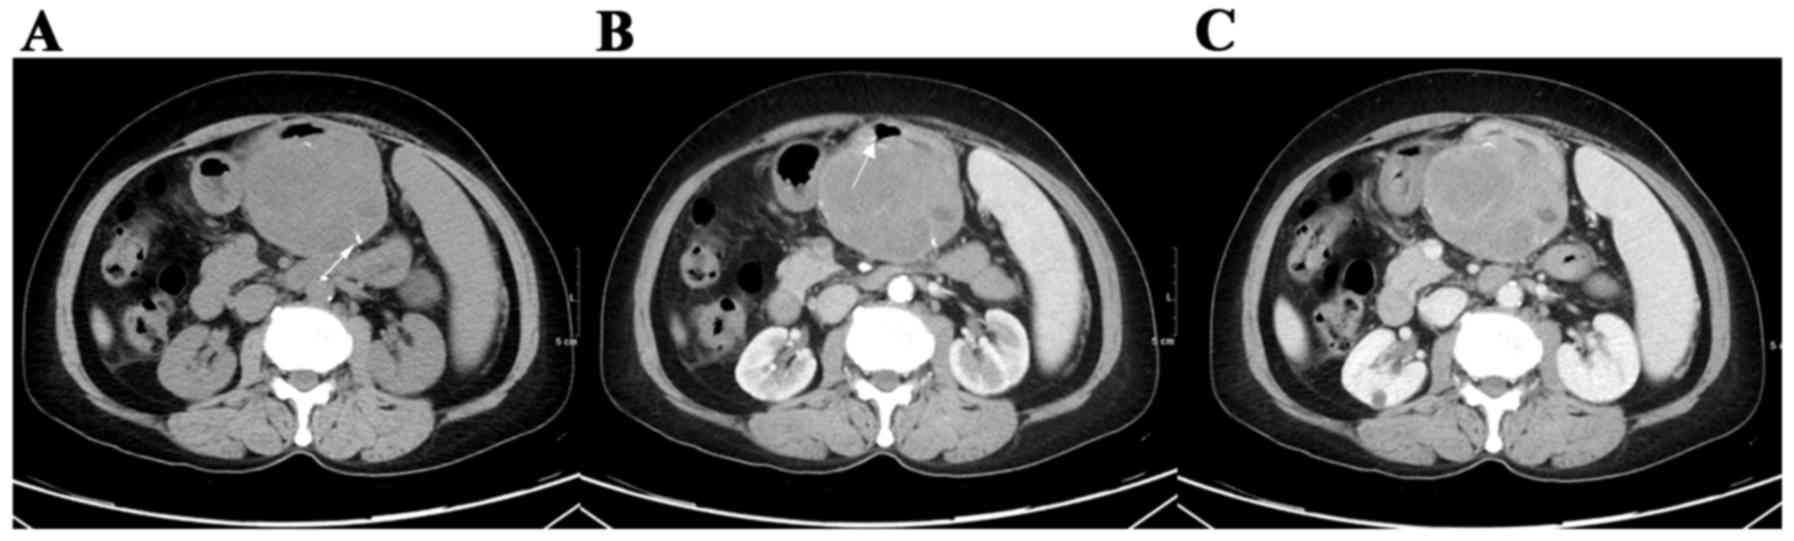
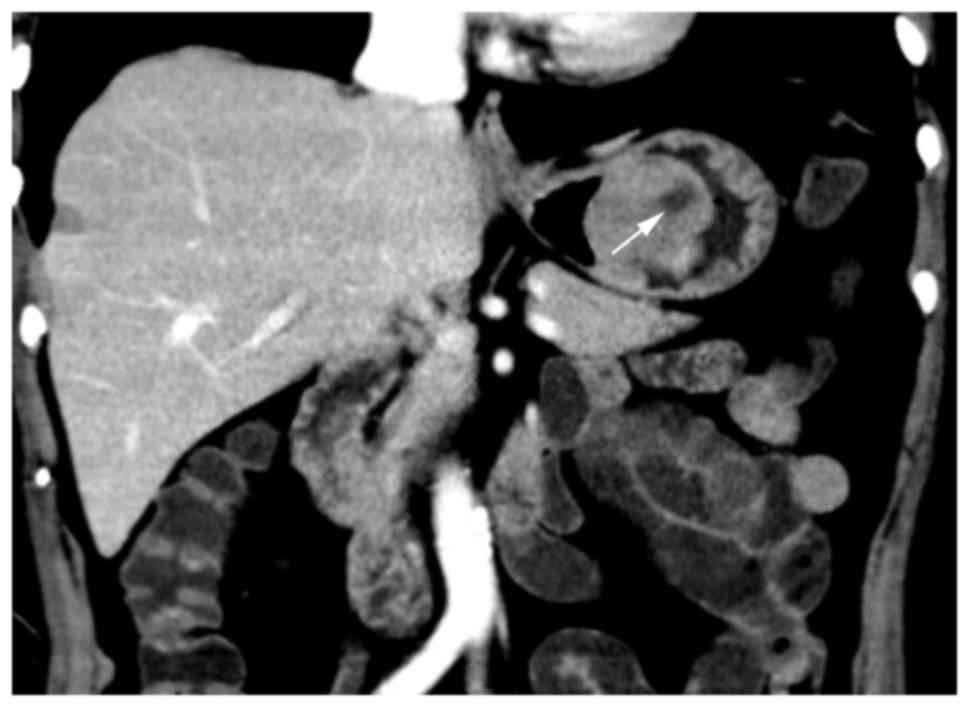
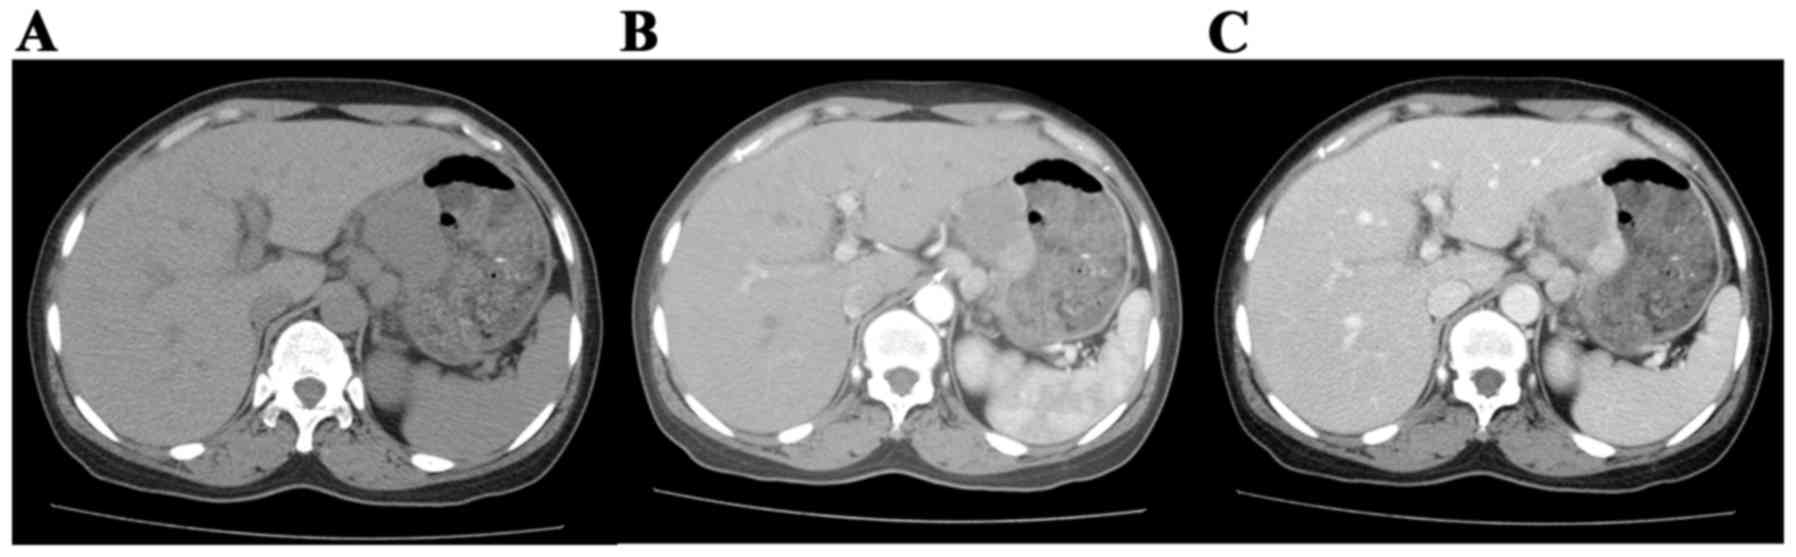
Comparison of CT data
The differences between gastrointestinal schwannomas
and GISTs in tumor margin (Figs.
1–5), growth pattern (Figs. 1–5),
intratumoral calcification (Fig. 5)
and hemorrhage were not statistically significant. The differences
in size (P=0.007), contour (P=0.041), cystic change (Fig. 2; P<0.0001), PLNs (Fig. 6; P=0.0007), tumor vessels (P=0.0098),
pattern (P=0.0002) and degree (P=0.005) of contrast enhancement
were statistically significant (Table
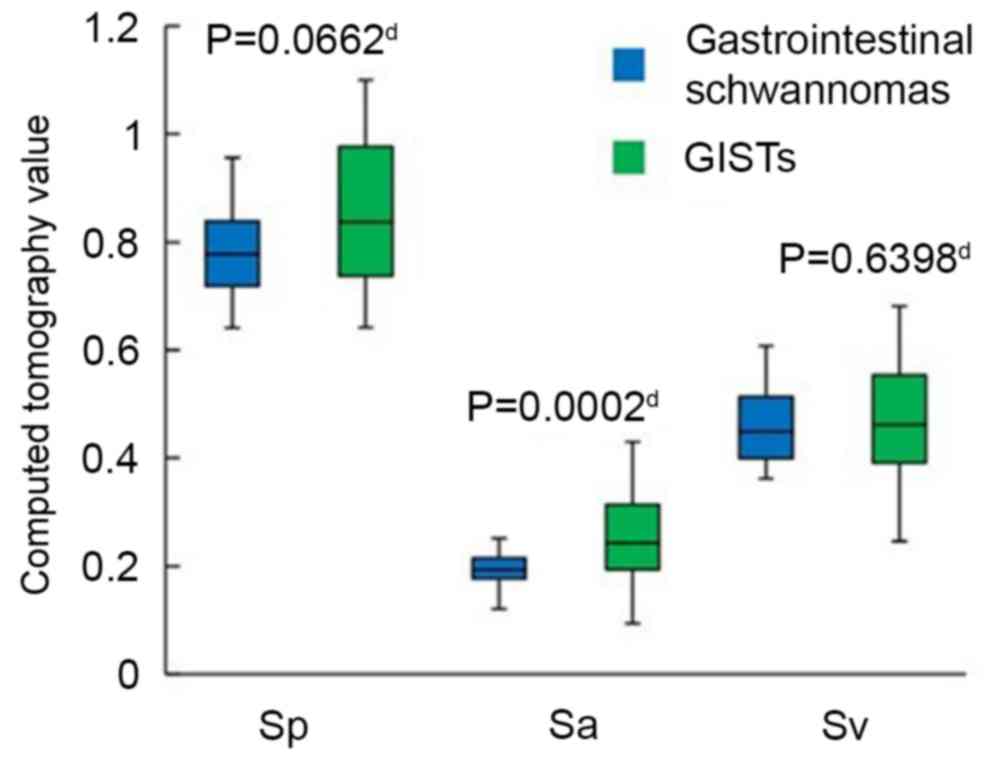
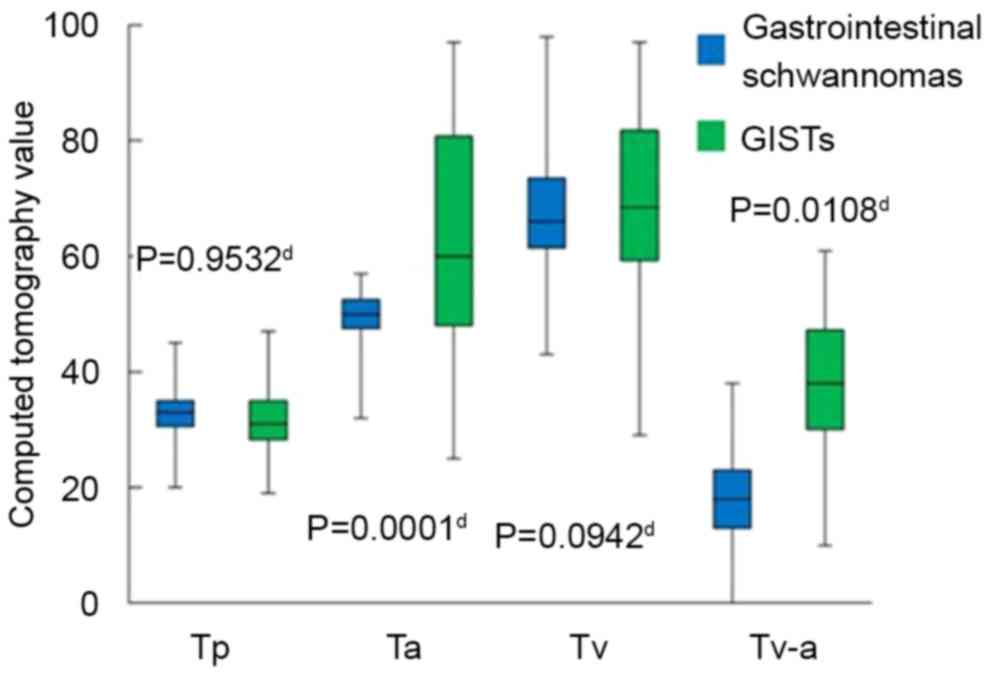
II). The Sa (P=0.0002), Ta (P=0.0001) and Tv-a (P=0.0108) of
GISTs were significantly higher than gastrointestinal schwannomas
in all cases (Figs. 7 and 8). No statistically significant differences
were observed in the remaining CT features.
| Table II.CT results of gastric schwannomas and
GISTs. |
Table II.
CT results of gastric schwannomas and
GISTs.
|
| Schwannomas
(n=15) | GISTs (n=50) |
|
|---|
|
|
|
|
|
|---|
| CT results | % | n | % | n | P-value |
|---|
| Size |
|
|
|
| 0.007a |
| <5
cm | 73.3 | 11 | 32.0 | 16 |
|
| ≥5
cm | 26.7 | 4 | 68.0 | 34 |
|
| Contour |
|
|
|
| 0.041a |
| Round or
quasi-circular | 86.7 | 13 | 58.0 | 29 |
|
|
Lobulated | 13.3 | 2 | 42.0 | 21 |
|
| Margin |
|
|
|
| 0.67b |
|
Well-defined | 93.3 | 14 | 84.0 | 42 |
|
|
Ill-defined |
6.7 | 1 | 16.0 | 8 |
|
| Growth pattern |
|
|
|
| 0.085b |
|
Endoluminal | 13.3 | 2 | 36.0 | 18 |
|
|
Exophytic or mixed | 86.7 | 13 | 64.0 | 32 |
|
| Calcification |
|
|
|
| 1.00b |
| + | 26.7 | 4 | 30.0 | 15 |
|
| − | 73.3 | 11 | 70.0 | 35 |
|
| Cystic change |
|
|
|
| <0.0001a |
| + | 13.3 | 2 | 78.0 | 39 |
|
| − | 86.7 | 13 | 22.0 | 11 |
|
| Hemorrhage |
|
|
|
| 1.00b |
| + | 0 | 0 | 4.0 | 2 |
|
| − | 100 | 15 | 96.0 | 48 |
|
| Ulceration |
|
|
|
| 0.529a |
| + | 26.7 | 4 | 36.0 | 18 |
|
| − | 73.3 | 11 | 64.0 | 32 |
|
| Perilesional lymph
nodes |
|
|
|
| 0.0007b |
| + | 66.7 | 10 | 18.0 | 9 |
|
| − | 23.3 | 5 | 82.0 | 51 |
|
| Tumor vessels |
|
|
|
| 0.0098a |
| + | 80.0 | 12 | 42.0 | 21 |
|
| − | 20.0 | 3 | 58.0 | 29 |
|
| Enhancement
pattern |
|
|
|
| 0.0002b |
|
Homogeneous | 66.7 | 10 | 14.0 | 7 |
|
|
Heterogeneous | 33.3 | 5 | 86.0 | 43 |
|
| Enhancement
degree |
|
|
|
| 0.005a |
| Light
or moderate | 93.3 | 14 | 52.0 | 26 |
|
|
Obvious |
6.7 | 1 | 48.0 | 24 |
|
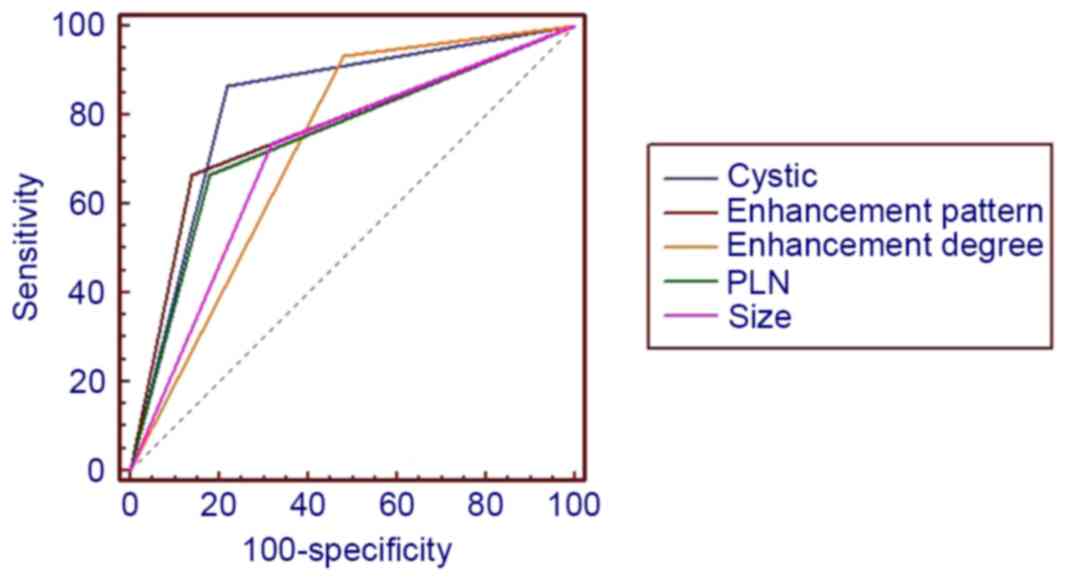
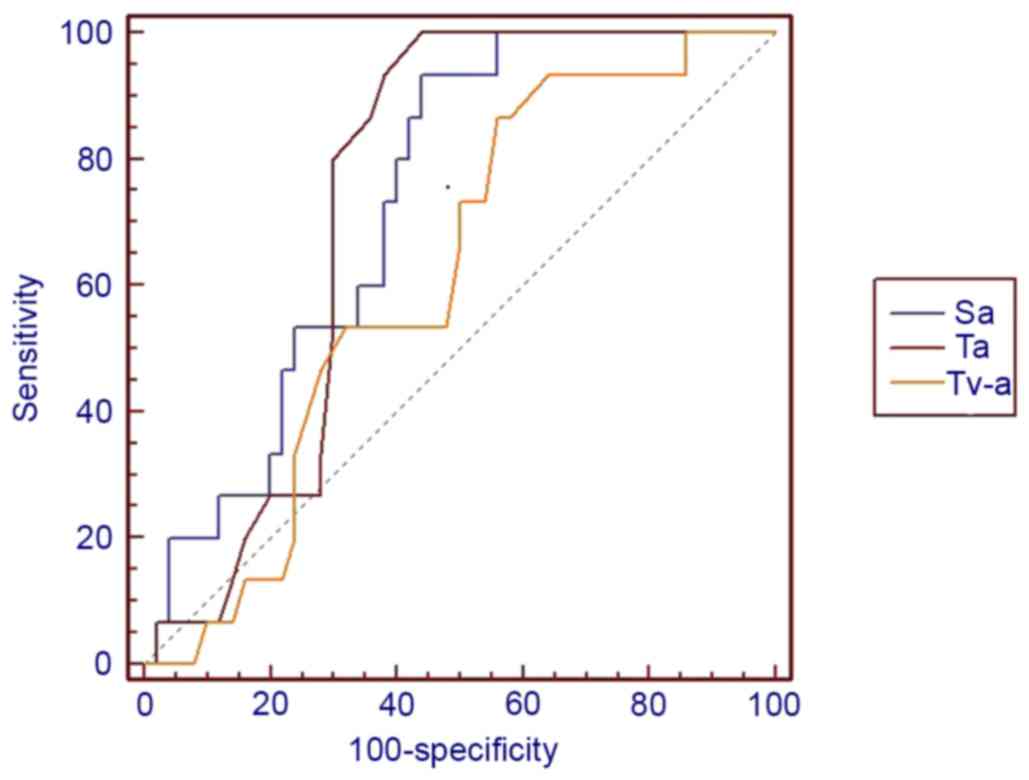
Statistically significant CT features were selected
for ROC analysis. The maximal area under the ROC curve is
illustrated in Table III. ROC
curves demonstrated in Figs. 9 and
10 indicated that lesion size,
cystic change, PLNs, enhancement pattern and Sa value were of
higher diagnostic value than others, AUC >0.7. Furthermore, the
presence of cystic change demonstrated the best diagnostic ability,
lesion size had the highest sensitivity and cystic change and Sa
had the highest specificity (Table
III).
| Table III.AUC of the Receiver operating
characteristic curve of the computed tomography features
distinguishing gastric schwannomas from gastrointestinal stromal
tumors. |
Table III.
AUC of the Receiver operating
characteristic curve of the computed tomography features
distinguishing gastric schwannomas from gastrointestinal stromal
tumors.
| Index | Specificity | Sensitivity | AUC |
|---|
| Size | 0.7 | 0.9 | 0.8 |
| Contour | 0.4 | 0.9 | 0.6 |
| Cystic change | 0.9 | 0.8 | 0.8 |
| Perilesional lymph
nodes | 0.7 | 0.8 | 0.7 |
| Fistula | 0.8 | 0.6 | 0.7 |
| Enhancement
pattern | 0.7 | 0.9 | 0.8 |
| Ta | 0.8 | 0.7 | 0.7 |
| Sa | 0.9 | 0.6 | 0.7 |
Discussion
The data from the present study demonstrated that
gastrointestinal schwannomas and GISTs frequently present as
submucosal round or quasi-circular tumors, accompanied with
hemorrhage, necrosis, cystic changes and a mild to moderate
enhancement pattern. The differences between gastrointestinal
schwannomas and GISTs in a number of CT features, including tumor
margins and growth patterns, were not statistically significant.
However, the differences for other CT features, including
differences in lesion size, were statistically significant,
consistent with the data published by Choi et al (13). Among the statistically significant CT
features, the presence of PLNs exhibited a higher predictive value
in differentiating between the two types of tumor. Perilesional
lymphadenopathy has been hypothesized to be induced by the
inflammatory process rather than tumor metastasis (15,16).
Histological examination from the present study demonstrated that
inflammatory cells were scattered throughout the tumors, and
inflammation may stimulate the proliferation of surrounding lymph
nodes. Hou et al (15)
reported that the cytotoxin released by tumor cells stimulated the
enlargement of lymph nodes, whereas Atmatzidis et al
(16) reported that PLNs exhibited
reactive inflammatory process. The data from the present study are
consistent with data from Prévot et al (17), and may be explained by Atmatzidis
et al (16). GISTs frequently
appeared in CT images as lobulated tumors with heterogeneous
density and moderate to obvious heterogeneous contrast enhancement.
Despite an overall abundance in blood supply in tumors compared
with normal tissue, the rapid proliferation of these tumor cells
led to the formation of multiple relative low-density areas with
relative insufficient blood supply in an enhanced CT scan. Thus,
hemorrhage, necrosis and cystic change are frequently exhibited in
these tumors, as demonstrated by their heterogeneous appearances on
CT (7).
In addition, the present study applied quantitative
measurements to analyze the difference in absolute CT values and
normalized CT values between gastrointestinal schwannomas and
GISTs. These measurements indicated that GISTs, as invasive tumors,
exhibited a more abundant blood supply when compared with benign
tumors, including gastrointestinal schwannomas.
The present study also demonstrated that ROC
analysis indicated that certain CT results, particularly cystic
change, size and Sa were reliable indicators for imaging
differentiation compared with the other results. Choi et al
(13) and Choi et al (14) attempted to identify the CT features
that may assist in distinguishing small (<5 cm) and large (≥5
cm) gastric GISTs from schwannomas. These studies revealed that
certain CT features, including a homogenous enhancement pattern and
PLNs, were more likely to indicate gastric schwannomas than GISTs.
Choi et al (13) interpreted
that exophytic or mixed growth and slower doubling time patterns
were the most common types of CT feature associated with gastric
schwannomas diagnoses. Choi et al (14) demonstrated that the pattern of
enhancement, the size of the tumor, and the presence of necrosis
and enlarged lymph nodes were significantly different between GISTs
and schwannomas. The qualitative analysis data of the present study
are consistent with these data. In addition, the present study has
introduced novel quantitative parameters, which demonstrated
statistically significant data, suggesting these CT features may be
used to differentiate GISTs from gastrointestinal schwannomas. To
the best of our knowledge, few studies have combined qualitative
and quantitative analysis to distinguish between these two types of
tumors.
Although certain quantitative parameters were
recognized as aiding in the differentiation between the two types
of tumor in the present study, specific CT features may overlap
between these two tumor types in certain cases. Another limitation
of the present study was the relatively small size of the group of
patients with gastrointestinal schwannomas, as this type of tumor
is rare. With such a limited sample size, useful cutoff CT values
could not be obtained to aid CT differentiation. Thus, the clinical
use of quantitative parameters to distinguish gastrointestinal
Schwannomas from GIST remains impractical.
In conclusion, GISTs demonstrate the characteristics
of malignant tumors, including abundant blood supply, faster growth
pattern, larger volume, frequent necrosis and cystic change, which
may be used to differentiate them from gastrointestinal
schwannomas. Gastrointestinal schwannomas, as benign tumors, are
more likely to be homogeneous with homogeneous enhancement, and
cystic changes, necrosis or the presence of PLNs are relatively
rare in schwannomas. Therefore, the detailed quantitative analysis
of CT images, combined with qualitative analysis, will be useful in
distinguishing between gastrointestinal schwannomas from GISTs.
Acknowledgements
The present study was supported by the National
Natural Science Foundation of China (grant no. 81571750), the
Zhujiang Scientific and Technological New Star Foundation (grant
no. 2012J2200084), the Natural Science Foundation of Guangdong
Province (grant nos. S2013010016004, 2014A030311018 and
2015A030313043) and the S&T Programs (grant no. 2014A020212125)
of Guangdong Province.
Glossary
Abbreviations
Abbreviations:
|
CT
|
computed tomography
|
|
GIST
|
gastrointestinal stromal tumors
|
|
Tp
|
tumor plain scan
|
|
Ap
|
aorta plain scan
|
|
Ta
|
tumor arterial phase
|
|
Aa
|
aorta arterial phase
|
|
Tv
|
tumor venous phase
|
|
Av
|
aorta venous phase
|
|
Sp
|
tumor plain scan over aorta plain
scan
|
|
Sa
|
tumor arterial phase over aorta
arterial phase
|
|
Sv
|
tumor venous phase over aorta venous
phase
|
|
ROC
|
receiver operating characteristic
|
|
Tv-a
|
difference between tumor venous and
arterial phases
|
|
PLN
|
perilesional lymph nodes
|
|
AUC
|
area under curve
|
|
ROI
|
region of interest
|
|
HU
|
Hounsfield units
|
References
|
1
|
Daimaru Y, Kido H, Hashimoto H and Enjoji
M: Benign schwannoma of the gastrointestinal tract: A
clinicopathologic and immunohistochemical study. Hum Pathol.
19:257–264. 1988. View Article : Google Scholar : PubMed/NCBI
|
|
2
|
Inagawa S, Hori M, Shimazaki J, Matsumoto
S, Ishii H, Itabashi M, Adachi S, Kawamoto T and Fukao K: Solitary
schwannoma of the colon: Report of two cases. Surg Today.
31:833–838. 2001. View Article : Google Scholar : PubMed/NCBI
|
|
3
|
Matsuki A, Kosugi S, Kanda T, Komukai S,
Ohashi M, Umezu H, Mashima Y, Suzuki T and Hatakeyama K: Schwannoma
of the esophagus: A case exhibiting high 18F-fluorodeoxyglucose
uptake in positron emission tomography imaging. Dis Esophagus.
22:E6–E10. 2009. View Article : Google Scholar : PubMed/NCBI
|
|
4
|
Melvin WS and Wilkinson MG: Gastric
schwannoma. Clinical and pathologic considerations. Am Surg.
59:293–296. 1993.PubMed/NCBI
|
|
5
|
Miettinen M, Sarlomo-Rikala M and Lassota
J: gastrointestinal stromal tumors: Recent advances in
understanding of their biology. Hum Pathol. 30:1212–1220. 1999.
View Article : Google Scholar
|
|
6
|
Hong HS, Ha HK, Won HJ, Byun JH, Shin YM,
Kim AY, Kim PN, Lee MG, Lee GH and Kim MJ: Gastric schwannomas:
Radiological features with endoscopic and pathological correlation.
Clin Radiol. 63:536–542. 2008. View Article : Google Scholar : PubMed/NCBI
|
|
7
|
Levy AD, Remotti HE, Thompson WM, Sobin LH
and Miettinen M: Gastrointestinal stromal tumors: Radiologic
features with pathologic correlation. Radiographics. 23:283–304,
456; quiz 532. 2003. View Article : Google Scholar : PubMed/NCBI
|
|
8
|
Loffeld RJ, Balk TG, Oomen JL and van der
Putten AB: Upper gastrointestinal bleeding due to a malignant
Schwannoma of the stomach. Eur J Gastroenterol Hepatol. 10:159–162.
1998. View Article : Google Scholar : PubMed/NCBI
|
|
9
|
Watanabe A, Ojima H, Suzuki S, Mochida Y,
Hirayama I, Hosouchi Y, Nishida Y, Kashiwabara K, Ohno T, Mochiki E
and Kuwano H: An individual with gastric schwannoma with
pathologically malignant potential surviving two years after
laparoscopy-assisted partial gastrectomy. Case Rep Gastroenterol.
5:502–507. 2011. View Article : Google Scholar : PubMed/NCBI
|
|
10
|
Zuo HD, Zhang XM and Zhai ZH: Nerve Sheath
tumor of stomach: Two Cases Report. J Med Cases. 3:68–72. 2012.
|
|
11
|
Ludwig DJ and Traverso LW: Gut stromal
tumors and their clinical behavior. Am J Surg. 173:390–394. 1997.
View Article : Google Scholar : PubMed/NCBI
|
|
12
|
Janowitz P, Meier F and Reisig J: Gastric
schwannoma as a rare differential diagnosis of pleural effusion. Z
Gastroenterol. 40:925–928. 2002. View Article : Google Scholar : PubMed/NCBI
|
|
13
|
Choi JW, Choi D, Kim KM, Sohn TS, Lee JH,
Kim HJ and Lee SJ: Small submucosal tumors of the stomach:
Differentiation of gastric schwannoma from gastrointestinal stromal
tumor with CT. Korean J Radiol. 13:425–433. 2012. View Article : Google Scholar : PubMed/NCBI
|
|
14
|
Choi YR, Kim SH, Kim SA, Shin CI, Kim HJ,
Kim SH, Han JK and Choi BI: Differentiation of large (≥5 cm)
gastrointestinal stromal tumors from benign subepithelial tumors in
the stomach: Radiologists' performance using CT. Eur J Radiol.
83:250–260. 2014. View Article : Google Scholar : PubMed/NCBI
|
|
15
|
Hou YY, Tan YS, Xu JF, Wang XN, Lu SH, Ji
Y, Wang J and Zhu XZ: Schwannoma of the gastrointestinal tract: A
clinicopathological, immunohistochemical and ultrastructural study
of 33 cases. Histopathology. 48:536–545. 2006. View Article : Google Scholar : PubMed/NCBI
|
|
16
|
Atmatzidis S, Chatzimavroudis G, Dragoumis
D, Tsiaousis P, Patsas A and Atmatzidis K: Gastric schwannoma: A
case report and literature review. Hippokratia. 16:280–282.
2012.PubMed/NCBI
|
|
17
|
Prévot S, Bienvenu L, Vaillant JC and de
Saint-Maur PP: Benign schwannoma of the digestive tract: A
clinicopathologic and immunohistochemical study of five cases,
including a case of esophageal tumor. Am J Surg Pathol. 23:431–436.
1999. View Article : Google Scholar : PubMed/NCBI
|