Introduction
Peroxisome proliferator-activated receptor γ
coactivator 1α (PGC1α) regulates metabolism (1,2),
mitochondrial biogenesis and energy homeostasis (3,4). A number
of studies have reported PGC1α as a central regulator of
thermogenesis, mitochondrial biogenesis and adaptation to fasting
in brown adipose tissue, skeletal muscle, cardiac muscle and the
liver (1,5). By contrast, PGC1α in the central nervous
system is less associated with energy state or thermogenesis
(6). PGC1α expression in the central
nervous system is high in the embryonic and early postnatal stages,
but is decreased during maturation. PGC1α is expressed mostly by
γ-aminobutyric acid-ergic neurons; however, a low level of PGC1α is
also expressed in glia in the mature brain (7). There is a significant association
between PGC1α and the metabolism of reactive oxygen species.
PGC1α-null mice are considerably more sensitive to the
neurodegenerative effects of the oxidative stressors
1-methyl-4-phenyl-1,2,3,6-tetrahydropyridine and kainic acid, which
suggests that PGC1α has a role in cellular antioxidant defense
(8).
Numerous clinical studies have reported a
significant association between PGC1α and a number of types of
cancer. In breast, colon and ovarian cancer (9–12), a
significant decrease in PGC1α expression accelerated the ‘Warburg
effect’, which allows cancer cells to switch from mitochondrial to
glycolytic metabolism to meet the metabolic requirements of
proliferation (13). By contrast,
increased PGC1α expression is present in melanoma, with a
corresponding decrease in patient survival (14). The role of PGC1α in a number of cancer
types remains unclear and warrants further studies.
Glioblastoma multiforme (GBM) is the most prevalent
and invasive type of brain tumor. It aggressively infiltrates and
spreads to the surrounding brain tissue via extensive microvascular
proliferation. Numerous necrotic areas surrounded by palisading
tumor cells are often observed (15).
Although novel therapeutic strategies and improved clinical
diagnostics have been introduced, GBM remains one of the most fatal
diseases (16). An extensive amount
of research has been performed to determine the mechanisms of
unlimited proliferation in GBM, as well as its robust resistance to
existing drugs and therapies (17,18) In the
present study, the expression of PGC1α in normal cortical tissues
and GBM tissues was compared. The results of the present study
indicate that PGC1α may be a novel biomarker for GBM, as well as a
novel target for future GBM therapy development.
Materials and methods
Patient samples
All experiments were performed in accordance with
approved guidelines of Chungnam National University Hospital (CNUH;
Daejeon, Republic of Korea). The Institutional Review Board of the
CNUH approved the experimental protocols and all patients provided
written informed consent prior to surgery. A total of 49 patients
undergoing tumor resection surgeries at the Department of
Neurosurgery, CNUH were enrolled, and pathological diagnoses were
confirmed by the Department of Pathology, CNUH via
immunohistochemistry. First-time GBM diagnosis was used as the
selection criterion, resulting in 26 patient samples that were
included in the present study (Table
I). The mean age of the patients was 58 years (range, 35 to 74
years). Normal brain tissue samples were obtained from cadavers or
from autopsies of surrounding normal brain tissues of consenting
GBM patients that underwent surgery (approval no. CNUH
2013-11-006).
 | Table I.Patient demographics and tumor
characteristics. |
Table I.
Patient demographics and tumor
characteristics.
| Case no. | Agea (years) | Gender | Pathological
diagnosis | Ki-67 (%) | Resection area |
|---|
| 1 | 64 | M | GBM | 20 | Left, parietal
lobe |
| 2 | 56 | F | GBM | 20 | Right, frontal
lobe |
| 3 | 58 | M | GBM | 20 | Left, temporal
lobe |
| 4 | 60 | M | GBM | 20 | Left, temporal
lobe |
| 5 | 40 | M | GBM | 20 | Left, frontal
lobe |
| 6 | 35 | M | GBM | 20 | Left, frontal
lobe |
| 7 | 56 | F | GBM | 20 | Right, frontal
lobe |
| 8 | 63 | M | GBM | 20 | Right, parietal
lobe |
| 9 | 72 | M | GBM | 20 | Right, occipital
lobe |
| 10 | 66 | F | GBM | 40 | Left, parietal
lobe |
| 11 | 49 | F | GBM | 15 | Left, temporal
lobe |
| 12 | 44 | M | Giant cell GBM | 40 | Right, frontal
lobe |
| 13 | 77 | F | GBM | 40 | Right frontal
lobe |
| 14 | 55 | M | GBM cerebri | 20 | Right, frontal
lobe |
| 15 | 71 | F | GBM | 90 | Right, parietal
lobe |
| 16 | 51 | M | GBM | 30 | Left, temporal
lobe |
| 17 | 56 | M | GBM | 20 | Right,
midbrain |
| 18 | 61 | M | GBM | 30 | Left, temporal
lobe |
| 19 | 52 | F | GBM | 30 | Left, parietal
lobe |
| 20 | 45 | M | GBM | 40 | Right, temporal
lobe |
| 21 | 71 | F | GBM | 30 | Right, frontal
lobe |
| 22 | 55 | M | GBM | 20 | Left, temporal
lobe |
| 23 | 52 | M | GBM | 50 | Left, parietal
lobe |
| 24 | 57 | M | GBM | 40 | Right, temporal
lobe |
| 25 | 74 | M | GBM | 40 | Right, parietal
lobe |
| 26 | 74 | M | GBM | 25 | Left, insular |
Tissue microarray and
immunostaining
Tissue microarrays (TMA) were used to perform the
comparative histological analysis of normal brain and GBM tissues.
The paraffin-embedded sample tissues were de-paraffinized and
rehydrated in a graded alcohol series. Tissues were retrieved using
0.01 M citrate buffer (pH 6.0) and heated in a microwave vacuum
histoprocessor (RHS-1; Milestone Medical, Bergamo, Italy) at a
controlled temperature of 121°C for 15 min. Following washing with
phosphate-buffered saline (pH 7.4), tissue sections were incubated
with anti-PGC1α antibody (1:200; Santa Cruz Biotechnology, Inc.,
Dallas, TX, USA; #SC13067) overnight in a humidity chamber at 4°C.
Immunohistochemical staining of the tissue sections was performed
using avidin-biotin peroxidase complex as previously described
(19,20). Additional TMA samples of normal cortex
and GBM tissues were obtained from US Biomax, Inc. (Rockville, MD,
USA).
All immunostaining was performed with antibodies
that detected the N-terminal epitope of PGC1α (1:200; Santa Cruz
Biotechnology, Inc.; #sc-13067). For immunofluorescence analysis,
PGC1α and COX4 (1:200; Cell Signaling Technology, Inc., Danvers,
MA, USA; #4D11-B3-E8) were used as above but with either a
Cy3-conjugated antibody (1:500; anti-rabbit; GE Healthcare Life
Sciences Chalfont, UK; #PA43004) or a Cy2-conjugated secondary
antibody (1:200; anti-mouse; GE Healthcare Life Sciences;
#PA42002). Cell nuclei were visualized with DAPI, and
double-stained sections were visualized using an Axiophot
microscope (Carl Zeiss AG, Oberkochen, Germany).
Bioinformatics
The mRNA expression of 18,988 probes from 38 GBM
cell lines was analyzed using the publicly available Broad-Novartis
Cancer Cell Line Encyclopedia (CCLE) database (https://portals.broadinstitute.org/ccle/home)
(21). The level of PGC1α mRNA
expression among the 38 GBM cell lines was determined using CCLE.
The mRNA expression data was normalized using the RankNormalize
module in GenePattern (http://www.broadinstitute.org/cancer/software/genepattern).
Gene Neighbors and Class Neighbors modules in GenePattern
(http://www.broadinstitute.org/cancer/software/genepattern)
were used to select genes that were closely associated with PGC1α
(22). Hierarchical clustering was
performed using complete linkage and Pearson rank-correlation
distance with software provided by GenePattern
(HierarchicalClustering; version 6). The colors in the heat-maps
show the relative gene expression compared to the mean expression,
with red being higher and blue lower. From the 18,988 gene set, 100
genes that were most correlated with PGC1α were selected for
classification by Gene Ontology Enrichment Analysis (GO terms)
using Database for Annotation, Visualization and Integrated
Discovery (DAVID; http://david.abcc.ncifcrf.gov) (23). Differentially expressed genes (DEGs)
were classified according to GO terms based on their biological
process, molecular function or cellular component. DAVID provided
an overview of extensive pathways (www.biocarta.com) in which various genes interacted,
as well as the number of DEGs per pathway with a P-value
representing gene enrichment. Gene enrichment score with P<0.05
represents a strong association rather than random chance (23). For genes with unknown biological
processes, GeneMANIA database (http://www.genemania.org) was used to predict their
function (24).
Statistical analysis
ImageJ software (version 1.47; National Institutes
of Health, Bethesda, MD, USA) was used to quantify the optical
density (pixels/mm2) or the intensity of images. The
results from immunohistochemical staining were analyzed by a paired
t-test between two groups. Data were presented as the mean ±
standard error. Statistical analyses were performed using the Prism
5.0 software (GraphPad Prism Software, Inc., La Jolla, CA, USA).
P<0.05 was considered to indicate a statistically significant
difference. Data transformation (log conversion) selection and
statistical analyses were performed with either the Microsoft Excel
11.0 (Microsoft Corporation, Redmond, WA, USA) or Prism 5.0
software.
Results
PGC1α is highly and variably expressed
in GBM patients
To determine the association between PGC1α and GBM,
levels of PGC1α protein in GBM and control (normal cortex) tissues
were compared using publicly available TMAs from US Biomax, Inc.
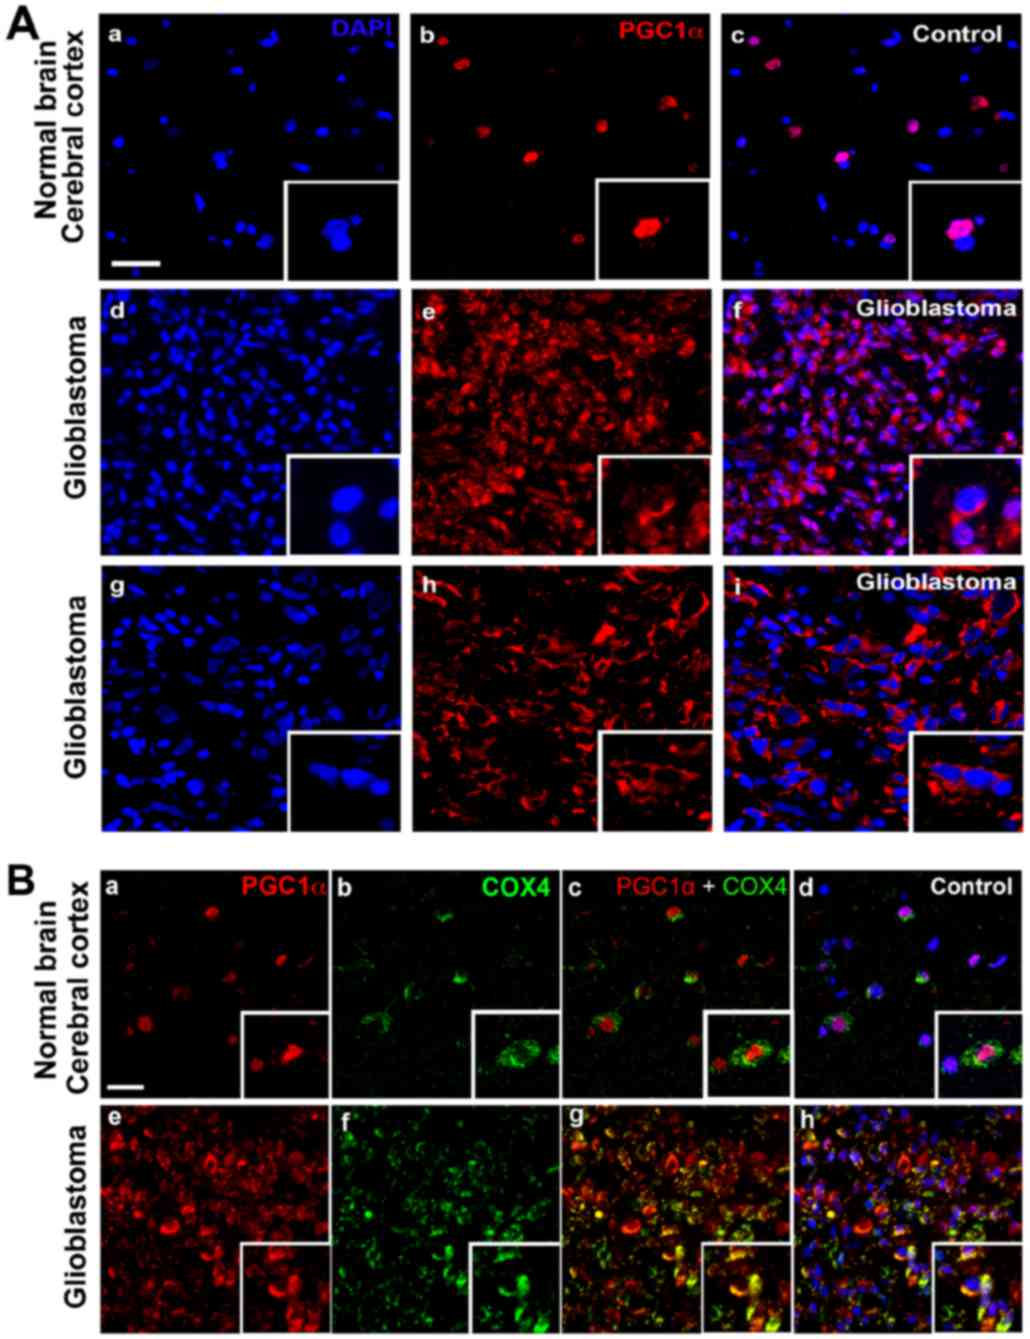
(Fig. 1). PGC1α was weakly detectable
in the nuclei of cortical tissues in the control, whereas it was
highly and sporadically expressed throughout the GBM tissues.
Furthermore, PGC1α was mostly expressed within the cytoplasm with
pale nucleic density (Fig. 1A).
Bright-field immunohistochemical analysis of TMA images using a
densitometer revealed that PGC1α expression varied between tumor
samples (Fig. 1B).
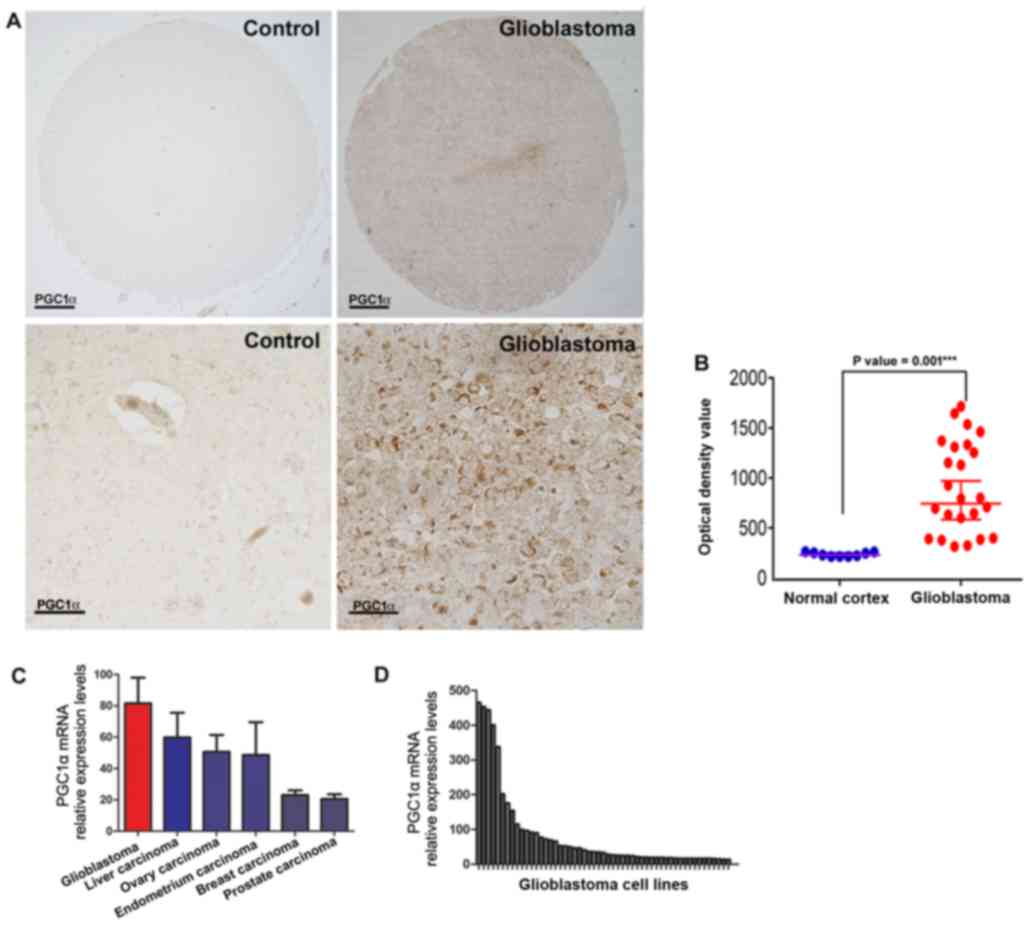 | Figure 1.Expression level of PGC1α in
glioblastoma multiforme and normal cortex. (A) Representative
immunohistochemical analysis of PGC1α expression from the US
Biomax, Inc. TMA database. Scale bar: 100 µm (upper panels) and 20
µm (lower panels). (B) Corrected optical density values of PGC1α in
normal cortex tissues and glioblastoma tissues from the US Biomax,
Inc. TMA database (unpaired t-test, ± SEM; ***P<0.001). (C)
Relative mRNA expression of PGC1α across various cancer types in
the CCLE database. Error bars: mean ± SEM in glioblastoma (n=38),
liver carcinoma (n=28), ovary carcinoma (n=52), endometrium
carcinoma (n=27), breast carcinoma (n=59) and prostate carcinoma
(n=8). (D) Relative expression values of PGC1α mRNA among 38
glioblastoma multiforme cell lines in the CCLE database. CCLE,
cancer cell line encyclopedia; PGC1α, peroxisome
proliferator-activated receptor γ, coactivator 1α; TMA, tissue
microarrays; SEM, standard error of the mean. |
For additional validation, PGC1α mRNA levels
were determined in GBM cell lines (n=38) using the Broad-Novartis
CCLE database (21). Comparative
analysis of PGC1α expression in GBM and five other types of
cancer, including liver, ovarian, endometrial, breast and prostate
carcinoma revealed that although there were variations in
PGC1α mRNA expression between the GBM cell lines (Fig. 1D), the level of expression was
increased in GBM compared to other cancer cell lines (Fig. 1C). Overall, these data demonstrate
that PGC1α expression was increased in a subpopulation of
GBM cells.
PGC1α is localized to the mitochondria
in GBM
As a transcriptional coactivator, PGC1α is reported
to be localized in the nuclei of the normal cortex (25). However, immunofluorescence analysis
demonstrated localization of PGC1α in the perinuclear or
cytoplasmic areas of GBM tissues (Fig.
2A). To confirm the subcellular localization of PGC1α, double
staining with anti-PGC1α and anti-COX4 (a mitochondrial marker)
antibodies was employed. There was a certain level of
colocalization of PGC1α and COX4, thereby indicating that PGC1α was
expressed in the mitochondria in GBM in addition to the perinuclear
or cytoplasmic areas (Fig. 2B).
Gene Neighbors of PGC1α
Bioinformatics analysis of PGC1α-associated genes
was performed. PGC1α mRNA expression levels detected in the GBM
cell lines (n=38; Table II) ranged
from 3.71 (log2) to 8.83 (log2), which
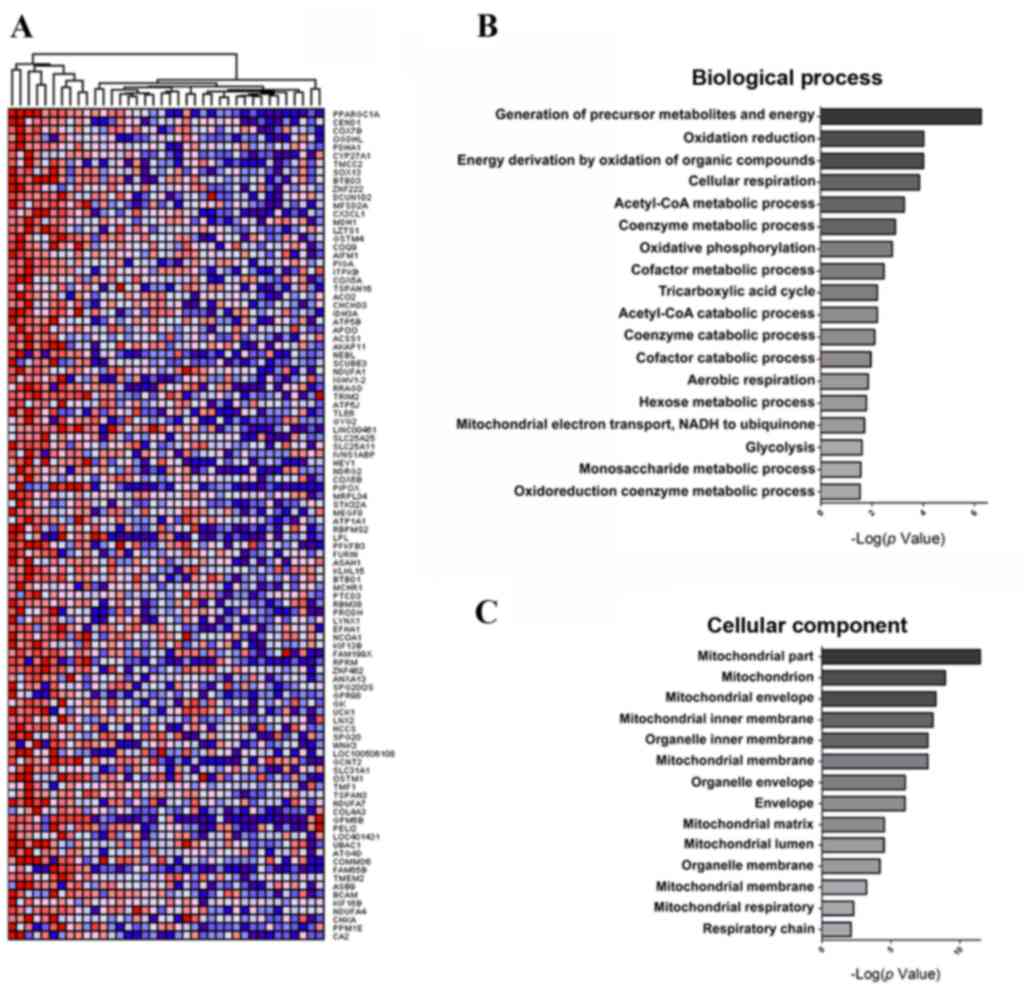
corresponds to a fold-change of 2.38. A total of 100 genes that
were strongly correlated with PGC1α were selected using Gene
Neighbors (Fig. 3A) and classified
using DAVID (23). Genes with
significant differences (P<0.05) were classified into two groups
based on GO terms: Biological process and cellular components
(Tables III and IV). Genes highly expressed in GBM cell
lines were largely associated with the generation of metabolite
precursors and energy (e.g., the hexose or monosaccharide metabolic
processes), oxidation reduction (e.g., mitochondrial electron
transport, nicotinamide adenine dinucleotide to ubiquinone and the
oxidoreduction coenzyme metabolic process), energy derivation by
the oxidation of organic compounds [e.g., acetyl-CoA metabolic and
catabolic processes, oxidative phosphorylation, tricarboxylic acid
(TCA) cycle, aerobic respiration and glycolysis, and coenzyme
metabolic and catabolic processes (e.g., cofactor catabolic
process) (Fig. 3B). Notably, highly
expressed genes were associated with the mitochondria (e.g.,
mitochondrial membrane, mitochondrial matrix and mitochondrial
respiratory chain), organelle membranes (e.g., organelle inner
membrane) and the cellular envelope (Fig.
3C). This observation is in agreement with the finding that
PGC1α is localized in the mitochondria in GBM as previously
described.
| Table II.List of GBM cell lines. |
Table II.
List of GBM cell lines.
| GBM cell lines | PGC1α mRNA |
|---|
| LNZ308 | 8.83 |
| LN464 | 8.79 |
| DBTRG05MG | 8.65 |
| LN235 | 8.40 |
| SNU626 | 7.65 |
| GB1 | 7.45 |
| YKG1 | 6.64 |
| U343 | 6.59 |
| LN428 | 6.52 |
| SNB19 | 6.49 |
| GMS10 | 6.27 |
| LN340 | 6.17 |
| KNS81 | 6.11 |
| 8MGBA | 5.72 |
| SNU201 | 5.63 |
| T98G | 5.53 |
| YH13 | 5.33 |
| LN382 | 5.19 |
| CAS1 | 5.11 |
| U178 | 4.71 |
| SF295 | 4.69 |
| SNU1105 | 4.62 |
| SNU489 | 4.60 |
| DKMG | 4.42 |
| BECKER | 4.30 |
| 42MGBA | 4.29 |
| KG1C | 4.22 |
| A172 | 4.17 |
| LN443 | 4.13 |
| LN215 | 4.09 |
| AM38 | 4.04 |
| LN18 | 4.04 |
| M059K | 4.02 |
| LN229 | 4.00 |
| KNS60 | 4.00 |
| SF172 | 3.84 |
| SNU466 | 3.74 |
| KS1 | 3.71 |
| Table III.List of Gene Neighbors of peroxisome
proliferator-activated receptor γ coactivator 1α differentially
expressed in glioblastoma multiforme cells. |
Table III.
List of Gene Neighbors of peroxisome
proliferator-activated receptor γ coactivator 1α differentially
expressed in glioblastoma multiforme cells.
| Gene symbol | Description |
|---|
| Generation of
precursor metabolites and energy |
|
|
ATP5J | ATP synthase,
H+ transporting, mitochondrial Fo complex, subunit
F6 |
|
ATP5B | ATP synthase,
H+ transporting, mitochondrial F1 complex, β
polypeptide |
|
NDUFA1 | NADH dehydrogenase
(ubiquinone) 1α subcomplex, 1, 7.5 kDa |
|
NDUFA4 | NADH dehydrogenase
(ubiquinone) 1α subcomplex, 4, 9 kDa |
|
NDUFA7 | NADH dehydrogenase
(ubiquinone) 1α subcomplex, 7, 14.5 kDa |
|
ACO2 | Aconitase 2,
mitochondrial |
|
GYG2 | Glycogenin 2 |
|
IDH3A | Isocitrate
dehydrogenase 3 (NAD+) α |
|
MDH1 | Malate
dehydrogenase 1, NAD (soluble) |
|
MCHR1 |
Melanin-concentrating hormone receptor
1 |
|
OGDHL | Oxoglutarate
dehydrogenase-like |
|
PDHA1 | Pyruvate
dehydrogenase (lipoamide) α 1 |
| Oxidation
reduction |
|
|
NDUFA1 | NADH dehydrogenase
(ubiquinone) 1α subcomplex, 1, 7.5 kDa |
|
NDUFA4 | NADH dehydrogenase
(ubiquinone) 1α subcomplex, 4, 9 kDa |
|
NDUFA7 | NADH dehydrogenase
(ubiquinone) 1α subcomplex, 7, 14.5 kDa |
|
AIFM1 | Apoptosis-inducing
factor, mitochondrion-associated, 1 |
|
CYP27A1 | Cytochrome p450,
family 27, subfamily A, polypeptide 1 |
|
COX5A | Cytochrome c
oxidase subunit Va |
|
HCCS | Holocytochrome c
synthase |
|
IDH3A | Isocitrate
dehydrogenase 3 (NAD+) α |
|
MDH1 | Malate
dehydrogenase 1, NAD (soluble) |
|
OGDHL | Oxoglutarate
dehydrogenase-like |
|
PIPOX | Pipecolic acid
oxidase |
|
PRODH | Proline
dehydrogenase (oxidase) 1 |
|
PDHA1 | Pyruvate
dehydrogenase (lipoamide) α 1 |
| Energy derivation
by oxidation of organic compounds |
|
|
NDUFA1 | NADH dehydrogenase
(ubiquinone) 1α subcomplex, 1, 7.5 kDa |
|
NDUFA4 | NADH dehydrogenase
(ubiquinone) 1α subcomplex, 4, 9 kDa |
|
NDUFA7 | NADH dehydrogenase
(ubiquinone) 1α subcomplex, 7, 14.5 kDa |
|
ACO2 | Aconitase 2,
mitochondrial |
|
GYG2 | Glycogenin 2 |
|
IDH3A | Isocitrate
dehydrogenase 3 (NAD+) α |
|
MDH1 | Malate
dehydrogenase 1, NAD (soluble) |
| Cellular
respiration |
|
|
NDUFA1 | NADH dehydrogenase
(ubiquinone) 1α subcomplex, 1, 7.5 kDa |
|
NDUFA4 | NADH dehydrogenase
(ubiquinone) 1α subcomplex, 4, 9 kDa |
|
NDUFA7 | NADH dehydrogenase
(ubiquinone) 1α subcomplex, 7, 14.5 kDa |
|
ACO2 | Aconitase 2,
mitochondrial |
|
IDH3A | Isocitrate
dehydrogenase 3 (NAD+) α |
|
MDH1 | Malate
dehydrogenase 1, NAD (soluble) |
| Acetyl-CoA
metabolic process |
|
|
ACO2 | Aconitase 2,
mitochondrial |
|
ACSS1 | Acyl-CoA synthetase
short-chain family member 1 |
|
IDH3A | Isocitrate
dehydrogenase 3 (NAD+) α |
|
MDH1 | Malate
dehydrogenase 1, NAD (soluble) |
| Coenzyme metabolic
process |
|
|
ACO2 | Aconitase 2,
mitochondrial |
|
ACSS1 | Acyl-CoA synthetase
short-chain family member 1 |
|
IDH3A | Isocitrate
dehydrogenase 3 (NAD+) α |
|
MDH1 | Malate
dehydrogenase 1, NAD (soluble) |
| Oxidation
phosphorylation |
|
|
ATP5J | ATP synthase,
H+ transporting, mitochondrial Fo complex, subunit
F6 |
|
ATP5B | ATP synthase,
H+ transporting, mitochondrial F1 complex, β
polypeptide |
|
NDUFA1 | NADH dehydrogenase
(ubiquinone) 1 α subcomplex, 1, 7.5 kDa |
|
NDUFA4 | NADH dehydrogenase
(ubiquinone) 1 α subcomplex, 4, 9 kDa |
|
NDUFA7 | NADH dehydrogenase
(ubiquinone) 1 α subcomplex, 7, 14.5 kDa |
| Cofactor metabolic
process |
|
|
ACO2 | Aconitase 2,
mitochondrial |
|
ACSS1 | Acyl-CoA synthetase
short-chain family member 1 |
|
COQ9 | Coenzyme Q9 homolog
(S. cerevisiae) |
|
IDH3A | Isocitrate
dehydrogenase 3 (NAD+) α |
|
MDH1 | Malate
dehydrogenase 1, NAD (soluble) |
|
PIPOX | Pipecolic acid
oxidase |
| Acetyl-CoA
catabolic process |
|
|
ACO2 | Aconitase 2,
mitochondrial |
|
IDH3A | Isocitrate
dehydrogenase 3 (NAD+) α |
|
MDH1 | Malate
dehydrogenase 1, NAD (soluble) |
| Tricarboxylic acid
cycle |
|
|
ACO2 | Aconitase 2,
mitochondrial |
|
IDH3A | Isocitrate
dehydrogenase 3 (NAD+) α |
|
MDH1 | Malate
dehydrogenase 1, NAD (soluble) |
| Coenzyme catabolic
process |
|
|
ACO2 | Aconitase 2,
mitochondrial |
|
IDH3A | Isocitrate
dehydrogenase 3 (NAD+) α |
|
MDH1 | Malate
dehydrogenase 1, NAD (soluble) |
| Cofactor catabolic
process |
|
|
ACO2 | Aconitase 2,
mitochondrial |
|
IDH3A | Isocitrate
dehydrogenase 3 (NAD+) α |
|
MDH1 | Malate
dehydrogenase 1, NAD (soluble) |
| Aerobic
respiration |
|
|
ACO2 | Aconitase 2,
mitochondrial |
|
IDH3A | Isocitrate
dehydrogenase 3 (NAD+) α |
|
MDH1 | Malate
dehydrogenase 1, NAD (soluble) |
| Hexose metabolic
process |
|
|
PFKFB3 |
6-phosphofructo-2-kinase/fructose-2,6-biphosphatase
3 |
|
GYG2 | Glycogenin 2 |
|
MDH1 | Malate
dehydrogenase 1, NAD (soluble) |
|
OGDHL | Oxoglutarate
dehydrogenase-like |
|
PDHA1 | Pyruvate
dehydrogenase (lipoamide) α 1 |
| Mitochondrial
electron transport, |
|
| NADH to
ubiquinone |
|
|
NDUFA1 | NADH dehydrogenase
(ubiquinone) 1 α subcomplex, 1, 7.5 kDa |
|
NDUFA4 | NADH dehydrogenase
(ubiquinone) 1 α subcomplex, 4, 9 kDa |
|
NDUFA7 | NADH dehydrogenase
(ubiquinone) 1 α subcomplex, 7, 14.5 kDa |
| Glycolysis |
|
|
MDH1 | Malate
dehydrogenase 1, NAD (soluble) |
|
OGDHL | Oxoglutarate
dehydrogenase-like |
|
PDHA1 | Pyruvate
dehydrogenase (lipoamide) α 1 |
| Monosaccharide
metabolic process |
|
|
PFKFB3 |
6-phosphofructo-2-kinase/fructose-2,6-biphosphatase
3 |
|
GYG2 | Glycogenin 2 |
|
MDH1 | Malate
dehydrogenase 1, NAD (soluble) |
|
OGDHL | Oxoglutarate
dehydrogenase-like |
|
PDHA1 | Pyruvate
dehydrogenase (lipoamide) α 1 |
| Oxidoreduction
coenzyme metabolic process |
|
|
COQ9 | Coenzyme Q9 homolog
(S. cerevisiae) |
|
IDH3A | Isocitrate
dehydrogenase 3 (NAD+) α |
|
MDH1 | Malate
dehydrogenase 1, NAD (soluble) |
| Unknown biological
process |
|
|
CEND1 | Cell cycle exit and
neuronal differentiation 1 |
|
COX7B | Cytochrome c
oxidase subunit VIIb |
|
TMCC2 | Transmembrane and
coiled-coil domain family 2 |
|
SOX13 | SRY (sex
determining region Y)-box 13 |
|
BTBD3 | BTB (POZ) domain
containing 3 |
|
ZNF222 | Zinc finger protein
222 |
|
DCUN1D2 | DCN1, defective in
cullin neddylation 1, domain containing 2 |
|
MFSD2A | Major facilitator
superfamily domain containing 2A |
|
CX3CL1 | Chemokine (C-X3-C
motif) ligand 1 |
|
GSTM4 | Glutathione
S-transferase mu 4 |
|
PIGA |
Phosphatidylinositol glycan anchor
biosynthesis, class A |
|
ITPKB |
Inositol-trisphosphate 3-kinase B |
|
TSPAN16 | Tetraspanin 16 |
|
CHCHD3 |
Coiled-coil-helix-coiled-coil-helix domain
containing 3 |
|
APOO | Apolipoprotein
O |
|
AKAP11 | A kinase (PRKA)
anchor protein 11 |
|
NEBL | Nebulette |
|
SCUBE3 | Signal peptide, CUB
domain, EGF-like 3 |
|
RRAGD | Ras-related GTP
binding D |
|
IGHV1-2 | Immunoglobulin
heavy variable 1–2 |
|
RRAGD | Ras-related GTP
binding D |
|
TRIM2 | Tripartite motif
containing 2 |
|
TLE6 | Transducin-like
enhancer of split 6 (E(sp1) homolog, Drosophila) |
|
LINC00461 | Long intergenic
non-protein coding RNA 461 |
|
SLC25A25 | Solute carrier
family 25 (mitochondrial carrier; phosphate carrier), member
25 |
|
SLC25A11 | Solute carrier
family 25 (mitochondrial carrier; oxoglutarate carrier), member
11 |
|
IVNS1ABP | Influenza virus
NS1A binding protein |
|
HEY1 |
Hairy/enhancer-of-split related with YRPW
motif 1 |
|
NDRG2 | NDRG family member
2 |
|
COX5B | Cytochrome c
oxidase subunit Vb |
|
MRPL34 | Mitochondrial
ribosomal protein L34 |
|
STK32A | Serine/threonine
kinase 32A |
|
MEGF8 | Multiple
EGF-like-domains 8 |
|
ATP1A1 | ATPase,
Na+/K+ transporting, α 1 polypeptide |
|
RBPMS2 | RNA binding protein
with multiple splicing 2 |
|
LPL | Lipoprotein
lipase |
|
FURIN | Furin (paired basic
amino acid cleaving enzyme) |
|
ASAH1 | N-acylsphingosine
amidohydrolase (acid ceramidase) 1 |
|
KLHL15 | Kelch-like family
member 15 |
|
BTBD1 | BTB (POZ) domain
containing 1 |
|
PTCD3 | Pentatricopeptide
repeat domain 3 |
|
RBM38 | RNA binding motif
protein 38 |
|
LYNX1 | Ly6/neurotoxin
1 |
|
EFHA1 | Mitochondrial
calcium uptake 2 |
|
NCOA1 | Nuclear receptor
coactivator 1 |
|
KIF13B | Kinesin family
member 13B |
|
FAM199X | Family with
sequence similarity 199, X-linked |
|
RPRM | Reprimo, TP53
dependent G2 arrest mediator candidate |
|
ZNF462 | Zinc finger protein
462 |
|
ANXA13 | Annexin A13 |
|
SPG20OS | SPG20 opposite
strand |
|
GPR98 | G protein-coupled
receptor 98 |
|
GK | Glycerol
kinase |
|
UCK1 | Uridine-cytidine
kinase 1 |
|
LNX2 | Ligand of
numb-protein X 2 |
|
SPG20 | Spastic paraplegia
20 (Troyer syndrome) |
|
WNK3 | WNK lysine
deficient protein kinase 3 |
|
LOC100506108 | LOC100506108 |
|
GCNT2 | Glucosaminyl
(N-acetyl) transferase 2, I-branching enzyme (I blood group) |
|
SLC31A1 | Solute carrier
family 31 (copper transporter), member 1 |
|
OSTM1 | Osteopetrosis
associated transmembrane protein 1 |
|
TMF1 | TATA element
modulatory factor 1 |
|
TSPAN3 | Tetraspanin 3 |
|
COL4A3 | Collagen, type IV,
α3 (Goodpasture antigen) |
|
GPM6B | Glycoprotein
M6B |
|
PELI2 | Pellino E3
ubiquitin protein ligase family member 2 |
|
LOC401431 | LOC401431 |
|
UBAC1 | UBA domain
containing 1 |
|
ATG4D | Autophagy related
4D, cysteine peptidase |
|
COMMD6 | COMM domain
containing 6 |
|
FAM65B | Family with
sequence similarity 65, member B |
|
TMEM2 | Transmembrane
protein 2 |
|
ASB9 | Ankyrin repeat and
SOCS box containing 9 |
|
BCAM | Basal cell adhesion
molecule (Lutheran blood group) |
|
KIF16B | Kinesin family
member 16B |
|
CHKA | Choline kinase
α |
|
PPM1E | Protein
phosphatase, Mg2+/Mn2+ dependent, 1E |
|
CA2 | Carbonic anhydrase
II |
| Table IV.Annotated summary of Gene Neighbors
of peroxisome proliferator-activated receptor γ coactivator 1α. |
Table IV.
Annotated summary of Gene Neighbors
of peroxisome proliferator-activated receptor γ coactivator 1α.
| Functional
role | Genes | P-value | -Log (P-value) |
|---|
| Biological
process |
|
|
|
|
Generation of precursor
metabolites and energy | 12 |
5.50×10⁷ |
6.26 |
|
Oxidation reduction | 13 |
9.60×10⁵ |
4.02 |
| Energy
derivation by oxidation of organic compounds | 7 |
9.80×10⁵ |
4.01 |
|
Cellular respiration | 6 |
1.40×10⁴ |
3.85 |
|
Acetyl-CoA metabolic
process | 4 |
5.40×10⁴ |
3.27 |
|
Coenzyme metabolic
process | 6 |
1.20×10³ |
2.92 |
|
Oxidative phosphorylation | 5 |
1.60×10³ |
2.80 |
|
Cofactor metabolic
process | 6 |
3.40×10³ |
2.47 |
|
Tricarboxylic acid cycle | 3 |
6.20×10³ |
2.21 |
|
Acetyl-CoA catabolic
process | 3 |
6.20×10³ |
2.21 |
|
Coenzyme catabolic
process | 3 |
7.90×10³ |
2.10 |
|
Cofactor catabolic
process | 3 |
1.10×10² |
1.96 |
| Aerobic
respiration | 3 |
1.40×10² |
1.85 |
| Hexose
metabolic process | 5 |
1.70×10² |
1.77 |
|
Mitochondrial electron
transport, NADH to ubiquinone | 3 |
2.00×10² |
1.70 |
|
Glycolysis | 3 |
2.50×10² |
1.60 |
|
Monosaccharide metabolic
process | 5 |
2.80×10² |
1.55 |
|
Oxidoreduction coenzyme
metabolic process | 3 |
3.00×10² |
1.52 |
| Cellular
component |
|
|
|
|
Mitochondrial part | 22 |
3.40×10¹² | 11.47 |
|
Mitochondrion | 25 |
1.20×10⁹ |
8.92 |
|
Mitochondrial envelope | 16 |
5.90×10⁹ |
8.23 |
|
Mitochondrial inner
membrane | 14 |
9.20×10⁹ |
8.04 |
|
Mitochondrial membrane | 15 |
2.20×10⁸ |
7.66 |
|
Organelle inner membrane | 14 |
2.20×10⁸ |
7.66 |
|
Organelle envelope | 16 |
9.80×10⁷ |
6.01 |
|
Envelope | 16 |
1.00×10⁶ |
6.00 |
|
Mitochondrial lumen | 9 |
3.20×10⁵ |
4.49 |
|
Mitochondrial matrix | 9 |
3.20×10⁵ |
4.49 |
|
Organelle membrane | 18 |
6.40×10⁵ |
4.19 |
|
Mitochondrial membrane
part | 6 |
6.00×10⁴ |
3.22 |
|
Mitochondrial respiratory
chain | 4 |
5.20×10³ |
2.28 |
|
Respiratory chain | 4 |
8.00×10³ |
2.10 |
|
Respiratory chain complex
I | 3 |
2.20×10² |
1.66 |
|
Mitochondrial respiratory
chain complex I | 3 |
2.20×10² |
1.66 |
| NADH
dehydrogenase complex | 3 |
2.20×10² |
1.66 |
| Cell
surface | 6 |
4.20×10² |
1.38 |
|
Mitochondrial
proton-transporting ATP synthase complex | 2 |
9.90×10² |
1.00 |
PGC1α expression is highly correlated
with mitochondrial function in GBM
Two-way hierarchical clustering of targeted gene
sets was performed between five GBM cell lines with the highest
(LNZ308, LN464, DBTRG05MG, LN235 and SNU626) and lowest levels
(LN229, KNS60, SF172, SNU466 and KS1) of PGC1α expression. The
expression of TCA cycle-(P<0.0001), oxidative phosphorylation
(OXPHOS)-(P<0.0001) and lipogenesis-associated genes (P<0.01)
was significantly increased in the PGC1α-upregulated cells compared
with the PGC1α-downregulated cells (Fig.
4A-C). Furthermore, the expression of antioxidant-associated
genes was significantly increased in the PGC1α-upregulated cell
lines compared with the PGC1α-downregulated cell lines (Fig. 4D; P<0.0001). Taken together, the
data in Figs. 3 and 4 suggest that metabolic and mitochondrial
genes were highly expressed in parallel with PGC1α. Notably, genes
associated with mitochondrial functions, including TCA cycle,
OXPHOS, lipogenesis and antioxidant genes, were highly expressed in
cells with high PGC1α levels (Fig.
4), which corroborates the results from a recent study
(26) and the colocalization data as
previously described in the present study.
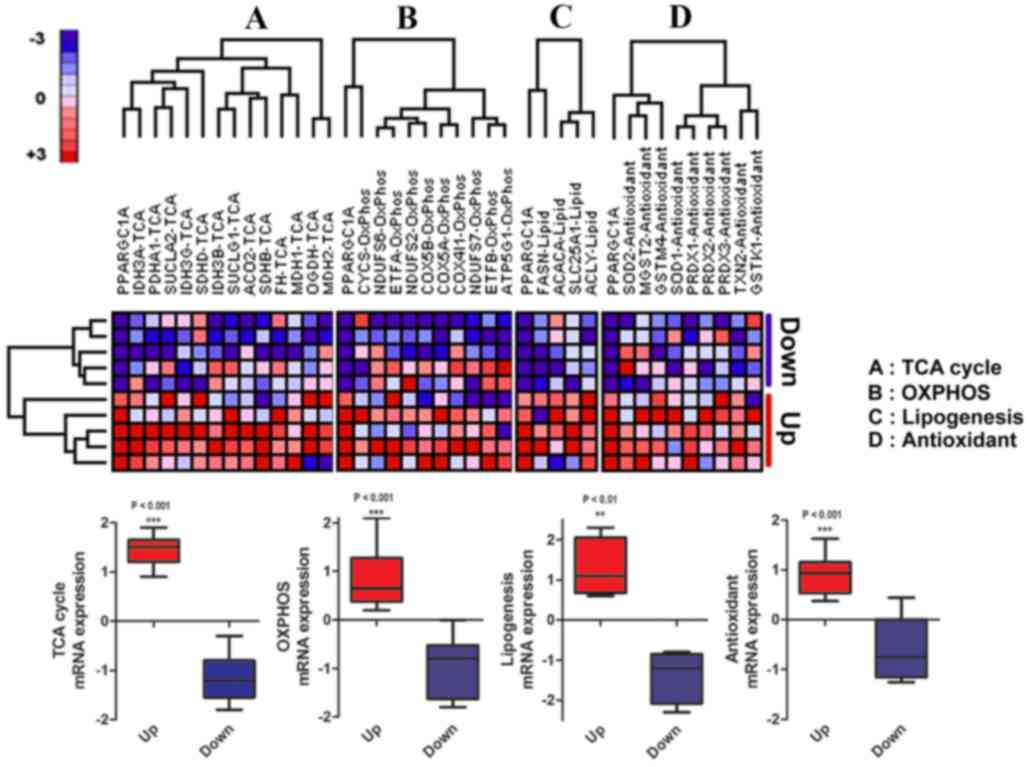 | Figure 4.Two-way hierarchical clustering of
target gene sets previously reported to be associated with PGC1α in
cancer. (A) TCA cycle genes (***P<0.001), (B) OXPHOS genes
(***P<0.001), (C) Lipogenesis genes (**P<0.01) and (D)
Antioxidant genes (***P<0.001) are differentially expressed
among the top five PGC1α up- and downregulated GBM cell lines. The
top five GBM cell lines are LNZ308, LN464, DBTRG05MG, LN235 and
SNU626. The bottom five GBM cell lines are LN229, KNS60, SF172,
SNU466 and KS1. Color in the heat-maps displays expression relative
to the mean expression value, with red indicating higher expression
and blue lower expression. Colors are displayed in a score ladder
from red to blue (+3 to −3, upper left panel). The obtained values
were analyzed statistically by paired t-test. GBM, glioblastoma
multiforme; OXPHOS, oxidative phosphorylation; PGC1α, peroxisome
proliferator-activated receptor γ, coactivator 1α; TCA,
tricarboxylic acid. |
Class Neighbors of PGC1α up- and
downregulated GBM cell lines
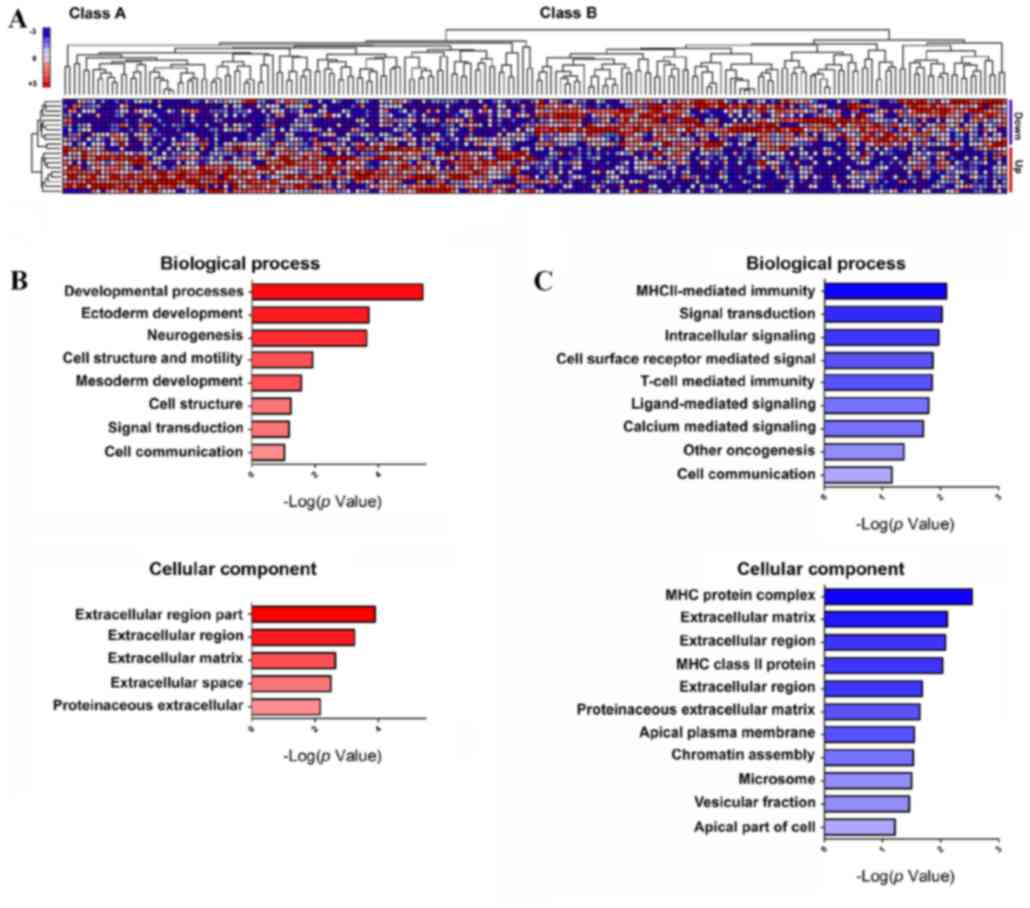
Bioinformatics analysis using Class Neighbors
yielded two classes of GBM cell lines. Class A contained the ten
most PGC1α-upregulated GBM cell lines, and class B contained the
ten most PGC1α-downregulated GBM cell lines (Fig. 5A). Out of a total of 18,988 probe
sets, 100 genes that were most strongly correlated with classes A
and B and most highly expressed were selected. DAVID analysis
classified these genes into three groups based on GO terms: i)
Biological process, ii) molecular function and iii) cellular
components (Fig. 5B and C; Tables V–VIII). GeneMANIA database analysis
resulted in the identification of 52 genes with previously unknown
biological interactions with PGC1α, including necdin (NDN).
| Table V.List of class A genes highly
expressed in peroxisome proliferator-activated receptor γ
coactivator 1α-upregulated glioblastoma multiforme cells. |
Table V.
List of class A genes highly
expressed in peroxisome proliferator-activated receptor γ
coactivator 1α-upregulated glioblastoma multiforme cells.
| Gene | Description | Score | P-value | Fold-change | Upa mean | Downamean |
|---|
| Developmental
processes |
|
|
|
|
|
|
CLEC2B | C-type lectin
domain family 2, member B | 2.63 |
3.2×10³ | 1.44 | 5.88 | 4.09 |
|
EFHD1 | EF-hand domain
family, member D1 | 2.22 |
4.4×10² | 1.31 | 6.03 | 4.61 |
|
EPHA3 | EPH receptor
A3 | 2.45 |
1.9×10² | 1.39 | 5.33 | 3.83 |
|
HHIPL2 | HHIP-like 2 | 3.52 |
2.6×10³ | 1.21 | 5.49 | 4.53 |
|
MAMDC2 | MAM domain
containing 2 | 2.49 |
2.2×10² | 1.42 | 6.76 | 4.77 |
|
POU3F2 | POU class 3
homeobox 2 | 2.54 |
2.6×10² | 1.40 | 7.20 | 5.15 |
|
BHLHE41 | Basic
helix-loop-helix family, member e41 | 2.92 |
6.2×10³ | 1.26 | 6.14 | 4.89 |
|
CDH6 | Cadherin 6, type 2,
K-cadherin (fetal kidney) | 2.80 |
1.1×10² | 1.35 | 5.83 | 4.31 |
|
CELSR2 | Cadherin, EGF LAG
seven-pass G-type receptor 2 | 2.80 |
1.2×10² | 1.21 | 7.78 | 6.42 |
|
CXCR4 | Chemokine (C-X-C
motif) receptor 4 | 2.55 |
1.5×10² | 1.44 | 6.04 | 4.20 |
|
CNIH3 | Cornichon family
AMPA receptor auxiliary protein 3 | 2.41 |
3.3×10² | 1.41 | 7.22 | 5.11 |
|
CCNA1 | Cyclin A1 | 2.56 |
1.1×10² | 1.32 | 5.71 | 4.32 |
|
FABP7 | Fatty acid binding
protein 7, brain | 2.26 |
3.1×10² | 1.57 | 6.87 | 4.38 |
|
FBLN1 | Fibulin 1 | 2.62 |
1.9×10² | 1.27 | 7.35 | 5.78 |
|
FOXA2 | Forkhead box
A2 | 2.18 |
6.2×10² | 1.36 | 5.56 | 4.09 |
|
GPM6B | Glycoprotein
M6B | 2.14 |
4.8×10² | 1.46 | 7.60 | 5.19 |
|
HES1 | Hairy and enhancer
of split 1, (Drosophila) | 3.29 |
4.2×10³ | 1.21 | 8.42 | 6.98 |
|
HEY1 |
Hairy/enhancer-of-split related with YRPW
motif 1 | 2.49 |
2.3×10² | 1.28 | 8.16 | 6.39 |
|
IRX1 | Iroquois homeobox
1 | 2.81 |
8.4×10³ | 1.48 | 6.61 | 4.47 |
|
JAG1 | Jagged 1 | 3.16 |
6.0×10³ | 1.22 | 7.89 | 6.48 |
|
MYL5 | Myosin, light chain
5, regulatory | 3.19 |
5.6×10³ | 1.25 | 6.73 | 5.40 |
|
NRG2 | Neuregulin 2 | 2.73 |
1.4×10² | 1.22 | 4.99 | 4.09 |
|
NRP2 | Neuropilin 2 | 2.75 |
1.2×10² | 1.25 | 6.74 | 5.40 |
|
PTHLH | Parathyroid
hormone-like hormone | 2.46 |
1.9×10² | 1.42 | 6.77 | 4.75 |
|
PRICKLE2 | Prickle homolog 2
(Drosophila) | 2.46 |
2.3×10² | 1.22 | 8.15 | 6.70 |
|
SALL1 | Sal-like 1
(Drosophila) | 2.41 |
2.5×10² | 1.36 | 6.83 | 5.04 |
|
SCUBE3 | Signal peptide, CUB
domain, EGF-like 3 | 2.63 |
3.6×10³ | 1.34 | 7.76 | 5.78 |
|
TLR4 | Toll-like receptor
4 | 2.82 |
9.8×10³ | 1.36 | 6.29 | 4.61 |
| Signal
transduction |
|
|
|
|
|
|
|
EPHA3 | EPH receptor
A3 | 2.45 |
1.9×10² | 1.39 | 5.33 | 3.83 |
|
GPR56 | G protein-coupled
receptor 56 | 3.00 |
9.4×10³ | 1.26 | 7.68 | 6.07 |
|
PDZRN3 | PDZ domain
containing ring finger 3 | 2.61 |
1.5×10² | 1.39 | 8.00 | 5.75 |
|
RASSF2 | Ras association
(RalGDS/AF-6) domain 2 family member | 3.25 |
1.0×10³ | 1.50 | 6.64 | 4.44 |
|
WNK3 | WNK lysine
deficient protein kinase 3 | 3.06 |
5.4×10³ | 1.21 | 5.25 | 4.36 |
|
CDH6 | Cadherin 6, type 2,
K-cadherin (fetal kidney) | 2.80 |
1.1×10² | 1.35 | 5.83 | 4.31 |
|
CELSR2 | Cadherin, EGF LAG
seven-pass G-type receptor 2 | 2.80 |
1.2×10² | 1.21 | 7.78 | 6.42 |
|
CXCR4 | Chemokine (C-X-C
motif) receptor 4 | 2.55 |
1.5×10² | 1.44 | 6.04 | 4.20 |
|
CX3CL1 | Chemokine (C-X3-C
motif) ligand 1 | 4.01 |
8.0×10⁴ | 1.26 | 5.89 | 4.67 |
|
CNIH3 | Cornichon family
AMPA receptor auxiliary protein 3 | 2.41 |
3.3×10² | 1.41 | 7.22 | 5.11 |
|
FABP7 | Fatty acid binding
protein 7, brain | 2.26 |
3.1×10² | 1.57 | 6.87 | 4.38 |
|
FBLN1 | Fibulin 1 | 2.62 |
1.9×10² | 1.27 | 7.35 | 5.78 |
|
FOXA2 | Forkhead box
A2 | 2.18 |
6.2×10² | 1.36 | 5.56 | 4.09 |
|
ITPR1 | Inositol
1,4,5-trisphosphate receptor, type 1 | 2.68 |
1.4×10² | 1.25 | 6.99 | 5.60 |
|
ITPKB |
Inositol-trisphosphate 3-kinase B | 2.60 |
1.9×10² | 1.20 | 6.69 | 5.58 |
|
NRG2 | Neuregulin 2 | 2.73 |
1.4×10² | 1.22 | 4.99 | 4.09 |
|
NPY1R | Neuropeptide Y
receptor Y1 | 2.00 |
5.5×10² | 1.41 | 5.73 | 4.08 |
|
NRP2 | Neuropilin 2 | 2.75 |
1.2×10² | 1.25 | 6.74 | 5.40 |
|
PDE4B | Phosphodiesterase
4B, cAMP-specific | 2.59 |
2.1×10² | 1.26 | 6.83 | 5.42 |
|
PDGFRL | Platelet-derived
growth factor receptor-like | 2.55 |
2.5×10² | 1.29 | 6.76 | 5.22 |
|
SFRP1 | Secreted
frizzled-related protein 1 | 2.33 |
3.5×10² | 1.42 | 7.77 | 5.46 |
|
SCG2 | Secretogranin
II | 2.50 |
2.0×10² | 1.43 | 8.08 | 5.64 |
|
SCUBE3 | Signal peptide, CUB
domain, EGF-like 3 | 2.63 |
3.6×10³ | 1.34 | 7.76 | 5.78 |
|
TLR4 | Toll-like receptor
4 | 2.82 |
9.8×10³ | 1.36 | 6.29 | 4.61 |
|
TMTC1 | Transmembrane and
tetratricopeptide repeat containing 1 | 2.43 |
2.5×10² | 1.29 | 6.10 | 4.72 |
| Ectoderm
development |
|
|
|
|
|
|
|
EPHA3 | EPH receptor
A3 | 2.45 |
1.9×10² | 1.39 | 5.33 | 3.83 |
|
CDH6 | Cadherin 6, type 2,
K-cadherin (fetal kidney) | 2.80 |
1.1×10² | 1.35 | 5.83 | 4.31 |
|
CELSR2 | Cadherin, EGF LAG
seven-pass G-type receptor 2 | 2.80 |
1.2×10² | 1.21 | 7.78 | 6.42 |
|
CXCR4 | Chemokine (C-X-C
motif) receptor 4 | 2.55 |
1.5×10² | 1.44 | 6.04 | 4.20 |
|
FABP7 | Fatty acid binding
protein 7, brain | 2.26 |
3.1×10² | 1.57 | 6.87 | 4.38 |
|
FOXA2 | Forkhead box
A2 | 2.18 |
6.2×10² | 1.36 | 5.56 | 4.09 |
|
GPM6B | Glycoprotein
M6B | 2.14 |
4.8×10² | 1.46 | 7.60 | 5.19 |
|
HES1 | Hairy and enhancer
of split 1, (Drosophila) | 3.29 |
4.2×10³ | 1.21 | 8.42 | 6.98 |
|
HEY1 |
Hairy/enhancer-of-split related with YRPW
motif 1 | 2.49 |
2.3×10² | 1.28 | 8.16 | 6.39 |
|
IRX1 | Iroquois homeobox
1 | 2.81 |
8.4×10³ | 1.48 | 6.61 | 4.47 |
|
JAG1 | Jagged 1 | 3.16 |
6.0×10³ | 1.22 | 7.89 | 6.48 |
|
NRG2 | Neuregulin 2 | 2.73 |
1.4×10² | 1.22 | 4.99 | 4.09 |
|
NRP2 | Neuropilin 2 | 2.75 |
1.2×10² | 1.25 | 6.74 | 5.40 |
| Cell structure and
motility |
|
|
|
|
|
|
|
CELSR2 | Cadherin, EGF LAG
seven-pass G-type receptor 2 | 2.80 |
1.2×10² | 1.21 | 7.78 | 6.42 |
|
CXCR4 | Chemokine (C-X-C
motif) receptor 4 | 2.55 |
1.5×10² | 1.44 | 6.04 | 4.20 |
|
COL7A1 | Collagen, type VII,
α 1 | 2.53 |
2.0×10² | 1.26 | 8.29 | 6.58 |
|
DCLK1 | Doublecortin-like
kinase 1 | 2.69 |
1.6×10² | 1.21 | 4.91 | 4.06 |
|
DNM3 | Dynamin 3 | 2.22 |
3.7×10² | 1.21 | 6.13 | 5.06 |
|
DYNC1I1 | Dynein, cytoplasmic
1, intermediate chain 1 | 2.85 |
1.1×10² | 1.42 | 7.89 | 5.55 |
|
FOXA2 | Forkhead box
A2 | 2.18 |
6.2×10² | 1.36 | 5.56 | 4.09 |
|
GPM6B | Glycoprotein
M6B | 2.14 |
4.8×10² | 1.46 | 7.60 | 5.19 |
|
ITPR1 | Inositol
1,4,5-trisphosphate receptor, type 1 | 2.68 |
1.4×10² | 1.25 | 6.99 | 5.60 |
|
JAG1 | Jagged 1 | 3.16 |
6.0×10³ | 1.22 | 7.89 | 6.48 |
|
MYL5 | Myosin, light chain
5, regulatory | 3.19 |
5.6×10³ | 1.25 | 6.73 | 5.40 |
|
PRICKLE2 | Prickle homolog 2
(Drosophila) | 2.46 |
2.3×10² | 1.22 | 8.15 | 6.70 |
|
SPP1 | Secreted
phosphoprotein 1 | 0.82 |
4.2×101 | 1.03 | 7.03 | 7.22 |
| Neurogenesis |
|
|
|
|
|
|
|
EPHA3 | EPH receptor
A3 | 2.45 |
1.9×10² | 1.39 | 5.33 | 3.83 |
|
CDH6 | Cadherin 6, type 2,
K-cadherin (fetal kidney) | 2.80 |
1.1×10² | 1.35 | 5.83 | 4.31 |
|
CELSR2 | Cadherin, EGF LAG
seven-pass G-type receptor 2 | 2.80 |
1.2×10² | 1.21 | 7.78 | 6.42 |
|
CXCR4 | Chemokine (C-X-C
motif) receptor 4 | 2.55 |
1.5×10² | 1.44 | 6.04 | 4.20 |
|
FOXA2 | Forkhead box
A2 | 2.18 |
6.2×10² | 1.36 | 5.56 | 4.09 |
|
GPM6B | Glycoprotein
M6B | 2.14 |
4.8×10² | 1.46 | 7.60 | 5.19 |
|
HES1 | Hairy and enhancer
of split 1, (Drosophila) | 3.29 |
4.2×10³ | 1.21 | 8.42 | 6.98 |
|
HEY1 |
Hairy/enhancer-of-split related with YRPW
motif 1 | 2.49 |
2.3×10² | 1.28 | 8.16 | 6.39 |
|
IRX1 | Iroquois homeobox
1 | 2.81 |
8.4×10³ | 1.48 | 6.61 | 4.47 |
|
JAG1 | Jagged 1 | 3.16 |
6.0×10³ | 1.22 | 7.89 | 6.48 |
|
NRG2 | Neuregulin 2 | 2.73 |
1.4×10² | 1.22 | 4.99 | 4.09 |
|
NRP2 | Neuropilin 2 | 2.75 |
1.2×10² | 1.25 | 6.74 | 5.40 |
| Cell
communication |
|
|
|
|
|
|
|
CDH6 | Cadherin 6, type 2,
K-cadherin (fetal kidney) | 2.80 |
1.1×10² | 1.35 | 5.83 | 4.31 |
|
CELSR2 | Cadherin, EGF LAG
seven-pass G-type receptor 2 | 2.80 |
1.2×10² | 1.21 | 7.78 | 6.42 |
|
FABP7 | Fatty acid binding
protein 7, brain | 2.26 |
3.1×10² | 1.57 | 6.87 | 4.38 |
|
FBLN1 | Fibulin 1 | 2.62 |
1.9×10² | 1.27 | 7.35 | 5.78 |
|
FOXA2 | Forkhead box
A2 | 2.18 |
6.2×10² | 1.36 | 5.56 | 4.09 |
|
ITPR1 | Inositol
1,4,5-trisphosphate receptor, type 1 | 2.68 |
1.4×10² | 1.25 | 6.99 | 5.60 |
|
NRG2 | Neuregulin 2 | 2.73 |
1.4×10² | 1.22 | 4.99 | 4.09 |
|
SFRP1 | Secreted
frizzled-related protein 1 | 2.33 |
3.5×10² | 1.42 | 7.77 | 5.46 |
|
SCG2 | Secretogranin
II | 2.50 |
2.0×10² | 1.43 | 8.08 | 5.64 |
|
SCUBE3 | Signal peptide, CUB
domain, EGF-like 3 | 2.63 |
3.6×10³ | 1.34 | 7.76 | 5.78 |
|
TMTC1 | Transmembrane and
tetratricopeptide repeat containing 1 | 2.43 |
2.5×10² | 1.29 | 6.10 | 4.72 |
| Mesoderm
development |
|
|
|
|
|
|
|
EFHD1 | EF-hand domain
family, member D1 | 2.22 |
4.4×10² | 1.31 | 6.03 | 4.61 |
|
EPHA3 | EPH receptor
A3 | 2.45 |
1.9×10² | 1.39 | 5.33 | 3.83 |
|
FBLN1 | Fibulin 1 | 2.62 |
1.9×10² | 1.27 | 7.35 | 5.78 |
|
FOXA2 | Forkhead box
A2 | 2.18 |
6.2×10² | 1.36 | 5.56 | 4.09 |
|
MYL5 | Myosin, light chain
5, regulatory | 3.19 |
5.6×10³ | 1.25 | 6.73 | 5.40 |
|
NRP2 | Neuropilin 2 | 2.75 |
1.2×10² | 1.25 | 6.74 | 5.40 |
|
PTHLH | Parathyroid
hormone-like hormone | 2.46 |
1.9×10² | 1.42 | 6.77 | 4.75 |
|
SCUBE3 | Signal peptide, CUB
domain, EGF-like 3 | 2.63 |
3.6×10³ | 1.34 | 7.76 | 5.78 |
| Cell structure |
|
|
|
|
|
|
|
CELSR2 | Cadherin, EGF LAG
seven-pass G-type receptor 2 | 2.80 |
1.2×10² | 1.21 | 7.78 | 6.42 |
|
COL7A1 | Collagen, type VII,
α1 | 2.53 |
2.0×10² | 1.26 | 8.29 | 6.58 |
|
DCLK1 | Doublecortin-like
kinase 1 | 2.69 |
1.6×10² | 1.21 | 4.91 | 4.06 |
|
DNM3 | Dynamin 3 | 2.22 |
3.7×10² | 1.21 | 6.13 | 5.06 |
|
DYNC1I1 | Dynein, cytoplasmic
1, intermediate chain 1 | 2.85 |
1.1×10² | 1.42 | 7.89 | 5.55 |
|
FOXA2 | Forkhead box
A2 | 2.18 |
6.2×10² | 1.36 | 5.56 | 4.09 |
|
GPM6B | Glycoprotein
M6B | 2.14 |
4.8×10² | 1.46 | 7.60 | 5.19 |
|
SPP1 | Secreted
phosphoprotein 1 | 0.82 |
4.2×101 | 1.03 | 7.03 | 7.22 |
| Unknown biological
process |
|
|
|
|
|
|
|
RNF182 | Ring finger protein
182 | 2.22 |
3.9×10² | 1.27 | 8.41 | 6.64 |
|
ACSS3 | Acyl-CoA synthetase
short-chain family member 3 | 2.48 |
3.3×10² | 1.28 | 6.52 | 5.08 |
|
GSTM4 | Glutathione
S-transferase mu 4 | 4.79 |
4.0×10⁴ | 1.41 | 7.93 | 5.62 |
|
LINC00461 | Long intergenic
non-protein coding RNA 461 | 4.67 |
6.0×10⁴ | 1.55 | 9.31 | 5.99 |
|
FAM70A | Transmembrane
protein 255A | 3.80 |
6.0×10⁴ | 1.72 | 7.46 | 4.33 |
|
COL21A1 | Collagen, type XXI,
α1 | 4.49 |
4.0×10⁴ | 1.74 | 7.61 | 4.38 |
|
METTL7A | Methyltransferase
like 7A | 3.32 |
5.0×10³ | 1.49 | 8.06 | 5.40 |
|
GMPR | Guanosine
monophosphate reductase | 0.33 |
7.5×101 | 1.01 | 8.81 | 8.94 |
|
NID1 | Nidogen 1 | 2.36 |
2.8×10² | 1.26 | 9.12 | 7.23 |
|
KIAA0895 | KIAA0895 | 2.04 |
5.5×10² | 1.21 | 6.57 | 5.44 |
|
C8orf4 | Chromosome 8 open
reading frame 4 | 0.91 |
3.7×101 | 1.04 | 10.02 | 9.67 |
|
SEL1L3 | Sel-1 suppressor of
lin-12-like 3 (Caenorhabditis elegans) | 2.19 |
4.3×10² | 1.33 | 8.99 | 6.76 |
|
GPC4 | Glypican 4 | 2.55 |
2.2×10² | 1.41 | 8.55 | 6.07 |
|
PLEKHG1 | Pleckstrin homology
domain containing, family G (with RhoGef domain) member 1 | 2.47 |
2.8×10² | 1.38 | 6.36 | 4.62 |
|
PIPOX | Pipecolic acid
oxidase | 3.29 |
4.0×10⁴ | 1.68 | 6.46 | 3.84 |
|
FAM65B | Family with
sequence similarity 65, member B | 2.56 |
1.1×10² | 1.39 | 5.57 | 3.99 |
|
C7orf57 | Chromosome 7 open
reading frame 57 | 2.17 |
4.2×10² | 1.46 | 5.56 | 3.80 |
|
PPP2R2B | Protein phosphatase
2, regulatory subunit B, β | 3.58 |
2.8×10³ | 1.61 | 7.44 | 4.62 |
|
SERP2 | Stress-associated
endoplasmic reticulum protein family member 2 | 2.11 |
5.2×10² | 1.22 | 6.19 | 5.09 |
|
SOX2 | SRY (sex
determining region Y)-box 2 | 1.23 |
2.5×101 | 1.04 | 4.07 | 3.92 |
|
RPRM | Reprimo, TP53
dependent G2 arrest mediator candidate | 0.43 |
6.9×101 | 1.01 | 3.99 | 4.04 |
|
MFSD2A | Major facilitator
superfamily domain containing 2A | 3.69 |
2.0×10³ | 1.30 | 7.33 | 5.63 |
|
PELI2 | Pellino E3
ubiquitin protein ligase family member 2 | 2.91 |
1.1×10² | 1.29 | 7.33 | 5.68 |
|
GCNT2 | Glucosaminyl
(N-acetyl) transferase 2, I-branching enzyme (I blood group) | 2.40 |
3.3×10² | 1.22 | 7.59 | 6.22 |
|
SLC16A4 | Solute carrier
family 16, member 4 | 2.88 |
1.1×10² | 1.39 | 8.00 | 5.77 |
|
SH3BGR | SH3 domain binding
glutamic acid-rich protein | 1.58 |
1.3×101 | 1.05 | 10.64 | 10.12 |
|
WDR31 | WD repeat domain
31 | 3.54 |
2.8×10³ | 1.20 | 5.83 | 4.86 |
|
SLC16A9 | Solute carrier
family 16, member 9 | 2.07 |
4.4×10² | 1.23 | 6.40 | 5.19 |
|
GSTT1 | Glutathione
S-transferase theta 1 | 2.91 |
1.3×10² | 1.40 | 7.41 | 5.31 |
|
NDP | Norrie disease
(pseudoglioma) | 2.53 |
2.4×10² | 1.50 | 7.62 | 5.09 |
|
NDN | Necdin, melanoma
antigen (MAGE) family member | 2.42 |
2.9×10² | 1.44 | 7.59 | 5.27 |
|
ASB9 | Ankyrin repeat and
SOCS box containing 9 | 2.20 |
4.3×10² | 1.26 | 7.03 | 5.58 |
|
LONRF2 | LON peptidase
N-terminal domain and ring finger 2 | 2.08 |
6.0×10² | 1.37 | 6.10 | 4.44 |
|
SPHAR | S-phase response
(cyclin related) | 2.62 |
1.8×10² | 1.22 | 7.49 | 6.12 |
|
RNF144A | Ring finger protein
144A | 2.62 |
1.6×10² | 1.24 | 7.07 | 5.71 |
|
SERINC5 | Serine incorporator
5 | 4.07 |
1.4×10³ | 1.20 | 10.73 | 8.95 |
|
RRAGD | Ras-related GTP
binding D | 2.42 |
3.0×10² | 1.28 | 8.29 | 6.48 |
|
OGDHL | Oxoglutarate
dehydrogenase-like | 2.65 |
1.5×10² | 1.25 | 6.36 | 5.11 |
|
CEND1 | Cell cycle exit and
neuronal differentiation 1 | 3.91 |
1.0×10³ | 1.24 | 6.38 | 5.14 |
|
RBPMS2 | RNA binding protein
with multiple splicing 2 | 2.11 |
4.6×10² | 1.26 | 6.34 | 5.03 |
|
SULF2 | Sulfatase 2 | 2.69 |
1.9×10² | 1.50 | 8.01 | 5.33 |
|
MMP7 | Matrix
metallopeptidase 7 (matrilysin, uterine) | 2.97 |
2.0×10³ | 1.24 | 5.14 | 4.15 |
|
SLC2A12 | Solute carrier
family 2 (facilitated glucose transporter), member 12 | 2.95 |
8.4×10³ | 1.35 | 6.31 | 4.67 |
|
GFPT2 |
Glutamine-fructose-6-phosphate
transaminase 2 | 2.24 |
3.7×10² | 1.29 | 8.35 | 6.46 |
|
SOX9 | SRY (sex
determining region Y)-box 9 | 2.18 |
4.3×10² | 1.31 | 9.42 | 7.17 |
|
C5orf46 | Chromosome 5 open
reading frame 46 | 2.29 |
3.2×10² | 1.34 | 8.92 | 6.67 |
|
CP | Ceruloplasmin
(ferroxidase) | 2.35 |
3.3×10² | 1.05 | 4.24 | 4.03 |
|
GPNMB | Glycoprotein
(transmembrane) nmb | 2.85 |
1.1×10² | 1.35 | 10.04 | 7.46 |
|
SERPINI1 | Serpin peptidase
inhibitor, clade I (neuroserpin), member 1 | 2.35 |
3.5×10² | 1.32 | 7.42 | 5.63 |
|
TPRG1 | Tumor protein p63
regulated 1 | 2.36 |
3.5×10² | 1.30 | 5.12 | 3.94 |
|
PITX2 | Paired-like
homeodomain 2 | 2.09 |
5.6×10² | 1.32 | 5.44 | 4.13 |
| Table VIII.Annotated summary of class B of
peroxisome proliferator-activated receptor γ, coactivator 1α. |
Table VIII.
Annotated summary of class B of
peroxisome proliferator-activated receptor γ, coactivator 1α.
| Functional
role | Genes | P-value | -Log (P-value) |
|---|
| Biological
process |
|
MHCII-mediated immunity | 3 |
8.20×10³ | 2.09 |
| Signal
transduction | 27 |
9.70×10³ | 2.01 |
|
Intracellular signaling
cascade | 11 |
1.10×10² | 1.96 |
| Cell
surface receptor mediated signal transduction | 16 |
1.40×10² | 1.85 |
| T-cell
mediated immunity | 5 |
1.40×10² | 1.85 |
|
Ligand-mediated signaling |
7 |
1.60×10² | 1.80 |
|
Calcium mediated
signaling |
4 |
2.00×10² | 1.70 |
| Other
oncogenesis |
3 |
4.30×10² | 1.37 |
| Cell
communication | 11 |
6.90×10² | 1.16 |
| Cellular
component |
| MHC
protein complex |
4 |
2.90×10³ | 2.54 |
|
Extracellular matrix |
7 |
7.80×10³ | 2.11 |
|
Extracellular region part | 12 |
8.40×10³ | 2.08 |
| MHC
class II protein complex |
3 |
9.30×10³ | 2.03 |
|
Extracellular region | 18 |
2.10×10² | 1.68 |
|
Proteinaceous extracellular
matrix |
6 |
2.30×10² | 1.64 |
|
Apical plasma membrane |
4 |
2.90×10² | 1.54 |
|
Chromatin assembly
complex |
2 |
3.00×10² | 1.52 |
|
Microsome |
5 |
3.20×10² | 1.49 |
|
Vesicular fraction |
5 |
3.50×10² | 1.46 |
|
Apical part of cell |
4 |
6.10×10² | 1.21 |
In addition, when genes were analyzed according to
cell signaling pathway (BioCarta database), 3 signaling pathways in
class A and 5 in class B were identified as statistically
significant (P<0.05; Table IX).
The results of the present study demonstrate that class A genes
play roles in signaling pathways associated with metabolic and
mitochondrial electron transport and that class B genes are
involved in signaling pathways associated with differentiation and
immune function.
| Table IX.Differentially regulated signaling
pathways in classes A and B. |
Table IX.
Differentially regulated signaling
pathways in classes A and B.
| Signaling
pathways |
Numbera | P-value |
|---|
| Class A |
|
Electron transport reaction in
mitochondria | 3 |
2.1×10⁻² |
|
Shuttle for transfer of acetyl
groups from mitochondria to the cytosol | 3 |
2.8×10⁻² |
| Role
of PPAR-γ coactivators in obesity and thermogenesis | 3 |
3.5×10⁻² |
| Class B |
|
Th1/Th2 differentiation | 5 |
6.3×10⁻³ |
|
Cytokines and inflammatory
response | 5 |
1.6×10⁻² |
|
Bystander B-cell
activation | 3 |
3.6×10⁻² |
| IL12-
and Stat4-dependent signaling pathway in Th1 development | 4 |
4.0×10⁻² |
|
Dendritic cells in regulating
Th1 and Th2 development | 4 |
4.5×10⁻² |
Discussion
The objective of the present study was to
investigate the association between aberrant expression of PGC1α
and GBM, and the role PGC1α may have in patient survival. Protein
level data demonstrated that PGC1α expression was increased in a
subpopulation of tumor cells, although there were variations
between different GBM cell lines and patients. PGC1α localization
was identified to differ between GBM tissues and the normal cortex
(Fig. 2). These results corroborated
with a previous study that detected a brain-specific isoform of
PGC1α in the cytoplasm rather than the nucleus (27). It was also reported that the PGC1α
isoform becomes localized in the mitochondria via phosphatase and
tensin homolog-induced putative kinase 1 and voltage-dependent
anion channel (28).
This present study also demonstrated that PGC1α was
expressed in the mitochondria of GBM cells. Based on these
corroborating results, it is predicted that PGC1α-mediated
mitochondrial biogenesis and respiration is increased in GBM
cells.
To investigate the role PGC1α has in GBM cells,
several bioinformatics analyses were performed. The analyses
demonstrated that metabolic and mitochondrial genes were highly
correlated with PGC1α in a number of GBM cell lines. Class
Neighbors analysis classified PGC1α-expressing GBM cell
lines into two groups: Class A and B. Class A contained genes
associated with development, neurogenesis, cell structure and
motility. Class B contained genes associated with immunity,
oncogenesis and signaling, including intracellular, T
cell-mediated, ligand-mediated and-calcium mediated pathways. Class
A genes are involved in mitochondrial and metabolic pathways,
whilst class B genes are involved in differentiation and immune
pathways. These data reinforce the hypothesis that PGC1α may
have an important role in regulating mitochondrial and metabolic
signaling pathways in the GBM microenvironment.
A notable result was the association of NDN
with PGC1α. NDN is reported to function as a tumor
suppressor in GBM (29) and controls
the proliferation of white adipose progenitor cells (30). NDN interacts with PGC1α via
nicotinamide adenine dinucleotide dependent protein deacetylase
(Sirt-1) and two transcription factors, E2F1 and P53, suggesting
that interactions with these cell cycle regulating factors are key
to its function (31). Therefore, it
is hypothesized that PGC1α enhances antioxidant capacity in GBM by
interacting with NDN and Sirt1, leading to delayed progression of
necrosis and ultimately increasing overall patient survival. Future
studies that elucidate the molecular interactions of PGC1α are
required to derive improved insights into the diagnosis, prognosis
and treatment of GBM.
Acknowledgements
This work was financially supported by the Chungnam
National University Hospital Research Fund in 2012 (SH Kim) and the
Basic Science Research Program through the National Research
Foundation of Korea, which was funded by the Ministry of Science,
ICT and Future Planning (grant no. 2013R1A1A1A05006966) and the
Ministry of Education, Science & Technology of South Korea
(grant nos. 2012R1A1A2004714 and 2012M3A9B6055302).
References
|
1
|
Finck BN and Kelly DP: PGC-1 coactivators:
Inducible regulators of energy metabolism in health and disease. J
Clin Invest. 116:615–622. 2006. View
Article : Google Scholar : PubMed/NCBI
|
|
2
|
Knutti D and Kralli A: PGC-1, a versatile
coactivator. Trends Endocrinol Metab. 12:360–365. 2001. View Article : Google Scholar : PubMed/NCBI
|
|
3
|
Scarpulla RC: Metabolic control of
mitochondrial biogenesis through the PGC-1 family regulatory
network. Biochim Biophys Acta. 1813:1269–1278. 2011. View Article : Google Scholar : PubMed/NCBI
|
|
4
|
Puigserver P and Spiegelman BM: Peroxisome
proliferator-activated receptor-gamma coactivator 1 alpha (PGC-1
alpha): Transcriptional coactivator and metabolic regulator. Endocr
Rev. 24:78–90. 2003. View Article : Google Scholar : PubMed/NCBI
|
|
5
|
Lin J, Handschin C and Spiegelman BM:
Metabolic control through the PGC-1 family of transcription
coactivators. Cell Metab. 1:361–370. 2005. View Article : Google Scholar : PubMed/NCBI
|
|
6
|
Tritos NA, Mastaitis JW, Kokkotou EG,
Puigserver P, Spiegelman BM and Maratos-Flier E: Characterization
of the peroxisome proliferator activated receptor coactivator 1
alpha (PGC 1alpha) expression in the murine brain. Brain Res.
961:255–260. 2003. View Article : Google Scholar : PubMed/NCBI
|
|
7
|
Cowell RM, Blake KR and Russell JW:
Localization of the transcriptional coactivator PGC-1alpha to
GABAergic neurons during maturation of the rat brain. J Comp
Neurol. 502:1–18. 2007. View Article : Google Scholar : PubMed/NCBI
|
|
8
|
St-Pierre J, Drori S, Uldry M, Silvaggi
JM, Rhee J, Jäger S, Handschin C, Zheng K, Lin J, Yang W, et al:
Suppression of reactive oxygen species and neurodegeneration by the
PGC-1 transcriptional coactivators. Cell. 127:397–408. 2006.
View Article : Google Scholar : PubMed/NCBI
|
|
9
|
Watkins G, Douglas-Jones A, Mansel RE and
Jiang WG: The localisation and reduction of nuclear staining of
PPARgamma and PGC-1 in human breast cancer. Oncol Rep. 12:483–488.
2004.PubMed/NCBI
|
|
10
|
Feilchenfeldt J, Brüundler MA, Soravia C,
Tötsch M and Meier CA: Peroxisome proliferator-activated receptors
(PPARs) and associated transcription factors in colon cancer:
Reduced expression of PPARgamma-coactivator 1 (PGC-1). Cancer lett.
203:25–33. 2004. View Article : Google Scholar : PubMed/NCBI
|
|
11
|
Jiang WG, Douglas-Jones A and Mansel RE:
Expression of peroxisome-proliferator activated receptor-gamma
(PPARgamma) and the PPARgamma co-activator, PGC-1, in human breast
cancer correlates with clinical outcomes. Int J Cancer.
106:752–757. 2003. View Article : Google Scholar : PubMed/NCBI
|
|
12
|
Zhang Y, Ba Y, Liu C, Sun G, Ding L, Gao
S, Hao J, Yu Z, Zhang J, Zen K, et al: PGC-1alpha induces apoptosis
in human epithelial ovarian cancer cells through a
PPARgamma-dependent pathway. Cell Res. 17:363–373. 2007. View Article : Google Scholar : PubMed/NCBI
|
|
13
|
Heiden MG Vander, Cantley LC and Thompson
CB: Understanding the Warburg effect: The metabolic requirements of
cell proliferation. Science. 324:1029–1033. 2009. View Article : Google Scholar : PubMed/NCBI
|
|
14
|
Vazquez F, Lim JH, Chim H, Bhalla K,
Girnun G, Pierce K, Clish CB, Granter SR, Widlund HR, Spiegelman BM
and Puigserver P: PGC1α expression defines a subset of human
melanoma tumors with increased mitochondrial capacity and
resistance to oxidative stress. Cancer cell. 23:287–301. 2013.
View Article : Google Scholar : PubMed/NCBI
|
|
15
|
Plate KH and Risau W: Angiogenesis in
malignant gliomas. Glia. 15:339–347. 1995. View Article : Google Scholar : PubMed/NCBI
|
|
16
|
Stupp R, Mason WP, van den Bent MJ, Weller
M, Fisher B, Taphoorn MJ, Belanger K, Brandes AA, Marosi C, Bogdahn
U, et al: Radiotherapy plus concomitant and adjuvant temozolomide
for glioblastoma. N Engl J Med. 352:987–996. 2005. View Article : Google Scholar : PubMed/NCBI
|
|
17
|
Cancer Genome Atlas Research Network, .
Comprehensive genomic characterization defines human glioblastoma
genes and core pathways. Nature. 455:1061–1068. 2008. View Article : Google Scholar : PubMed/NCBI
|
|
18
|
Verhaak RG, Hoadley KA, Purdom E, Wang V,
Qi Y, Wilkerson MD, Miller CR, Ding L, Golub T, Mesirov JP, et al:
Integrated genomic analysis identifies clinically relevant subtypes
of glioblastoma characterized by abnormalities in PDGFRA, IDH1,
EGFR, and NF1. Cancer Cell. 17:98–110. 2010. View Article : Google Scholar : PubMed/NCBI
|
|
19
|
Lee YS, Kang JW, Lee YH and Kim DW: ID4
mediates proliferation of astrocytes after excitotoxic damage in
the mouse hippocampus. Anat Cell Biol. 44:128–134. 2011. View Article : Google Scholar : PubMed/NCBI
|
|
20
|
Yi MH, Kim S, Zhang E, Kang JW, Park JB,
Lee YH, Chung CK, Kim YM and Kim DW: IQGAP1 expression in spared
CA1 neurons after an excitotoxic lesion in the mouse hippocampus.
Cell Mol Neurobiol. 33:1003–1012. 2013. View Article : Google Scholar : PubMed/NCBI
|
|
21
|
Barretina J, Caponigro G, Stransky N,
Venkatesan K, Margolin AA, Kim S, Wilson CJ, Lehár J, Kryukov GV,
Sonkin D, et al: The cancer cell line encyclopedia enables
predictive modelling of anticancer drug sensitivity. Nature.
483:603–607. 2012. View Article : Google Scholar : PubMed/NCBI
|
|
22
|
Golub TR, Slonim DK, Tamayo P, Huard C,
Gaasenbeek M, Mesirov JP, Coller H, Loh ML, Downing JR, Caligiuri
MA, et al: Molecular classification of cancer: Class discovery and
class prediction by gene expression monitoring. Science.
286:531–537. 1999. View Article : Google Scholar : PubMed/NCBI
|
|
23
|
Huang DW, Sherman BT, Tan Q, Collins JR,
Alvord WG, Roayaei J, Stephens R, Baseler MW, Lane HC and Lempicki
RA: The DAVID gene functional classification tool: A novel
biological module-centric algorithm to functionally analyze large
gene lists. Genome Biol. 8:R1832007. View Article : Google Scholar : PubMed/NCBI
|
|
24
|
Vlasblom J, Zuberi K, Rodriguez H, Arnold
R, Gagarinova A, Deineko V, Kumar A, Leung E, Rizzolo K, Samanfar
B, et al: Novel function discovery with GeneMANIA: A new integrated
resource for gene function prediction in Escherichia coli.
Bioinformatics. 31:306–310. 2015. View Article : Google Scholar : PubMed/NCBI
|
|
25
|
Meng H, Liang HL and Wong-Riley M:
Quantitative immuno-electron microscopic analysis of
depolarization-induced expression of PGC-1alpha in cultured rat
visual cortical neurons. Brain Res. 1175:10–16. 2007. View Article : Google Scholar : PubMed/NCBI
|
|
26
|
Deighton RF, Le Bihan T, Martin SF, Gerth
AM, McCulloch M, Edgar JM, Kerr LE, Whittle IR and McCulloch J:
Interactions among mitochondrial proteins altered in glioblastoma.
J Neurooncol. 118:247–256. 2014. View Article : Google Scholar : PubMed/NCBI
|
|
27
|
Soyal SM, Felder TK, Auer S, Hahne P,
Oberkofler H, Witting A, Paulmichl M, Landwehrmeyer GB, Weydt P and
Patsch W; European Huntington Disease Network, : A greatly extended
PPARGC1A genomic locus encodes several new brain-specific isoforms
and influences Huntington disease age of onset. Hum Mol Genet.
21:3461–3473. 2012. View Article : Google Scholar : PubMed/NCBI
|
|
28
|
Choi J, Batchu VV, Schubert M, Castellani
RJ and Russell JW: A novel PGC-1α isoform in brain localizes to
mitochondria and associates with PINK1 and VDAC. Biochem Biophys
Res Commun. 435:671–677. 2013. View Article : Google Scholar : PubMed/NCBI
|
|
29
|
Chapman EJ and Knowles MA: Necdin: A multi
functional protein with potential tumor suppressor role? Mol
Carcinog. 48:975–981. 2009. View
Article : Google Scholar : PubMed/NCBI
|
|
30
|
Fujiwara K, Hasegawa K, Ohkumo T, Miyoshi
H, Tseng YH and Yoshikawa K: Necdin controls proliferation of white
adipocyte progenitor cells. PloS One. 7:e309482012. View Article : Google Scholar : PubMed/NCBI
|
|
31
|
Niinobe M, Koyama K and Yoshikawa K:
Cellular and subcellular localization of necdin in fetal and adult
mouse brain. Dev Neurosci. 22:310–319. 2000. View Article : Google Scholar : PubMed/NCBI
|