Introduction
Accompanied by the continuous industrialization and
urbanization in China, the incidence of malignant tumors is
increasing annually. Presently, malignant tumors are one of the
main diseases that seriously threatens human health. Moreover,
because of life style changes and aging, malignant tumors represent
a primary cause of death in our country (1). It is also known that cancer patients are
prone to malnutrition. Some studies suggested that roughly 50–90%
of cancer patients suffer from malnutrition (2). The number of incidences of severe
malnutrition in patients with malignant tumors was reported to be
about 2,000,000/year (3).
Once a patient is diagnosed with a malignant tumor,
nutritional risk screening (NRS-2002) must be carried out in a
timely manner (4). Recently, two
screening tools have been widely-used the NRS-2002, recommended by
the European Society for Clinical Nutrition and Metabolism (ESPEN)
(5), and patient-generated subjective
global assessment (PG-SGA), developed by Ottery (6) for the oncology population. The PG-SGA
was developed based on Subjective Global Assessment (SGA). Clinical
studies found that the PG-SGA is the most ideal and widely used
tool to evaluate the nutritional status of patients with tumors.
Therefore, the PG-SGA has become widely applied and popularization
by the American Dietetic Association (ADA) (2,7–9).
The primary aim of this study was to analyze the
potential relationship of the PG-SGA with nutritional status
assessed by NRS-2002, anthropometry and biochemical indicators to
determine its value as a clinical tool for integration in the
assessment of patients with cancer. The secondary aim of the study
was to compare the similarities and differences between the PG-SGA
and NRS-2002 in the evaluation of nutritional status of patients
with cancer.
Patients and methods
Patients
In this cross-institutional study, we selected
subjects from the First Hospital of Hebei Medical University, the
Second Hospital of Hebei Medical University (East court), Hengshui
Halison International Peace Hospital, Xingtai People's Hospital and
the Affiliated Hospital of Chengde Medical College from June 2013
to June 2014, for a total of 927 patients with malignant tumors.
Patients with cancer and aged at least 18 years old were eligible
for inclusion in the study. Multiple admission patients were
investigated only once. The exclusion criteria included patients
who were unwilling to participate in the study, patients aged
<18 years or >90 years, patients with physical or cognitive
impairment, patients with AIDS and recipients of organ transplants.
The design of the study was approved by the Research Ethics Board
of the First Hospital of Hebei Medical University (no. 2013205) and
written informed consent was obtained from all participants.
Nutritional status
A questionnaire survey was used to investigate the
nutritional status of patients with malignant tumors. Patients
(n=927) who consented to participate in the study completed the
NRS-2002 and PG-SGA. The NRS-2002 ranges from 0–7 points and
consists of three parts: part one assesses the severity of disease,
part two assesses the nutritional status and part three is an
adjustment for patients aged >70 years. Patients with a total
score of ≥3 were estimated to be at nutritional risk (10). The PG-SGA ranges from 0 to 50 points,
with a score of ≤1 indicating well-nourished (PG-SGA ≤1, PG-SGA-A),
a score of 2–8 indicating moderately malnourished (2≤ PG-SGA <9,
PG-SGA-B), and a score of ≥9 indicating severely malnourished
(PG-SGA ≥9, PG-SGA-C) (10).
Anthropometry
Body weight (BW; nearest 0.1 kg) and height (nearest
cm) were measured while the patient was standing without shoes and
wearing light clothes. Body mass index (BMI) was calculated as
weight (kg) divided by height (m) squared (kg/m2).
Mid-arm circumference (MAC), mid-arm muscle circumference (MAMC),
and triceps skinfold thickness (TSF) were measured on the dominant
arm according to Heymsfield et al (11). MAMC was calculated according to the
following formula: MAMC (cm) = MAC (cm) - [TSF (mm) × 0.314]
(12). Non-dominant hand grip was
performed using a standardized position recommended by the American
Society of Hand Therapists. All anthropometric measurements were
made at least 3 times by the same investigator and the reported
values were averaged.
Biochemistry
Blood samples from a cubital vein were collected on
admission for analysis of total protein, albumin, and hemoglobin.
Because the diagnostic criteria for nutritional risk were different
in each hospital, they were made by referring to the protocol of
each hospital.
Statistical analysis
Statistical analyses were carried out using SPSS
version 13 (SPSS, Inc., Chicago, IL, USA). All data were not
normally distributed. Baseline characteristics are presented as
frequencies with percentages or median with interquartile range.
The Mann-Whitney test and Kruskal-Wallis H non-parametric test were
used for intergroup comparisons. Because the data were not normally
distributed, the relation was assessed by Spearmans rank
correlation analysis. The κ statistic was used to evaluate the
agreement between two assessment methods. The range of values for κ
was from 0–1. A value of κ below 0.4 indicated that chance alone
could account for the observed agreement, and a value of 1
represented a perfect concordance. A probability value <0.05 was
considered to indicate a statistically significant difference.
Results
The baseline characteristics of patients are
summarized in Table I. The study
population consisted of 510 (55%) men with a median age of 62 years
(interquartile range, 55–70 years) and 417 (45%) women with a
median age of 59 years (interquartile range: 48–66 years).
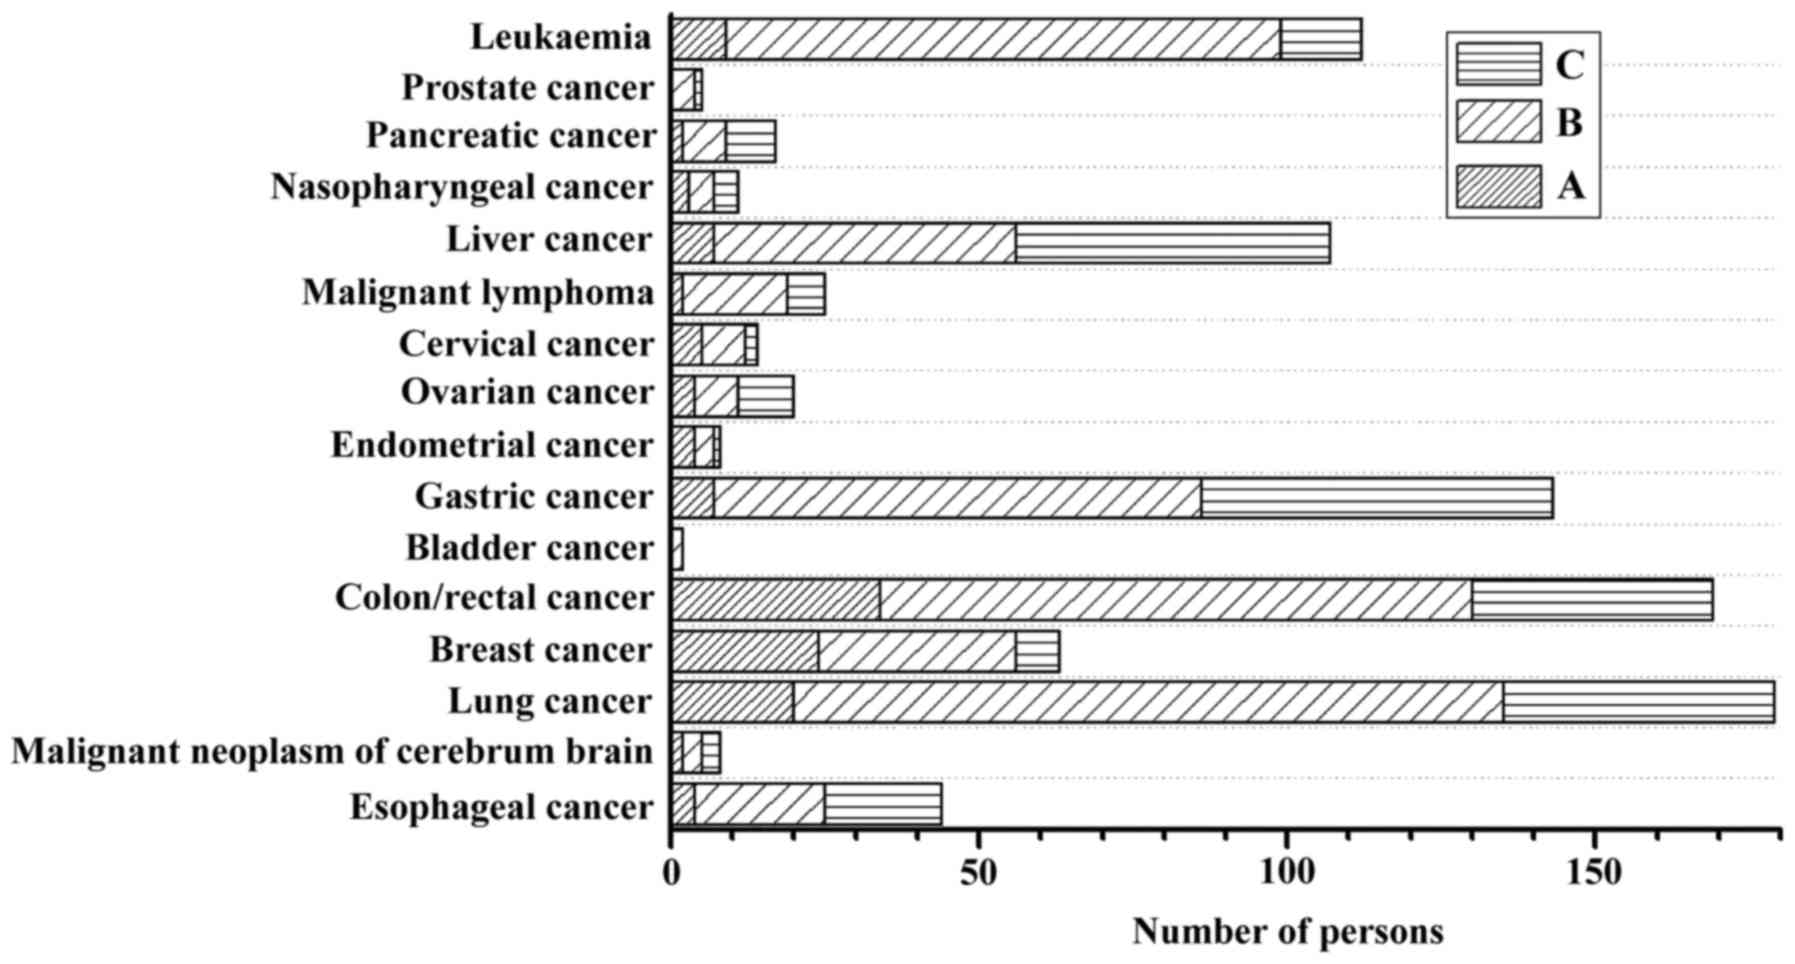
According to the PG-SGA, 13.7% of patients were well-nourished
(PG-SGA from 0–1) and 86.3% were malnourished, among whom, 57.8%
were moderately malnourished (PG-SGA from 2–8) and 28.5% of
patients were severely malnourished (PG-SGA ≥9). The nutritional
status of patients according to tumor type is shown in Fig. 1. According to NRS-2002, 30.7% of
patients were at nutritional risk (NRS-2002 ≥3). The median weight,
BMI, TSF, MAMC, and non-dominant hand grip were higher in men than
in women (P<0.05). Lung cancer was the most prevalent tumor,
accounting for 19.3% of patients. The biochemical variables
mentioned above did not differ significantly according to sex,
except for hemoglobin.
 | Table I.Clinical characteristics of the
patients. |
Table I.
Clinical characteristics of the
patients.
| Clinical
characteristics | Total (n=927) | Men (n=510) | Women (n=417) |
|---|
| Age, median
(IQR) | 61 (52–78) | 62 (55–70) | 59 (48–66) |
| Nutritional
parameters, median (IQR) |
|
|
|
| Weight,
kg | 61 (52–68) | 65 (59–70) | 58
(52–64.63)a |
| BMI,
kg/m2 | 22.3 (20.3–24.5) | 22.10
(20.3–23.93) | 22.7
(20.6–25.2)a |
| TSF,
mm | 12.0 (8.1–15) | 10.05 (8–13.63) | 13.0
(9–16)a |
| MAC,
cm | 27.0 (23.5–30.0) | 27.0 (24–30.0) | 26.25 (23–30.0) |
| MAMC,
cm | 22.72
(20.29–25.45) | 23.13
(21.17–25.92) | 22.08
(18.73–24.56)a |
| Non-dominant hand
grip, kg | 16.7 (10–24) | 20 (12–27.93) | 14.05
(10–20)a |
| Total protein,
g/l | 65 (59.2–71) | 64.75
(59.18–70.93) | 66.80
(60.15–71.75) |
| Albumin, g/l | 38.2 (34.1–42) | 38 (34.00–42.00) | 39 (35.45–41.80) |
| Hemoglobin, mg/l | 117.0 (102–129) | 118.0 (102–132) | 115.0
(101–127)b |
| Tumor location, n
(%) |
|
|
|
|
Esophageal cancer | 44 (4.7) | 31 (6.1) | 13 (3.1) |
| Malignant
neoplasm of cerebrum brain | 8 (9) | 5 (1.0) | 3 (7.0) |
| Lung
cancer | 179 (19.3) | 112 (22.0) | 67 (16.1) |
| Breast
cancer | 63 (6.8) | 2 (0.4) | 61 (14.6) |
|
Colon/rectal cancer | 169 (18.2) | 90 (17.6) | 79 (18.9) |
| Bladder
cancer | 2 (0.2) | 1 (0.2) | 1 (0.2) |
| Gastric
cancer | 143 (15.4) | 107 (21.0) | 36 (8.6) |
|
Endometrial cancer | 8 (0.9) | 0 (0) | 8 (1.9) |
| Ovarian
cancer | 20 (2.2) | 0 (0) | 20 (4.8) |
| Cervical
cancer | 14 (1.5) | 0 (0) | 14 (3.4) |
| Malignant
lymphoma | 25 (2.7) | 11 (2.2) | 14 (3.4) |
| Liver
cancer | 107 (11.5) | 64 (12.5) | 43 (10.3) |
|
Nasopharyngeal cancer | 11 (1.2) | 10 (2.0) | 1 (0.2) |
|
Pancreatic cancer | 17 (1.8) | 7 (1.4) | 10 (2.4) |
| Prostate
cancer | 5 (0.5) | 5 (1.0) | 0 (0) |
|
Leukemia | 112 (12.1) | 65 (12.7) | 47 (11.3) |
Anthropometrics, biochemical parameters, and
NRS-2002 score for each of the PG-SGA classifications are shown in
Table II. All variables were
statistically significant between the PG-SGA groups
(P<0.05).
| Table II.Comparison of nutritional indicators
(median, IQR) according to PG-SGA. |
Table II.
Comparison of nutritional indicators
(median, IQR) according to PG-SGA.
|
| PG-SGA |
|---|
|
|
|
|---|
| Nutritional
parameters | Aa | Bb | Cc |
|---|
| Weight, kg | 65 (60–72) | 63 (56–70) | 58
(50–62)d |
| BMI,
kg/m2 | 24 (22–26) | 22.6 (20.8–24.8) | 21.1
(19.03–22.98)d |
| MAC, cm | 28.5
(26.5–31.25) | 27.5 (24.3–30) | 24
(20.4–27.00)d |
| TSF, mm | 14.1 (10–20.5) | 12.5 (8.4–15) | 9.05
(8–12.33)d |
| Non-dominant hand
grip, kg | 21.1
(16.4–29.75) | 17 (10–24) | 14
(9–20)d |
| MAMC, cm | 23.87
(22.14–25.76) | 23.2
(20.72–25.89) | 21.3
(17.75–23.23)d |
| Total protein,
g/l | 68.6 (65.0–73.5) | 66.2 (60.0–72.1) | 60.2
(57.67–66.2)d |
| Albumin, g/l | 41 (38.2–43.25) | 38.8 (34.7–42.7) | 35.8
(32.43–40.0)d |
| Hemoglobin,
mg/l | 124.0
(114.0–134.5) | 116.0
(100.0–128.0) | 115.0
(101.0–134.5)d |
Correlations of the PG-SGA and NRS-2002 scores with
anthropometrics, muscle function, and biochemical parameters
stratified by sex are shown in Table
III. For patients with malignant tumors, there was a
significant positive correlation between the PG-SGA scores and
NRS-2002 scores in both men and women. In men, BMI, non-dominant
hand grip, and total protein had moderate negative correlations
with PG-SGA, whereas in women, such correlations were found between
weight, BMI, TSF, non-dominant hand grip, MAC, MAMC, total protein
and albumin. Both men and women had a weak negative correlation of
PG-SGA with hemoglobin. In addition, the relationship between
nutritional status and NRS-2002 was similar to the relationship
between nutritional status and PG-SGA.
| Table III.Correlation coefficients and P-values
for patient data and nutritional assessment techniques according to
sex. |
Table III.
Correlation coefficients and P-values
for patient data and nutritional assessment techniques according to
sex.
|
| PG-SGA | NRS-2002 |
|---|
|
|
|
|
|---|
|
| Men | Women | Men | Women |
|---|
|
|
|
|
|---|
| Nutritional
parameters | Correlation | P-value | Correlation | P-value | Correlation | P-value | Correlation | P-value |
|---|
| Weight, kg | −0.296 | <0.001 | −0.350 | <0.001 | −0.341 | <0.001 | −0.418 | <0.001 |
| BMI,
kg/m2 | −0.305 | <0.001 | −0.355 | <0.001 | −0.336 | <0.001 | −0.417 | <0.001 |
| TSF, mm | −0.224 | <0.001 | −0.343 | <0.001 | −0.207 | <0.001 | −0.332 | <0.001 |
| MAC, cm | −0.294 | <0.001 | −0.417 | <0.001 | −0.266 | <0.001 | −0.395 | <0.001 |
| MAMC, cm | −0.237 | <0.001 | −0.321 | <0.001 | −0.222 | <0.001 | −0.295 | <0.001 |
| Non-dominant hand
grip, kg | −0.333 | <0.001 | −0.219 | <0.001 | −0.324 | <0.001 | −0.239 | <0.001 |
| Total protein,
g/l | −0.323 | <0.001 | −0.333 | <0.001 | −0.319 | <0.001 | −0.313 | <0.001 |
| Albumin, g/l | −0.271 | <0.001 | −0.376 | <0.001 | −0.297 | <0.001 | −0.264 | <0.001 |
| Hemoglobin,
mg/l | −0.214 | <0.001 | −0.165 | 0.001 | −0.266 | <0.001 | −0.255 | 0.001 |
| NRS-2002 score | 0.543 | <0.001 | 0.575 | <0.001 |
|
|
|
|
Concordance between albumin and NRS-2002 was
observed in 577 of 927 (62.2%) patients, and concordance between
albumin and PG-SGA was observed in 551 of 927 (59.4%) patients.
Sensitivity was 93.78% with PG-SGA and 43.13% with NRS-2002.
Specificity was 21.8 and 82.16% with PG-SGA and NRS-2002,
respectively. Agreement was higher between albumin and NRS-2002
(κ=0.251, P=0.0007) than between albumin and the PG-SGA (κ=0.160,
P=0.0006; Table IV).
| Table IV.Statistical comparison of albumin and
screening tool values at hospital admission: PG-SGA and NRS-2002
vs. albumin. |
Table IV.
Statistical comparison of albumin and
screening tool values at hospital admission: PG-SGA and NRS-2002
vs. albumin.
|
| PG-SGA | NRS-2002 |
|---|
|
|
|
|
|---|
| Items | At risk (B+C) | No risk (A) | Total | At risk (NRS-2002
≥3) | No risk (NRS-2002
<3) | Total |
|---|
| At risk (albumin
<35g/l) | 452 | 30 | 482 | 204 | 269 | 473 |
| No risk (albumin
≥35g/l) | 348 | 97 | 445 | 81 | 373 | 454 |
| Total | 800 | 127 | 927 | 285 | 642 | 927 |
| Sensitivity |
| 93.78%
(454/482) |
|
| 43.13%
(204/473) |
|
| Specificity |
| 21.80%
(97/445) |
|
| 82.16%
(373/454) |
|
|
|
| κ=0.160,
P=0.0006 |
|
| κ=0.251,
P=0.0007 |
|
Discussion
Previous studies (13–15) showed
that malnutrition can reduce the immune function of patients with
tumors and increase the risk of infection, the incidence of
postoperative complications and mortality. With the correct
nutritional evaluation, malnutrition or the risk of malnutrition
can be detected. The process of recovery in patients may benefit
from timely nutritional screening and nutritional support. Commonly
used anthropometric indicators such as BMI, TSF and MAC, have
limitations including the lack of specific normal reference values
and large measurement error. In addition, all of the individual
nutritional indexes emphasize specific aspects and should therefore
not be used alone for nutritional evaluation. The use of a
comprehensive nutritional assessment tool should be recommended for
patients with malignancy. Numerous nutritional evaluation tools
have been applied clinically, such as NRS-2002, Mini Nutritional
Assessment (MNA), SGA and PG-SGA. NRS-2002 is mainly used to screen
for malnutrition risk in patients to provide guidance for clinical
nutrition intervention. The PG-SGA is an effective tool for the
assessment of nutritional status of patients with tumors and has
been widely promoted and applied by the ADA and other
organizations. However, the relationship between the PG-SGA,
NRS-2002, and individual anthropometric and biochemical parameters
remains unclear. Therefore, the objective of this study was to
explore the association between the PG-SGA, NRS-2002 and other
nutritional parameters.
The PG-SGA scores have been shown to be accurate for
distinguishing well-nourished patients from malnourished patients
with a score of ≥9 (16). Our study
found that according to PG-SGA, the incidence rate of malnutrition
in cancer patients was 86.3%. Using the PG-SGA as a method of
nutritional evaluation, Bauer et al (8) found that the incidence of malnutrition
in ambulant cancer patients receiving radiation therapy was 75%.
Shaw et al (4), reported that
the prevalence of malnutrition in cancer outpatients was 71%. The
prevalence of malnutrition in cancer is often quoted as 40–80%
(17,18), and this may depend largely on the
method of assessment and screening, the clinical setting and
diagnostic group studied. Regarding the parameters of this study,
there was no limit on cancer stage, and whether patients received
treatment or not was not taken into consideration for analysis.
Therefore, these may have been causes of the high incidence of
malnutrition in this study. However, the study showed that compared
with those who were classified as malnourished according to the
PG-SGA (86.3%), NRS-2002 underestimated the incidence of patients
at risk (30.7%). This may have been because of differences between
NRS-2002 and the PG-SGA. The PG-SGA was designed in such a way that
the components of the medical history can be completed by the
patient using a checkbox format. Physical examination is then
performed by a health professional. In comparison, PG-SGA contains
more anthropometric parameters. Although the assessment process is
cumbersome, it is a comprehensive and effective evaluation
tool.
In our study, the values of all variables were
significantly lower in the PG-SGA-C group than in the PG-SGA-A
group, and all variables except for hemoglobin in the PG-SGA-C
group were lower than in the PG-SGA-B group. Only non-dominant hand
grip and hemoglobin in the PG-SGA-B group were lower than in the
PG-SGA-A group. This was consistent with the results from other
studies regarding nutritional evaluation using NRS-2002, in which
the nutritional parameters of the high-risk group with NRS ≥3 were
significantly lower than those of other groups (19).
We studied the relationship between PG-SGA and
NRS-2002 scores and parameters in patients with malignant tumors
and found that there was a significant positive correlation between
the PG-SGA scores and NRS-2002 scores in either men or women. Our
results suggest that there was a negative and moderate correlation
between PG-SGA scores and BMI, and between PG-SGA scores and total
protein in both men and women. In contrast, studies with similar
methodology found poor agreement between nutritional assessment
parameters and PG-SGA scores (20).
This variation may have been because each method reveals a
different aspect of malnutrition. Furthermore, our results
indicated that the relationship between nutritional status and
NRS-2002 is similar to the relationship between nutritional status
and the PG-SGA. The association between nutritional status and the
NRS-2002 score of patients with head and neck cancer was well
described in a study by Orell-Kotikangas et al (19). The study showed that in men, BMI, MAC
and mid-arm muscle area (MAMA) had moderate negative correlation
with NRS-2002, whereas in women, such correlation was not observed.
This finding is not concordant with our results. The difference may
be because of the fact that our study included 417 female patients
(45%) with cancer compared with 15 women (23%) with head and neck
squamous-cell carcinoma (HNSCC) (17), in which their proportion of female
participants was far below our study.
Albumin is commonly considered as a good marker of
nutritional status. We compared the accordance between albumin and
screening tool parameters upon hospital admission, i.e., PG-SGA and
NRS-2002 vs. albumin. The agreement of both methods was low,
indicating poor consistency of malnutrition identification in
individual patients. When comparing PG-SGA score with albumin, a
higher sensitivity and lower specificity compared with NRS-2002 are
seen in patients with tumors. The sensitivity and specificity of
the NRS-2002 were poor in comparison at 43.13 and 82.16%,
respectively, which were lower than previous studies undertaken in
patients with HNSCC (19). Therefore,
we find that the PG-SGA is more suitable than NRS-2002 to screen
for the risk of malnutrition in patients with tumors.
Several limitations were associated with the present
study. First of all, the design was not prospective. Although the
sample size was large, some types of cancer had a limited number of
patients. In addition, the values of the PG-SGA and NRS-2002 are
difficult to analyze from the perspective of different tumor types.
Although many studies have been performed to associate PG-SGA,
NRS-2002 and nutritional parameters, this study is still meaningful
because it involved a variety of tumors. As the sample population
included 927 patients, it was comparatively large. In this study,
the number of patients with lung cancer was the highest, followed
by colorectal cancer, and gastric cancer. This trend was consistent
with data (21) on malignant tumors
in China. The results of this study indicate that for patients with
cancer, the relationship between the PG-SGA, NRS-2002 and
nutritional status is statistically significant. Compared with
NRS-2002, PG-SGA is a suitable screening tool for detecting the
risk of malnutrition in patients with cancer.
Acknowledgements
The authors would like to thank Xinxia Song, Ting
Guo, Yan Li, Qiuge Qiao, and Xiaofeng Zhang who participated in
data collection in the study. This research was supported by
research grants from the high level talents in Hebei Province of
China (no. A201400542) and General Program of National Natural
Science Foundation in China (no. 81373046). We thank all the
members for their help.
References
|
1
|
Moore MA, Ariyaratne Y, Badar F, Bhurgri
Y, Datta K, Mathew A, Gangadharan P, Nandakumar A, Pradhananga KK,
Talukder MH, et al: Cancer epidemiology in South Asia - past,
present and future. Asian Pac J Cancer Prev. 11 Suppl 2:49–66.
2010.PubMed/NCBI
|
|
2
|
Thoresen L, Fjeldstad I, Krogstad K, Kaasa
S and Falkmer UG: Nutritional status of patients with advanced
cancer: The value of using the subjective global assessment of
nutritional status as a screening tool. Palliat Med. 16:33–42.
2002. View Article : Google Scholar : PubMed/NCBI
|
|
3
|
von Meyenfeldt M: Cancer-associated
malnutrition: An introduction. Eur J Oncol Nurs. 9 Suppl 2:S35–S38.
2005. View Article : Google Scholar : PubMed/NCBI
|
|
4
|
Shaw C, Fleuret C, Pickard JM, Mohammed K,
Black G and Wedlake L: Comparison of a novel, simple nutrition
screening tool for adult oncology inpatients and the Malnutrition
Screening Tool (MST) against the Patient-Generated Subjective
Global Assessment (PG-SGA). Support Care Cancer. 23:47–54. 2015.
View Article : Google Scholar : PubMed/NCBI
|
|
5
|
Kondrup J, Allison SP, Elia M, Vellas B
and Plauth M: Educational and Clinical Practice Committee, European
Society of Parenteral and Enteral Nutrition (ESPEN): ESPEN
guidelines for nutrition screening 2002. Clin Nutr. 22:415–421.
2003. View Article : Google Scholar : PubMed/NCBI
|
|
6
|
Ottery FD: Definition of standardized
nutritional assessment and interventional pathways in oncology.
Nutrition. 12 Suppl:S15–S19. 1996. View Article : Google Scholar : PubMed/NCBI
|
|
7
|
Ottery FD: Rethinking nutritional support
of the cancer patient: The new field of nutritional oncology. Semin
Oncol. 21:770–778. 1994.PubMed/NCBI
|
|
8
|
Bauer J, Capra S and Ferguson M: Use of
the scored Patient-Generated Subjective Global Assessment (PG-SGA)
as a nutrition assessment tool in patients with cancer. Eur J Clin
Nutr. 56:779–785. 2002. View Article : Google Scholar : PubMed/NCBI
|
|
9
|
Gabrielson DK, Scaffidi D, Leung E,
Stoyanoff L, Robinson J, Nisenbaum R, Brezden-Masley C and Darling
PB: Use of an abridged scored Patient-Generated Subjective Global
Assessment (abPG-SGA) as a nutritional screening tool for cancer
patients in an outpatient setting. Nutr Cancer. 65:234–239. 2013.
View Article : Google Scholar : PubMed/NCBI
|
|
10
|
Ottery FD: Patient-Generated Subjective
Global AssessmentThe Clinical Guide to Oncology Nutrition. McCallum
PD and Polisena CG: American Dietetic Association; Chicago, IL: pp.
11–23. 2000
|
|
11
|
Heymsfield SB, Baumgartner RN and Pan SF:
Nutritional assessment of malnutrition by anthropometric
methodsSHILS, ME Modern Nutrition in Health and Disease. Williams
and Wilkins; Baltimore, MD: 1999
|
|
12
|
Thomas B: Manual of dietetic practice.
2nd. Oxford: Blackwell; pp. 52–57. 1994
|
|
13
|
Silva FR, De Oliveira MG, Souza AS,
Figueroa JN and Santos CS: Factors associated with malnutrition in
hospitalized cancer patients: a croos-sectional study. Nutr J.
14:1232015. View Article : Google Scholar : PubMed/NCBI
|
|
14
|
Fukuda Y, Yamamoto K, Hirao M, Nishikawa
K, Maeda S, Haraguchi N, Miyake M, Hama N, Miyamoto A, Ikeda M, et
al: Prevalence of malnutrition among gastric cancer patients
undergoing gastrectomy and optimal preoperative nutritional support
for preventing surgical site infections. Ann Surg Oncol. 22 Suppl
3:S778–S785. 2015. View Article : Google Scholar : PubMed/NCBI
|
|
15
|
Wie GA, Cho YA, Kim SY, Kim SM, Bae JM and
Joung H: Prevalence and risk factors of malnutrition among cancer
patients according to tumor location and stage in the National
Cancer Center in Korea. Nutrition. 26:263–268. 2010. View Article : Google Scholar : PubMed/NCBI
|
|
16
|
Isenring E, Bauer J and Capra S: The
scored Patient-generated Subjective Global Assessment (PG-SGA) and
its association with quality of life in ambulatory patients
receiving radiotherapy. Eur J Clin Nutr. 57:305–309. 2003.
View Article : Google Scholar : PubMed/NCBI
|
|
17
|
Bozzetti F; SCRINIO Working Group, :
Screening the nutritional status in oncology: A preliminary report
on 1,000 outpatients. Support Care Cancer. 17:279–284. 2009.
View Article : Google Scholar : PubMed/NCBI
|
|
18
|
Bauer J and Capra S: Comparison of a
malnutrition screening tool with subjective global assessment in
hospitalised patients with cancer - sensitivity and specificity.
Asia Pac J Clin Nutr. 12:257–260. 2003.PubMed/NCBI
|
|
19
|
Orell-Kotikangas H, Österlund P,
Saarilahti K, Ravasco P, Schwab U and Mäkitie AA: NRS-2002 for
pre-treatment nutritional risk screening and nutritional status
assessment in head and neck cancer patients. Support Care Cancer.
23:1495–1502. 2015. View Article : Google Scholar : PubMed/NCBI
|
|
20
|
Souza Thompson, Motta R, Castanho I Alves
and Velarde L Guillermo Coca: Cutoff point of the phase angle in
pre-radiotherapy cancer patients. Nutr Hosp. 32:2253–2260.
2015.PubMed/NCBI
|
|
21
|
Chen W, Zheng R, Zeng H and Zhang S: The
updated incidences and mortalities of major cancers in China, 2011.
Chin J Cancer. 34:502–507. 2015. View Article : Google Scholar : PubMed/NCBI
|