Introduction
Ovarian fibrothecoma is an uncommon type of ovarian
tumor of the thecoma-fibroma group, which is a set of tumors of sex
cord/stromal origin. The thecoma-fibroma group is a spectrum of
benign ovarian tumors that contains fibroma, fibroma-thecoma and
thecoma, depending on the relative proportion of fibroblasts and
theca cells (1).
Fibromas are composed entirely or almost entirely of
fibroblasts and no theca cells, whereas fibroma-thecoma and thecoma
are composed of different proportion of theca cells. Fibromas and
fibrothecomas are considered to be the most common solid primary
tumors of the ovary (2).
Fibroma-thecomas and thecomas share overlapping histological
characteristics (1), so the
designation of fibrothecoma is used. This tumor accounts for ~4% of
all ovarian neoplasms (1). Due to the
low prevalence, the imaging features of fibrothecoma are not fully
known, which results in easy misdiagnosis (3).
Fibrothecomas originate from the ovarian medulla,
whereas fibromas originate from the ovarian cortex (2). The difference in origin and cellular
components leads to different clinical and imaging manifestations
(3). Fibromas are primarily observed
in young women and are usually non-functioning tumors.
Fibrothecomas, however, are usually observed in postmenopausal
women; the mean age of onset is between 55 and 60 years (4). Fibrothecomas are the most common
hormonally active ovarian neoplasms (5). Almost half produce estrogen. A high
level of estrogen, menstrual disorders and vaginal bleeding are
occasionally observed in patients with fibrothecoma (1). They are considered to be benign;
malignancy in fibrothecomas is rarely observed (6).
To the best of our knowledge, several studies have
previously described the imaging features of ovarian fibroma and
fibrothecoma (1,4,5,7). However, the population sample sizes were
small and the different disease subtypes were always discussed
together. Nocito et al (8)
indicated that fibroma and fibrothecoma should be considered as
separate entities. Wu et al (7) previously reported on the magnetic
resonance imaging (MRI) features of fibrothecoma in 26 patients,
and showed that MRI had the superiority to show the ovarian
fibrothecoma characteristics as well as other oestrogenic
functional appearances. The present study retrospectively analyzed
the computed tomography (CT) and MRI features of 25
histologically-proven fibrothecomas. Histological features were
also discussed and compared with the imaging characteristics.
Patients and methods
Patients
The present retrospective study was approved by the
Institutional Review Board of the Affiliated Hospital of Nanjing
University of Chinese Medicine and requirement of written informed
consent was waived. Twenty-six patients with surgically and
pathologically proven ovarian fibrothecomas treated at the
Affiliated Hospital of Nanjing University of Chinese Medicine
between January 2009 and February 2015 were included. Of the 26
patients, 1 was excluded as their tumor was smaller than 1 cm,
which was almost too small to be measured; the remaining 25 cases
were analyzed.
CT and MRI scan protocol
A total of 20 patients were examined with a 64-row
multislice-spiral CT (Brilliance 64; Philips Healthcare, DA Best,
The Netherlands). Of these 20 patients, 15 underwent
contrast-enhanced CT scans with the intravenous administration of
Ultravist. The scanning protocol was as follows: 5-mm layer
thickness, a pitch of 1, 120-kV tube voltage and 200–500-mA tube
current. CT images were processed in workstation for coronal,
sagittal and oblique reconstruction.
A total of 5 patients underwent a 3.0T (Verio,
Siemens AG, Munich, Germany) MRI examination using a body-phase
array coil. All sequences were acquired with anterior and posterior
saturation bands. The transverse planes covered the entire area of
the pelvis. Axial fast low-angle shot two-dimensional T1-weighted
image (T1WI) [time of reception (TR)/time of echo (TE), 139/4.76
msec; thickness, 6.0 mm; interaction gap, 1 mm; field of view, 25
cm], axial turbo spin echo (TSE) T2WI (TR/TE, 1,900/76 msec;
thickness, 6.0 mm; interaction gap, 1 mm; field of view, 25 cm),
and sagittal fat-suppression T2WI (TR/TE, 263/4.76 msec; thickness,
6.0 mm; interaction gap, 1 mm; field of view, 25 cm) were obtained.
The axial, sagittal and coronal T1WI with fat saturation after
gadolinium diethylenetriamine pentaacetic acid (Magnevist; Bayer,
Shanghai, China) administration was performed on 4 patients using
the parameters used in pre-contrast T1WI.
Image analysis
The CT and MRI examinations were reviewed in
conference by 2 experienced radiologists. The following features of
ovarian lesions were noted: The location (left or right side), size
(mean diameter of the three planes), shape (round, oval or
lobulated), boundary (clear or obscure), components (solid, cystic
or mixed), CT density, MRI signal intensity, and ascites in the
abdomen and pelvis. The tumors were graded into 1 of 5 degrees,
depending on the solid and cystic portion in the mass: Degree 1,
pure solid (no radiological evidence of cysts or necrosis); degree
2, predominantly solid (cystic portion <25%); degree 3, mixed
solid and cystic (cystic portion 25–50%); degree 4, predominantly
cystic (cystic portion 51–75%); and degree 5, cystic (cystic
portion 76–100%). The enhancement degree of the solid components
within tumors was compared with that of the uterine myometrium. The
MR signal intensity of the tumor was compared with that of the
adjacent pelvic skeletal muscle.
Pathological examination
Surgical resections were performed in all 25 cases.
Pathological specimens were fixed in 4% formaldehyde (24 h at room
temperature), embedded in paraffin and cut into sections (4-µm
thick), and were subsequently stained with hematoxylin (8 min at
room temperature) and eosin (10 sec at room temperature) solution.
In addition, immunohistochemical staining was performed on 9 tumor
samples. The following primary antibodies were used: Cytokeratin
(CK)-7 (dilution, 1:80; catalog no. OV-TL 12/30); vimentin
(dilution, 1:20; catalog no. V9); epithelial membrane antigen (EMA;
dilution, 1:50; catalog no. E29); Ki-67 (dilution, 1:100; catalog
no. MIB-1); (Dako; Agilent Technologies, Inc., Santa Clara, CA,
USA); CK8 (dilution, 1:100; catalog no. ab53280); CK17 (dilution,
1:20; catalog no. ab109725); anti-inhibin (dilution, 1:20; catalog
no. ab14087); (Abcam, Cambridge, UK.). The expression of Ki-67,
vimentin, inhibin-a and SMA was detected.
Statistical analysis
Statistical analysis was performed using SPSS 17.0
software (SPSS, Inc., Chicago, IL, USA). Qualitative data are
expressed as percentages. Quantitative data are shown as mean ±
standard deviation. Spearman's rank correlation analysis was used
to determine the correlation between the tumor size and the grade
of tumor and ascites. P<0.05 was deemed to indicate statistical
significance.
Results
Clinical data
The clinical data are shown in Table I. The age of the patients ranged
between 41 and 82 years (mean, 60.7±10.8 years). A total of 23
(92%) patients were postmenopausal and 2 (8%) were premenopausal.
Pelvic pain (n=7), postmenopausal vaginal bleeding (n=5) and a
pelvic mass (n=9) found by routine ultrasound examination were the
main complaints reported by patients. There were 4 asymptomatic
cases. Carbohydrate antigen 125 (CA125; normal reference, ≤35 U/ml)
testing was performed on 9 patients and abnormal values were
observed in 6 patients.
 | Table I.Clinical data of patients. |
Table I.
Clinical data of patients.
| Clinical data | Value |
|---|
| Agea (range), years | 60.7±10.8
(41–82) |
| Menopause, n (%) |
|
|
Premenopausal | 2 (8.0) |
|
Postmenopausal | 23 (92.0) |
| Side, n (%) |
|
| Left | 10 (40.0) |
|
Right | 15 (60.0) |
| Pelvic pain, n
(%) |
|
| Yes | 7 (28.0) |
| No | 18 (72.0) |
| Postmenopausal
vaginal bleeding, n (%) |
|
| Yes | 5 (20.0) |
| No | 20 (80.0) |
| Palpable mass, n
(%) |
|
| Yes | 9 (36.0) |
| No | 16 (64.0) |
|
Asymptomatic, n (%) | 4 (16.0) |
| Tumor
sizea (range), cm | 9.8±5.3
(1.5–21.4) |
| ≥6.0, n
(%) | 18 (72.0) |
| <6.0,
n (%) | 7 (28.0) |
| Tumor nature, n
(%) |
|
|
Benign | 24 (96.0) |
|
Malignant | 1 (4.0) |
CT and MRI findings
The imaging features are described in Table II. All 25 tumors were unilateral; 10
lesions (40%) were on the left side and 15 (60%) were on the right.
A total of 24 tumors (96%) had well-defined boundaries, whereas 1
(4%) tumor had an obscure boundary. In total, 15 masses were oval
or round and 10 masses were lobulated. The size of these masses
ranged between 1.5 and 21.4 cm, with a mean diameter of 9.8±5.3 cm;
18 masses (72%) were >6.0 cm in size. Solid and predominantly
solid masses were found in 16 cases: 6 cases were degree 1, 4 cases
were degree 2 and 6 cases were degree 3. Cystic and predominantly
cystic masses were found in 9 cases, and of these, 4 cases were
degree 4 and 5 cases were degree 5.
| Table II.Summary of CT/MRI findings. |
Table II.
Summary of CT/MRI findings.
| Variable | Value |
|---|
| Shape, n (%) |
|
|
Oval/round | 15 (60.0) |
|
Lobulated | 10 (40.0) |
| Boundary, n
(%) |
|
|
Clear | 24 (96.0) |
|
Obscure | 1 (4.0) |
| Solid and cystic
pattern, n (%) |
| Solid
and 50% solid |
|
|
Degree 1 | 6 (24.0) |
|
Degree 2 | 4 (16.0) |
|
Degree 3 | 6 (24.0) |
| Cystic
and 50% solid |
|
|
Degree 4 | 4 (16.0) |
|
Degree 4 | 5 (20.0) |
| Endometrial
hyperplasia, n (%) | 7 (28.0) |
| Ascites, n (%) | 9 (36.0) |
| Unenhanced CT
attenuation of tumor parenchymaa (range), HU | 44.2±12.8
(31.0–79.0) |
| MRI signal of tumor
parenchyma, n (%) |
|
| TIWI
intensity |
|
|
Iso- or mild
hypointensity | 5 (100) |
|
Hyperintensity | 0 |
| T2WI
intensity |
|
|
Iso- or mild
hypointensity | 3 (60.0) |
|
Mainly
isointensity | 2 (40.0) |
|
Hyperintensity | 0 |
| CT and MRI
enhancement of tumor parenchyma, n (%) |
|
|
Mild | 14 (73.7) |
|
Moderate | 4 (21.1) |
|
Marked | 1 (5.3) |
The CT value of the solid regions of these masses
ranged between 31 and 79 HU, with a mean of 44.2±12.8 HU. MRI could
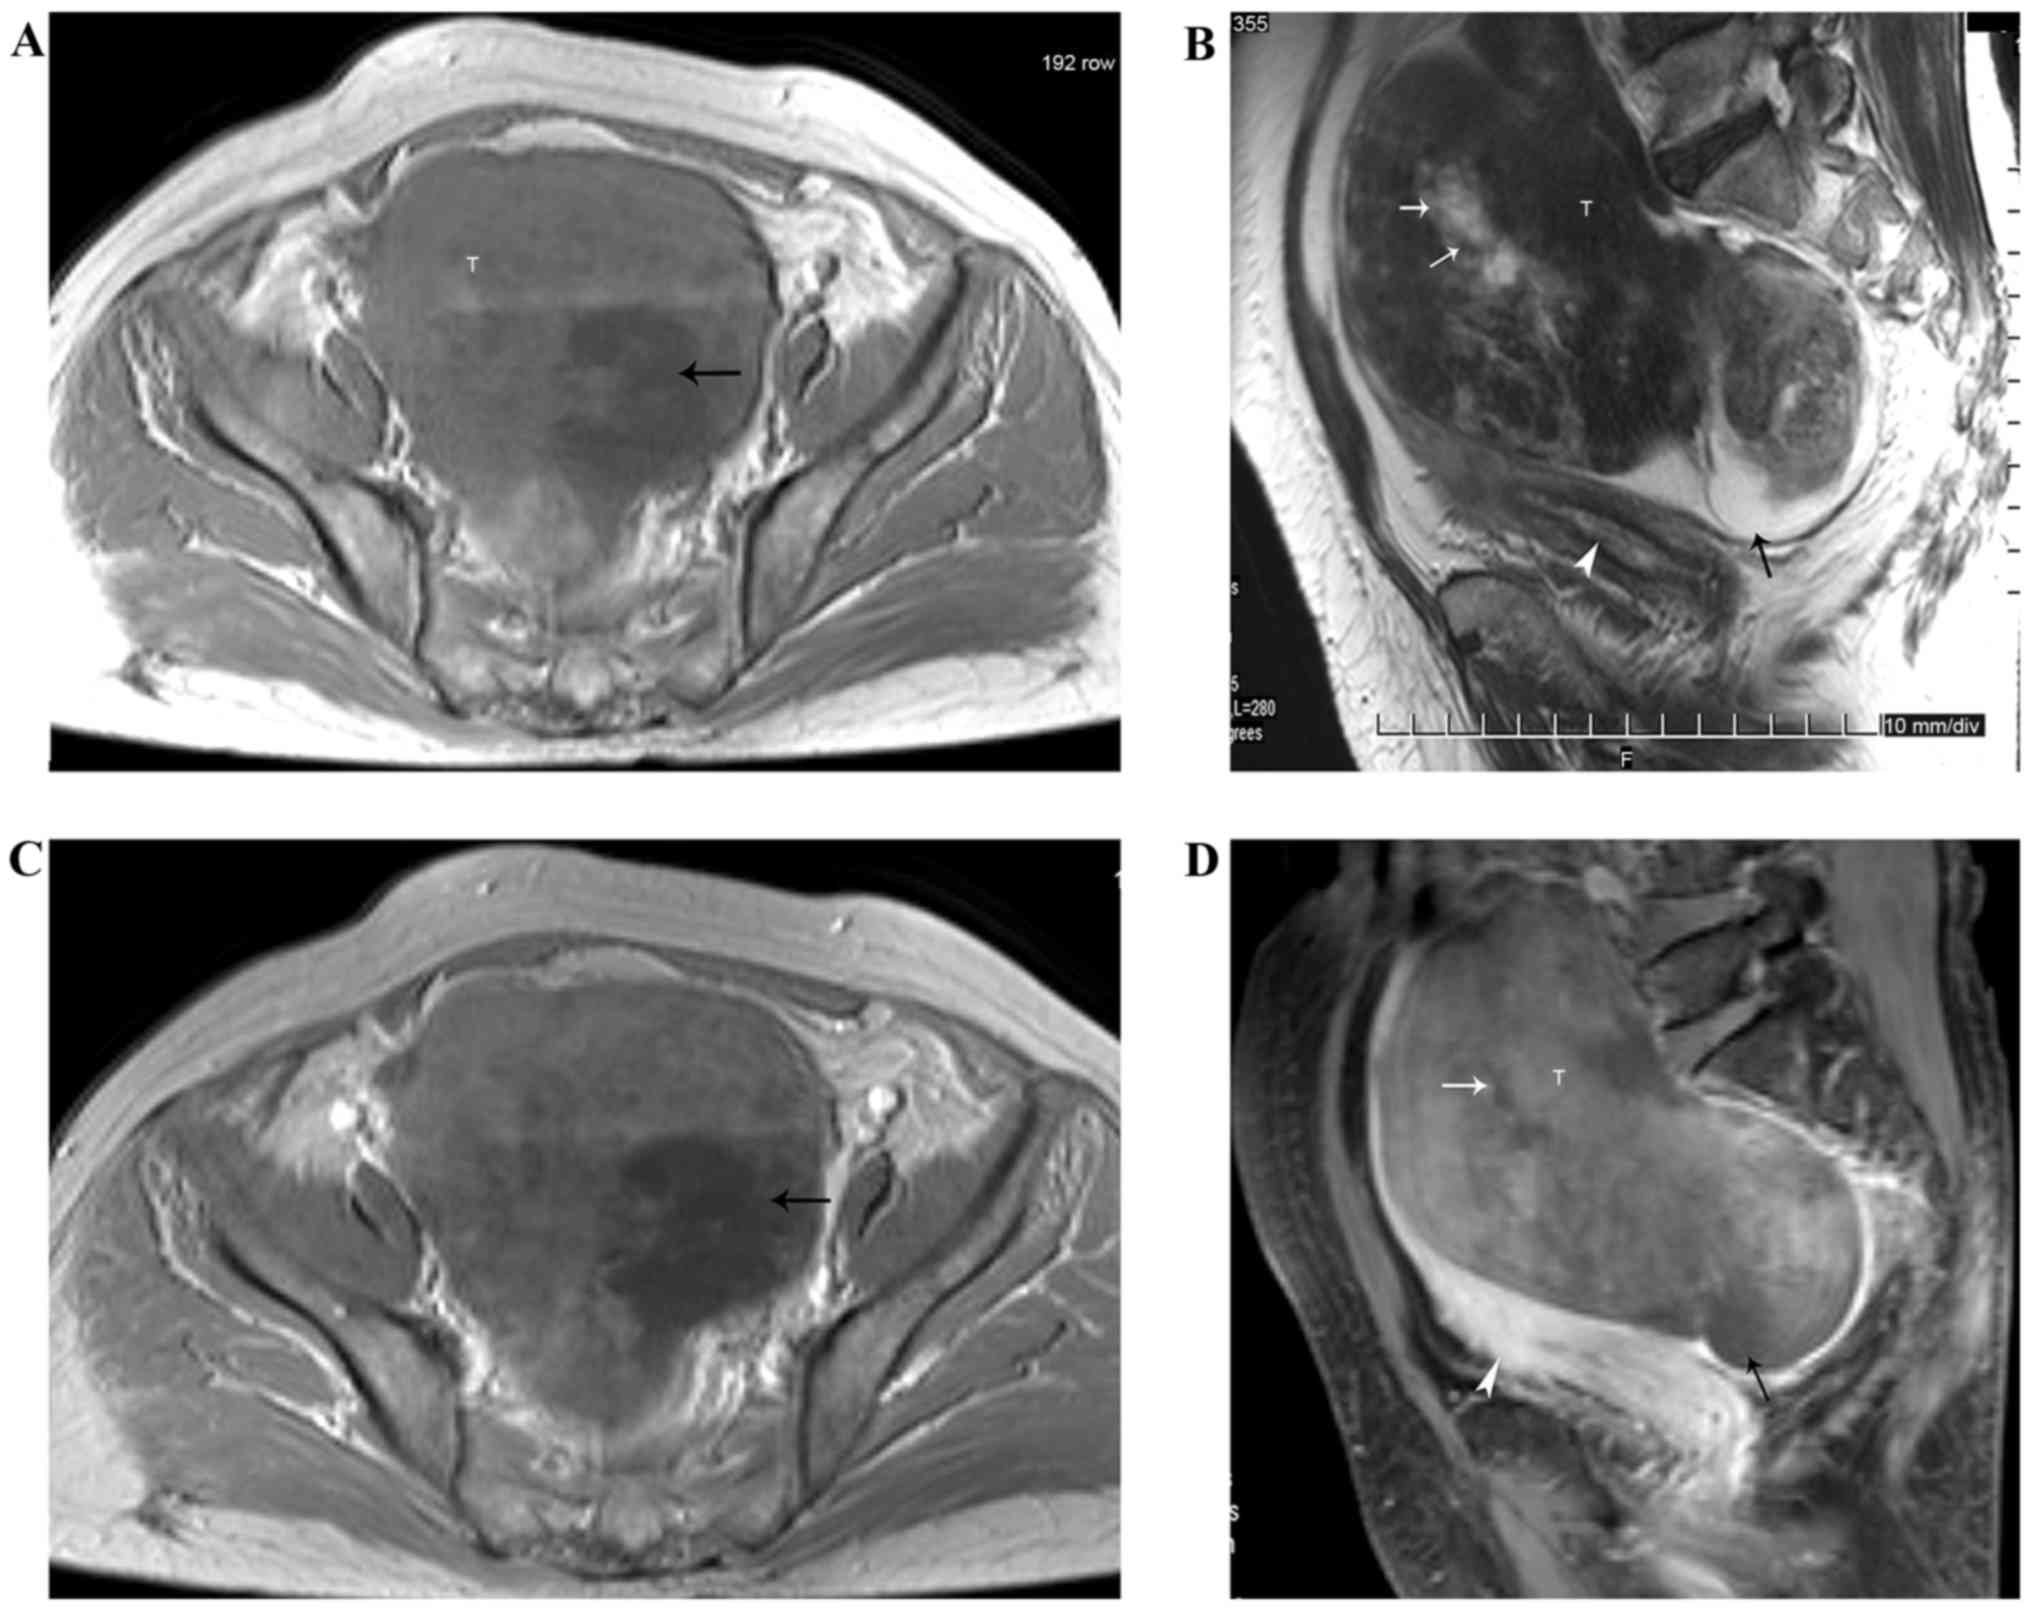
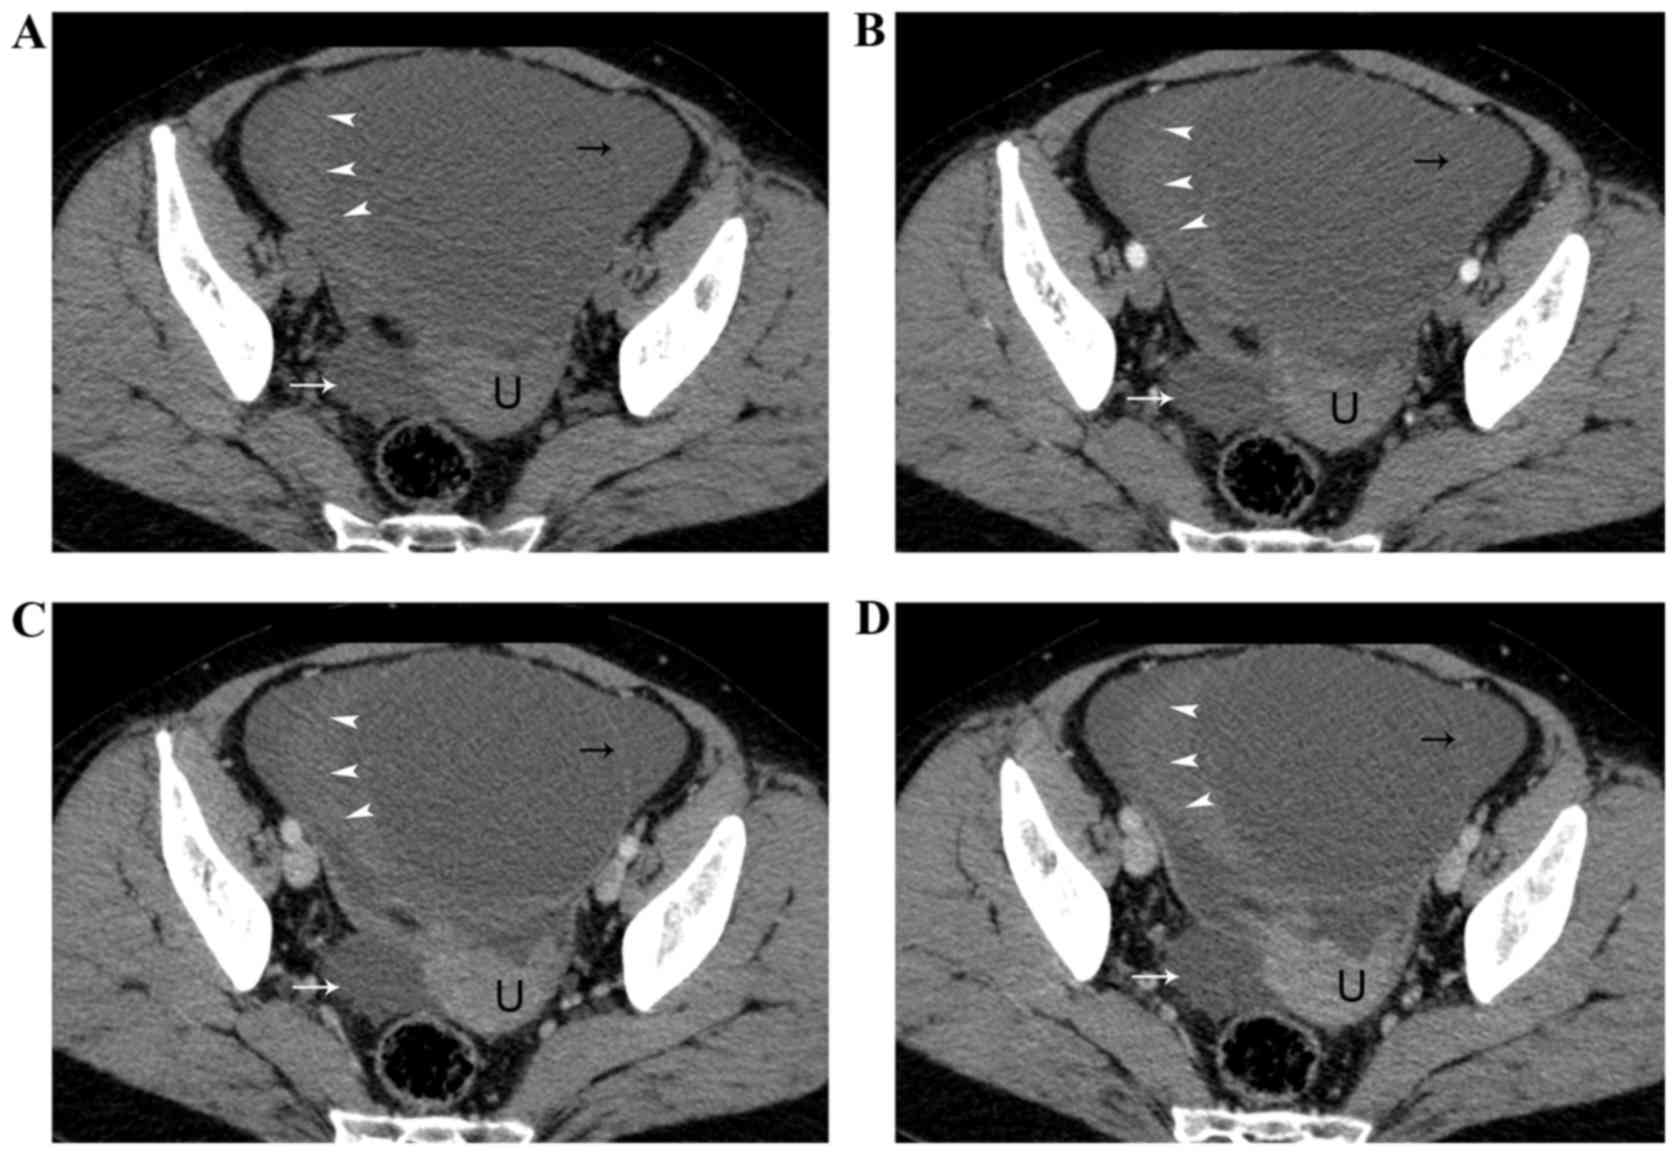
clearly reveal the solid and cystic components of these tumors. The
solid regions of these tumors exhibited isointensity or slight
hypointensity relative to the adjacent myometrium on T1WI and T2WI.
Edema or cystic regions of tumors exhibted hypointensity on T1WI
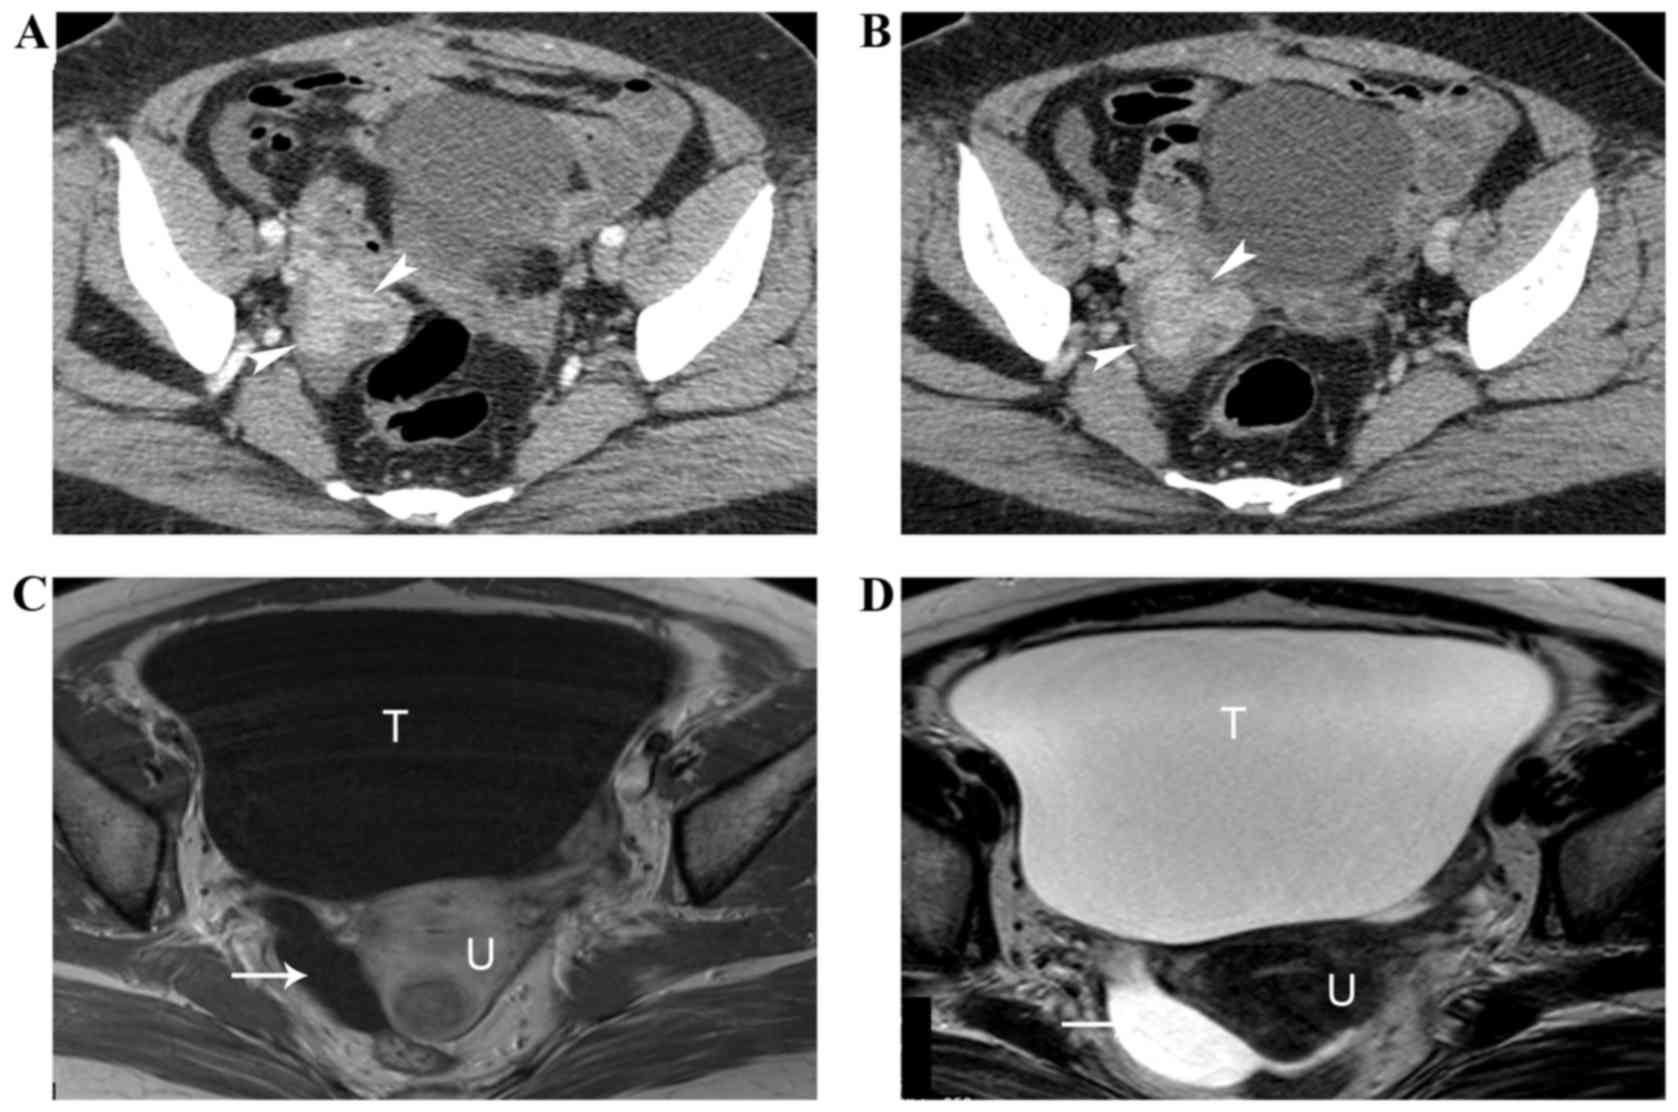
and hyperintensity on T2WI (Fig. 1).
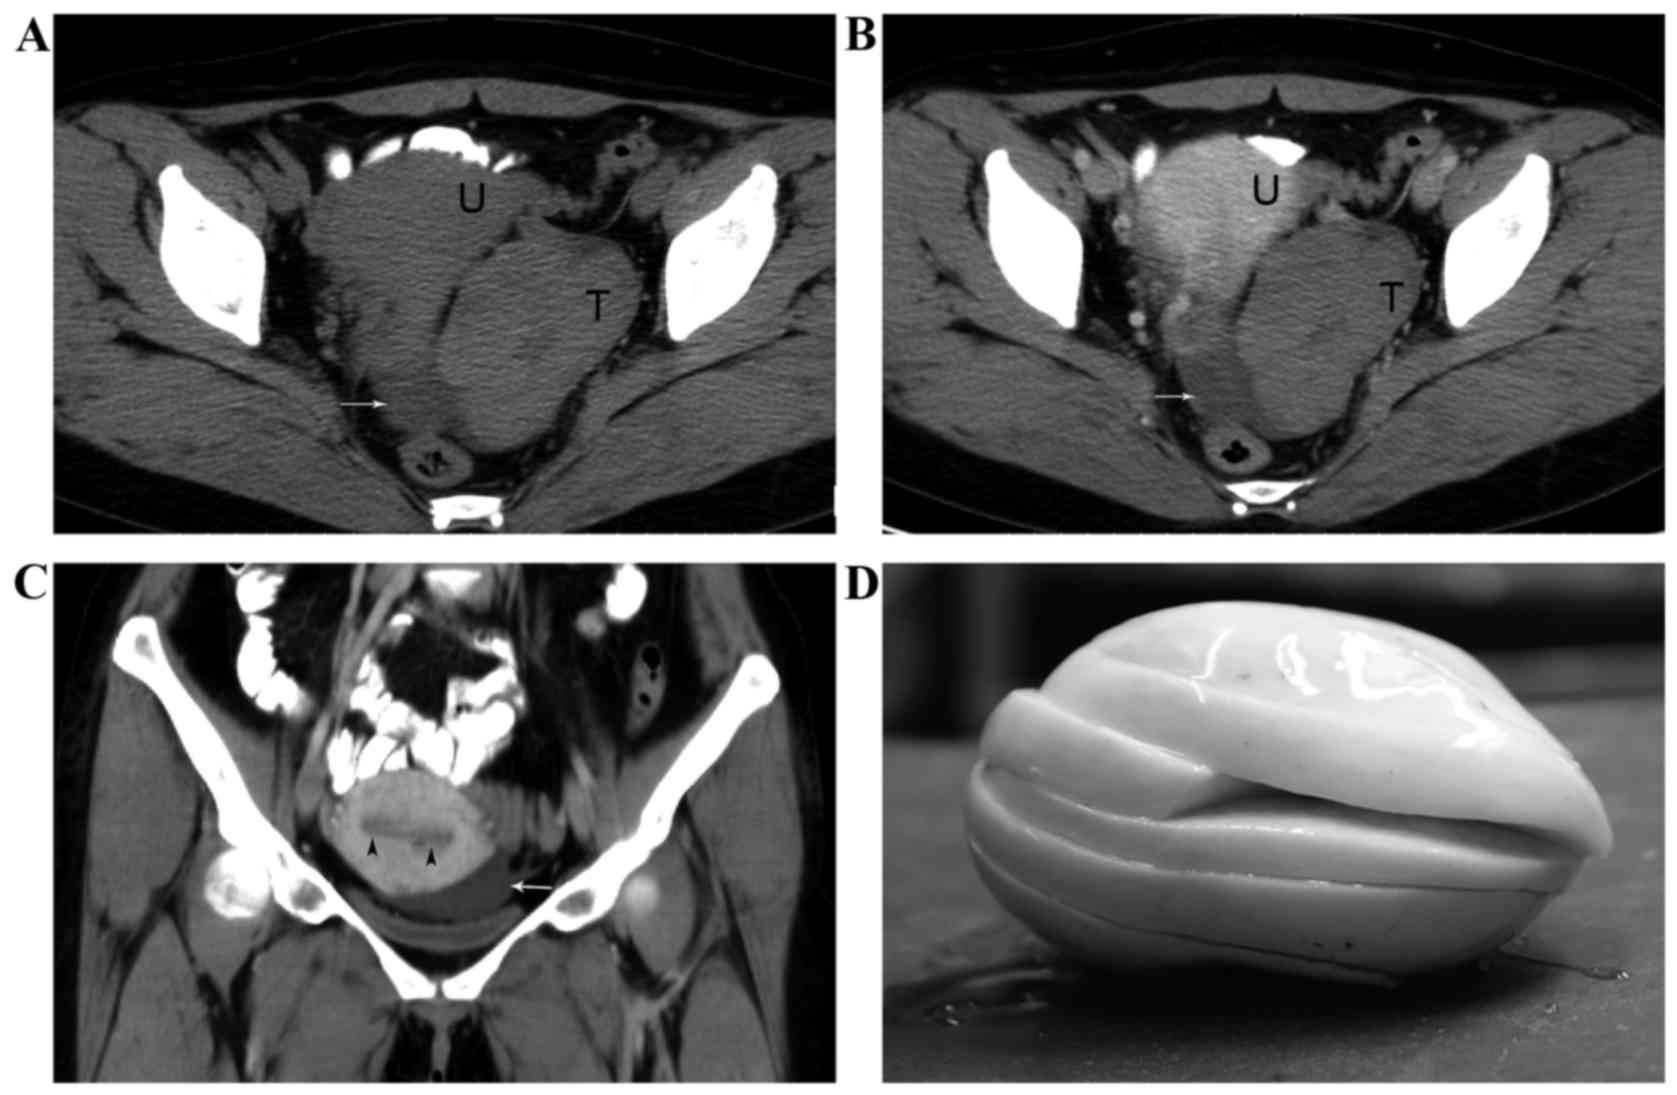
Contrast-enhanced CT or MRI scans were performed on 19 patients,
solid components exhibited mild to moderate enhancement in 18 cases
(94.7%) and 1 case (5.3%) exhibited intense enhancement. The
enhancement degree of these mild to moderately enhanced lesions was
lower than that of normal myometrium on CT and MRI images (Figs. 1–3). The
time-density curve of the tumor plateaued, following an initial
mild enhancement (Fig. 4).
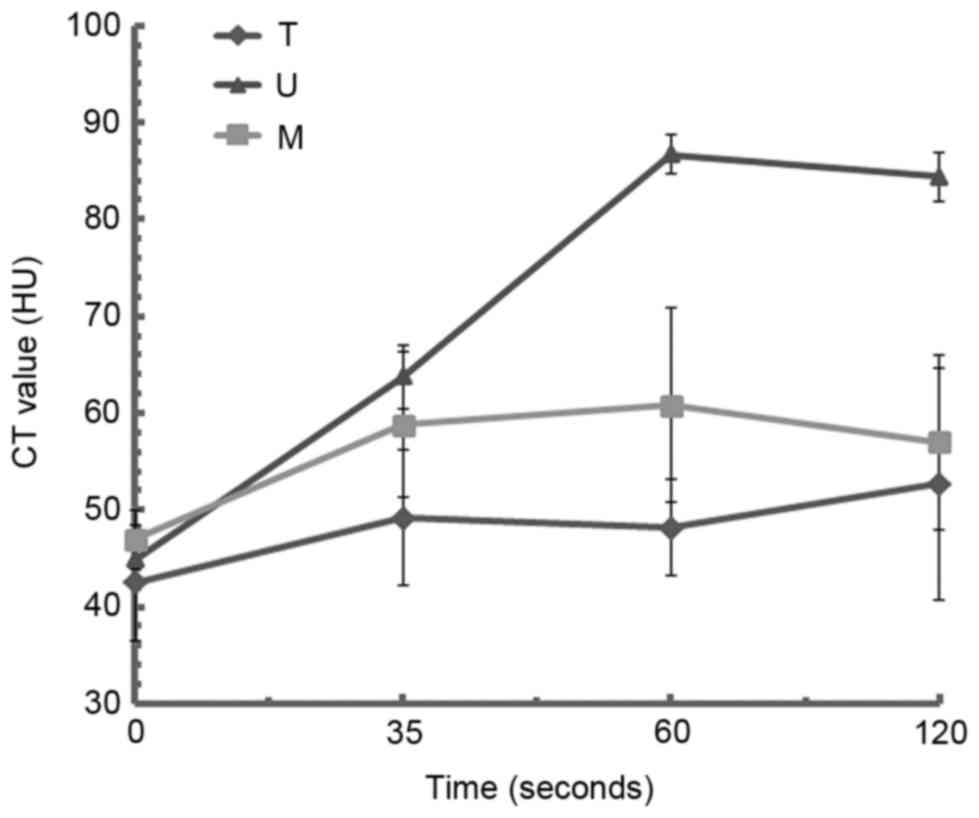 | Figure 4.Time-intensity curve of ovarian
fibrothecoma. The CT values of tumors, uterus and muscle, of the
pelvis were 42.5±6.7, 45.9±2.9 and 46.9±2.7 HU, respectively, on
pre-contrast CT images. The contrast of the tumor is mildly
enhanced in the arterial phase, the time-intensity curve then
plateaus in the venous and delayed phases. The tumor enhancement
value is lower than that of the uterus or the muscle in all three
phases. CT, computed tomography; T, tumor; U, uterus; M,
muscle. |
More detailed information was also obtained about
the surrounding organs, including the uterus, ovaries and bowels.
Thickened endometrium (Figs. 1 and
2) and ascites (Figs. 1, 2 and
5) were found in 7 and 9 patients,
respectively. No patients exhibited an enlarged lymph node. No
calcification was observed in any tumor. In addition, the tumor
size was significantly correlated with tumor cystic degeneration
(r=0.77, P<0.001) and ascites (r=0.41, P<0.001).
Pathological examination
The tumors were oval, round or lobulated in shape.
In 2 patients, the tumors were solid masses, whereas the other 23
tumors were solid-cystic masses with different proportions of solid
and cystic regions. These manifestations matched the findings of
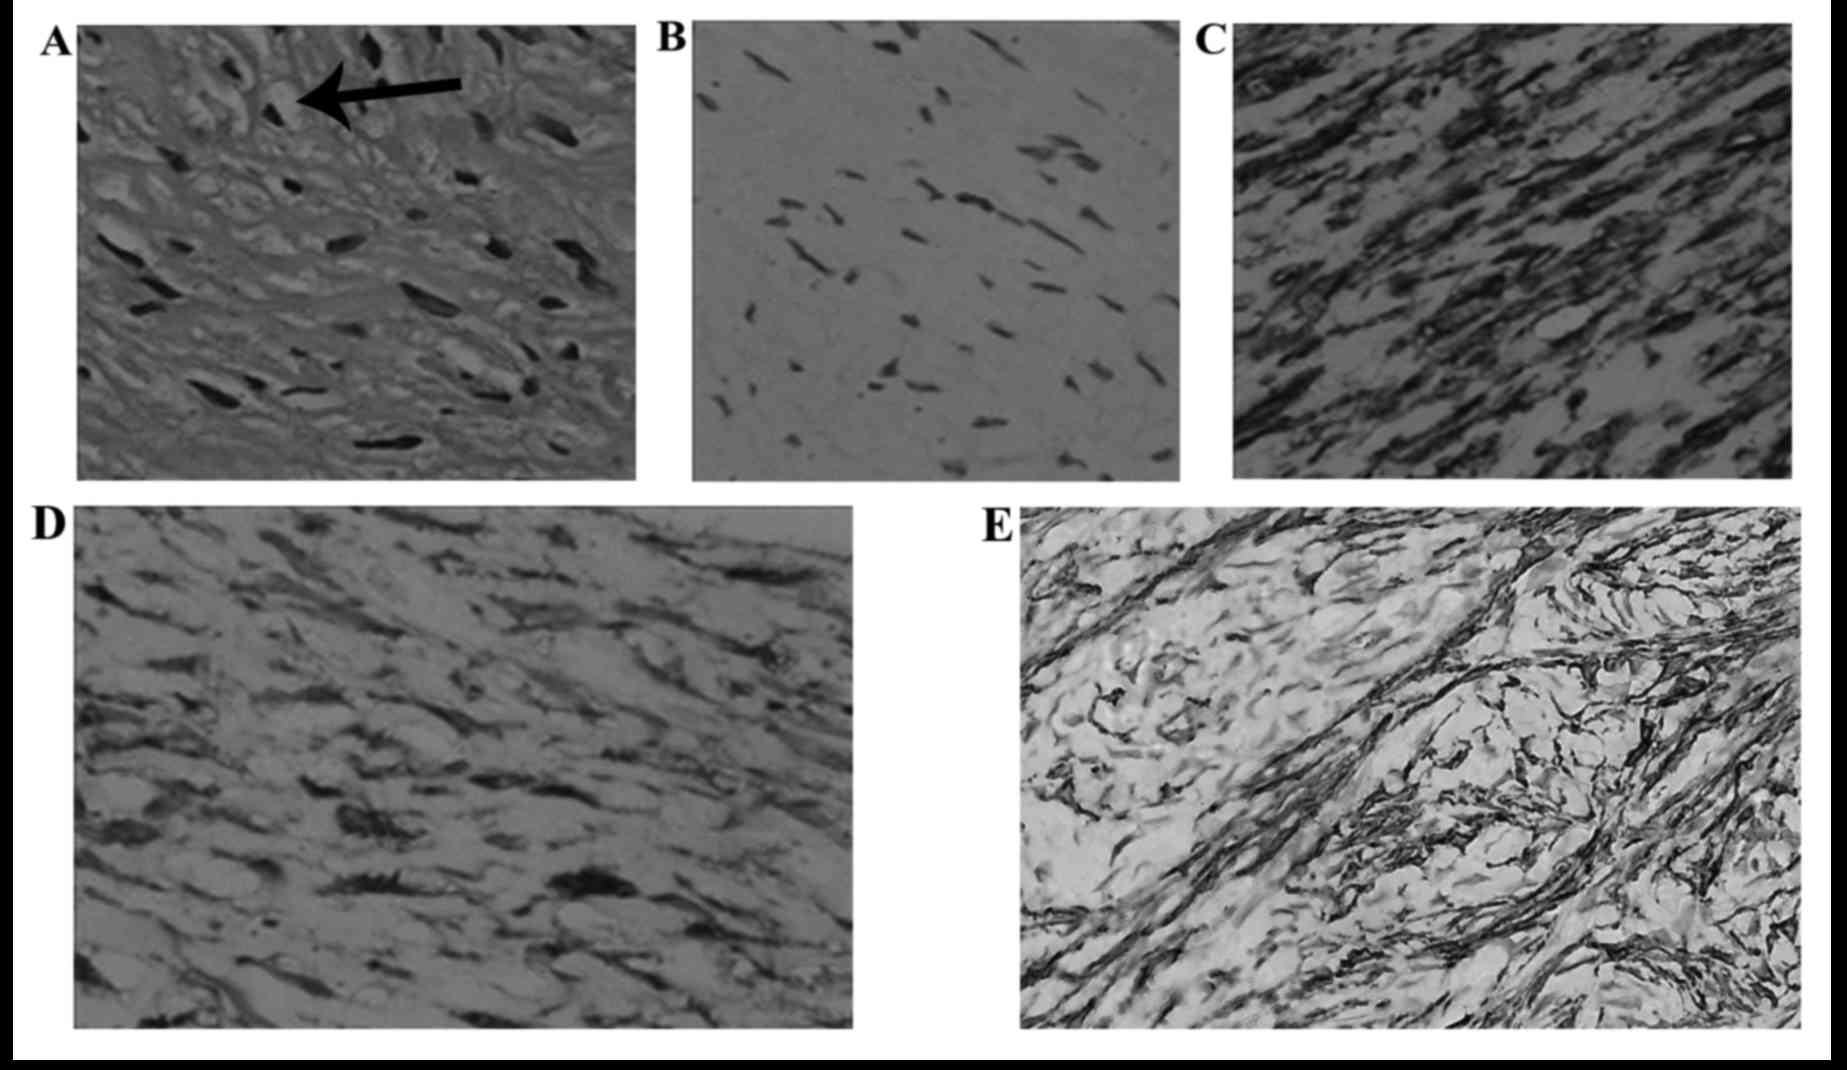
the imaging. Histopathological examination revealed that the tumors
were composed of varying amounts of spindle-shaped cells and theca
cells, with abundant lipid and fibromatous components in the
cytoplasm (Fig. 6A). A total of 19
cases were diagnosed as fibroma-thecoma and 6 were diagnosed as
thecoma; 24 (96%) tumors were benign and 1 (4%) was confirmed as a
low-grade malignancy. Immunohistochemical staining was performed on
9 tumors. Histologically, 7, 7, 5 and 4 tumors positively stained
for Ki-67 (Fig. 6B), vimentin
(Fig. 6C), inhibin-a (Fig. 6D) and SMA (Fig. 6E), respectively.
Discussion
Ovarian fibrothecomas are rare tumors of sex
cord-stromal origin that represent <4% of all ovarian neoplasms
(4). The majority of fibrothecomas
are benign and malignancy is rare (3). The majority of patients who suffer from
this disease are postmenopausal (9).
Generally, pelvic pain or distention and irregular vaginal bleeding
are the main patient symptoms (3,5,7). Estrogenic effects, such as endometrial
hyperplasia, endometrial cancer and postmenopausal bleeding,
commonly accompany fibrothecomas. In the present study, the mean
patient age was 61 years and 23/25 patients were postmenopausal. A
total of 5 patients manifested postmenopausal vaginal bleeding and
7 patients exhibited endometrial abnormalities. It has been
reported that theca cells are endocrine cells located in the
ovarian medulla (10–12). Thus, hormones secreted by theca cells
are believed to be the reason for the prevalence of estrogenic
activity in patients with fibrothecomas. These findings suggested
that the onset age and clinical manifestations may have potential
diagnostic value.
Previous studies have included as many cases as
possible to achieve a comprehensive imaging view on fibrothecomas
(1–4).
Typically, the tumor parenchyma exhibits isodensity on CT images
(1), slight hypointensity or
isointensity in MRI and mild enhancement following the injection of
contrast medium (2,4). A thickened myometrium is usually
observed in postmenopausal women during radiological examinations
owing to the high level of estrogen (1–4). In the
present series, the majority of the imaging features were
consistent with previous studies. One important feature of
fibrothecomas is the lack of blood supply (1). Ultrasound examinations have also shown
that tumors lack blood flow (4). The
tumors exhibit heterogeneous hypodensity or isodensity on CT
imaging and the tumor parenchyma shows mild to moderate enhancement
after contrast medium is injected; marked enhancement is rare.
Typically, the time-density curve of the tumor reveals a plateaued
pattern with little initial contrast-medium uptake. This type of
time-density curve is primarily observed in tumors with abundant
fibrosis. The parenchyma of fibrothecomas typically exhibits
hypointensity to isointensity on T1WI and T2WI when compared with
myometrium. Abundant collagen, fibrostic content and the low blood
flow of the tumor are believed to be the reasons that these
features are observed on CT and MRI scans.
Further disease manifestations were reported in the
present series. The current study showed a significant positive
correlation between the tumor size and the degree of cystic
degeneration. This result also suggests that fibrothecomas are a
type of hypovascular tumor and that the central necrosis is partly
caused by lack of blood supply, which was consistent with a
previous study (13). In the present
study, there were 19 (76%) masses exhibiting cystic degeneration,
which is a slightly higher than that observed in previous studies
(5,14). Only fibrothecomas were included in the
present study, which may manifest as larger masses; cystic
degeneration or necrosis is more frequent in fibrothecomas than
fibromas (14).
Fibrothecomas can present with ascites and pleural
effusion, known as Meigs' syndrome (2,8). In the
present study, 10 (40%) patients exhibited ascites, which is close
to the values reported in previous studies (1,4). No
pleural effusion occurred in the present 25 patients. Zhang et
al (1) reported that larger
tumors tended to be associated with ascites. In the present study,
ascites was also positively associated with tumor size. An ovarian
neoplasm accompanied by ascites may lead to a misdiagnosis as a
malignant tumor, such as cystadenocarcinoma. The solid region and
the septum of cystadenocarcinomas typically exhibit vivid
enhancement, which is higher than that observed in fibrothecomas
(15). Thus, when a large ovarian
tumor is found with pelvic ascites and the solid region of the
tumor exhibits mild to moderate enhancement, fibrothecoma should be
considered as a potential diagnosis.
Histologically, fibrothecomas are composed of ovoid,
spindle-shaped or plump tumor cells with round to ovoid-shaped
nuclei and abundant intracytoplasmic lipids (1,2,5). Immunohistochemical staining reveals that
the majority of fibrothecomas are positive for inhibin-a, vimentin,
Ki-67 and SMA (1,3,8). The
present results are consistent with those of previous reports. In a
total of 9 patients, inhibin-a and SMA staining was observed in 5
and 4 patients, respectively. Inhibin is an endocrine hormone
produced by granulosa cells and testicular Sertoli cells (16). Laboratory tests also indicated that
CA125 levels were higher than normal in 67% of patients (6/9).
These are considered to be important markers for the diagnosis of
sex cord-stromal tumors, particularly fibrothecomas. Additionally,
7/9 patients were positive for vimentin and Ki-67 expression.
Vimentin is a type of intermediate filament protein expressed in
mesenchymal cells, whereas Ki-67 is involved in cell proliferation
and is only expressed in the active stage of the cell cycle
(17). In the present study, the
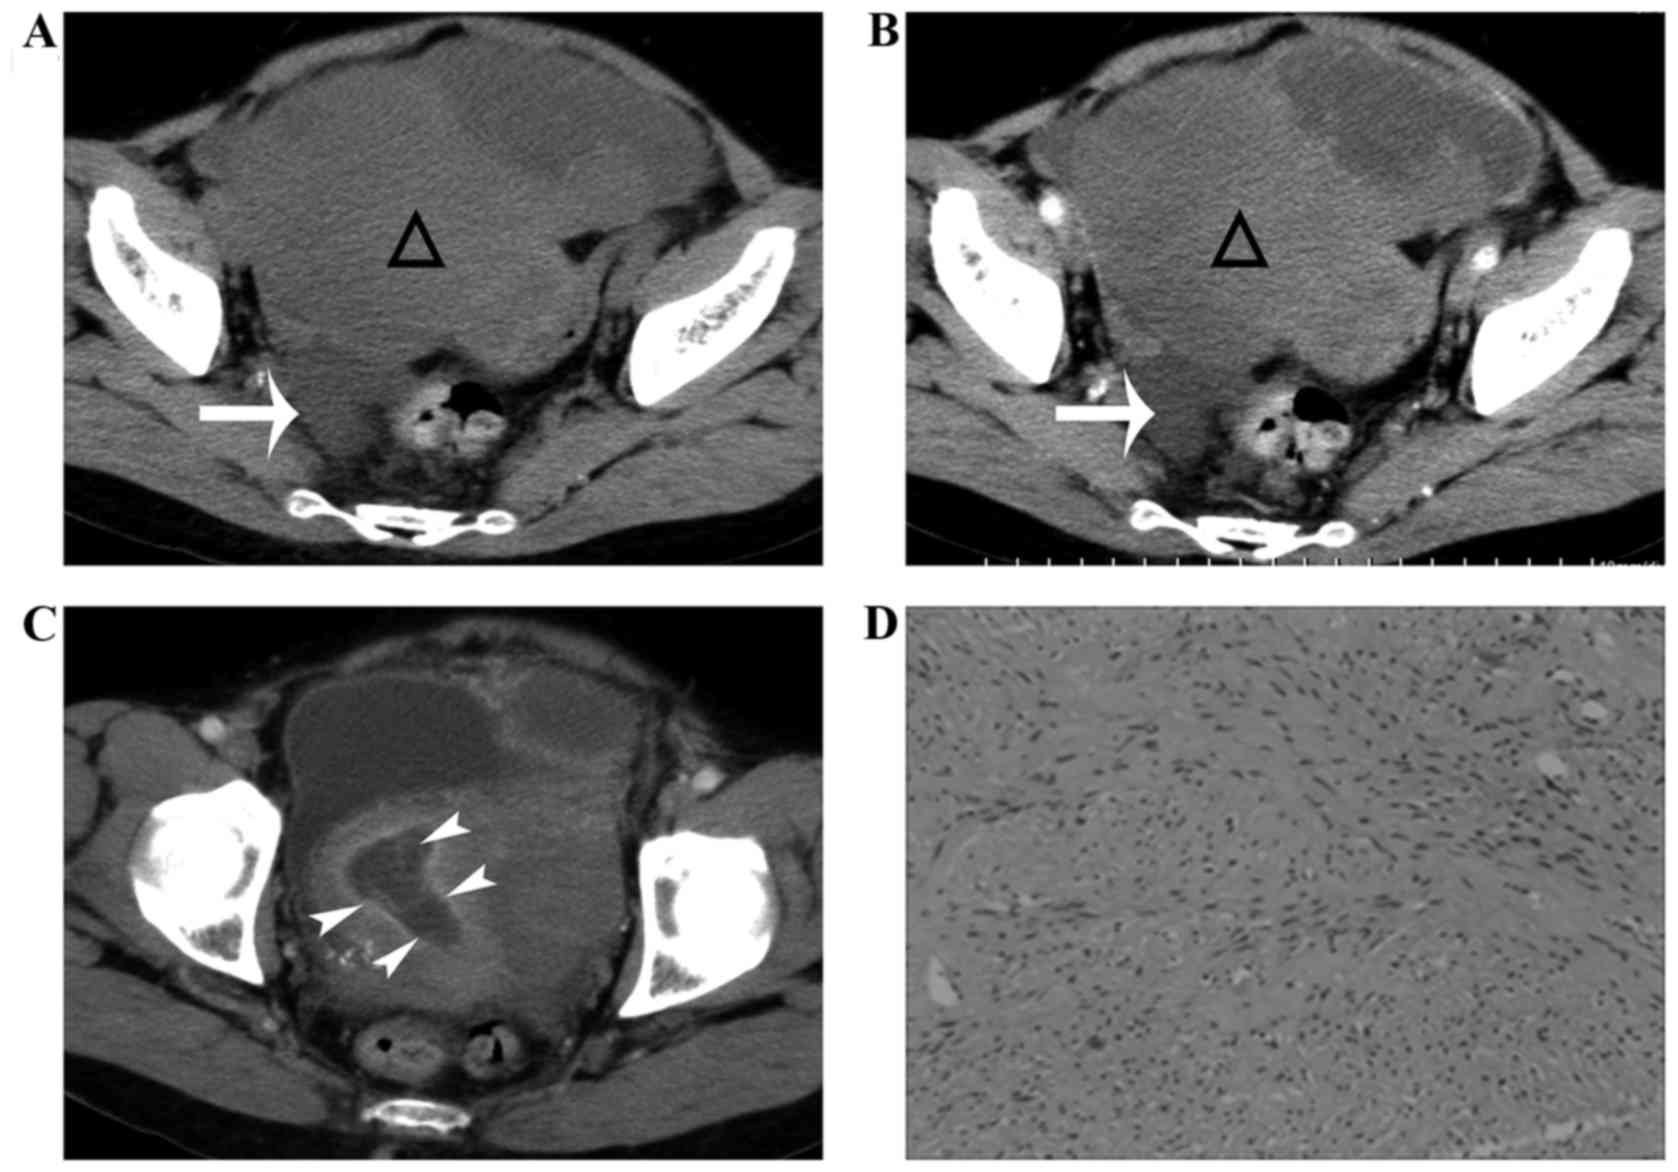
tumor of 1 patient exhibited vivid enhancement on CT scans
(Fig. 7A and B); immunohistochemical
examination showed that the tumor was positive for Ki-67
expression. Expression of Ki-67 may indicate that the tumor is
actively growing. Further study is necessary to confirm whether
this expression is correlated with the atypical intense enhancement
of the tumor parenchyma.
There is overlap between fibrothecomas and other
types of tumors, including subserous leiomyomas, fibromas, Brenner
tumors and cystadenomas. Thus, a differential diagnosis is required
for accurate diagnosis. Subserous leiomyomas commonly appear as
solid masses, with or without necrosis, similar to solid or
predominant solid fibrothecomas. However, leiomyomas have a rich
vascular supply (3). Thus, enhanced
CT or MRI examinations are important. Fibromas and fibrothecomas
are all sex-cord stromal tumors with broadly similar appearances
(18). Similar to fibrothecomas,
fibromas are a type of hypovascular tumor; however, they exhibit
less necrosis and cystic degeneration (19). In addition, the estrogen levels and
the endometrium of patients with fibromas are always normal
(20). In the present study, 8
atypical cases appeared as cystic masses (Fig. 7C and D), with few solid components.
They could easily have been misdiagnosed as Brenner tumors or
cystadenomas, depending on the imaging features. Low signal
intensities on T2WI are also observed in Brenner tumors (21). Brenner tumors are commonly associated
with ipsilateral ovarian neoplasms (22), which are hard to differentiate from
cystic and predominant cystic fibrothecomas (23). Brenner tumors are usually observed in
premenopausal women (21), whereas
the majority of fibrothecomas are found in postmenopausal women;
patients with fibrothecomas can incur higher levels of estrogen.
The parenchyma or septa of cystadenomas exhibit intense enhancement
after administration of contrast medium (23), whereas no such character is observed
in fibrothecomas. The vividly enhanced fibrothecoma should be
differentiated from a sclerosing stromal tumor (SST) of the ovary,
as SSTs are usually found in younger women (19).
There are several limitations to the present study.
Firstly, the number of cases is inadequate; there may be certain
other features of this tumor that have not been observed owing to
the small sample size. Secondly, contrast enhancement was not
performed in all the patients, and further investigations are
therefore required to show the enhancing features. Finally,
estrogen levels were not tested in these patients.
In summary, fibrothecomas exhibit various imaging
findings. Typically, they are well-defined tumors that occur in
postmenopausal woman. The tumor parenchyma exhibits isodensity on
CT scans, a hypointensity or isointensity signal on T1WI and T2WI,
and mild to moderate enhancement after the administration of
contrast medium. When plotted, the time-density curve for the tumor
forms a plateau. Tumor sizes are positively correlated with cystic
degeneration and pelvic ascites. The presence of estrogenic
effects, such as endometrial hyperplasia, postmenopausal bleeding,
elevated serum CA125 levels and positive expression of inhibin-a
and Ki-67, are valuable for fibrothecoma diagnosis.
Acknowledgements
The present study was funded by the National Natural
Science Foundation of China (grant no. 81471705).
References
|
1
|
Zhang Z, Wu Y and Gao J: CT diagnosis in
the thecoma-fibroma group of the ovarian stromal tumors. Cell
Biochem Biophys. 71:937–943. 2015. View Article : Google Scholar : PubMed/NCBI
|
|
2
|
Zhang H, Zhang GF, Wang TP and Zhang H:
Value of 3.0 T diffusion-weighted imaging in discriminating thecoma
and fibrothecoma from other adnexal solid masses. J Ovarian Res.
6:582013. View Article : Google Scholar : PubMed/NCBI
|
|
3
|
Li X, Zhang W, Zhu G, Sun C, Liu Q and
Shen Y: Imaging features and pathologic characteristics of ovarian
thecoma. J Comput Assist Tomogr. 36:46–53. 2012. View Article : Google Scholar : PubMed/NCBI
|
|
4
|
Shinagare AB, Meylaerts LJ, Laury AR and
Mortele KJ: MRI features of ovarian fibroma and fibrothecoma with
histopathologic correlation. AJR Am J Roentgenol. 198:W296–W303.
2012. View Article : Google Scholar : PubMed/NCBI
|
|
5
|
Yen P, Khong K, Lamba R, Corwin MT and
Gerscovich EO: Ovarian fibromas and fibrothecomas: Sonographic
correlation with computed tomography and magnetic resonance
imaging: A 5-year single-institution experience. J Ultrasound Med.
32:13–18. 2013. View Article : Google Scholar : PubMed/NCBI
|
|
6
|
Björkholm E and Silfverswärd C: Theca-cell
tumors. Clinical features and prognosis. Acta Radiol Oncol.
19:241–244. 1980. View Article : Google Scholar : PubMed/NCBI
|
|
7
|
Wu B, Peng WJ, Gu YJ, Cheng YF and Mao J:
MRI diagnosis of ovarian fibrothecomas: Tumour appearances and
oestrogenic effect features. Br J Radiol. 87:201306342014.
View Article : Google Scholar : PubMed/NCBI
|
|
8
|
Nocito AL, Sarancone S, Bacchi C and
Tellez T: Ovarian thecoma: Clinicopathological analysis of 50
cases. Ann Diagn Pathol. 12:12–16. 2008. View Article : Google Scholar : PubMed/NCBI
|
|
9
|
Buy JN and Ghossain M: Sex cord-stromal
tumorsGynecological Imaging. Springer; Berlin, Heidelberg: pp.
329–375. 2013, View Article : Google Scholar
|
|
10
|
Magoffin DA: Ovarian theca cell. Int J
Biochem Cell Biol. 37:1344–1349. 2005. View Article : Google Scholar : PubMed/NCBI
|
|
11
|
Outwater EK, Wagner BJ, Mannion C,
McLarney JK and Kim B: Sex cord-stromal and steroid cell tumors of
the ovary. Radiographics. 18:1523–1546. 1998. View Article : Google Scholar : PubMed/NCBI
|
|
12
|
Tanaka YO, Tsunoda H, Kitagawa Y, Ueno T,
Yoshikawa H and Saida Y: Functioning ovarian tumors: Direct and
indirect findings at MR imaging. Radiographics. 24 Suppl
1:S147–S166. 2004. View Article : Google Scholar : PubMed/NCBI
|
|
13
|
Kato H, Kanematsu M, Ono H, Yano R, Furui
T, Morishige K and Hatano Y: Ovarian fibromas: MR imaging findings
with emphasis on intratumoral cyst formation. Eur J Radiol.
82:e417–e421. 2013. View Article : Google Scholar : PubMed/NCBI
|
|
14
|
Chung BM, Park SB, Lee JB, Park HJ, Kim YS
and Oh YJ: Magnetic resonance imaging features of ovarian fibroma,
fibrothecoma, and thecoma. Abdom Imaging. 40:1263–1272. 2015.
View Article : Google Scholar : PubMed/NCBI
|
|
15
|
Malek M, Pourashraf M, Mousavi AS, Rahmani
M, Ahmadinejad N, Alipour A, Hashemi FS and Shakiba M:
Differentiation of benign from malignant adnexal masses by
functional 3 tesla MRI techniques: Diffusion-weighted imaging and
time-intensity curves of dynamic contrast-enhanced MRI. Asian Pac J
Cancer Prev. 16:3407–3412. 2015. View Article : Google Scholar : PubMed/NCBI
|
|
16
|
Robertson DM, Pruysers E and Jobling T:
Inhibin as a diagnostic marker for ovarian cancer. Cancer Lett.
249:14–17. 2007. View Article : Google Scholar : PubMed/NCBI
|
|
17
|
Winking H, Gerdes J and Traut W:
Expression of the proliferation marker Ki-67 during early mouse
development. Cytogenet Genome Res. 105:251–256. 2004. View Article : Google Scholar : PubMed/NCBI
|
|
18
|
Horta M and Cunha TM: Sex cord-stromal
tumors of the ovary: A comprehensive review and update for
radiologists. Diagn Interv Radiol. 21:277–286. 2015. View Article : Google Scholar : PubMed/NCBI
|
|
19
|
Genç M, Solak A, Genç B, Sivrikoz ON,
Kurtulmuş S, Turan A, Sahin N and Gür EB: A diagnostic dilemma for
solid ovarian masses: The clinical and radiological aspects with
differential diagnosis of 23 cases. Eur J Gynaecol Oncol.
36:186–191. 2015.PubMed/NCBI
|
|
20
|
Cornitescu FI, Tănase F, Simionescu C and
Iliescu D: Clinical, histopathological and therapeutic
considerations in non-neoplastic abnormal uterine bleeding in
menopause transition. Rom J Morphol Embryol. 52:759–765.
2011.PubMed/NCBI
|
|
21
|
Outwater EK, Siegelman ES, Kim B,
Chiowanich P, Blasbalg R and Kilger A: Ovarian Brenner tumors: MR
imaging characteristics. Magn Reson Imaging. 16:1147–1153. 1998.
View Article : Google Scholar : PubMed/NCBI
|
|
22
|
Arnogiannaki N, Grigoriadis C, Zygouris D,
Terzakis E, Sebastiadou M and Tserkezoglou A: Proliferative Brenner
tumor of the ovary. clinicopathological study of two cases and
review of the literature. Eur J Gynaecol Oncol. 32:576–578.
2011.PubMed/NCBI
|
|
23
|
Zhang P, Cui Y, Li W, Ren G, Chu C and Wu
X: Diagnostic accuracy of diffusion-weighted imaging with
conventional MR imaging for differentiating complex solid and
cystic ovarian tumors at 1.5T. World J Surg Oncol. 10:2372012.
View Article : Google Scholar : PubMed/NCBI
|