Introduction
Non-small cell lung cancer (NSCLC) is one leading
cause of cancer deaths in many countries (1). It can be categorized into three major
histological subtypes among which adenocarcinoma (AC) and squamous
cell carcinoma (SCC) account roughly for 40 and 30% of the lung
cancer (LC) cases, respectively (2).
Increasing evidence supports that AC and SCC differ in the
composition of genes and molecular characteristics. For instance,
Hou et al (3) found that in
contrast to the AC-associated genes are highly enriched to tight
junction and cell adhesion molecules, the SCC-associated genes are
more correlated to cell communication. Therefore, they are
currently regarded as two distinct diseases.
Currently, treatment choices for the NSCLC patients
mainly depend on the stage at which cancer was diagnosed regardless
of the histological subtype. For example, patients at the stage IA
usually undergo surgical resection and rarely prescribe to adjuvant
chemotherapy. But the recurrence rates of patients at the same
stage of cancer are heterogeneous, making such homogeneous
treatment choices implausible. It is becoming critical to evaluate
the risk profiles of patients using a reliable molecular/gene
signature. Nevertheless, due to the fundamental differences between
AC and SCC of NSCLC patients, it is hypothesized that specific
genes are related to recurrence/survival rates for each histology
subtype (4–6).
To deal with the issue of high dimensionality
commonly existing in gene expression profiles, downsizing from
thousands of genes to a minimal gene signature with maximal
predictive ability is of the essence. In statistics, this process
is referred to as feature selection (7). Efforts have been devoted to distinguish
AC from SCC using gene expression profiles and various feature
selection algorithms (8–12), and more recently to identify
prognostic markers for each specific subtype (4–6).
Genes are highly correlated and can be grouped into
many gene sets correspondingly. Depending on if these group
structures are taken into account, a feature selection algorithm
may be classified into either a pathway-based or a gene-based
method. Studies have demonstrated that compared to its gene-based
counterpart, a pathway-based feature selection algorithm in which
pathway information is utilized to assist the selection process has
a better predictive performance, stability or biological
interpretation (13–18). Specifically for the NSCLC
applications, several pathway-based feature selection algorithms
have been applied to distinguish its major subtypes and/or
histological stages (8,11,14).
As a data visualization method, the Radial
Coordinate Visualization (RadViz) method (19) can display more than two variables in a
2-dimensional projection. It can also be used to search for
biologically interesting patterns and select relevant genes highly
associated with the phenotype of interest (9,20). In a
Radviz projection, features such as genes are presented as anchor
points spaced around the perimeter of a circle while samples are as
points inside the circle. Each point (i.e., a sample) is held in
place by springs that are attached at the other end to the feature
anchors (i.e., genes). The stiffness of each spring is proportional
to the sample's corresponding gene expression value and the point
ends up at the position where the spring forces for these anchors
are in equilibrium. When used for the purpose of feature selection,
RadViz may be roughly regarded as a gene-based method since it does
not account for any pathway information.
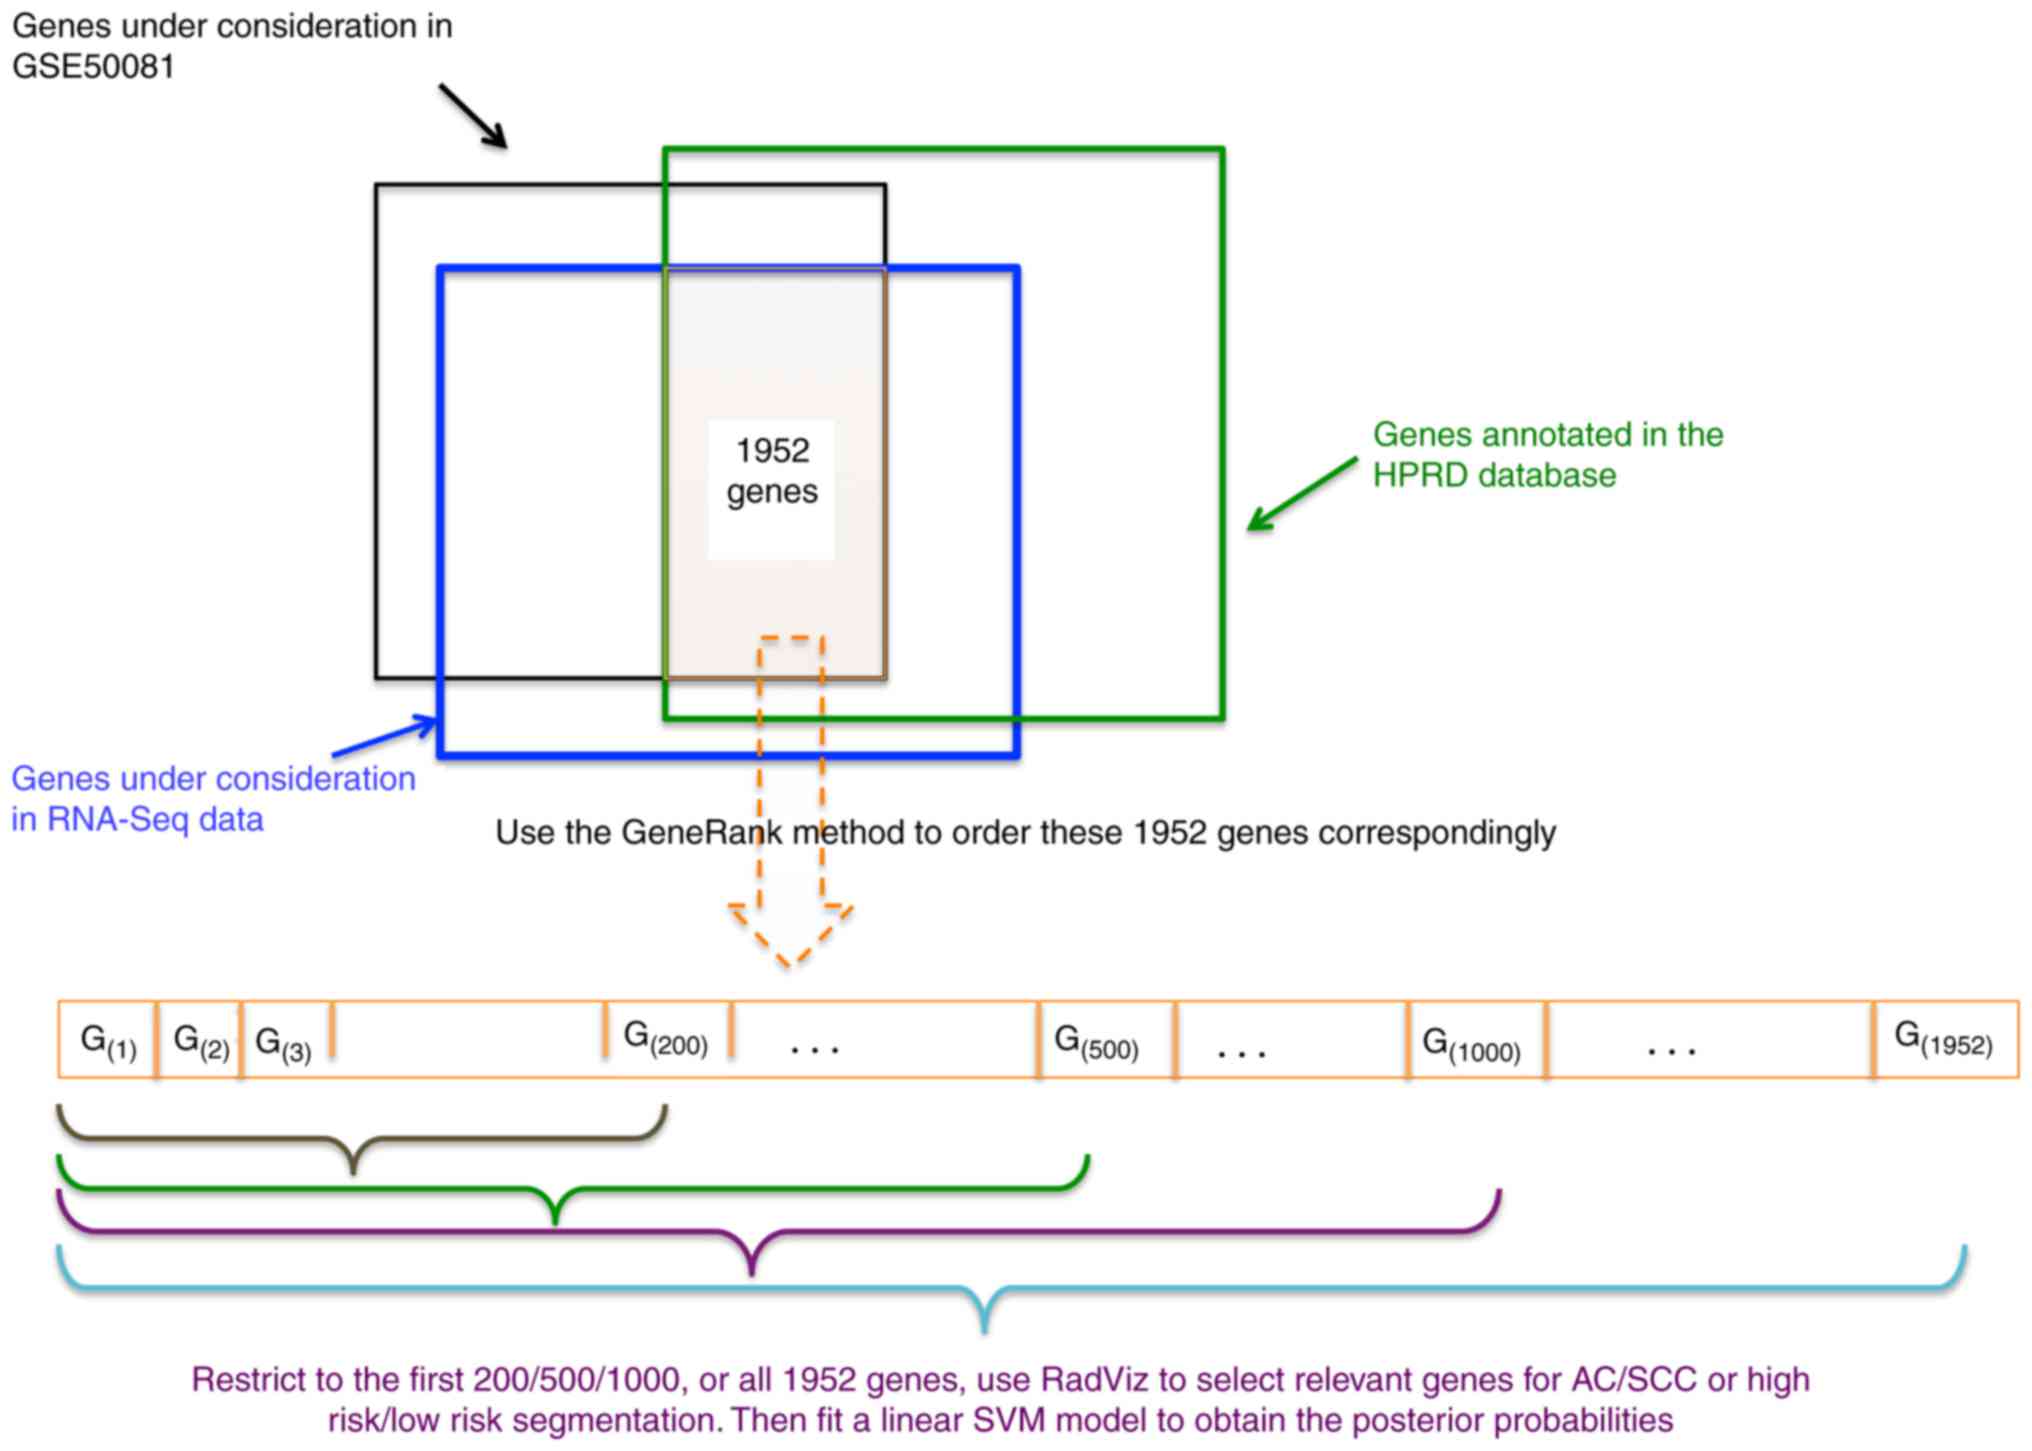
In this article, we first ordered genes using a
novel ranking method in bioinformatics-the GeneRank method
(21) which ranks genes according to
not only its expression level but also its connectivity with other
genes in the gene-to-gene interaction network, and then we
restricted the genes under consideration to those ranked on the top
by the GeneRank method and used RadViz to select relevant genes in
the restricted search space. The proposed procedure is a
combination of the pre-filtering and RadViz, in which the
connectivity information is also incorporated. We applied the
proposed procedure to a set of NSCLC data to establish diagnostic
gene signatures for the classification between AC and SCC and
prognostic signatures for the survival prediction of NSCLC
patients.
Materials and methods
Experimental data
One microarray dataset and one RNA-Seq dataset were
included in this study. The microarray data was under the accession
number of GSE50081 in the Gene Expression Omnibus (GEO: http://www.ncbi.nlm.nih.gov/geo/) repository. It
was hybridized on Affymetrix HGU133 Plus 2.0 chips, including 127
AC and 42 SCC patients. We excluded those patients censored before
a 5-year period and then stratified the remaining 133 patients into
two categories: high-risk patients who had died and low-risk
patients who had survived more than 5 years. The microarray data
set was used as the training set to train the final statistical
models (i.e., the diagnostic/prognostic signatures).
The RNA-Seq data were downloaded from The Cancer
Genome Atlas (TCGA: https://tcga-data.nci.nih.gov/tcga/) on August 13,
2014. After restricting the patients to those at early stages and
being adjuvant treatment naïve with survival information, this
leaves 70 AC and 55 SCC subjects in this study. In the present
study, the RNA-Seq dataset was used as the test set to validate the
performance of the resulting diagnostic/prognostic signatures.
Pre-processing procedures
For the microarray data, the expression values were
obtained using the frma algorithm (22) and normalization across samples was
carried out using quantile normalization. The resulting expression
values were log2 transformed and further standardized to
have a mean of 0 and a standard deviation of 1 for each gene. For
the NSCLC RNA-seq data, Counts-per-million (CPM) values were
calculated and log2 transformed by the R Voom function
(23). Then the resulting values were
standardized as well.
Statistical analysis
As mentioned in the Introduction section, RadViz is
a visualization method that can be used for the purpose of feature
selection and classification. In order to obtain a clear and good
separation among different classes using several genes, Radviz
needs to search over a myriad of possible combinations. This search
is tedious. To automatically solve this problem, an approach called
VizRank had been proposed by (24),
which scores the visualization projects according to the degree of
class separation and then to find those with the highest scores. In
VizRank, features are ranked using signal-to-noise ratio and a
subset of the features is randomly chosen favoring features with
higher ranks, given such genes convey more information about the
classification under investigation. Lastly, for a selected gene
subset, VizRank then evaluates exhaustively all possible
projections defined by different permutations of feature anchors on
the circle to obtain the optimal projection.
GeneRank
The GeneRank method (21) ranks genes on the basis of both genes'
expression values and their connectivity information. Specifically,
it solves the following equation,
(I–dWD–1)r=(1–d)exp
here, W denotes the adjacency matrix of genes, and D
is a diagonal matrix recording the degrees (i.e., the number of
genes to whom the specific gene is connected in the pathway graph)
of genes. The gene expression value is represented by exp, and d is
a tuning parameter, balancing the influence of a gene's expression
value and its connectivity information. Its default value of 0.5
was used in this study. The GeneRank for each gene was calculated
using the R pathClass package.
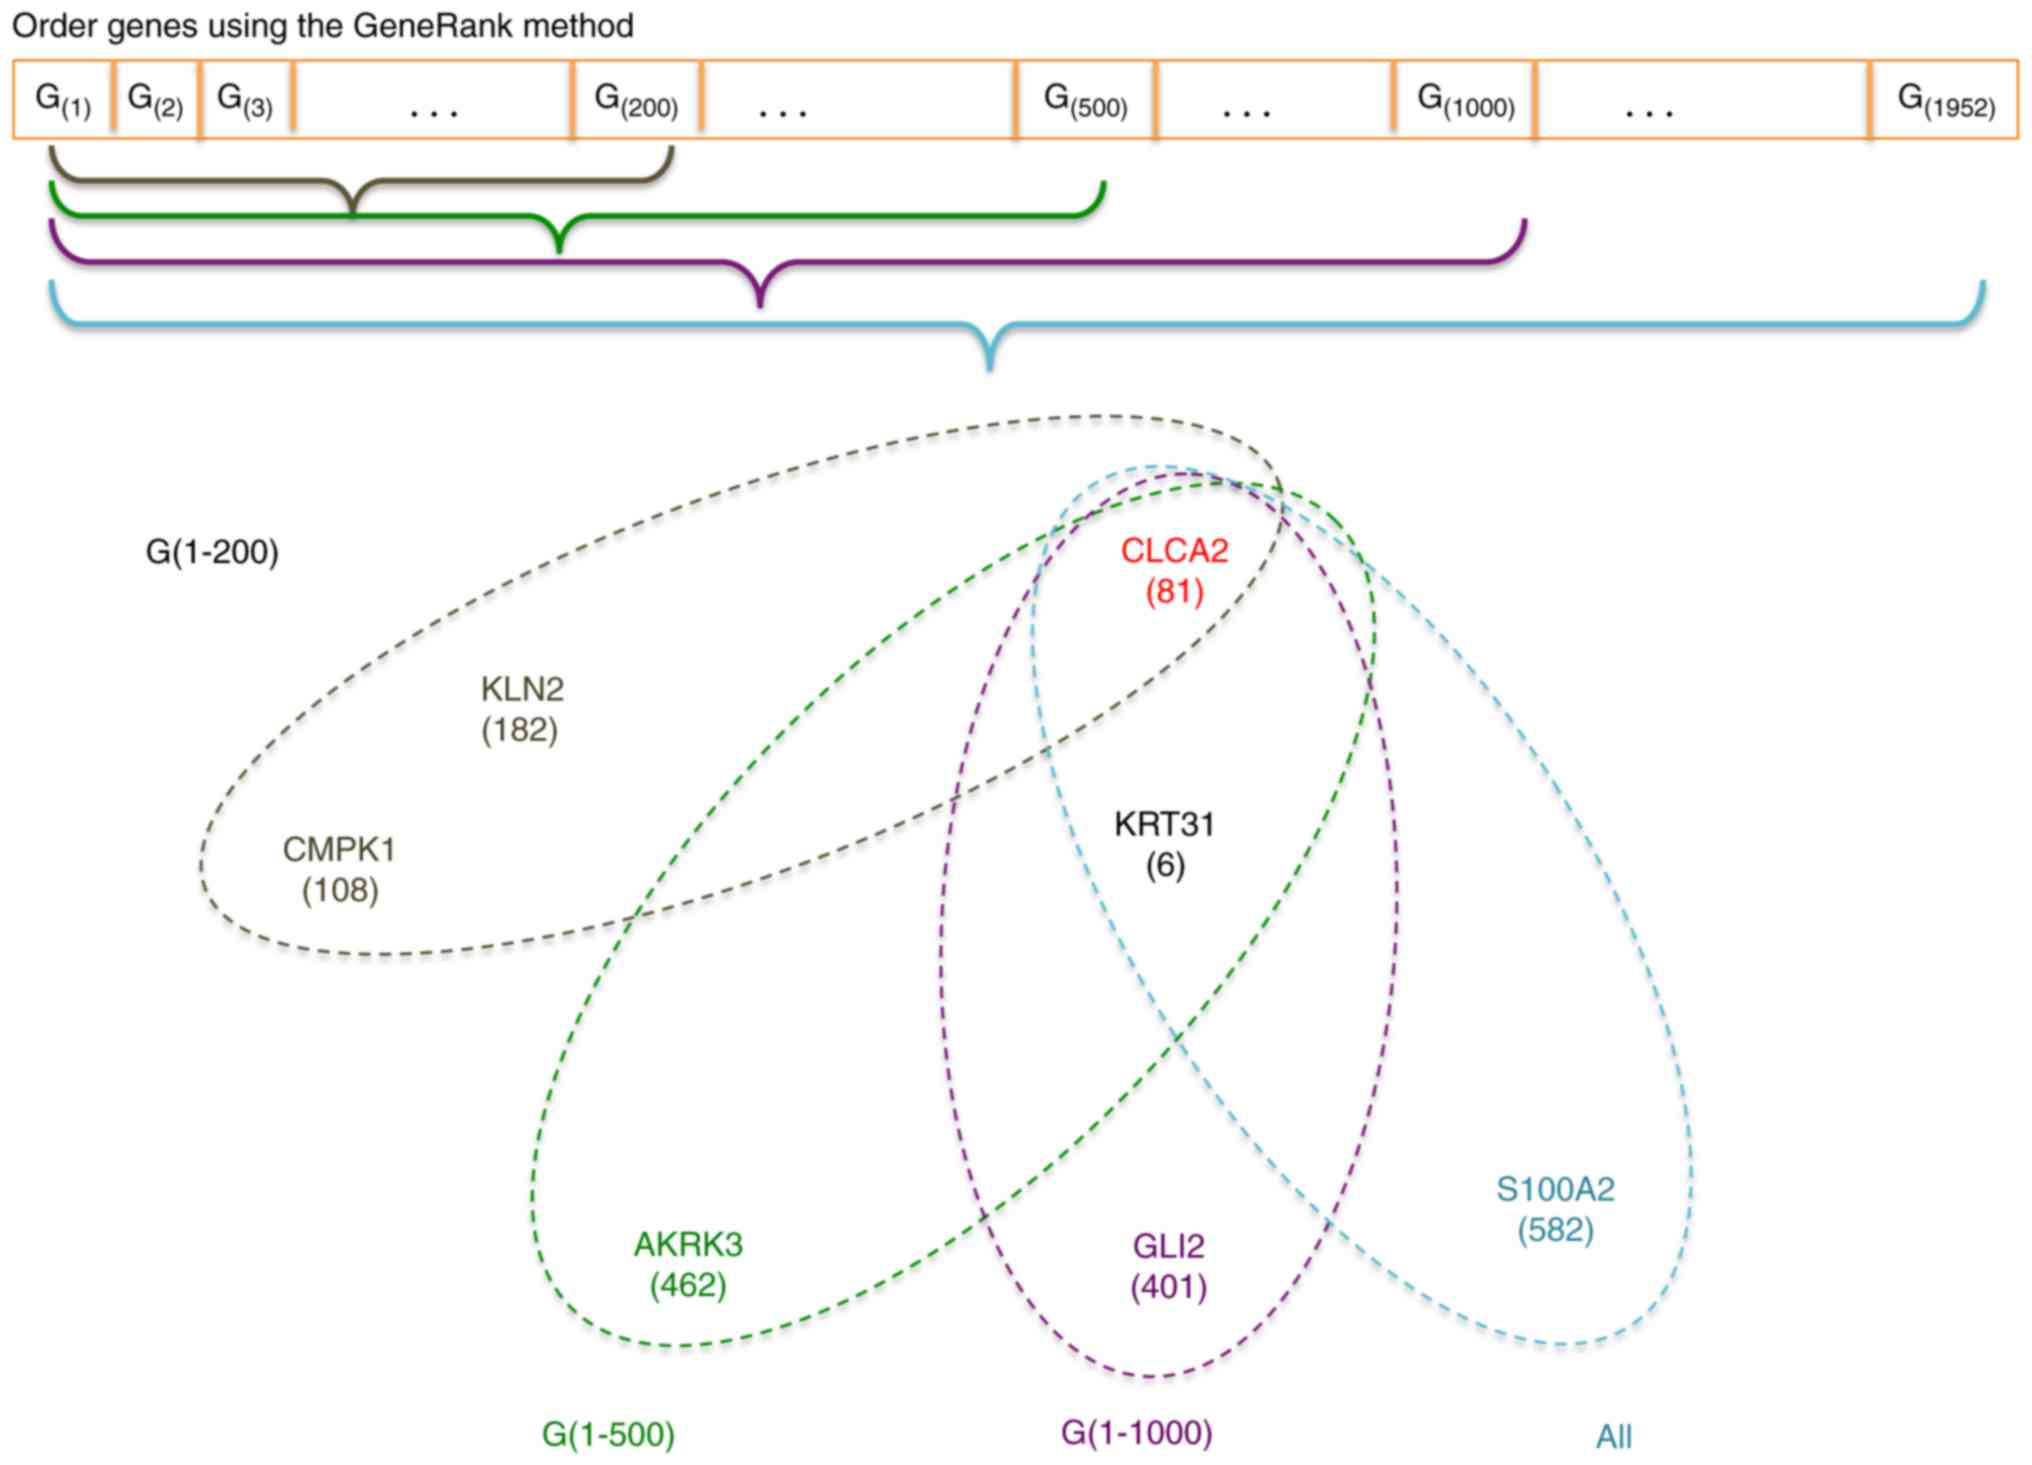
In our proposed procedure, all genes under
consideration were firstly ordered according to their GeneRanks.
Then upon the first 200, 500, 1,000, and all genes in this list, we
used RadViz to select the optimal gene subset with the best VizRank
score (the maximum number of genes was set at 8). The proposed
procedure is graphically illustrated in Fig. 1.
Statistical metrics
To evaluate the performance of a resulting
diagnostic signature, two metrics-Generalized Brier Score (GBS),
and misclassified error rate-were considered. GBS was defined as
(25),
GBS=∑i=1n∑k=1k(Yik–pik)2/2
where Yik is an indicator function,
indicating whether or not subject i (i=1,2, …, n) in class
k (k=1, 2, …, K). And pik denotes the calculated
probability of subject i belonging to class k. Of
note, we normalized the GBS by the sample size n. As a result, the
normalized GBS falls inside [0, 1], with a value closer to 0
indicting a better separation among classes.
For a resulting prognostic signature, we used the
C-statistic over the follow-up period (0, τ) to evaluate its
performance. Specifically, the censoring-adjusted C-statistic is
defined by (26) as,
Cτ(β)=P(g(Xi)>g(Xj)|Ti<Tj,Ti<τ)
where g(X) is the risk score for a subject with
predictor vector X. Ti and Tj the survival
time for patient i and patient j, respectively. C-statistic can be
estimated using R package survAUC, with a value closer to 1
indicating a better performance.
Additionally, we fitted a multiple Cox regression
model using the selected genes as covariates and calculated the
risk scores for each patient using the estimated coefficients in
this model. Setting the mean value of those risk scores as a
threshold, we classified patients into a low-risk group or a
high-risk group. We obtained Kaplan-Meier curves using the
resulting risk scores, and compared the two curves using log-rank
tests. P-value of the log-rank test was the other metric used to
compare the performance of resulting prognostic signatures.
Statistical language and packages
Statistical analysis including SVM, GeneRank, and
performance metric calculation was carried out in the R language
version 3.2 (http://www.r-project.org).
RadViz/VizRank analysis was conducted using the Orange software,
version 2.7 (http://www.orange.biolab.si).
Results
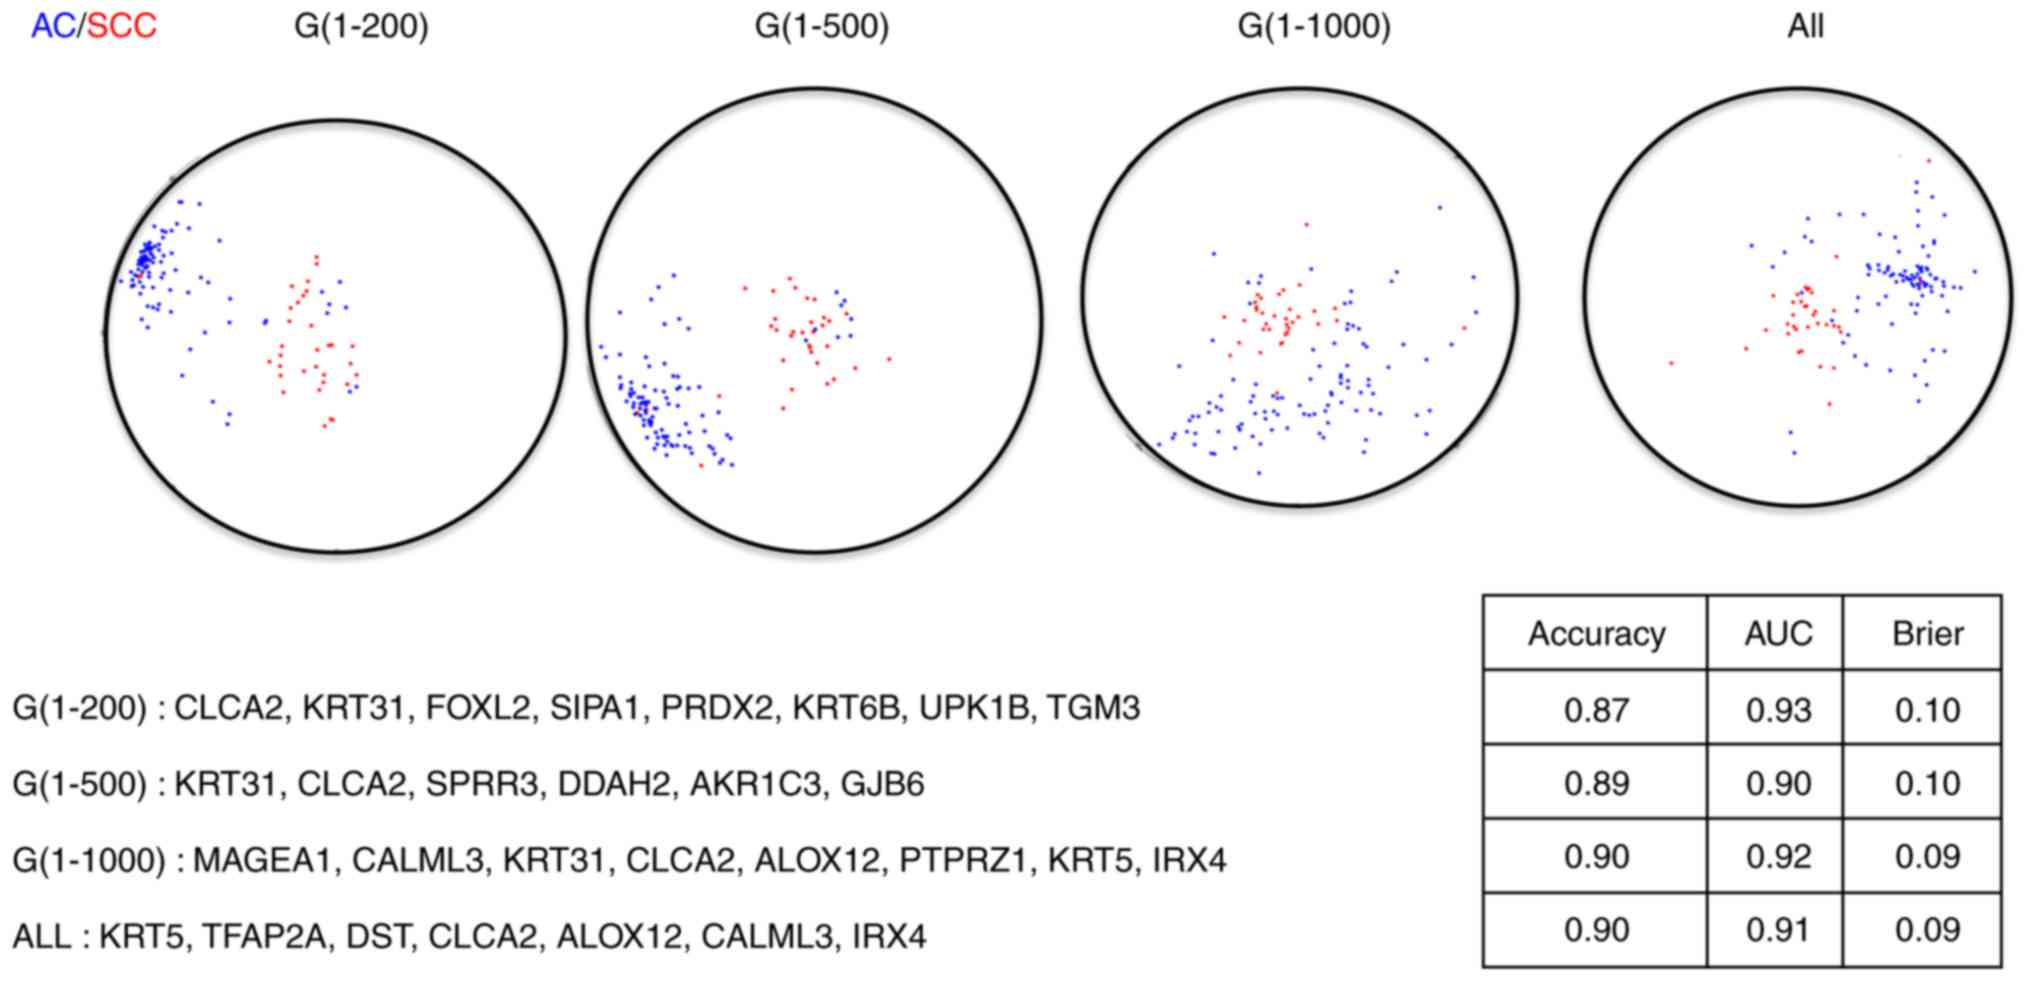
We applied the proposed procedure to the NSCLC
application and obtained two sets of gene signatures-one for the
AC/SCC segmentation and the other for high/low risk segmentation,
being herein referred to as the diagnostic signature and the
prognostic signature, respectively. We consider four scenarios: the
genes under consideration were restricted to the first 200, or 500,
or 1,000 highest-ranked genes and then were all 1,952 genes in the
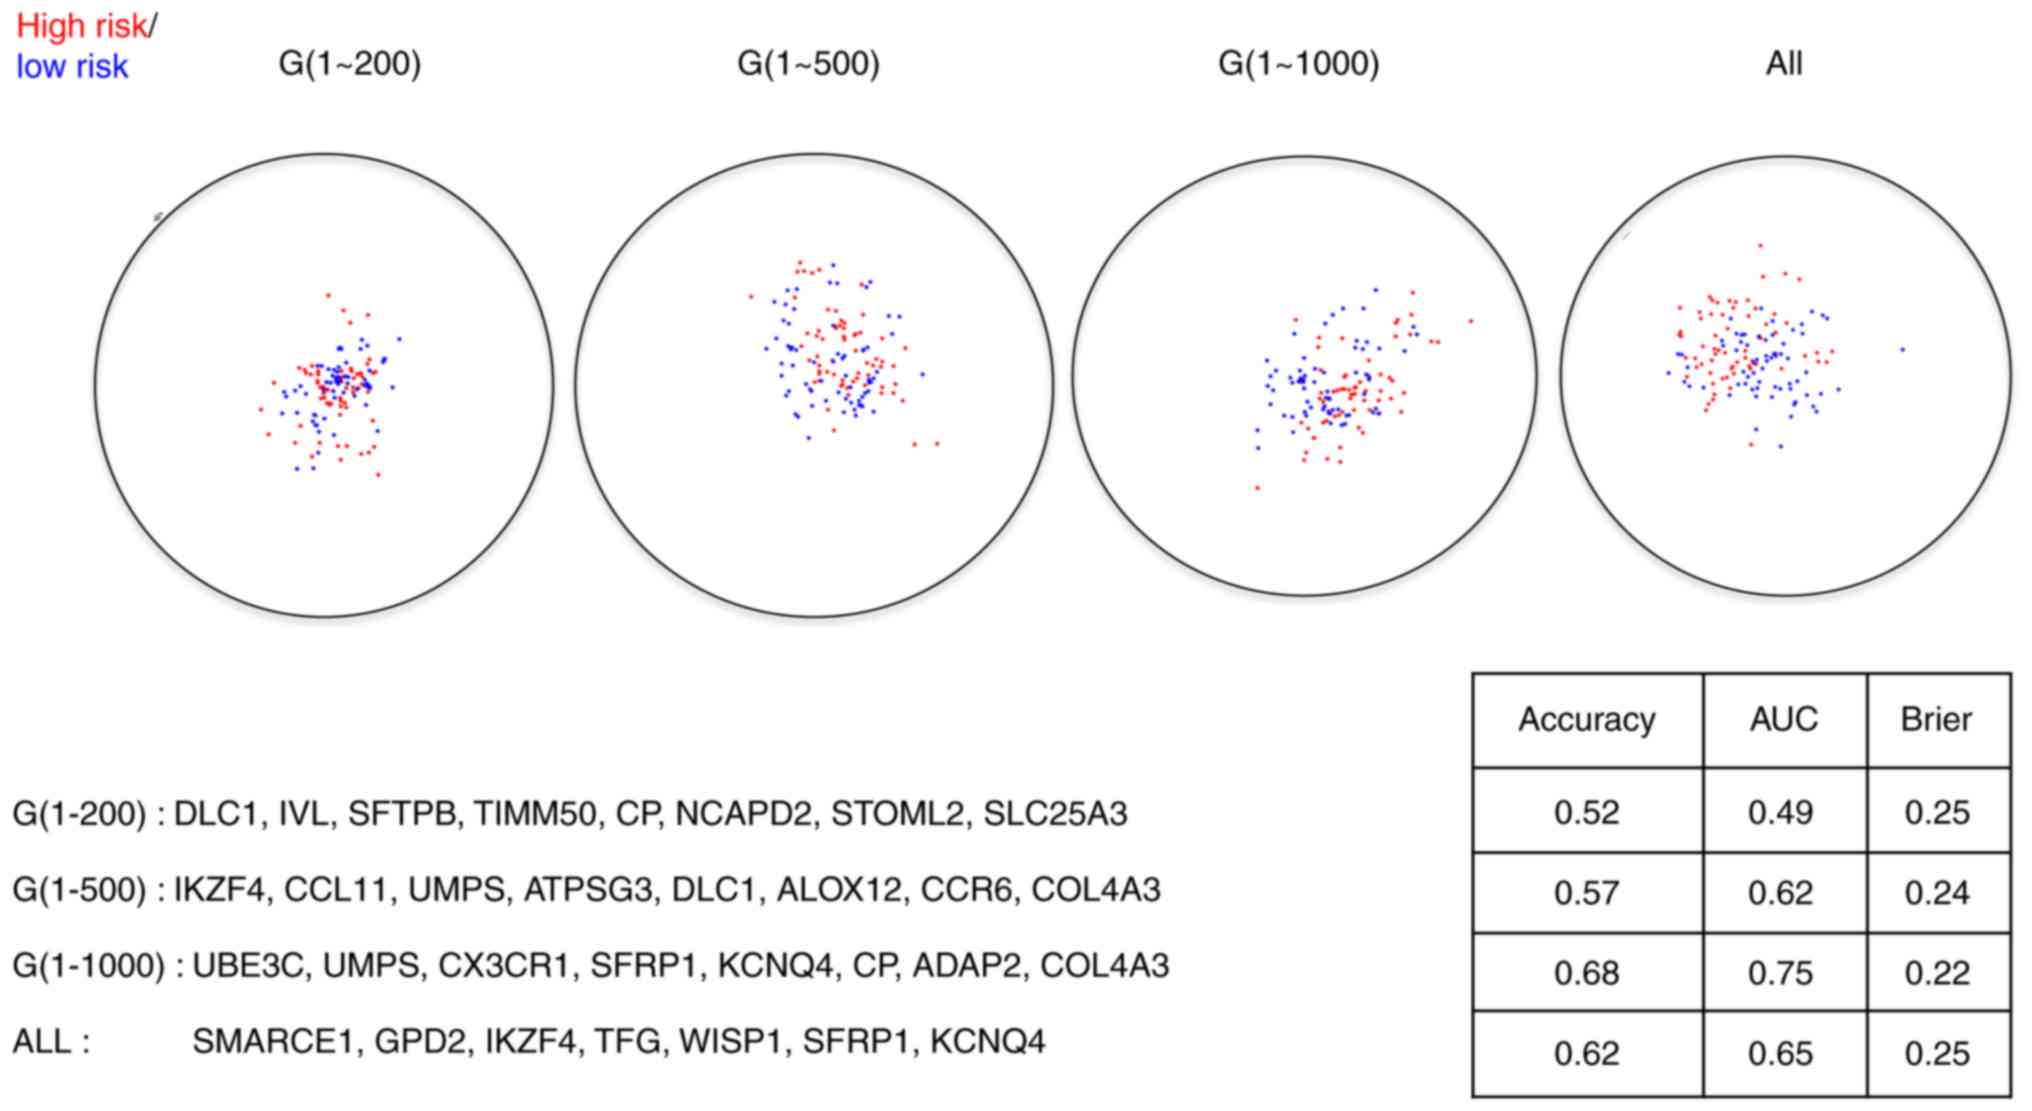
last scenario. The corresponding RadViz projections with optimal
gene subsets are presented in Figs. 2
and 3, from which we observed that
the final diagnostic and prognostic gene signatures were barely
overlapped in all scenarios. As discussed previously (5), it is unsurprising to observe no or only
limited overlaps between the diagnostic signatures and the
prognostic signatures since the outcomes under investigation for
these two sets of signatures differ in nature.
The performance statistics of the resulting
diagnostic signatures for both the training set and the test set
are presented in Table I. Similarly,
the performance statistics of the resulting prognostic signatures
for both the training set and the test set are presented in
Table II. There are no significant
differences in terms of predictive performance for either
diagnostic signatures or prognostic signatures under these four
scenarios, indicating a prescreening step to downsize the genes
under consideration to those that are important in terms of both
pathway connectivity and expression differences shall not
deteriorate the predictive performance of resulting final
signatures. Even though no huge differences among those signatures
exist, the signatures constructed with the first 1,000 genes
outperform slightly to the signatures under the other scenarios,
suggesting 1,000 is the optimal cutoff for the number of genes
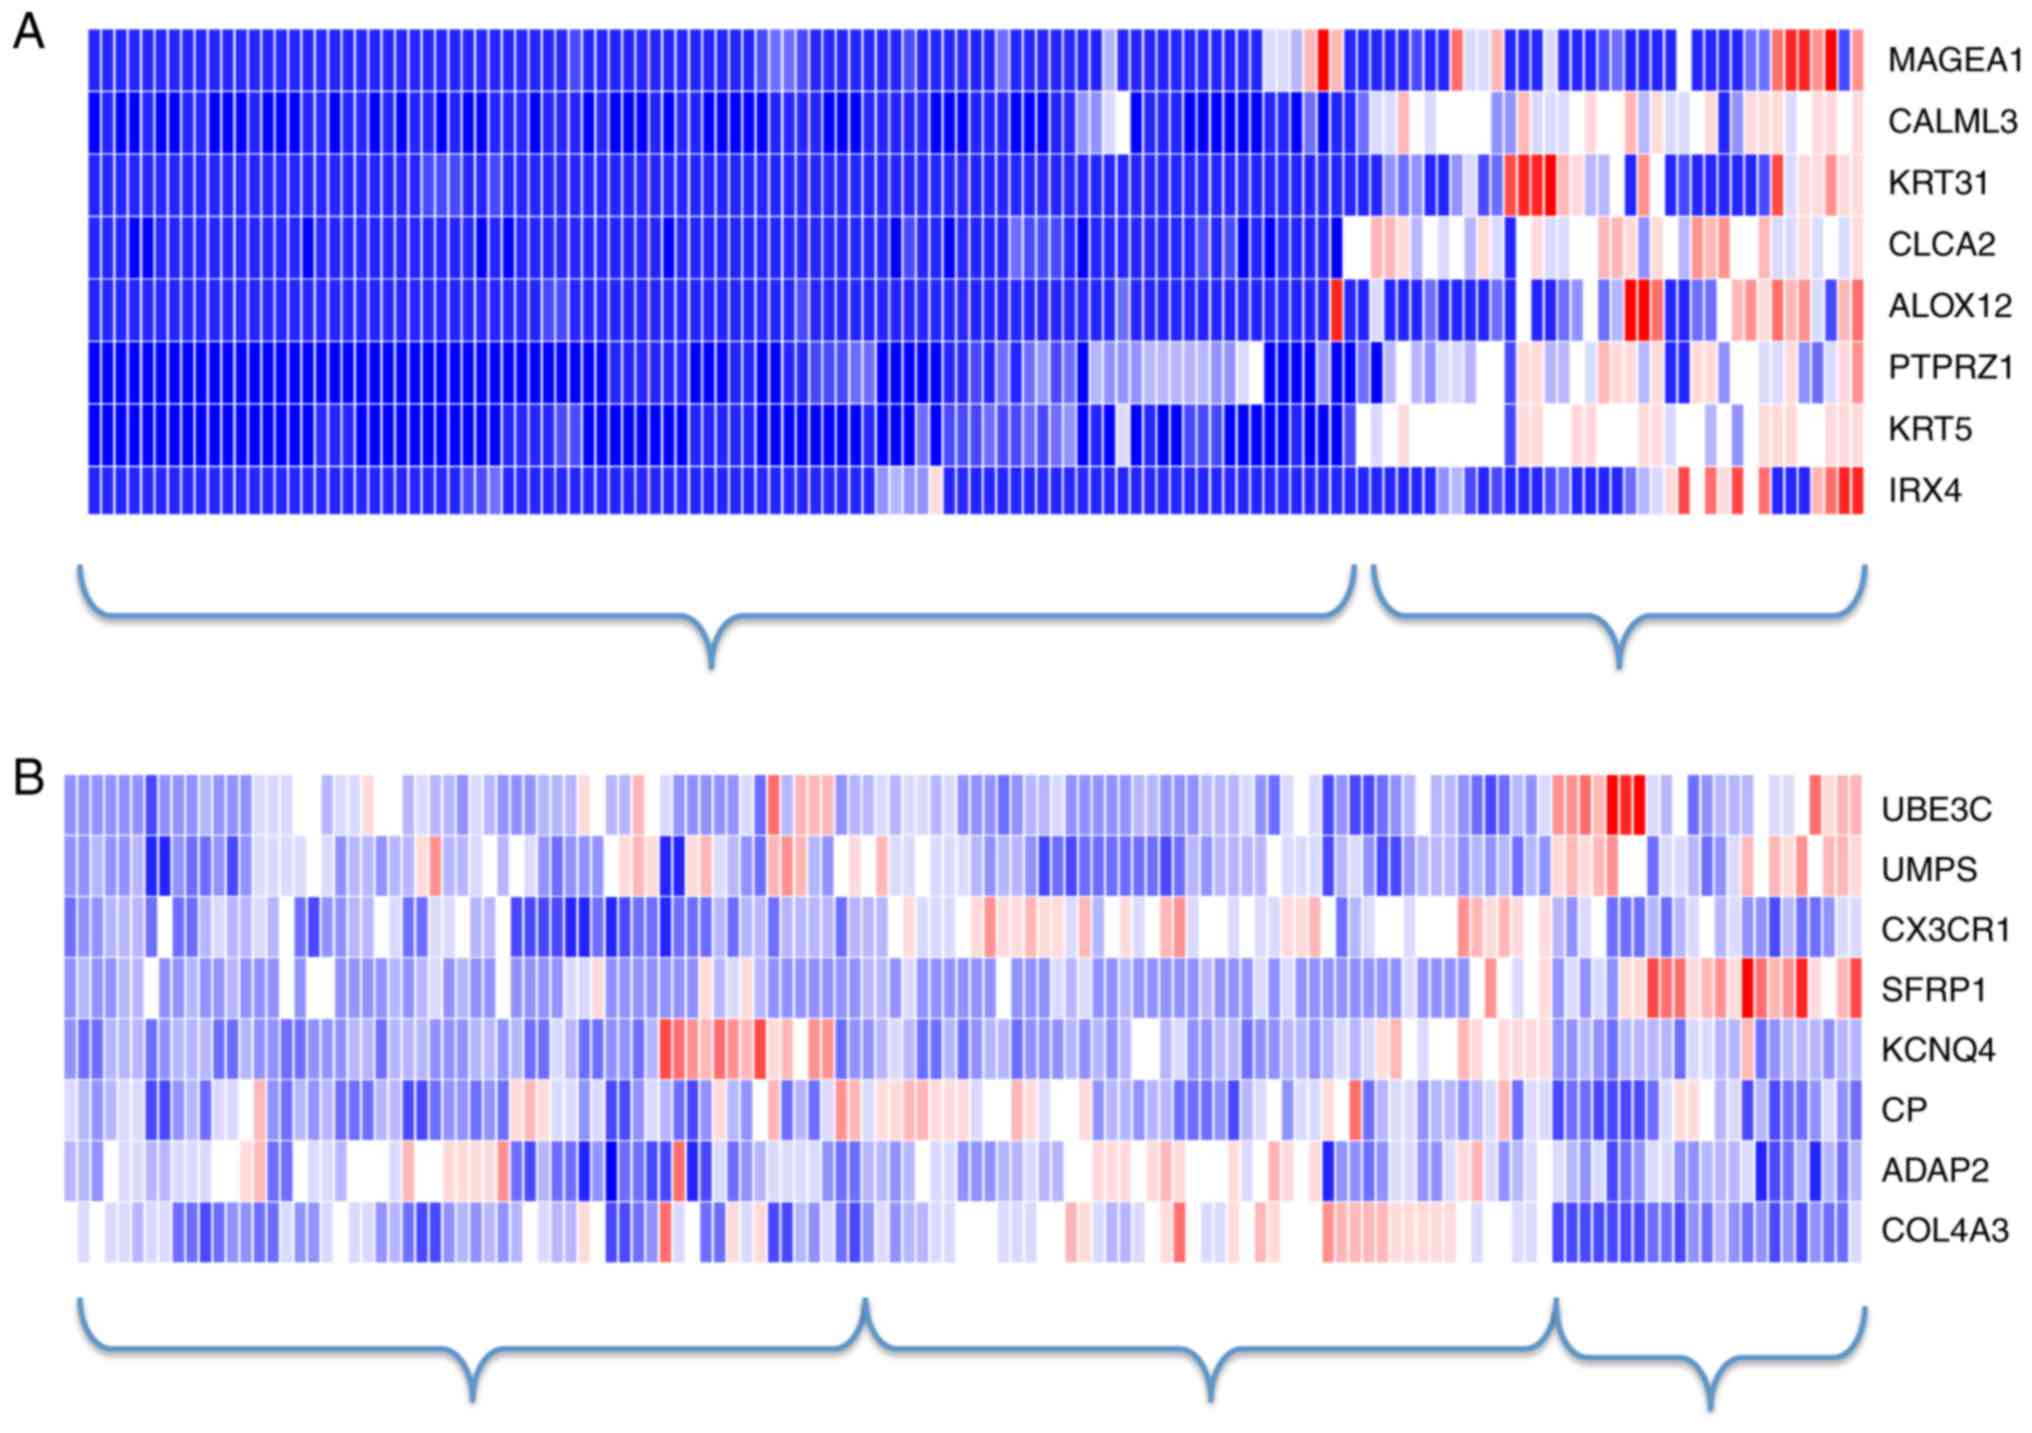
under consideration in this study. The heatmaps of the 8-gene
diagnostic signature and the 8-gene prognostic signature under the
first 1,000-gene scenario are shown in Fig. 4. In consistent to the previous
observations, there existed a clear separation between AC and SCC
samples but not so between the high-risk and the low-risk patients.
Instead, using hierarchical clustering (as shown in Fig. 4), the samples may be classified into
three clusters-the high-risk patients, the low-risk patients, and
those with ambiguous labels.
 | Table I.Performance statistics for the AC/SCC
subtype segmentation. |
Table I.
Performance statistics for the AC/SCC
subtype segmentation.
| A, The maximum size
of each projection is fixed at 8. |
|---|
|
|---|
|
| Training set
(GSE50081) | Test set
(RNA-Seq) |
|---|
|
|
|
|
|---|
| Variable | Accuracy (%) | GBS | Accuracy (%) | GBS |
|---|
| G(1)
~G(200) | 90.98 | 0.092 | 79.4 | 0.188 |
| G(1)
~G(500) | 90.98 | 0.092 | 77.6 | 0.186 |
| G(1)
~G(1,000) | 92.48 | 0.088 | 76 | 0.180 |
| All 1,952
genes | 91.73 | 0.082 | 78.4 | 0.165 |
|
| B, The maximum size
of each projection is fixed at 3. |
|
|
| Training set
(GSE50081) | Test set
(RNA-Seq) |
|
|
|
|
| Variable | Accuracy (%) | GBS | Accuracy (%) | GBS |
|
| G(1)
~G(200) | 89.47 | 0.087 | 76 | 0.202 |
| G(1)
~G(500) | 90.23 | 0.109 | 82.4 | 0.173 |
| G(1)
~G(1,000) | 90.23 | 0.117 | 84 | 0.164 |
| All 1,952
genes | 90.23 | 0.107 | 82.4 | 0.171 |
| Table II.Performance statistics for the NSCLC
high risk/low risk segmentation. |
Table II.
Performance statistics for the NSCLC
high risk/low risk segmentation.
| A, The maximum size
of each projection is fixed at 8 |
|---|
|
|---|
|
| Training set
(GSE50081) | Test set
(RNA-Seq) |
|---|
|
|
|
|
|---|
| Variable | C-stat | P-value (log
rank) | C-stat | P-value |
|---|
| G(1)
~G(200) | 0.6276 |
6.47×10⁻³ | 0.4174 | 0.051 |
| G(1)
~G(500) | 0.5783 |
1.70×10⁻³ | 0.5097 | 0.59 |
| G(1)
~G(1,000) | 0.6687 |
8.11×10⁻⁶ | 0.4207 | 0.131 |
| All genes | 0.6045 |
4.13×10⁻⁵ | 0.2284 | 0.799 |
|
| B, 40 genes with
the highest frequencies in RadViz projections |
|
|
| Training set
(GSE50081) | Test set
(RNA-Seq) |
|
|
|
|
| Variable | C-stat | P-value (log
rank) | C-stat | P-value |
|
| G(1)
~G(200) | 0.7035 |
2.82×10⁻⁴ | 0.4693 | 0.161 |
| G(1)
~G(500) | 0.6965 |
4.57×10⁻⁶ | 0.5374 | 0.089 |
| G(1)
~G(1,000) | 0.7244 |
5.23×10⁻⁷ | 0.5436 | 0.054 |
| All genes | 0.7018 |
3.34×10⁻⁶ | 0.4381 | 0.112 |
Furthermore, since it is demonstrated that several
genes are adequate to discriminate AC and SCC apart (9,11), we set
the maximum number of genes in the RadViz projections as 3 and
redid the selection of relevant genes and the final model fitting.
In contrast, previous studies (5,27) have
shown that compared to the diagnostic gene signatures, the
identification of prognostic gene signatures is much difficult and
thus less than 10 genes might be incapable of separating patients
with good prognosis from those with bad prognosis. As a fix to
this, we resort to the strategy of using genes with the highest
frequencies in the RadViz projections (9,20). Here
the final size is set at 40. The performance statistics for the
40-gene prognostic signature are tabulated in Table II as well.
The gene symbols of these 3-gene diagnostic
signatures are presented in Fig. 5.
We found the 3-gene signatures are very stable. While there is one
gene (33.3%) existing in all these signatures, 3 of these four
signatures (75%) share 2 common genes (66.7%), providing further
evidence to support that several gene biomarkers are sufficient to
distinguish AC and SCC. For the prognosis analysis, when we
increased the size of final models to 40, a better separation
between patients with good prognosis and those with bad prognosis
has been achieved compared to the 8-gene signatures. But the
performance of the 40-gene signatures is still below satisfactory,
which may be explained by the following reasons.
First, the patients were stratified into two
categories as the high-risk one and the low-risk one on the basis
of their survival time. The risk status served as the outcome when
training the prognostic signatures. Such an over-simplified
stratification might lead to the predictive inferiority of a
prognostic signature, as pointed out by (28). Considering the RadViz method is
incapable of dealing with the time-to-event outcomes, we will
definitely replace it with a more novel feature selection algorithm
e.g., LASSO and reanalyze this NSCLC dataset in our future
research.
Second, in this study we constructed the overall
prognostic signature for NSCLC patients without considering their
histological subtypes. As mentioned in the Introduction section,
there may exist subtype-specific prognostic genes for AC and SCC.
Since one major goal of this study is to illustrate the point that
the diagnostic and prognostic gene signatures differ dramatically,
a homogenous prognostic signature for both AC and SCC is required.
Construction of subtype-specific prognostic signatures using either
separate survival analysis for each specific subtype or a suitable
statistical method such as (4,5) is
warranted, in order to make better prediction and thus to
facilitate personalized treatment strategies for NSCLC
patients.
Lastly, the gene expression profile alone might not
convey all information about the prognosis of NSCLC patients. If
this is true, other omics data such as copy number alternation and
DNA methylation data need to be integrated in order to provide a
better survival prediction for the NSCLC early-stage patients.
Discussion
In the present study, we trained on the same data to
construct the diagnostic and prognostic gene signatures with the
aids of RadViz and SVM. The gene expression profiles may contain
valuable information on AC/SCC segmentation, and also valuable
information on prognosis. Nevertheless, those informative genes for
diagnosis might not be valuable for prognosis, and vice verse. It
is unsurprising that the diagnostic signatures and the prognostic
signatures share no or limited overlaps, even they are all trained
on the same dataset.
With regard to that no significant prognostic gene
signatures have been achieved in this study, in the Results
section, we listed three reasons to explain why this happened.
Given the fact we obtained substantially better C-statistics using
the same datasets and Cox-models (unpublished work), we believe the
stratification of patients into different risk categories on the
basis of their survival time may result in huge information loss.
Thus, it is emphasized that such an over-simplification shall be
avoided in practice.
Depending on if the membership/label information is
taken into account, a machine learning method is classified into
either an unsupervised method or a supervised method. Without
considering the labels/dependent variables, the information
captured by an unsupervised learning method might not be meaningful
for both diagnosis and prognosis, let alone there are so many
irrelevant and redundant genes in gene expression profiles to blur
the signals from those relevant ones, thus the process of variable
selection becomes imperative where the outcome/label is always
taken into consideration. Therefore, we prefer to a supervised
method over an unsupervised learning method.
References
|
1
|
Jemal A, Bray F, Center MM, Ferlay J, Ward
E and Forman D: Global cancer statistics. CA Cancer J Clin.
61:69–90. 2011. View Article : Google Scholar : PubMed/NCBI
|
|
2
|
Lu C, Onn A, Vaporciyan A, et al: 78:
Cancer of the lungHolland-Frei Cancer Medicine. 8th. People's
Medical Publishing House; 2010
|
|
3
|
Hou J, Aerts J, den Hamer B, van Ijcken W,
den Bakker M, Riegman P, van der Leest C, van der Spek P, Foekens
JA, Hoogsteden HC, et al: Gene expression-based classification of
non-small cell lung carcinomas and survival prediction. PLoS One.
5:e103122010. View Article : Google Scholar : PubMed/NCBI
|
|
4
|
Tian S, Wang C and An MW: Test on
existence of histology subtype-specific prognostic signatures among
early stage lung adenocarcinoma and squamous cell carcinoma
patients using a Cox-model based filter. Biol Direct. 10:152015.
View Article : Google Scholar : PubMed/NCBI
|
|
5
|
Tian S: Identification of subtype-specific
prognostic genes for early-stage lung adenocarcinoma and squamous
cell carcinoma patients using an embedded feature selection
algorithm. PLoS One. 10:e01346302015. View Article : Google Scholar : PubMed/NCBI
|
|
6
|
Skrzypski M, Dziadziuszko R, Jassem E,
Szymanowska-Narloch A, Gulida G, Rzepko R, Biernat W, Taron M,
Jelitto-Górska M, Marjański T, et al: Main histologic types of
non-small-cell lung cancer differ in expression of
prognosis-related genes. Clin Lung Cancer. 14:666–673.e2. 2013.
View Article : Google Scholar : PubMed/NCBI
|
|
7
|
Saeys Y, Inza I and Larrañaga P: A review
of feature selection techniques in bioinformatics. Bioinformatics.
23:2507–2517. 2007. View Article : Google Scholar : PubMed/NCBI
|
|
8
|
Zhang L, Wang L, Du B, Wang T, Tian P and
Tian S: Classification of non-small cell lung cancer using
significance analysis of microarray-gene set reduction algorithm.
Biomed Res Int. 2016:24916712016.PubMed/NCBI
|
|
9
|
Zhang A, Wang C, Wang S, Li L, Liu Z and
Tian S: Visualization-aided classification ensembles discriminate
lung adenocarcinoma and squamous cell carcinoma samples using their
gene expression profiles. PLoS One. 9:e110522014.
|
|
10
|
Tian S and Suárez-fariñas M:
Hierarchical-TGDR: Combining biological hierarchy with a
regularization method for multi-class classification of lung cancer
samples via high-throughput gene-expression data. Syst Biomed.
4:e259792013.
|
|
11
|
Ben-Hamo R, Boue S, Martin F, Talikka M
and Efroni S: Classification of lung adenocarcinoma and squamous
cell carcinoma samples based on their gene expression profile in
the sbv IMPROVER diagnostic signature challenge. Syst Biomed.
1:83–92. 2013.
|
|
12
|
Liu J, Yang XY and Shi WJ: Identifying
differentially expressed genes and pathways in two types of
non-small cell lung cancer: Adenocarcinoma and squamous cell
carcinoma. Genet Mol Res. 13:95–102. 2014. View Article : Google Scholar : PubMed/NCBI
|
|
13
|
Johannes M, Brase JC, Fröhlich H, Gade S,
Gehrmann M, Fälth M, Sültmann H and Beissbarth T: Integration of
pathway knowledge into a reweighted recursive feature elimination
approach for risk stratification of cancer patients.
Bioinformatics. 26:2136–2144. 2010. View Article : Google Scholar : PubMed/NCBI
|
|
14
|
Tian S, Chang HH and Wang C:
Weighted-SAMGSR: Combining significance analysis of microarray-gene
set reduction algorithm with pathway topology-based weights to
select relevant genes. Biol Direct. 11:502016. View Article : Google Scholar : PubMed/NCBI
|
|
15
|
Chen L, Xuan J, Riggins RB, Clarke R and
Wang Y: Identifying cancer biomarkers by network-constrained
support vector machines. BMC Syst Biol. 5:1612011. View Article : Google Scholar : PubMed/NCBI
|
|
16
|
Sun H, Lin W, Feng R and Li H:
Network-regularized high-dimensional Cox regression for analysis of
genomic data. Stat Sin. 24:1433–1459. 2014.PubMed/NCBI
|
|
17
|
Pan W, Xie B and Shen X: Incorporating
predictor network in penalized regression with application to
microarray data. Biometrics. 66:474–484. 2010. View Article : Google Scholar : PubMed/NCBI
|
|
18
|
Sokolov A, Carlin DE, Paull EO, Baertsch R
and Stuart JM: Pathway-based genomics prediction using generalized
elastic net. PLoS Comput Biol. 12:e10047902016. View Article : Google Scholar : PubMed/NCBI
|
|
19
|
Hoffman P, Grinstein G, Marx K, Grosse I
and Stanley E: DNA visual and analytic data mining. Proceedings
Vis' 97. (Cat No 97CB36155). 1997.
|
|
20
|
Mramor M, Leban G, Demsar J and Zupan B:
Visualization-based cancer microarray data classification analysis.
Bioinformatics. 23:2147–2154. 2007. View Article : Google Scholar : PubMed/NCBI
|
|
21
|
Morrison JL, Breitling R, Higham DJ and
Gilbert DR: GeneRank: Using search engine technology for the
analysis of microarray experiments. BMC Bioinformatics. 6:2332005.
View Article : Google Scholar : PubMed/NCBI
|
|
22
|
McCall MN, Bolstad BM and Irizarry RA:
Frozen robust multiarray analysis (fRMA). Biostatistics.
11:242–253. 2010. View Article : Google Scholar : PubMed/NCBI
|
|
23
|
Law CW, Chen Y, Shi W and Smyth GK: Voom:
Precision weights unlock linear model analysis tools for RNA-seq
read counts. Genome Biol. 15:R292014. View Article : Google Scholar : PubMed/NCBI
|
|
24
|
Leban G, Bratko I, Petrovic U, Curk T and
Zupan B: VizRank: Finding informative data projections in
functional genomics by machine learning. Bioinformatics.
21:413–414. 2005. View Article : Google Scholar : PubMed/NCBI
|
|
25
|
Yeung KY, Bumgarner RE and Raftery AE:
Bayesian model averaging: Development of an improved multi-class,
gene selection and classification tool for microarray data.
Bioinformatics. 21:2394–2402. 2005. View Article : Google Scholar : PubMed/NCBI
|
|
26
|
Uno H, Cai T, Pencina MJ, D'Agostino RB
and Wei LJ: On the C-statistics for evaluating overall adequacy of
risk prediction procedures with censored survival data. Stat Med.
30:1105–1117. 2011.PubMed/NCBI
|
|
27
|
Zhao SD, Parmigiani G, Huttenhower C and
Waldron L: Más-o-menos: A simple sign averaging method for
discrimination in genomic data analysis. Bioinformatics.
30:3062–3069. 2014. View Article : Google Scholar : PubMed/NCBI
|
|
28
|
Binder H and Schumacher M: Comment on
‘network-constrained regularization and variable selection for
analysis of genomic data’. Bioinformatics. 24:2566–2569. 2008.
View Article : Google Scholar : PubMed/NCBI
|