Introduction
Breast cancer is the most prevalent type of cancer
in females (1). There are >200,000
new cases each year in the USA, and the number is not decreasing
(2). In total, >12% of females are
diagnosed with breast cancer in their lifetime. In addition to
local treatments, including surgery and radiation therapy, breast
cancer patients are often systematically treated with hormone
therapy, chemotherapy or targeted therapy (3). The biomarkers most commonly used to
guide the choice of treatment are estrogen receptor (ER),
progesterone receptor (PR) and human epidermal growth factor
receptor 2 (HER2). For example, ER- and/or PR-positive breast
cancer can be treated with hormone therapy, including tamoxifen,
which blocks the binding of estrogen with its cognate receptor.
Patients with HER2-positive breast cancer benefit from targeted
therapies aimed at blocking HER2 activation (4). However, basal-like triple negative
breast cancer (TNBC) does not express any of the above biomarkers,
and therefore, it does not respond well to existing systemic
therapies and exhibits a high rate of recurrence (5).
Enhancer of zeste homolog 2 (EZH2) belongs to the
polycomb group (PcG) protein family (6). Along with other PcG proteins, EZH2 forms
a protein complex named polycomb repressive complex 2 (PRC2), which
suppresses gene transcription (7).
EZH2 is the only enzymatic component of the PRC2 complex that
catalyzes histone H3 Lys27 trimethylation (H3K27me3), a
histone repression mark that mediates close chromatin and
epigenetic silencing of genes associated with cell proliferation,
migration and invasion.
EZH2 is often overexpressed in numerous types of
human cancer, including TNBC (8–10), and has
been revealed to promote tumor growth by repressing the expression
of tumor-suppressor genes (11–13).
Mutations with increased activity of EZH2 have also been detected
in various human types of cancer, including lymphomas (7). Due to aberrant activation of EZH2 in
numerous cancer subtypes, EZH2 has been an attractive target for
drug development. A few promising small molecule inhibitors of
EZH2, including GSK126, have been developed, and their antitumor
efficacy has actively been tested in pre-clinical and clinical
settings (14,15).
It has been demonstrated that PRC2 components
interact with histone deacetylases (HDACs), and EZH2-mediated
transcriptional silencing is known to be blocked by HDAC inhibitors
(10,16). H3K27me3 induces closed chromatin and
gene repression, whereas histone H3 Lys27 acetylation
(H3K27ac) does the opposite by promoting open chromatin and gene
transcription activation (17). It
has been hypothesized that HDACs remove the acetyl group from
Lys27 and make it available for methylation by EZH2, and
thereby EZH2 and HDAC proteins work cooperatively to mediate gene
silencing by acting on the same nucleosome(s) (8).
EZH2 has been identified as an oncoprotein that is
crucial to the growth of TNBC (9);
therefore, the present study aimed to determine the cooperative
action of EZH2 and HDACs on TNBC by treating TNBC cells with EZH2
or HDAC inhibitors alone or combined. The results of the present
study demonstrated that co-treatment with both inhibitors resulted
in greater antitumor effects in TNBC, compared with each drug
alone.
Materials and methods
Cell lines, cell culture, chemicals
and antibodies
The TNBC cell lines MDA-MB-231 and MDA-MB-436 were
purchased from the American Type Culture Collection (Manassas, VA,
USA) and maintained in Dulbecco's modified Eagle's medium (Thermo
Fisher Scientific, Inc., Waltham, MA, USA) supplemented with 10%
fetal bovine serum (Thermo Fisher Scientific, Inc.) and 100 µg/ml
penicillin-streptomycin-glutamine (Thermo Fisher Scientific, Inc.)
at 37°C with 5% CO2. The EZH2 inhibitor GSK126 and the
HDAC inhibitor LBH589 were purchased from Selleck Chemicals
(Houston, TX, USA). Dimethyl sulfoxide (DMSO) was purchased from
Sigma-Aldrich; Merck KGaA (Darmstadt, Germany). The antibodies used
for western blotting were: Anti-B cell lymphoma-2 like 11 (BIM;
(ChemiCon International; Thermo Fisher Scientific, Inc.; catalog
no. AB17003; dilution, 1:1,000), anti-poly(ADP-ribose) polymerase
(PARP; Cell Signaling Technology, Inc., Danvers, MA, USA; catalog
no. 9532; dilution, 1:1,000), anti-forkhead box O1 (FOXO1; Cell
Signaling Technology, Inc.; catalog no. 9462L; dilution, 1:1,000),
anti-protein kinase B (AKT; Cell Signaling Technology, Inc.;
catalog no. 9272; dilution, 1:1,000), anti-phosphorylated (p)-AKT
(Ser473 phosphorylation; Cell Signaling Technology,
Inc.; catalog no. 9471L; dilution, 1:1,000), anti-p27 (Santa Cruz
Biotechnology, Inc., Dallas, TX, USA; catalog no. sc-71813, 1:1,000
dilution) and anti-extracellular-signal-related kinase 2 (ERK2;
Santa Cruz Biotechnology, Inc.; catalog no. sc-1647; dilution,
1:10,000). The antibodies used for chromatin immunoprecipitation
(ChIP) were as follows: Anti-H3K27ac (Abcam, Cambridge, MA, USA;
catalog no. ab4729; 5 µg/ChIP assay) and non-specific rabbit
immunoglobulin G (IgG; Vector laboratories, Inc., Burlingame, CA,
USA; catalog no. I-1000; 5 µg/ChIP assay). Horseradish peroxidase
(HRP)-conjugated secondary antibodies (donkey anti-mouse IgG HRP,
catalog no. NA931V, dilution 1:5,000; and donkey anti-rabbit IgG
HRP, catalog no. NA934V, dilution 1:5,000) for western blotting
were purchased from GE Healthcare Life-Sciences (Pittsburgh, PA,
USA).
Cell morphology analysis and
imaging
MDA-MB-231 and MDA-MB-436 cells (1×10⁵
cells/well) were plated into 6-well plates at ~20% confluence. At
24 h after plating, incubated at 37°C (~40% confluence), cells were
treated with vehicle (DMSO), GSK126, LBH589 or both GSK126 and
LBH589 for 24 h, and morphological images were captured using a
DMI3000 B microscope (magnification, ×400; Leica Microsystems GmbH,
Wetzlar, Germany) from ≥5 random fields.
Analysis of apoptotic cells using
fluorescence-activated cell sorting (FACS)
Apoptotic cell death (DNA content <2 copy number
of unreplicated genome (N) was examined using FACS, as previously
described (18). MDA-MB-231 cells
were treated with vehicle (DMSO), GSK126, LBH589 or GSK126 and
LBH589 for 24 h at 37°C. Cells were then harvested by
centrifugation at 1,000 × g for 5 min. Cells were washed with 1X
PBS once, fixated with 70% ethanol on ice for 30 min and stored at
−20°C. Following washing twice with 1X PBS, cells were stained with
propidium iodide (PI) in a staining solution, which was
supplemented with 20 µg/ml PI (Sigma-Aldrich; Merck KGaA) and 50
µg/ml RNase A (Thermo Fisher Scientific, Inc.), for 30 min at room
temperature, and their DNA content profiles were then determined by
flow cytometry using FACScan (BD Biosciences, Franklin Lakes, NJ,
USA) and apoptotic cells (PI intensity, <2 N) were determined
using CellQuest Pro software (version 5.1; BD Biosciences).
Western blot analysis
MDA-MB-231 and MDA-MB-436 cells (1.5×10⁵
cells/well) were plated into 6-cm dishes at ~30% confluence. At 24
h after plating, incubated at 37°C (~50% confluence), cells were
treated with vehicle (DMSO), GSK126, LBH589 or both GSK126 and
LBH589 for 24 h at 37°C. Cells were then harvested and lysed for 1
h on ice in modified radioimmunoprecipitation assay buffer (1X PBS,
1% Nonidet P-40, 0.1% SDS and 1X protease inhibitor cocktail;
Sigma-Aldrich). The protein concentration in the samples was
determined using a bicinchoninic acid assay (Thermo Fisher
Scientific, Inc.). Equal amounts (80–100 µg protein) of samples
were separated using SDS-PAGE (6–10% gels) and transferred onto
nitrocellulose membranes. Membranes were pre-blocked with 5%
non-fat dry milk (Bio-Rad Laboratories, Inc., Hercules, CA, USA) in
1X TBS for 1 h at room temperature and subsequently incubated
overnight at 4°C with primary antibodies against PARP, BIM, FOXO1,
(p)-AKT, AKT or p27. ERK2 was used as a loading control (12). Membranes were washed three times with
1X TBS containing 0.1% Tween-20 and incubated with HRP-conjugated
secondary antibodies, goat anti-mouse IgG or anti-rabbit IgG as
aforementioned, for 1 h at room temperature. Proteins were detected
by chemiluminescence (Thermo Fisher Scientific, Inc.).
RNA extraction and reverse
transcription-quantitative polymerase chain reaction (RT-qPCR)
MDA-MB-231 and MDA-MB-436 cells (2×10⁵
cells/well) were plated into 6-cm dishes. At 24 h after plating,
and incubated at 37°C (~50% confluence), cells were treated with
vehicle (DMSO), GSK126, LBH589 or both GSK126 and LBH589 for 24 h
at 37°C. Cells were lysed with TRIzol® reagent (Thermo
Fisher Scientific, Inc.) for 10 min at room temperature, and total
RNA was extracted following the manufacturer's protocol. cDNA was
synthesized using SuperScript II reverse transcriptase (Thermo
Fisher Scientific, Inc.) according to the manufacturer's protocol.
RT-qPCR was performed using iQ SYBR® Green Supermix
(Bio-Rad Laboratories, Inc.) and an iCycler iQ™ Real-Time PCR
Detection System (Bio-Rad Laboratories, Inc.), according to the
manufacturer's protocol. The PCR cycles (denaturing at 95°C for 20
sec, annealing at 58°C for 20 sec and extending at 72°C for 25 sec)
for BIM and GADPDH genes were between 26 and 30 and
between 17 and 19, respectively, in different cell lines and
different treatment conditions. The experiments were repeated three
times. All the signals were normalized by GAPDH, and the
2−ΔΔCq method (19) was
used to determine the fold changes in expression of mRNAs. The
sequences of the primers used for RT-qPCR were as follows:
BIM forward, 5′-AGACAGAGCCACAAGCTTCC-3′ and reverse,
5′-CAGGCGGACAATGTAACGTA-3′; and GAPDH forward,
5′-ACCCACTCCTCCACCTTTGAC-3′ and reverse,
5′-TGTTGCTGTAGCCAAATTCGTT-3′.
Analysis of public chromatin
immunoprecipitation sequencing (ChIP-seq) data
ChIP-seq signals for the promoter histone mark
histone H3 Lys4 trimethylation (H3K4me3), the enhancer
histone mark histone H3 Lys4 monomethylation (H3K4me1)
and transcriptionally active histone mark histone H3
Lys27 acetylation (H3K27ac), obtained from LNCaP
prostate cancer cells (20), were
analyzed and displayed using the University of California at Santa
Cruz genome browser (genome.ucsc.edu), as reported previously (21).
ChIP assay
MDA-MB-231 and MDA-MB-436 cells (3×10⁶
cells/well) were cultured in 10 cm dishes, for 24 h at 37°C, and
treated with vehicle (DMSO), GSK126, LBH589 or both GSK126 and
LBH589, for 24 h at 37°C. Following treatment, ~5×10⁶
cells in each treatment group were collected and sonicated using a
Bioruptor (Diagenode, Inc., Denville, NJ, USA), according to the
manufacturer's protocol. ChIP was performed according to a
previously described protocol (22).
The soluble chromatin was incubated with 5 µg of non-specific
control rabbit IgG or anti-H3K27ac antibodies overnight at 4°C.
Immunoprecipitated and input DNA were subjected to reverse
cross-linking by incubating at 65°C overnight. Following treatment
with proteinase K at 55°C for 2 h, DNA was purified using the
PureLink Quick PCR Purification kit (Qiagen, Inc., Valencia, CA,
USA). ChIP and input samples were analyzed using qPCR using the iQ
SYBR® Green Supermix and an iCycler iQ™ Real-Time PCR
Detection System (Bio-Rad Laboratories, Inc.), according to
manufacturer's protocol. The 2−ΔΔCq method (19) was used to determine the enrichment of
ChIP signals. The experiments were performed three times. The
sequences of the PCR primers were as follows: BIM promoter
forward, 5′-GCGGACGTGAGTTTCGGTGTG-3′ and reverse,
5′-GGTGCACATCTCTAAATGGGGACGG-3′; BIM enhancer-1 forward,
5′-CCCGTTTGTAAGAGGCCAGGC-3′ and reverse,
5′-CCTCACTGCTGCCTCGTGGT-3′; and BIM enhancer-2 forward,
5′-GGCTATTGGTAAAGGCTAGGTAGCG-3′ and reverse
5′-CCGGTACATGCGCTCACACAG-3′.
Statistical analysis
Experiments were performed in ≥3 replicates unless
indicated otherwise. The results are presented as the mean ±
standard deviation. Statistical analyses were performed by
two-tailed Student's t-test. P<0.05 was considered to indicate a
statistically significant difference.
Results
EZH2 and HDAC inhibitors induce
morphological changes in TNBC cells
To determine the effectiveness of EZH2 and HDAC
inhibitors in TNBC, the present study first examined their effects
on cell morphology using microscopic analyses. MDA-MB-231 and
MDA-MB-436 TNBC cells were treated with vehicle (DMSO), EZH2
inhibitor GSK126 (15 mM), HDAC inhibitor LBH589 (2.5 nM) or both
and LBH589 for 24 h. Cells grown under the control condition (0.1%
DMSO in complete culture medium) were spindle-like, abundant and
well attached to the culture dish. Conversely, following treatment
with the above inhibitors, certain cells were detached and became
round, a possible indicator of apoptotic cell death (23) (Fig. 1).
With the addition of GSK126 alone there was only a slight change,
namely a decrease in rigidity and size, in the morphology of the
cultured cells. As expected, inhibition of the EZH2
methyl-transferase alone may have little impact on the malignant
cells, as it would not address the deacetylation at the H3K27
position (8). With the treatment of
LBH589 alone, there was a greater number of cells that were
shriveled and no longer attached to the culture dish, compared with
mock-treated cells (Fig. 1). The HDAC
inhibitor therefore was observed to have a greater impact on tested
TNBC cells compared with that of the EZH2 inhibitor alone. Of note,
it was revealed that cells treated with both inhibitors were
affected the most. A large majority of cells lost their normal
morphology and were not able to adhere well to the culture dish
(Fig. 1). This distinctly higher
level of morphological change, caused by EZH2 and HDAC inhibitors
relative to vehicle, suggested an association with an increase in
the rate of apoptosis.
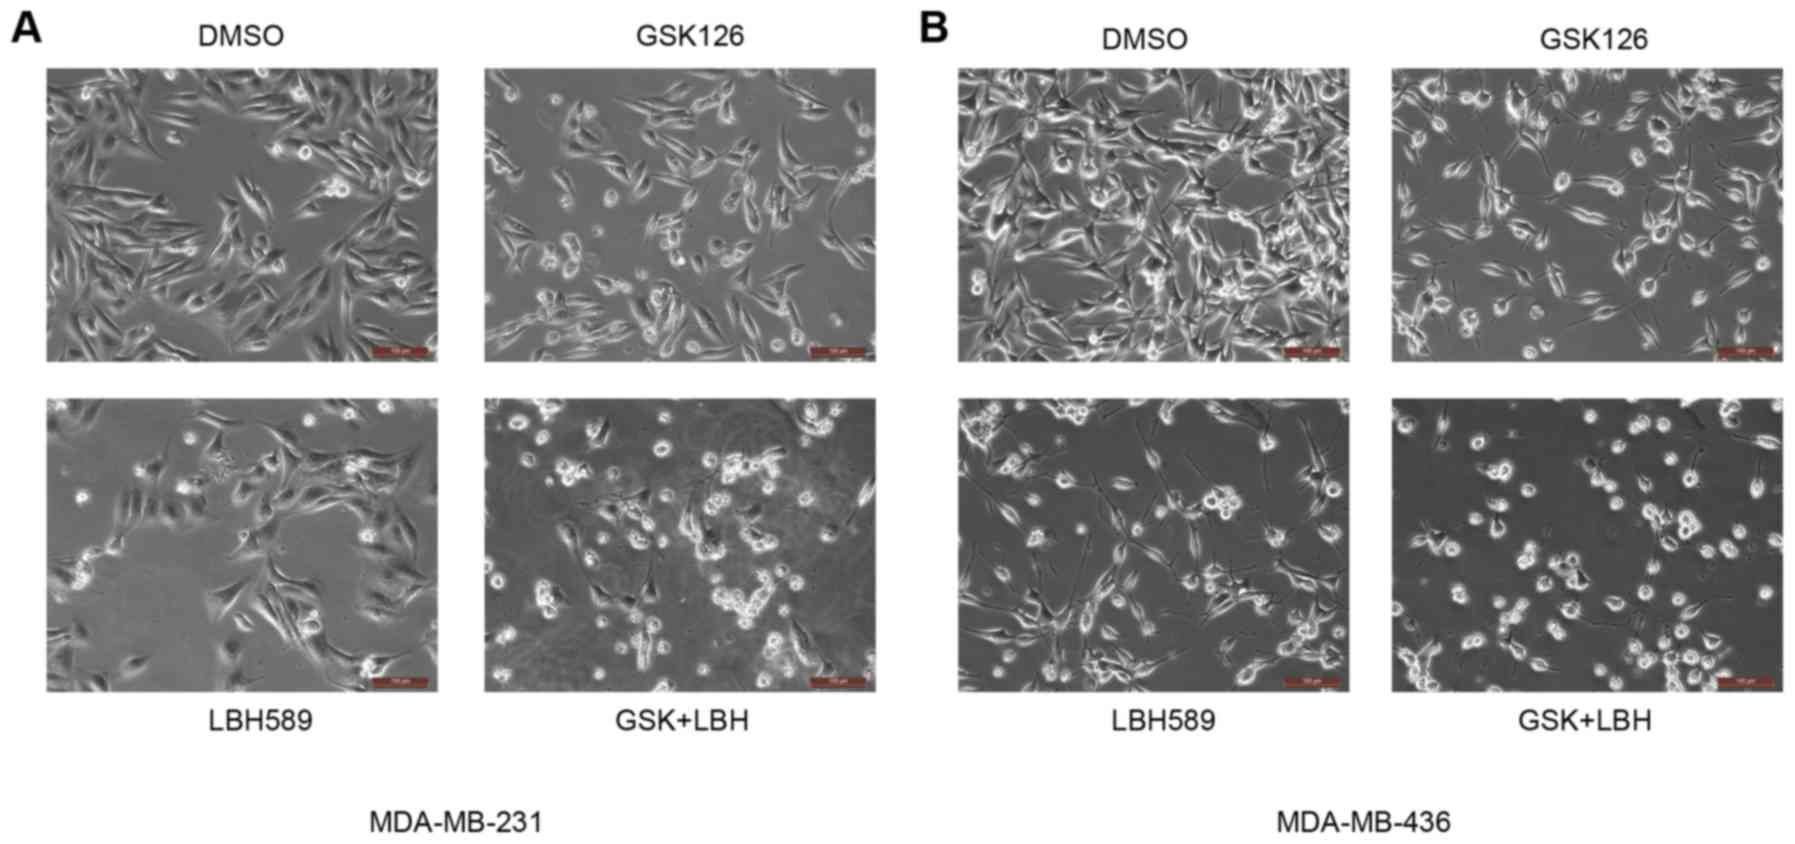 | Figure 1.EZH2 and HDAC inhibitors induce
morphological changes in MDA-MB231 and MDA-MB-436 cells. (A)
MDA-MB-231 and (B) MDA-MB-436 cells were treated with GSK126 (15
µM), LBH589 (2.5 nM) or both for 24 h. Cells growing under normal
conditions (DMSO) were spindle-like and attached well to the
culture dish. Conversely, following treatment with these
inhibitors, certain cells were detached and became round, which is
indicative of apoptotic cell death. Scale bars, 100 µm. EZH2,
enhancer of zeste 2 polycomb repressive complex 2 subunit; HDAC,
histone deacetylase; DMSO, dimethyl sulfoxide; GSK, GSK126; LBH,
LBH589. |
Inhibition of EZH2 and HDAC proteins
induces apoptotic cell death
To validate the morphological observation, FACS
analysis was performed on the cultures of both TNBC cell lines with
or without treatment. The cells were stained with PI and analyzed
by flow cytometry to determine the amount of DNA in the cells.
Cells with a PI intensity <2N were considered apoptotic, as the
DNA was fragmented (24). Consistent
with the morphological images, there were increasingly higher
amounts of fragmented DNA, and thus apoptotic cells, in the
cultures treated with GSK126, LBH589 or both, compared with vehicle
(Fig. 2A), which is quantitatively
presented in Fig. 2B. Specifically,
there was a significant increase in the percentage of dead or dying
cells in the culture treated with GSK126 and LBH589, compared with
mock (DMSO) treatment. Cells treated with the vehicle (DMSO),
GSK126 or LBH589 alone exhibited cell death rates of 6.00, 11.57
and 15.52%, respectively. Cells treated with GSK126 and LBH589
demonstrated a 40.31% apoptotic rate, which was over double the
apoptotic level in the culture treated with LBH589 alone (Fig. 2B). The results of simultaneous
treatment of GSK126 and LBH589 corroborate the hypothesis that
inhibiting methylation by EZH2 and deacetylation by HDACs may
induce an additive/synergistic effect in cancer therapy.
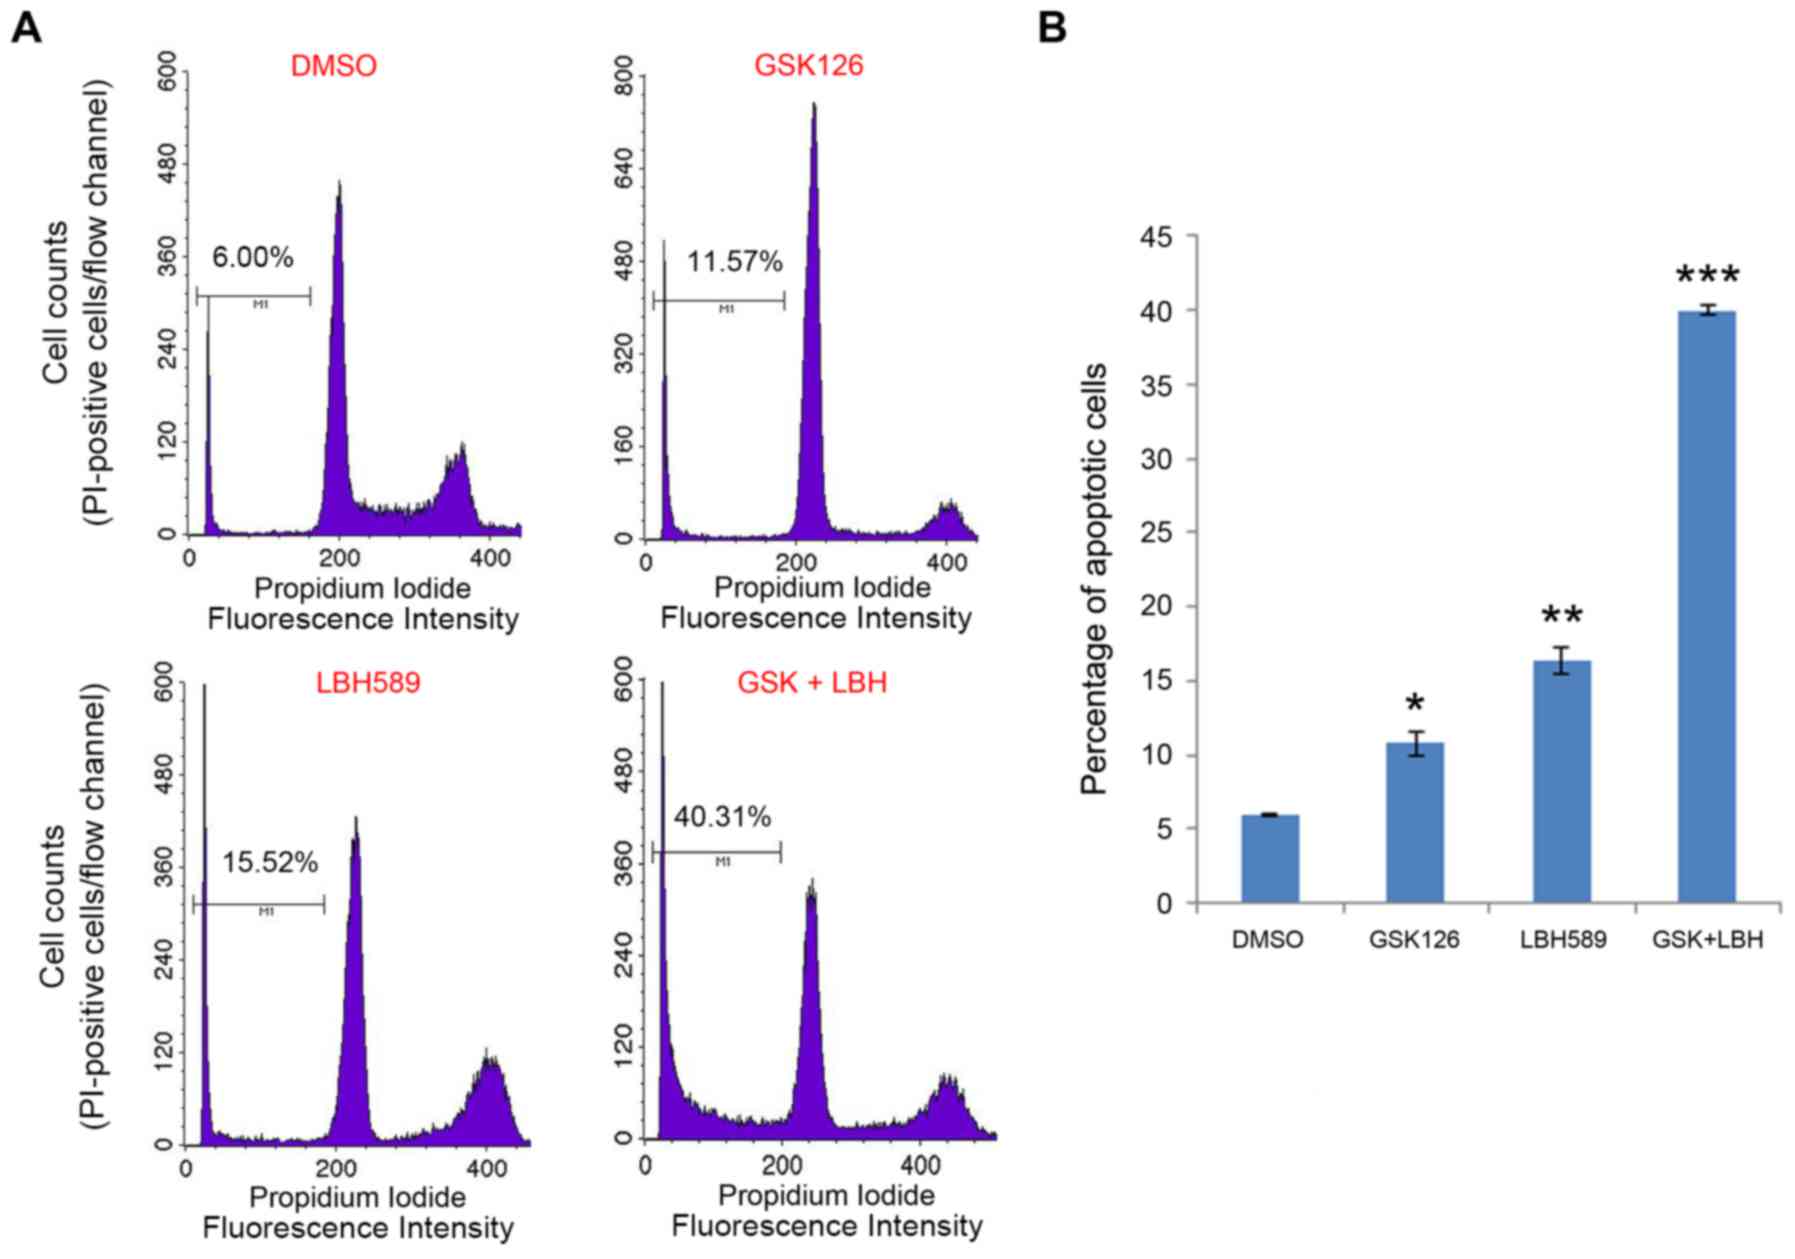 | Figure 2.EZH2 and HDAC inhibitors induce
apoptotic death in triple negative breast cancer cells. (A)
MDA-MB-231 cells were treated with vehicle (DMSO), GSK126, LBH589
or both GSK126 and LBH589 for 24 h. Cells were harvested and
stained with PI, followed by fluorescence-activated cell sorting
analysis. Apoptotic cells (PI intensity <2N) were determined by
CellQuest software (version 5.1; BD Biosciences, Franklin Lakes,
NJ, USA). (B) The percentage of apoptotic cells in the indicated
groups was determined from two replicates. Data are represented as
the mean ± standard deviation (n=2). *P<0.05, **P<0.01,
***P<0.001 compared with the control (DMSO) group. EZH2,
enhancer of zeste 2 polycomb repressive complex 2 subunit; HDAC,
histone deacetylase; DMSO, dimethyl sulfoxide; PI, propidium
iodide; N, copy number of unreplicated genome; GSK, GSK126; LBH,
LBH589. |
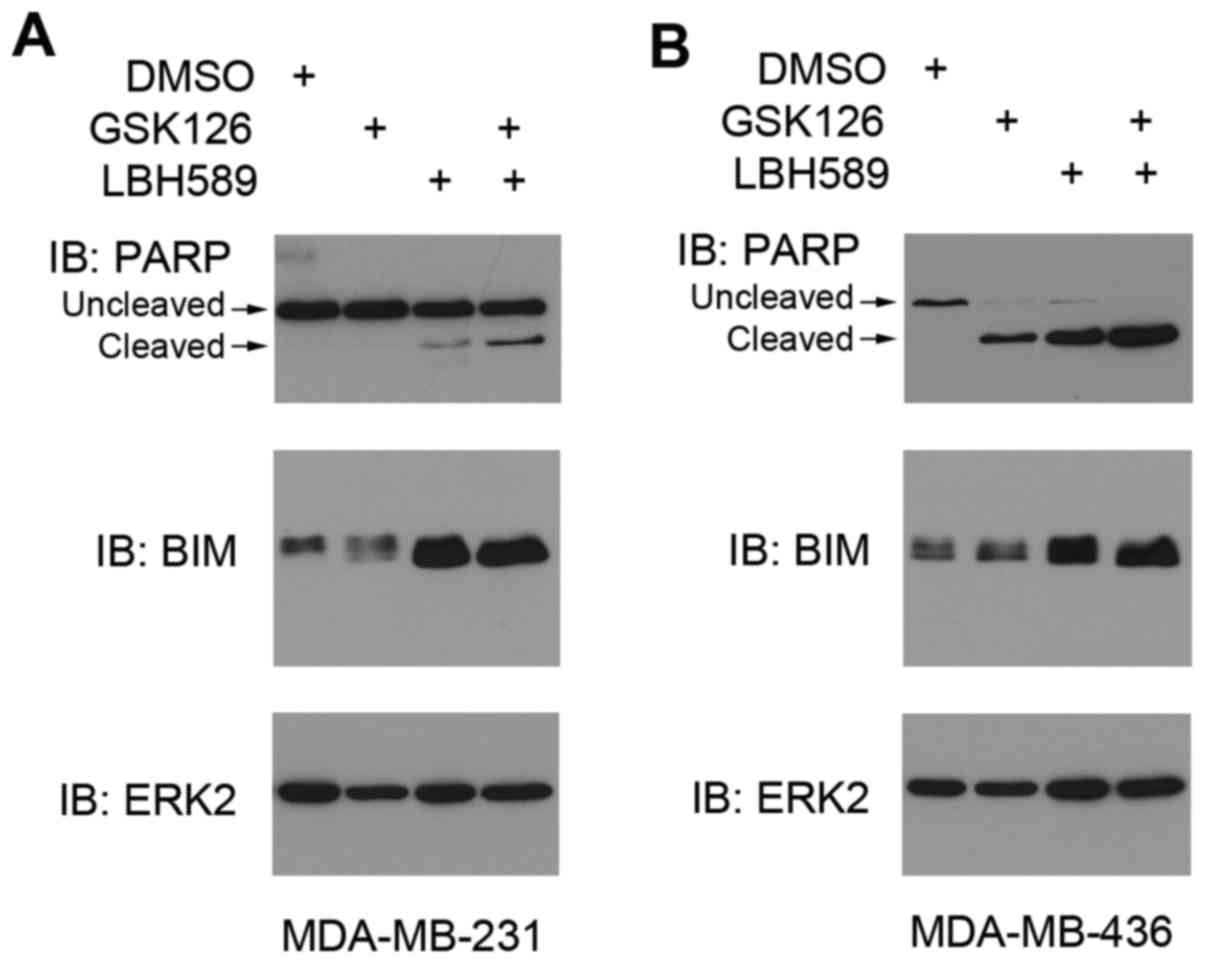
Increase in BIM protein expression
level induces high levels of apoptosis
As another method to determine apoptosis, the
present study evaluated the level of PARP cleavage, an apoptotic
marker (25), and a key pro-apoptotic
protein, BIM (encoded by a gene termed BCL2L11) (26), using western blot analysis.
Full-length PARP is a protein involved in DNA repair and chromatin
structure formation. During apoptosis, this full-length protein is
cleaved into small fragments that are detected as cleaved PARP
(25). PARP protein has a unique
fragmentation as a result of apoptosis, which allows for convenient
detection of the levels of programmed cell death (25). In both MDA-MB-231 and MDA-MB-436 cells
treated with either GSK126 or LBH589, cleaved PARP expression level
increased inversely to the expression level of uncleaved
full-length PARP (Fig. 3). Consistent
with the hypothesis of the present study, the combined treatment
produced the highest levels of cleaved PARP, therefore resulting in
the highest levels of apoptosis detected by FACS analysis (Fig. 2).
The reason for the increased apoptotic levels may be
attributed to the overexpression of pro-apoptotic proteins. One
such protein, BIM, often serves a key role in apoptosis in all
cancer cells (26). Western blotting
revealed that treating the cancer cells with GSK126 induced a
slight increase in BIM expression. However, following treatment
with LBH589, BIM protein expression levels were higher in both cell
lines, compared with mock treatment (Fig.
3A and B). Thus, the significant increase in apoptotic levels
evident in the cell count analysis (Fig.
2) was in agreement with the immunoblotting results (Fig. 3). The culture treated with both drugs
demonstrated the highest levels of BIM expression, again displaying
the effectiveness of both inhibitors on malignant cells (Fig. 3).
BIM mRNA expression levels are
upregulated by inhibition of EZH2 and HDAC proteins
It was revealed that treatment with EZH2 and HDAC
inhibitors induced increased levels of apoptosis in TNBC cells, as
demonstrated by the increased levels of BIM protein expression.
However, it was unclear whether the promotion of the pro-apoptotic
protein and the increased levels of cell death were due to
increased mRNA expression of BIM. Thus, the effect of GSK126
and LBH589 on the expression levels of BIM mRNA was
determined by RT-qPCR. Quantitation of the steady-state mRNA
expression levels confirmed that EZH2 and HDAC inhibitors
upregulated the mRNA expression levels of BIM in the
MDA-MB-231 and MDA-MB-436 cell lines (Fig. 4). Consistent with the results of the
FACS analysis, treatment with GSK126 induced slight increases in
BIM mRNA expression levels. Also similar to the results
presented in Fig. 3, LBH589 induced
the second-highest expression levels of BIM mRNA (Fig. 4). Finally, addition of both inhibitors
consistently resulted in the highest level of BIM mRNA
expression, which was associated with the level of apoptotic cell
death (Fig. 4). Since both inhibitors
were successful in inducing BIM mRNA expression, it was
suggested that the expression of BIM mRNA may be regulated by EZH2
and HDACs in TNBC cells.
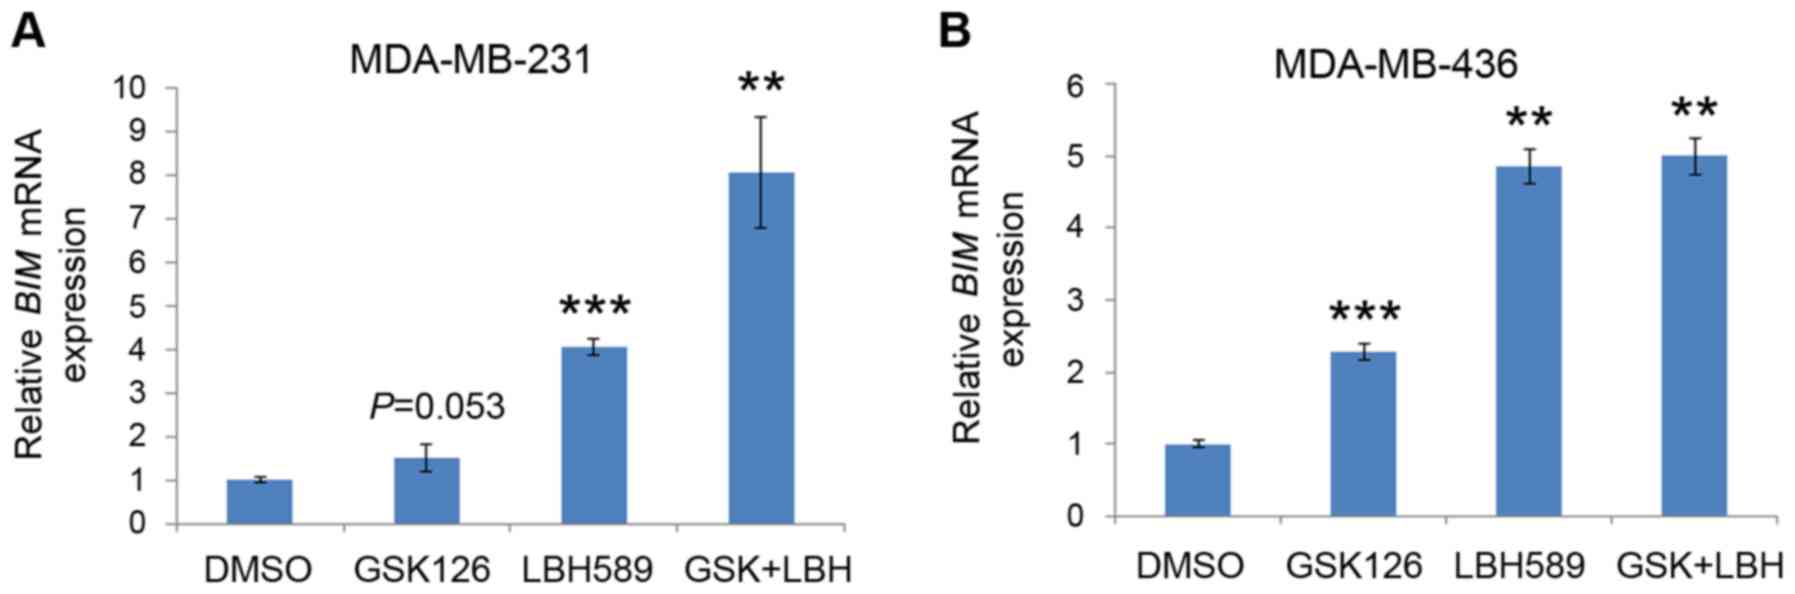 | Figure 4.EZH2 and HDAC inhibitors induce
BIM mRNA expression in triple negative breast cancer cells.
(A) MDA-MB-231 and (B) MDA-MB-436 cells were treated with vehicle
(DMSO), GSK126, LBH589 or both GSK126 and LBH589 as indicated for
24 h. Cells were then harvested, and BIM mRNA expression was
analyzed by reverse transcription-quantitative polymerase chain
reaction, using GAPDH as an internal control. All data are
presented as the mean ± standard deviation (error bar) from three
replicates. **P<0.01, ***P<0.001 compared with the control
(DMSO) group. EZH2, enhancer of zeste 2 polycomb repressive complex
2 subunit; HDAC, histone deacetylase; BIM, B cell lymphoma-2
like 11; DMSO, dimethyl sulfoxide; GSK, GSK126; LBH, LBH589. |
BIM regulation by EZH2 and HDAC
inhibitors is independent of FOXO1 expression
BIM is a well-established target gene of the
transcription factor FOXO1 (27). It
has been demonstrated that HDAC inhibitors can augment FOXO1
expression in phosphatase and tensin homolog (PTEN)-positive and
-negative cells (28), but can only
induce BIM expression by FOXO1 in PTEN-positive cancer cells
(29). The expression of FOXO3, a
homologue of FOXO1, is also induced by the EZH2 inhibitor GSK126 in
breast cancer 1-mutated breast cancer cells (30). It has been shown previously that
MDA-MB-231 cells are PTEN-positive and MDA-MB-436 cells are
negative for PTEN (31). Also, PTEN
loss induces AKT activation, which phosphorylates and inhibits
FOXO1 (32). Therefore, this should
result in an increase in BIM expression in MDA-MB-231 cells only if
HDAC and/or EZH2 inhibitor-induced BIM expression were mediated by
FOXO1 upregulation. Of note, treatment with the GSK126 and LBH589
inhibitors increased BIM expression levels in both cell lines
(Figs. 3 and 4). This suggested that, whereas the
expression of FOXO1 may be repressed by EZH2, FOXO1 may not cause
the elevated expression level of BIM observed in the present study.
To investigate whether this is the case, the present study examined
FOXO1 expression levels in comparison with BIM expression levels in
both cancer cell lines. BIM expression levels increased upon
treatment with EZH2 or HDAC inhibitor alone or together, and there
was no clear indication of higher expression levels of FOXO1 in
cells treated with these inhibitors, relative to mock treatment.
Conversely, when treated with GSK126, FOXO1 expression was
inhibited in AKT phosphorylation-positive (MDA-MB-436) and
-negative (MDA-MB-231) cell lines (Fig.
5). Treatment of LBH589 alone induced FOXO1 expression in both
cell lines, and was particularly pronounced in the cells with high
p-AKT levels (Fig. 5). It is worth
noting that increased expression of BIM (Figs. 3 and 4)
was not entirely consistent with the apoptosis levels (Fig. 2). The present study also analyzed
expression of p27, a different target gene of the FOXO
transcription factors (33), as
another functional readout to monitor the transcriptional
activities of FOXO1. However, there was no positive association
between FOXO1 and p27 protein levels in PTEN-positive MDA-MB-231
and PTEN-negative MDA-MB-436 cell lines (Fig. 5). These results suggested that BIM
regulation by EZH2 and HDAC inhibitors may be independent of FOXO1
expression in these TNBC cell lines.
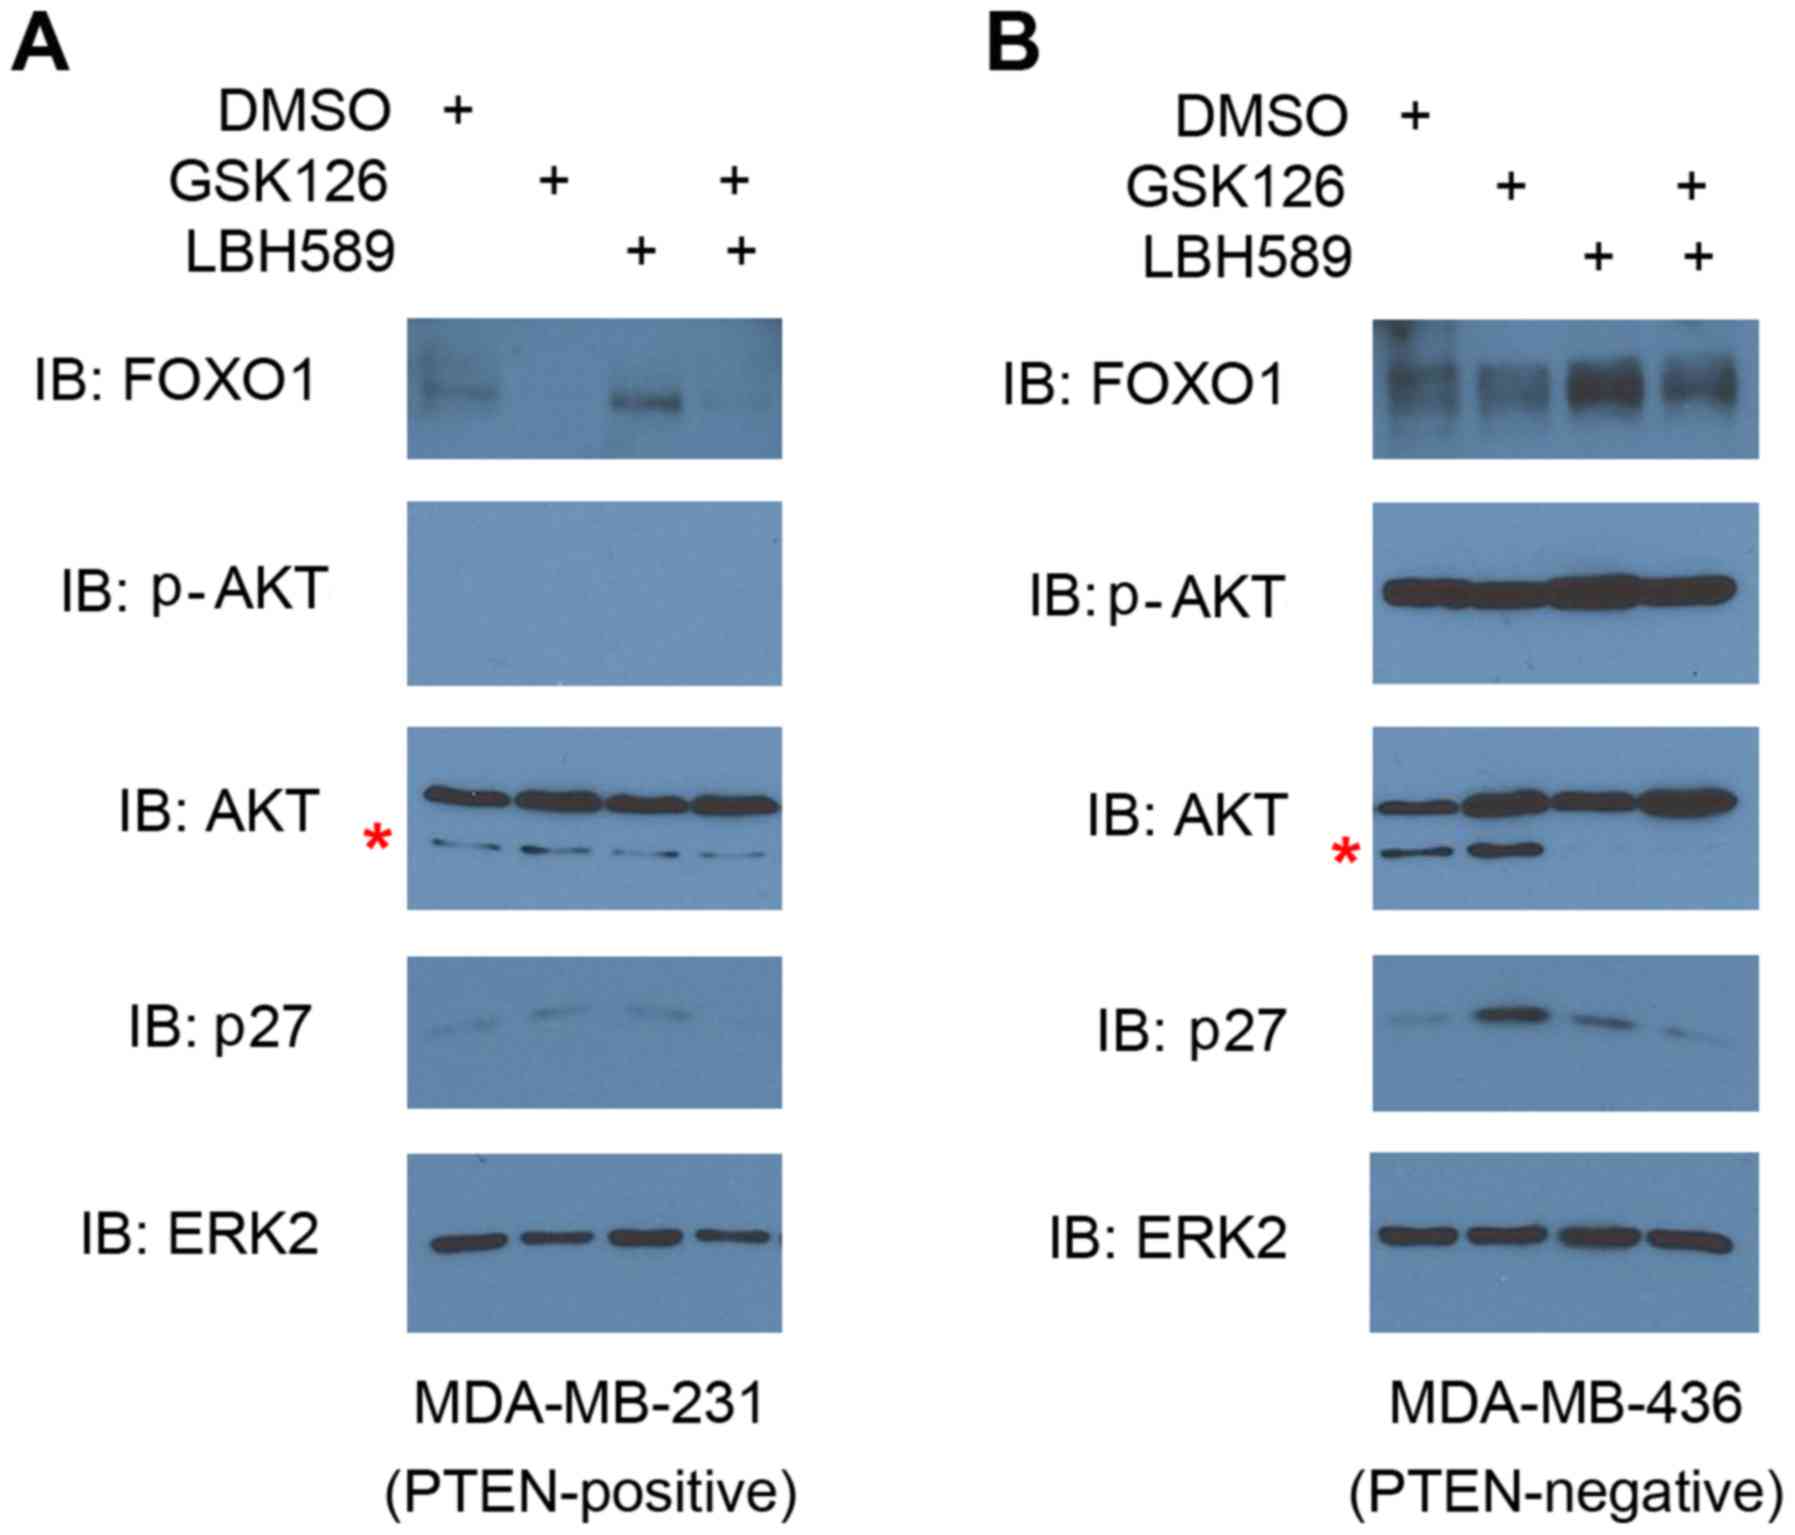 | Figure 5.Effect of EZH2 and HDAC2 inhibitors
on FOXO1 protein expression in triple negative breast cancer cells.
(A) MDA-MB-231 and (B) MDA-MB-436 cells were treated with vehicle
(DMSO), GSK126, LBH589 or both GSK126 and LBH589 as indicated for
24 h. Cells were then harvested for western blot analysis using the
indicated antibodies. ERK2 expression level was used as the protein
loading control. Non-specific western blotting bands are indicated
by *, a phenomenon observed in HeLa cells (http://www.cellsignal.com/products/primary-antibodies/akt-antibody/9272?N=4294956287&Ntt=akt&fromPage=plp).
Similar results were obtained in two independent experiments. EZH2,
enhancer of zeste 2 polycomb repressive complex 2 subunit; HDAC,
histone deacetylase; DMSO, dimethyl sulfoxide; ERK2, extracellular
signal-related kinase 2; AKT, protein kinase B; p-, phosphorylated;
FOXO1, forkhead box O1; PTEN, phosphatase and tensin homolog. |
H3K27ac in the promoter and enhancers
of the BIM gene is differentially upregulated by EZH2 and HDAC
inhibitors
Having ruled out the possibility of FOXO1
regulation, the present study instead hypothesized that BIM
expression via EZH2 and HDAC inhibitors was directly regulated by
H3K27ac levels at the promoter and/or the enhancers. Therefore, a
ChIP assay was performed using anti-H3K27ac antibodies. ChIP-qPCR
results demonstrated increased expression levels of H3K27ac at the
BIM promoter when both cell lines were treated with GSK126
(Fig. 6A and B). Of note, LBH589
treatment alone resulted in a smaller increase in H3K27ac in the
BIM promoter compared with the effect of GSK126 alone,
whereas treatment with both drugs revealed no change (Fig. 6A and B), thus contradicting the
increased apoptosis levels observed under these two conditions
(Figs. 2 and 3). Subsequently, the present study detected
an increase in H3K27ac levels at the enhancer-1 following treatment
with GSK126, LBH589 or both inhibitors, and revealed that H3K27ac
expression levels were highest following LBH589 treatment alone
(Fig. 6A and C). At enhancer-2, the
results were opposite to the effects of GSK126 or LBH589 alone or
together on the BIM promoter (Fig.
6A and D).
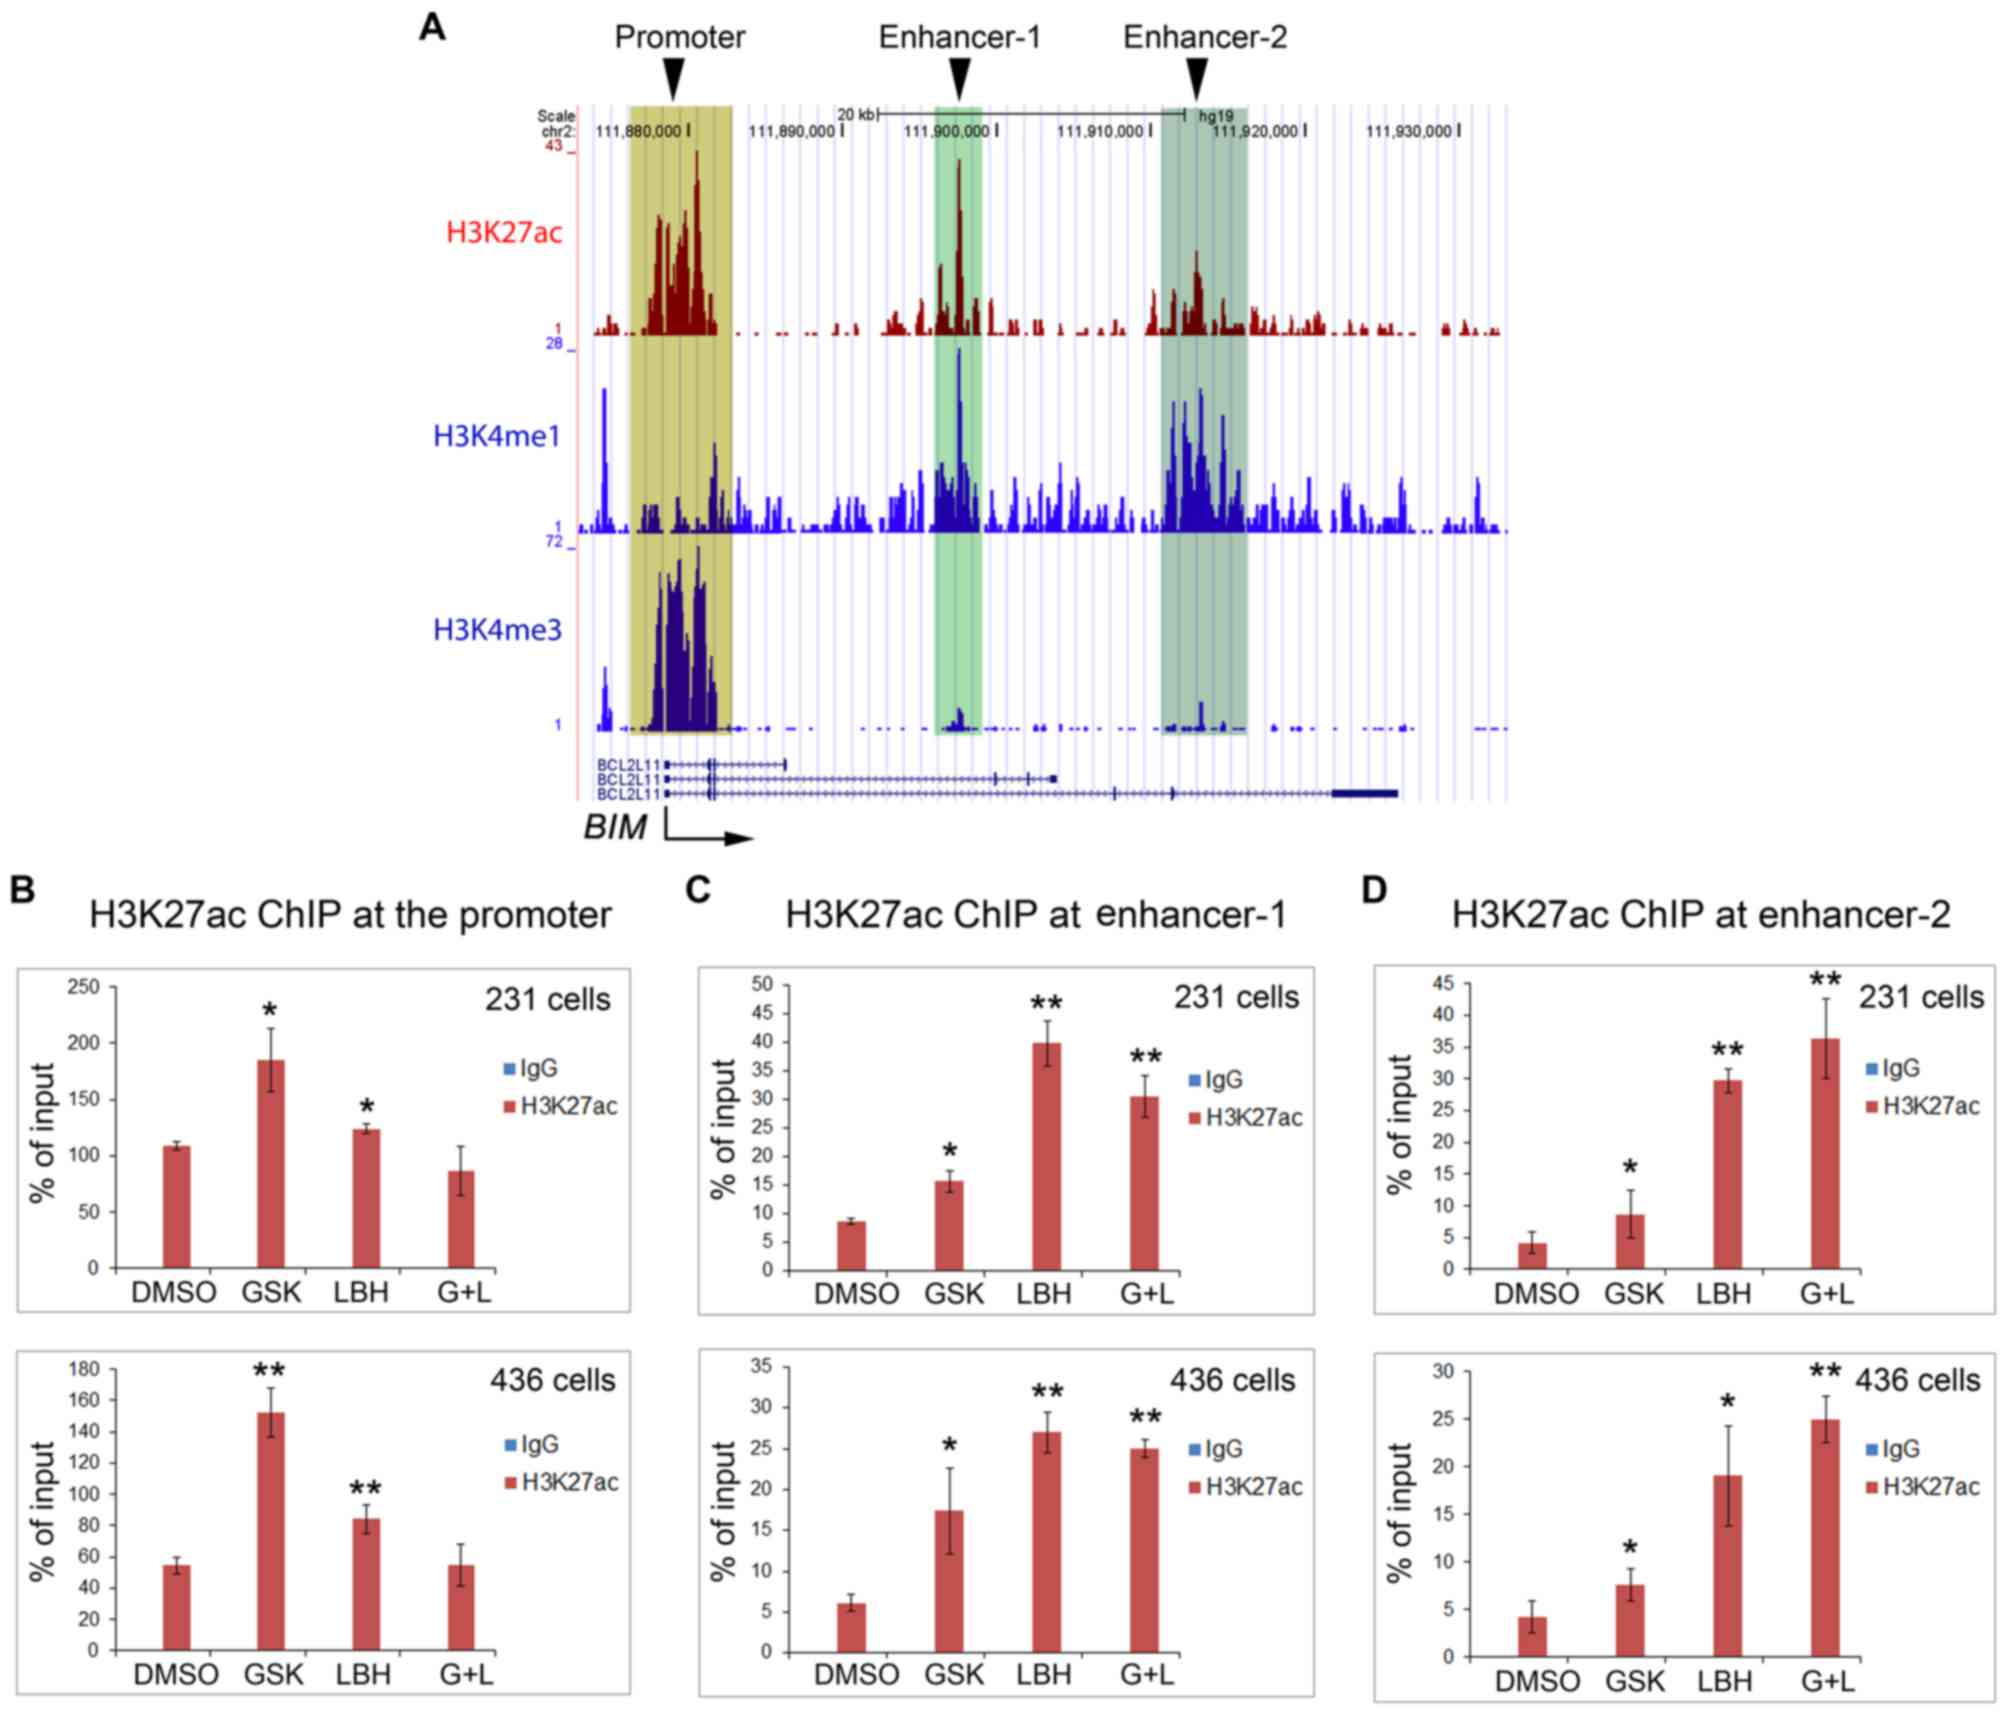 | Figure 6.EZH2 and HDAC inhibitors increase
H3K27ac expression levels in the BIM gene promoter and
enhancers in triple negative breast cancer cells. (A) University of
California at Santa Cruz genome browser screen shots display
ChIP-seq signals of H3K27ac, the enhancer histone mark H3K4me1 and
the promoter histone mark H3K4me3 obtained from the public data
generated from a different cancer cell type (prostate cancer LNCaP
cells). Reverse transcription-quantitative polymerase chain
reaction analysis of ChIP DNA using (B) primers for the promoter,
(C) putative enhancer-1 and (D) enhancer-2. DNA was
immunoprecipitated by control IgG or anti-H3K27ac antibody from
MDA-MB-231 and MDA-MB-436 cells treated with vehicle (DMSO),
GSK126, LBH 589 or both GSK126 and LBH589. Cells were harvested for
ChIP assay at 24 h after treatment. *P<0.05, **P<0.005
compared with the control (DMSO) group. H3K27me1, histone H3
Lys27 methylation; H3K27me3, histone H3 Lys27
trimethylation; H3K27ac, histone H3 Lys27 acetylation;
EZH2, enhancer of zeste 2 polycomb repressive complex 2 subunit;
HDAC, histone deacetylase; DMSO, dimethyl sulfoxide;
BIM/BCL211, B cell lymphoma-2 like 11; GSK, GSK126;
LBH, LBH 589; G+L, GSK126 and LBH 589; ChIP, chromatin
immunoprecipitation; IgG, immunoglobulin G. |
Discussion
EZH2 has been identified as an important oncoprotein
associated with the growth of TNBC cells (34). Thus, the present study hypothesized
that treatment of TNBC cells with EZH2 inhibitors may result in
apoptosis. Following initial treatment of cells with EZH2 inhibitor
alone, notably, there was no marked effect on apoptosis, which lead
to the hypothesis that the combination of EZH2 and HDAC inhibitors
may have a greater effect on apoptosis, compared with each
individual agent. The present study assumed that EZH2, a
methyl-transferase enzyme, would cooperate with HDACs at the
H3K27ac level. As their name implies, HDACs may remove the acetyl
group and allow EZH2 to transfer a methyl group to Lys27
on histone H3, thereby repressing gene expression by creating a
closed chromatin. Indeed, this hypothesis was supported by the
observation of the present study that there was an increased
pro-apoptotic effect in TNBC cells co-treated with EZH2 and HDAC
inhibitors.
BIM is a pro-apoptotic protein. High expression
levels of BIM were associated with the inhibition of EZH2 and HDAC
proteins. FOXO1 has been reported, in certain cellular settings, to
induce BIM expression, thus presenting another possible target for
treatment (35). Notably, expression
of FOXO family proteins is repressed by EZH2 (30). The present study hypothesized that
EZH2 inhibition elevates BIM via a mechanism of increased
expression of the FOXO1 transcription factor. However, despite
higher expression levels of BIM, there was a lack of a
corresponding increase in the FOXO1 expression level associated
with inhibition of EZH2 and/or HDAC in both TNBC cell types.
The present study assumed that both inhibitors
regulated BIM transcription at the promoter, but repeated
experiments demonstrated that this was not the case. Instead,
further data established that BIM was directly regulated by the
EZH2 inhibitor at the promoter, and by the HDAC inhibitor at the
enhancers. Furthermore, the death of the malignant cancer cells may
be more greatly affected by regulation of the enhancers compared
with that of the promoter. The apoptotic effects of treatment with
the EZH2 inhibitor, regulated at the promoter, were invariably
lower compared with those induced by treatment with both
inhibitors, and this observation was associated with increased
expression levels of H3K27ac at the BIM enhances, particularly
enhancer-2.
In conclusion, the results of the present study
demonstrated that treating TNBC cells with an EZH2 inhibitor
(GSK126) or a HDAC inhibitor (LBH589) alone produced limited
effects on cell morphology, apoptotic cell death and BIM expression
levels. However, a combination of both inhibitors resulted in
increased tumor-killing effects which supported the hypothesis that
the combination of EZH2 and HDAC inhibitors have an increased
effect on apoptosis, compared with each individual inhibitor.
Additionally, the results of the present study revealed the
possibility of a novel treatment strategy via additive agents.
Acknowledgements
The authors would like to thank Dr Yu Zhao
(laboratory of Dr Kun Ling, the Department of Biochemistry and
Molecular Biology at Mayo Clinic, Rochester, MN, USA) for his
assistance with designing primers for RT-qPCR and ChIP-qPCR. The
authors thank the Mayo Clinic Institutional for their support and
assistance. The present study was supported in part by the National
Institutes of Health/National Cancer Institute (grant no.
R01CA149039).
References
|
1
|
Donepudi MS, Kondapalli K, Amos SJ and
Venkanteshan P: Breast cancer statistics and markers. J Cancer Res
Ther. 10:506–511. 2014.PubMed/NCBI
|
|
2
|
DeSantis CE, Fedewa SA, Sauer Goding A,
Kramer JL, Smith RA and Jemal A: Breast cancer statistics, 2015:
Convergence of incidence rates between black and white women. CA
Cancer J Clin. 66:31–42. 2016. View Article : Google Scholar : PubMed/NCBI
|
|
3
|
Schnitt SJ: Classification and prognosis
of invasive breast cancer: From morphology to molecular taxonomy.
Mod Pathol. 23 Suppl 2:S60–S64. 2010. View Article : Google Scholar : PubMed/NCBI
|
|
4
|
Callahan R and Hurvitz S: Human epidermal
growth factor receptor-2-positive breast cancer: Current management
of early, advanced, and recurrent disease. Curr Opin Obstet
Gynecol. 23:37–43. 2011. View Article : Google Scholar : PubMed/NCBI
|
|
5
|
Andre F and Zielinski CC: Optimal
strategies for the treatment of metastatic triple-negative breast
cancer with currently approved agents. Ann Oncol. 23 Suppl
6:vi46–vi51. 2012. View Article : Google Scholar : PubMed/NCBI
|
|
6
|
Simon JA and Kingston RE: Mechanisms of
polycomb gene silencing: Knowns and unknowns. Nat Rev Mol Cell
Biol. 10:697–708. 2009.PubMed/NCBI
|
|
7
|
Kim KH and Roberts CW: Targeting EZH2 in
cancer. Nat Med. 22:128–134. 2016. View
Article : Google Scholar : PubMed/NCBI
|
|
8
|
Simon JA and Lange CA: Roles of the EZH2
histone methyltransferase in cancer epigenetics. Mutat Res.
647:21–29. 2008. View Article : Google Scholar : PubMed/NCBI
|
|
9
|
Kleer CG, Cao Q, Varambally S, Shen R, Ota
I, Tomlins SA, Ghosh D, Sewalt RG, Otte AP, Hayes DF, et al: EZH2
is a marker of aggressive breast cancer and promotes neoplastic
transformation of breast epithelial cells. Proc Natl Acad Sci USA.
100:11606–11611. 2003. View Article : Google Scholar : PubMed/NCBI
|
|
10
|
Varambally S, Dhanasekaran SM, Zhou M,
Barrette TR, Kumar-Sinha C, Sanda MG, Ghosh D, Pienta KJ, Sewalt
RG, Otte AP, et al: The polycomb group protein EZH2 is involved in
progression of prostate cancer. Nature. 419:624–629. 2002.
View Article : Google Scholar : PubMed/NCBI
|
|
11
|
Gilbert PM, Mouw JK, Unger MA, Lakins JN,
Gbegnon MK, Clemmer VB, Benezra M, Licht JD, Boudreau NJ, Tsai KK,
et al: HOXA9 regulates BRCA1 expression to modulate human breast
tumor phenotype. J Clin Invest. 120:1535–1550. 2010. View Article : Google Scholar : PubMed/NCBI
|
|
12
|
Wang L, Zeng X, Chen S, Ding L, Zhong J,
Zhao JC, Wang L, Sarver A, Koller A, Zhi J, et al: BRCA1 is a
negative modulator of the PRC2 complex. Embo J. 32:1584–1597. 2013.
View Article : Google Scholar : PubMed/NCBI
|
|
13
|
Chen H, Tu SW and Hsieh JT:
Down-regulation of human DAB2IP gene expression mediated by
polycomb Ezh2 complex and histone deacetylase in prostate cancer. J
Biol Chem. 280:22437–22444. 2005. View Article : Google Scholar : PubMed/NCBI
|
|
14
|
McCabe MT, Ott HM, Ganji G, Korenchuk S,
Thompson C, Van Aller GS, Liu Y, Graves AP, Pietra A Della III,
Diaz E, et al: EZH2 inhibition as a therapeutic strategy for
lymphoma with EZH2-activating mutations. Nature. 492:108–112. 2012.
View Article : Google Scholar : PubMed/NCBI
|
|
15
|
Kurmasheva RT, Sammons M, Favours E, Wu J,
Kurmashev D, Cosmopoulos K, Keilhack H, Klaus CR, Houghton PJ and
Smith MA: Initial testing (stage 1) of tazemetostat (EPZ-6438), a
novel EZH2 inhibitor, by the Pediatric Preclinical Testing Program.
Pediatr Blood Cancer. 64:2017. View Article : Google Scholar
|
|
16
|
van der Vlag J and Otte AP:
Transcriptional repression mediated by the human polycomb-group
protein EED involves histone deacetylation. Nat Genet. 23:474–478.
1999. View Article : Google Scholar : PubMed/NCBI
|
|
17
|
Zhang T, Cooper S and Brockdorff N: The
interplay of histone modifications-writers that read. EMBO Rep.
16:1467–1481. 2015. View Article : Google Scholar : PubMed/NCBI
|
|
18
|
Liu P, Kao TP and Huang H: CDK1 promotes
cell proliferation and survival via phosphorylation and inhibition
of FOXO1 transcription factor. Oncogene. 27:4733–4744. 2008.
View Article : Google Scholar : PubMed/NCBI
|
|
19
|
Livak KJ and Schmittgen TD: Analysis of
relative gene expression data using real-time quantitative PCR and
the 2(-Delta Delta C(T)) method. Methods. 25:402–408. 2001.
View Article : Google Scholar : PubMed/NCBI
|
|
20
|
Heintzman ND, Stuart RK, Hon G, Fu Y,
Ching CW, Hawkins RD, Barrera LO, Van Calcar S, Qu C, Ching KA, et
al: Distinct and predictive chromatin signatures of transcriptional
promoters and enhancers in the human genome. Nat Genet. 39:311–318.
2007. View
Article : Google Scholar : PubMed/NCBI
|
|
21
|
Wang D, Garcia-Bassets I, Benner C, Li W,
Su X, Zhou Y, Qiu J, Liu W, Kaikkonen MU, Ohgi KA, et al:
Reprogramming transcription by distinct classes of enhancers
functionally defined by eRNA. Nature. 474:390–394. 2011. View Article : Google Scholar : PubMed/NCBI
|
|
22
|
Boyer LA, Lee TI, Cole MF, Johnstone SE,
Levine SS, Zucker JP, Guenther MG, Kumar RM, Murray HL, Jenner RG,
et al: Core transcriptional regulatory circuitry in human embryonic
stem cells. Cell. 122:947–956. 2005. View Article : Google Scholar : PubMed/NCBI
|
|
23
|
Elmore S: Apoptosis: A review of
programmed cell death. Toxicol Pathol. 35:495–516. 2007. View Article : Google Scholar : PubMed/NCBI
|
|
24
|
Riccardi C and Nicoletti I: Analysis of
apoptosis by propidium iodide staining and flow cytometry. Nat
Protoc. 1:1458–1461. 2006. View Article : Google Scholar : PubMed/NCBI
|
|
25
|
Chaitanya GV, Steven AJ and Babu PP:
PARP-1 cleavage fragments: Signatures of cell-death proteases in
neurodegeneration. Cell Commun Signal. 8:312010. View Article : Google Scholar : PubMed/NCBI
|
|
26
|
Gogada R, Yadav N, Liu J, Tang S, Zhang D,
Schneider A, Seshadri A, Sun L, Aldaz CM, Tang DG and Chandra D:
Bim, a proapoptotic protein, up-regulated via transcription factor
E2F1-dependent mechanism, functions as a prosurvival molecule in
cancer. J Biol Chem. 288:368–381. 2013. View Article : Google Scholar : PubMed/NCBI
|
|
27
|
Gilley J, Coffer PJ and Ham J: FOXO
transcription factors directly activate bim gene expression and
promote apoptosis in sympathetic neurons. J Cell Biol. 162:613–622.
2003. View Article : Google Scholar : PubMed/NCBI
|
|
28
|
Pei Y, Liu KW, Wang J, Garancher A, Tao R,
Esparza LA, Maier DL, Udaka YT, Murad N, Morrissy S, et al: HDAC
and PI3K Antagonists Cooperate to Inhibit Growth of MYC-Driven
Medulloblastoma. Cancer Cell. 29:311–323. 2016. View Article : Google Scholar : PubMed/NCBI
|
|
29
|
Yang Y, Zhao Y, Liao W, Yang J, Wu L,
Zheng Z, Yu Y, Zhou W, Li L, Feng J, et al: Acetylation of FoxO1
activates Bim expression to induce apoptosis in response to histone
deacetylase inhibitor depsipeptide treatment. Neoplasia.
11:313–324. 2009. View Article : Google Scholar : PubMed/NCBI
|
|
30
|
Gong C, Yao S, Gomes AR, Man EP, Lee HJ,
Gong G, Chang S, Kim SB, Fujino K, Kim SW, et al: BRCA1 positively
regulates FOXO3 expression by restricting FOXO3 gene methylation
and epigenetic silencing through targeting EZH2 in breast cancer.
Oncogenesis. 5:e2142016. View Article : Google Scholar : PubMed/NCBI
|
|
31
|
Zhang J, Zhang P, Wei Y, Piao HL, Wang W,
Maddika S, Wang M, Chen D, Sun Y, Hung MC, et al: Deubiquitylation
and stabilization of PTEN by USP13. Nat Cell Biol. 15:1486–1494.
2013. View
Article : Google Scholar : PubMed/NCBI
|
|
32
|
Nakamura N, Ramaswamy S, Vazquez F,
Signoretti S, Loda M and Sellers WR: Forkhead transcription factors
are critical effectors of cell death and cell cycle arrest
downstream of PTEN. Mol Cell Biol. 20:8969–8982. 2000. View Article : Google Scholar : PubMed/NCBI
|
|
33
|
Medema RH, Kops GJ, Bos JL and Burgering
BM: AFX-like forkhead transcription factors mediate cell-cycle
regulation by Ras and PKB through p27kip1. Nature. 404:782–787.
2000. View Article : Google Scholar : PubMed/NCBI
|
|
34
|
Hussein YR, Sood AK, Bandyopadhyay S,
Albashiti B, Semaan A, Nahleh Z, Roh J, Han HD, Lopez-Berestein G
and Ali-Fehmi R: Clinical and biological relevance of enhancer of
zeste homolog 2 in triple-negative breast cancer. Hum Pathol.
43:1638–1644. 2012. View Article : Google Scholar : PubMed/NCBI
|
|
35
|
Stahl M, Dijkers PF, Kops GJ, Lens SM,
Coffer PJ, Burgering BM and Medema RH: The forkhead transcription
factor FoxO regulates transcription of p27Kip1 and Bim in response
to IL-2. J Immunol. 168:5024–5031. 2002. View Article : Google Scholar : PubMed/NCBI
|