Introduction
MicroRNAs (miRNAs/miRs) are a class of short
endogenous non-coding RNAs that suppress gene expression by either
degrading mRNA or repressing mRNA translation through complementary
binding to their specific target mRNAs in the 3′-untranslated
region (1,2). Mature miRNAs are small single-stranded
RNAs 19–22 nucleotides in length. Increasing evidence suggests that
miRNAs are involved in diverse basic biological processes,
including cell proliferation, apoptosis and differentiation
(3,4).
Studies have also verified that miRNAs are ectopically expressed in
tumors and operate as tumor oncogenes or suppressors during tumor
progression, indicating the potential for miRNAs as biomarkers for
cancer diagnosis and therapy (2).
Hepatocellular carcinoma (HCC) is the third leading
cause of global cancer-associated mortality, with the highest
incidence occurring in Asia (5). The
World Health Organization (WHO) estimates that there are ~56,400
newly diagnosed cases of HCC worldwide per year (6), with a significantly higher occurrence in
males. Notably, more than half of all HCC cases are diagnosed in
China (7). Multiple risk factors
contribute to the occurrence of HCC, including chronic viral
hepatitis and alcohol abuse. HCC development typically involves
several steps, progressing from chronic hepatitis, cirrhosis and
dysplastic nodules to HCC (8). It has
been revealed that miRNAs serve a pivotal role in HCC progression
and may provide novel insight for diagnostic and therapeutic HCC
strategies (9). miR-124-3p has been
implicated in HCC and its expression has been demonstrated to be
downregulated in HCC tissues (2,10).
Additionally, several target genes of miR-124-3p have been
discovered (2,10,11).
However, to the best of our knowledge, previous studies combining
gene expression omnibus (GEO) data and bioinformatics analysis to
explore the mechanisms underlying the role of miR-124-3p in HCC
have not been performed. Additionally, previous studies have only
focused on a specific target gene of miR-124-3p. Therefore, the
potential mechanisms by which miR-124 suppresses tumorigenesis in
HCC remain unclear; miR-124-3p may be involved in the regulation of
several other undiscovered mRNAs and signaling pathways. The
present study investigated miR-124-3p expression and its potential
target genes in HCC by combining reverse transcription-quantitative
polymerase chain reaction (RT-qPCR) with GEO data, using prediction
software and natural language processing (NLP).
The clinical significance of miR-124-3p expression
in hepatocarcinogenesis and development and the potential target
genes of functional pathways in HCC patients was analyzed. Gene
expression profiles were examined from primary HCC samples,
literature searches using PubMed were performed and microarray data
was downloaded from GEO. miR-124-3p was transfected into the HepG2
cell line to confirm the prospective targeted genes predicted in
silico (relevant data were downloaded from GSE6207, GEO
Profiles) and key genes of HCC were identified from NLP. The
identified differentially expressed genes (DEGs) were subsequently
integrated to confirm the potential target genes of miR-124-3p in
HCC. Finally, the relevant signaling pathways in HCC were assessed
to determine the key genes involved in the maintenance of these
pathways, in order to further identify novel therapeutic targets in
HCC.
Materials and methods
Tissue specimens
A total of 101 formalin-fixed, paraffin-embedded
(FFPE) HCC tissues (80 males and 21 females) with clear pathology
diagnoses were collected (10% neutral formalin-fixed for 24 h at
room temperature). These HCC patients underwent primary surgical
resection at the First Affiliated Hospital of Guangxi Medical
University (Nanning, China) between January 2012 and February 2014
and did not receive any additional treatment. The age of the HCC
patients ranged from 29 to 82 years old, with a mean age of 52
years. Among the 101 cases, 70 were successfully followed up.
Clinical stages were classified according to the WHO
Tumor-Node-Metastasis (TNM) criteria (12). Recurrence-free survival (RFS) was
defined as the length of time between surgery and recurrence.
Additionally, 101 adjacent non-HCC tissues were obtained to serve
as internal controls. The present study was approved by the
Research Ethics Committee of the First Affiliated Hospital of
Guangxi Medical University (Nanning, China), and written informed
consent was obtained from all patients.
RNA extraction and RT-qPCR
The total RNA, including miRNA, was isolated from
tumor sections using the miRNeasy FFPE kit (Qiagen China Co., Ltd.,
Shanghai, China), as previously described (13–15). The
miScript Reverse Transcription and the miScript SYBR-Green PCR kits
(218073 and 218161 respectively; Qiagen China Co., Ltd.) were used
to evaluate miR-124-3p expression levels. Reverse
transcription-quantitative polymerase chain reaction (RT-qPCR) was
performed in triplicate using the 7900HT PCR system (Applied
Biosystems; Thermo Fisher Scientific, Inc., Waltham, MA, USA), in
order to determine miRNA expression. The following temperature
protocol was applied: 16°C for 30 min, 42°C for 30 min and 85°C for
5 min. LightCycler 480 SYBR-Green I Master (Roche Diagnostics GmbH)
was used for qPCR, with the following thermocycling conditions:
Initial pre-denaturation for 5 min at 95°C, followed by 40 cycles
of 95°C with 10 sec, 60°C for 10 sec and 72°C for 10 sec;
evaluation of the solubility curve was performed at 95°C for 5 sec
and 65°C for 1 min, which was followed by cooling at 40°C for 30
sec. Each experiment was repeated in triplicate. The abundance of
miR-124-3p in each sample was normalized to references genes RNU6B
and RNU48, which was demonstrated to be a stable internal control
in previous studies (16). The
sequences purchased from Applied Biosystems (Thermo Fisher
Scientific, Inc.) were as follows: miR-124-3p,
5′-UCGGGGAUCAUCAUGUCACGAG-3′ (cat. no. 4427975-001288), RNU6B,
5′-CGCAAGGAUGACACGCAAAUUCGUGAAGCGUUCCAUAUUUUU-3′ (cat. no.
4427975-001093); and RNU48,
5′-GAUGACCCCAGGUAACUCUGAGUGUGUCGCUGAUGCCAUCACCGCAGCGCUCUGACC-3′
(cat. no. 4427975-001006). The relevant expression of miR-124-3p
was quantified using the formula 2−∆Cq (17).
Literature review search
PubMed was searched to identify previous studies
regarding miR-124-3p expression, and clinical parameters were also
collected if available. The search terms were as follows:
‘malignant* OR cancer OR tumor OR neoplas* OR carcinoma’,
‘hepatocellular OR liver OR hepatic OR HCC’ and ‘miR-124 OR
miRNA-124 OR microRNA-124 OR ‘miR 124’ OR ‘miRNA 124’ OR ‘microRNA
124’ OR miR-124-3p OR miRNA-124-3p OR microRNA-124-3p’. A
meta-analysis with P-values alone was subsequently conducted to
pool the collected data if no relative expression of miR-124-3p was
provided. To allow the combination of the P-values from each study,
two-tailed P-values were converted into one-tailed P-values by
dividing by two. A meta-analysis using Fisher's method was
subsequently performed (18).
Public microarray data analysis of
miR-124-3p
To verify the difference in miR-124-3p expression
between HCC and normal liver tissues, the GEO database of the
National Center for Biotechnology Information (NCBI) of the
National Institute of Health (NIH; http://www.ncbi.nlm.nih.gov/geo/) and the ArrayExpress
data of the European Bioinformatics Institute (EBI; http://www.ebi.ac.uk/arrayexpress/) were
searched. The following terms were searched: ‘malignant* OR cancer
OR tumor OR neoplas* OR carcinoma’, ‘hepatocellular OR liver OR
hepatic OR HCC’ and ‘miR-124 OR miRNA-124 OR microRNA-124 OR ‘miR
124’ OR ‘miRNA 124’ OR ‘microRNA 124’ OR miR-124-3p OR miRNA-124-3p
OR microRNA-124-3p’. Following screening, seven datasets [GSE57555
(https://www.ncbi.nlm.nih.gov/geo/query/acc.cgi?acc=GSE57555)
(19), GSE41874 (https://www.ncbi.nlm.nih.gov/geo/query/acc.cgi?acc=GSE41874),
GSE40744 (https://www.ncbi.nlm.nih.gov/geo/query/acc.cgi?acc=GSE40744)
(20), GSE21362 (https://www.ncbi.nlm.nih.gov/geo/query/acc.cgi?acc=GSE21362)
(21), GSE20077 (https://www.ncbi.nlm.nih.gov/geo/query/acc.cgi?acc=GSE20077)
(22), GSE12717 (https://www.ncbi.nlm.nih.gov/geo/query/acc.cgi?acc=GSE12717)
(23) and GSE31383 (https://www.ncbi.nlm.nih.gov/geo/query/acc.cgi?acc=GSE31383)
(24)] were included. Among them,
dataset GSE57555 contained 11 cholangiocarcinoma samples, 5 HCC
samples and 16 normal controls; GSE41874 contained 3 primary HCC
samples, 3 metastatic hepatocellular carcinoma (metastatic HCC)
samples and 4 normal controls; GSE40744 contained 9 HCC, 17 HCC
surrounding non-tumorous tissue affected by cirrhosis (HCC-CIR), 18
hepatitis C virus-associated cirrhosis without HCC (CIR), 13
hepatitis B virus-associated acute liver failure (ALF), 7
surrounding normal liver of liver angioma (NLA) and 12
non-cancerous liver tissues; GSE21362 contained 73 HCC and 73
normal control samples; GSE20077 was a cell line dataset, which
contained 7 HCC cell lines and 3 normal primary human hepatocytes;
GSE12717 contained 10 HCC and 6 normal control samples; GSE31383
contained 9 HCC and 10 normal control samples. In addition, a
dataset GSE64989 contained 8 recurrent HCC and 10 non-recurrent HCC
samples, and two datasets [GSE67138 (https://www.ncbi.nlm.nih.gov/geo/query/acc.cgi?acc=GSE67138)
and GSE67139 (https://www.ncbi.nlm.nih.gov/geo/query/acc.cgi?acc=GSE67139)]
about vascular invasion were also included. GSE67138 contained 23
vascular invasion and 34 non-vascular invasions; GSE67139 contained
58 vascular invasion and 57 non-vascular invasions. The significant
differences between the case groups and normal controls for the
included datasets were calculated using Student's t-test.
To explore the DEGs associated with miR-124-3p in
HCC, GEO profiles were searched with the terms ‘HCC AND miR-124-3p’
and a gene set (GSE6207) investigated miR-124-3p transfection in
the HepG2 cell line was identified. The effects in the miR-124
overexpression group with the negative control group were
subsequently compared by assessing fold change (FC), to identify
downregulated genes and potential miR-124 targets (FC <0.95 were
selected). The GSE6207 dataset (25)
was retrieved to explore the mechanism by which miR-124-3p may be
involved in hepatocarcinogenesis.
In silico analysis of target genes of
miR-124-3p
Predicted targets of miR-124-3p and its target sites
were analyzed using miRWalk2.0 (http://zmf.umm.uni-heidelberg.de/apps/zmf/mirwalk2/)
(26), which combines 12 existing
miRNA-target prediction programs (miRWalk, Microt4, miRanda,
miRbridge, miRDB, miRMap, miRNAMap, Pictar2, PITA, RNA22, RNAhybrid
and TargetScan) to provide comprehensive potential targets for
miR-124-3p. The genes contained in >5 prediction software
programs were selected in order to obtain more reliable
targets.
NLP
NLP is a novel computerized approach to analyze text
in order to achieve human-like language processing. Under this
approach, programmers create software to ‘read’ the text and
extract key pieces of information from clinical notes, procedures,
radiology or pathology reports and laboratory results (27,28). A
literature search was performed in PubMed to obtain all associated
electronic records. The literature search queries were as follows:
(hepatocellular carcinoma) AND (resistance OR prognosis OR
metastasis OR recurrence OR survival OR carcinogenesis OR sorafenib
OR bevacizumab) and [‘1980/01/01’ (PDAT): ‘2015/05/25’ (PDAT)].
Subsequently, all pertinent molecules were retrieved and a list was
generated, primarily comprising proteins and genes. Gene mention
tagging was conducted with A Biomedical Named Entity Recognizer
(ABNER; http://pages.cs.wisc.edu/~bsettles/abner/). ABNER also
assisted in conjunction resolution. Gene name normalization
conformed to the standard names in the Entrez database provided by
NCBI (https://www.ncbi.nlm.nih.gov/gene/). Finally,
statistical analysis was performed; P<0.01 was considered to
indicate a statistically significant difference, as previously
described (29,30). The P-value of a certain HCC-related
gene was calculated with the following formula:
p=1–∑i=0k–1p(i|n,m,N);p(i|n,m,N)=n!(N–n)!m!(N–m)!n–i!i!n–m!N–n–m+i!N!
Where N indicates all the eligible studies, m is the
frequency of the related genes, n is the frequency of HCC and k is
the co-occurrence of HCC and a certain gene.
Construction of protein-protein
interaction (PPI) networks
Overlapping genes were placed into the Search Tool
for the Retrieval of Interacting Genes/Proteins (STRING; version
10.0; http://string-db.org/) to construct the
PPI network. The direct (physical) and indirect (functional)
associations between the proteins were identified using four
methods: Literature-reported protein interactions, high-throughput
experiments, genome analysis and prediction, and co-expression
studies. A node with a degree of high connectivity was perceived as
a hub node. By scrutinizing the connectivity degrees of the nodes
in the PPI networks, the hub genes were determined. Subsequently,
the expression of hub genes identified from PPI networks were
calculated with TCGA data. Firstly, the publicly available RNA-seq
data of the mRNA level of Liver hepatocellular carcinoma (LIHC)
samples were downloaded directly from the TCGA data portal
(https://tcga-data.nci.nih.gov/tcga/tcgaHome2.jsp)
via bulk download mode [LIHC (cancer type), RNASeqV2 (data type),
level 3 (data level)]. Then the relative expression of these hub
genes were extracted and calculated on a log2 scale to investigate
the potential targets of miR-124-3p in HCC. The immunohistochemical
data of most potential targets of miR-124-3p were downloaded from
The Human Protein Atlas (http://www.proteinatlas.org/).
Functional and signaling pathway
analyses
Further functional and signaling pathway analyses
were performed on a set of condition-specific genes, those that
overlapped in the GEO database, target prediction software and NLP.
The functional and signaling pathway analyses of the selected DEGs
was performed on a public database platform; the Database for
Annotation, Visualization and Integrated Discovery (DAVID;
https://david.ncifcrf.gov/), which
provides a functional interpretation of large lists of genes
derived from genomic studies. The analyses also included Gene
Ontology (GO) function analysis (http://www.geneontology.org/), Kyoto Encyclopedia of
Genes and Genomes (KEGG) (http://www.genome.jp/kegg/) analysis and Protein
Annotation Through Evolutionary Relationships (PANTHER) pathway
analysis (http://www.pantherdb.org/). GO
function analysis categorized the selected genes into groups, in
accordance with the following three independent classification
standards: Biological process (BP), cellular component (CC), and
molecular function (MF). A Benjamini P-value of <0.05 was used
to indicate a statistically significant difference in the above
pathway enrichment analyses. The results were visualized as three
GO maps using Cytoscape version 3.4.0 (http://cytoscape.org/). Subsequently, the pathway with
the top priority was selected for further evaluation and the most
significant aberrantly expressed genes were examined for their
prospective diagnostic and prognostic value. The top 30 enriched
pathways of KEGG were visualized using the ggplot2 (version 2.2.1)
package of R/Bioconductor (version 3.4.2) Project for Statistical
Computing (https://www.r-project.org).
Statistical analysis
SPSS 22.0 (IBM Corp., Armonk, NY, USA) was used for
statistical analysis. All data are presented as the mean ± standard
deviation. The receiver operating characteristic (ROC) curve was
drawn to identify the diagnostic significance of miR-124-3p and
clinical parameters. The criteria for assessing the area under the
ROC curve (AUC) were as follows: 0.5–0.7, poor evidence for
diagnosis; 0.7–0.9, moderate evidence for diagnosis; 0.9–1.0, high
evidence for diagnosis. The correlations between miR-124-3p
expression and clinicopathological parameters were determined using
Spearman's rank correlation. Significant differences between HCC
and non-cancerous liver tissues were analyzed using the Student's
t-test. The significant differences amongst three groups was
examined using one-way analysis of variance. Since no significant
differences were identified, no post-hoc test was performed. A
box-whisker plot was generated to demonstrate miR-124-3p expression
from all GEO datasets using GraphPad Prism (version 5.0; GraphPad
Software, Inc., La Jolla, CA, USA). RFS was assessed using the
Kaplan-Meier method as well as Cox Regression and the log-rank test
was performed to compare survival times. Kaplan-Meier survival
curves were drawn to evaluate the association between miR-124-3p
expression and the survival rate of 101 patients with HCC.
P<0.05 was considered to indicate a statistically significant
difference.
Results
Expression of miR-124-3p in HCC
tissues and its association with clinical parameters
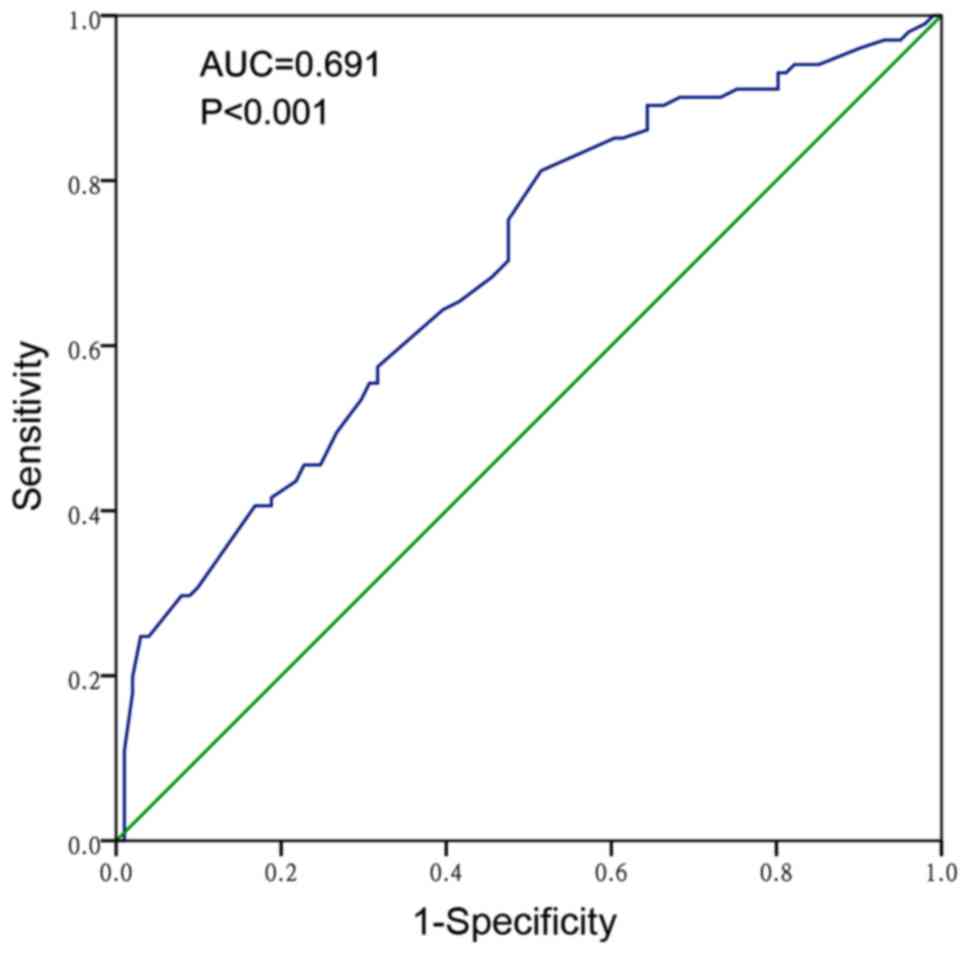
RT-qPCR analysis of miR-124-3p expression in 101 HCC
and adjacent non-cancerous tissues revealed that the relative
expression of miR-124-3p in HCC tissues was 2.4439±1.54599, which
was significantly reduced compared with expression in the adjacent
non-cancerous liver tissues (3.5279±1.82462; P<0.001). The AUC
of the low miR-124-3p levels for HCC diagnosis was 0.691 (95% CI,
0.618–0.763; P<0.001; Fig. 1),
with a cut-off value of 3.30, which indicated that miR-124-3p is a
poor diagnostic marker for HCC. The expression of miR-124-3p in HCC
samples with a single tumor node was significantly increased
(2.7356±1.73799) compared with those with multiple tumor nodes
(2.0659±1.16857; P=0.030). Compared with advanced stage HCC, the
relative expression of miR-124-3p in early stage patients was
markedly increased (stage I and II, 3.4600±1.97104; stage III and
IV, 2.1096±1.21910; P=0.003). Spearman's rank correlation analysis
revealed a correlation between miR-124-3p and clinical stage
(r=−0.305; P=0.002). The clinicopathological parameters of the 101
HCC patients are presented in Table
I.
 | Table I.Association between miR-124-3p and
clinicopathological parameters in hepatocellular carcinoma. |
Table I.
Association between miR-124-3p and
clinicopathological parameters in hepatocellular carcinoma.
|
| Relative miR-124-3p
expression (2−∆Cq) | Spearman's rank
correlation |
|---|
|
|
|
|
|---|
| Clinicopathological
feature | n | Mean ± standard
deviation | t | P-value | r | P-value |
|---|
| Tissue type |
|
|
|
|
|
|
|
Adjacent non-cancerous | 101 | 3.5279±1.82462 | −4.556 |
<0.001a | − | − |
|
HCC | 101 | 2.4439±1.54599 |
|
|
|
|
| Age, years |
|
|
|
|
|
|
|
≥50 | 51 | 2.2182±1.17362 | −1.484 | 0.142 | 0.081 | 0.423 |
|
<50 | 50 | 2.6740±1.83446 |
|
|
|
|
| Sex |
|
|
|
|
|
|
|
Male | 80 | 2.4642±1.62180 | 0.257 | 0.797 | 0.026 | 0.800 |
|
Female | 21 | 2.3662±1.24620 |
|
|
|
|
|
Differentiation |
|
|
|
|
|
|
|
High | 7 | 1.6857±0.74482 | 0.985 | 0.377 | 0.038 | 0.704 |
|
Moderate | 64 | 2.5442±1.60274 |
|
|
|
|
|
Low | 30 | 2.4067±1.54405 |
|
|
|
|
| Size |
|
|
|
|
|
|
| <5
cm | 21 | 2.4381±1.60171 | −0.019 | 0.985 | 0.028 | 0.777 |
| ≥5
cm | 80 | 2.4454±1.54141 |
|
|
|
|
| Tumor nodes |
|
|
|
|
|
|
|
Single | 57 | 2.7356±1.73799 | 2.200 | 0.030a | −0.193 | 0.053 |
|
Multi | 44 | 2.0659±1.16857 |
|
|
|
|
| Metastasis |
|
|
|
|
|
|
| No | 49 | 2.5980±1.85646 | 0.960 | 0.340 | 0.014 | 0.890 |
|
Yes | 52 | 2.2987±1.18255 |
|
|
|
|
| Clinical TNM
stage |
|
|
|
|
|
|
|
I–II | 25 | 3.4600±1.97104 | 3.228 | 0.003a | −0.305 | 0.002a |
|
III–IV | 76 | 2.1096±1.21910 |
|
|
|
|
| Portal vein tumor
embolus |
|
|
|
|
|
|
| − | 69 | 2.5571±1.62674 | 1.082 | 0.282 | −0.082 | 0.414 |
| + | 32 | 2.1997±1.34728 |
|
|
|
|
| Vaso-invasion |
|
|
|
|
|
|
| − | 63 | 2.5705±1.66786 | 1.060 | 0.292 | −0.070 | 0.485 |
| + | 38 | 2.2339±1.31371 |
|
|
|
|
| Tumor capsular
infiltration |
|
|
|
|
|
|
| With
complete capsule | 49 | 2.6039±1.71438 | 1.010 | 0.315 | −0.060 | 0.552 |
| No
capsule or infiltration | 52 | 2.2931±1.36838 |
|
|
|
|
| AFP |
|
|
|
|
|
|
| − | 46 | 2.3150±1.43969 | 0.314 | 0.755 | −0.008 | 0.944 |
| + | 39 | 2.4205±1.66341 |
|
|
|
|
| Cirrhosis |
|
|
|
|
|
|
| − | 54 | 2.4148±1.33719 | 0.198 | 0.844 | 0.066 | 0.509 |
| + | 47 | 2.4772±1.77018 |
|
|
|
|
Expression of miR-124-3p is correlated
with the prognosis of patients with HCC
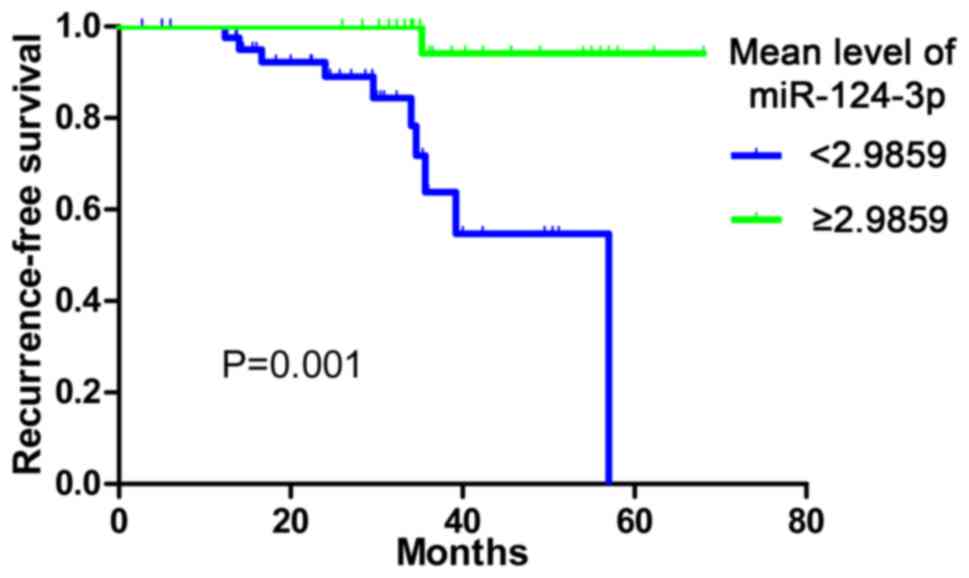
Kaplan-Meier analysis and Cox Regression were
performed in order to determine the prognostic role of miR-124-3p.
The follow-up information of 70 patients was obtained. In total, 44
patients exhibited low miR-124-3p expression (mean, <2.9859),
while 26 patients exhibited high expression. The median survival
time of the low miR-124-3p expression group was 57.00 months which
was significantly reduced compared with that of the high expression
group (the survival rate at each time point was >50%). The RFS
rate was significantly reduced in the low miR-124-3p expression
group compared with the high expression group (P=0.001; Fig. 2). The Cox Regression also demonstrated
a hazard ratio of 0.069 (95%CI, 0.009–0.552; P=0.012).
Expression of miR-124-3p in eight GEO
datasets and previous reports
To confirm the RT-qPCR results of the present study,
GEO datasets were searched to compare the expression of miR-124-3p
between HCC and non-cancerous tissues. miR-124-3p expression levels
in all seven microarray chips [GSE57555 (19), GSE41874 (https://www.ncbi.nlm.nih.gov/geo/query/acc.cgi?acc=GSE41874),
GSE40744 (20), GSE21362 (21) GSE20077 (22), GSE12717 (23) and GSE31383 (24)], including 119 HCC and 124
non-cancerous tissues, were presented in Fig. 3. A recurrence [GSE64989 (31)] and two invasive datasets (GSE67139 and
GSE67138) were also presented. Student's t-test revealed that
miR-124-3p was significantly reduced in HCC compared to normal
control samples with GSE 40744 data. While no significant
difference could be found in other datasets. The seven datasets and
RT-qPCR data from the present study were further analyzed by a
meta-analysis, in which standardized mean differences (SMD) with a
95% CI [SMD and 95% CI, 0.01 (−0.38–0.40)] from selected datasets
were pooled. However, no significant differences were observed
between the HCC and non-cancerous liver groups (data not shown).
Literatures review searching obtained four reliable studies. The
PubMed literature search revealed that miR-124-3p expression in HCC
was reduced compared with that in adjacent non-cancerous liver
tissues, which was consistent with the results obtained in the
present study (pooled P-value of four studies,
P=1.05×10⁻¹⁰).
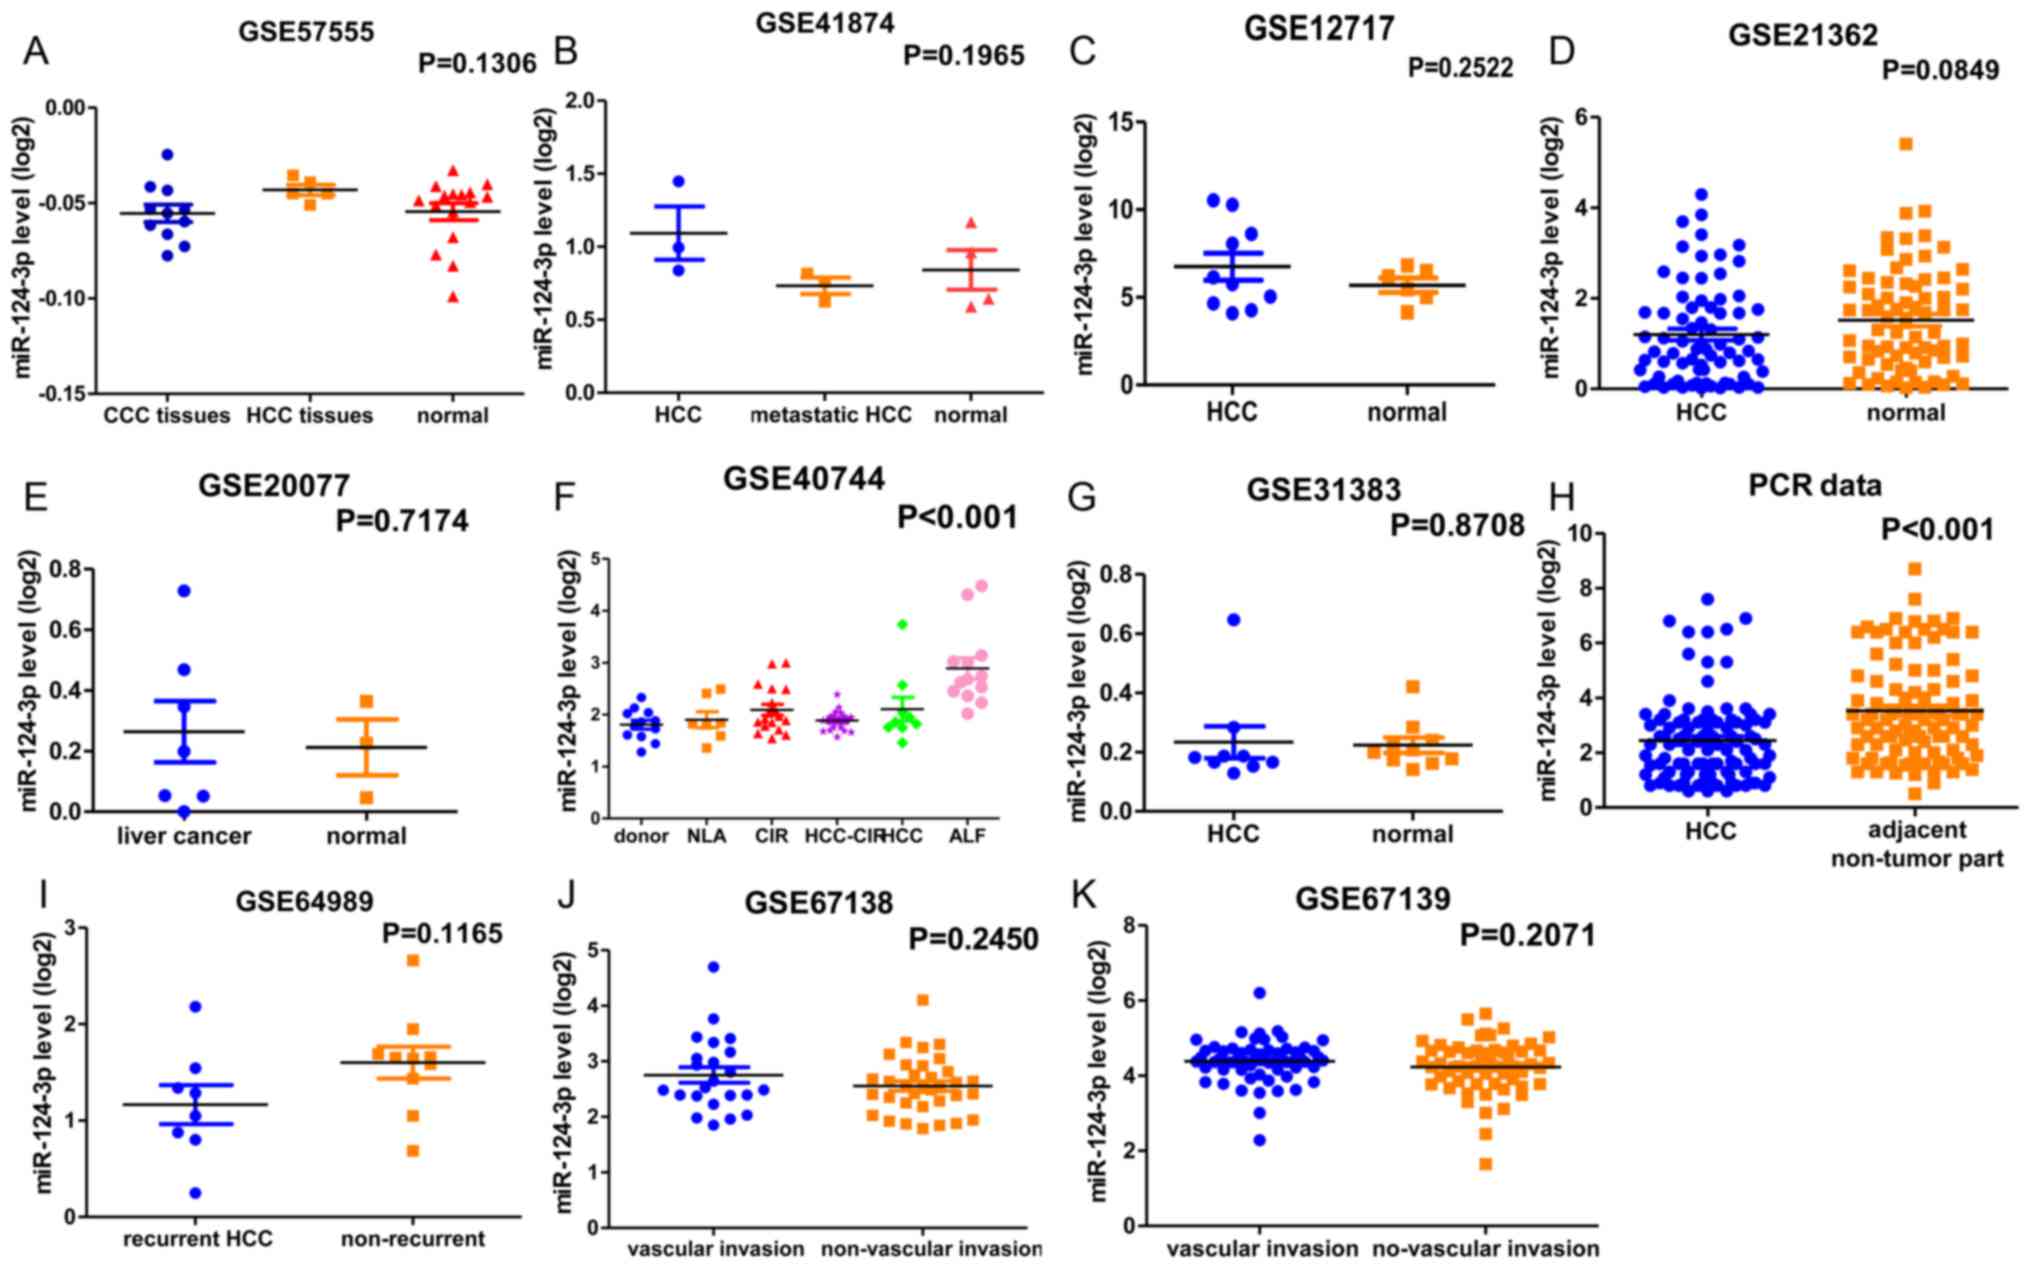 | Figure 3.Scatter diagram presenting the
miR-124-3p expression of 10 microarray chips. (A) miR-124-3p
expression in CCC, HCC and adjacent non-cancerous tissues.
P=0.1306. (B) miR-124-3p expression in primary HCC, metastatic HCC
and normal tissues. P=0.1965. (C) miR-124-3p expression in HCC
tissues and normal liver tissues. P=0.2522. (D) miR-124-3p
expression in HCC tissues and non-cancerous tissues. P=0.0849. (E)
miR-124-3p expression in a human liver cancer cell line and normal
primary human hepatocytes. P=0.7174. (F) miR-124-3p expression in
HCC, HCC-CIR, CIR, ALF, NLA and non-cancerous liver tissues.
P<0.001. (G) miR-124-3p expression in HCC tissues and human
healthy liver tissues. P=0.8708. (H) miR-124-3p expression in HCC
and adjacent non-tumor tissues. P<0.001. (I) miR-124-3p
expression in recurrent HCC tissues and non-recurrent HCC tissues.
P=0.1165. (J) miR-124-3p expression in tumor vascular invasion
tissues and non-tumor vascular invasion tissues. P=0.2450. (K)
miR-124-3p expression in tumor vascular invasion tissues and
non-tumor vascular invasion tissues. P=0.2071. miR-124-3p,
microRNA-124-3p; HCC, hepatocellular carcinoma; CCC,
cholangiocarcinoma; HCC-CIR, HCC surrounding non-tumorous tissue
affected by cirrhosis; CIR, hepatitis C virus-associated cirrhosis
without HCC; ALF, hepatitis B virus-associated acute liver failure;
NLA, surrounding normal liver of liver angioma. |
Potential targets of miR-124-3p in
HCC
To identify potential targets of miR-124-3p, GEO
profiles were searched and gene chip data were downloaded such that
the targets and functions of miR-124-3p could be analyzed. The
fold-change (FC) between the miR-124 transfection group and the
negative control group was subsequently calculated and FC values
<0.95 were selected; a total of 4,261 mRNAs were attained
following duplicate exclusion. The prediction process was then
performed online using the miRWalk 2.0, which contained 12
computational algorithms. To increase the reliability of the
present study, 3,902 mRNAs that appeared in ≥5 prediction software
programs were screened, and any duplicates were excluded.
Additionally, the titles and abstracts of 64,577 studies were
included through the use of NLP data and text mining tools and a
total of 1,800 HCC-associated genes were subsequently identified.
The potential target mRNAs of miR-124-3p in HCC were determined by
combining the predicted targets obtained using the three methods
described earlier. In total, 132 mRNAs (Table II) were selected for PPI network
analysis, GO analysis, KEGG pathway annotation and PANTHER pathway
analysis, in order to identify the genes largely representative of
the prospective molecular mechanism of miR-124-3p in HCC. A flow
chart demonstrating the aforementioned process is presented in
Fig. 4.
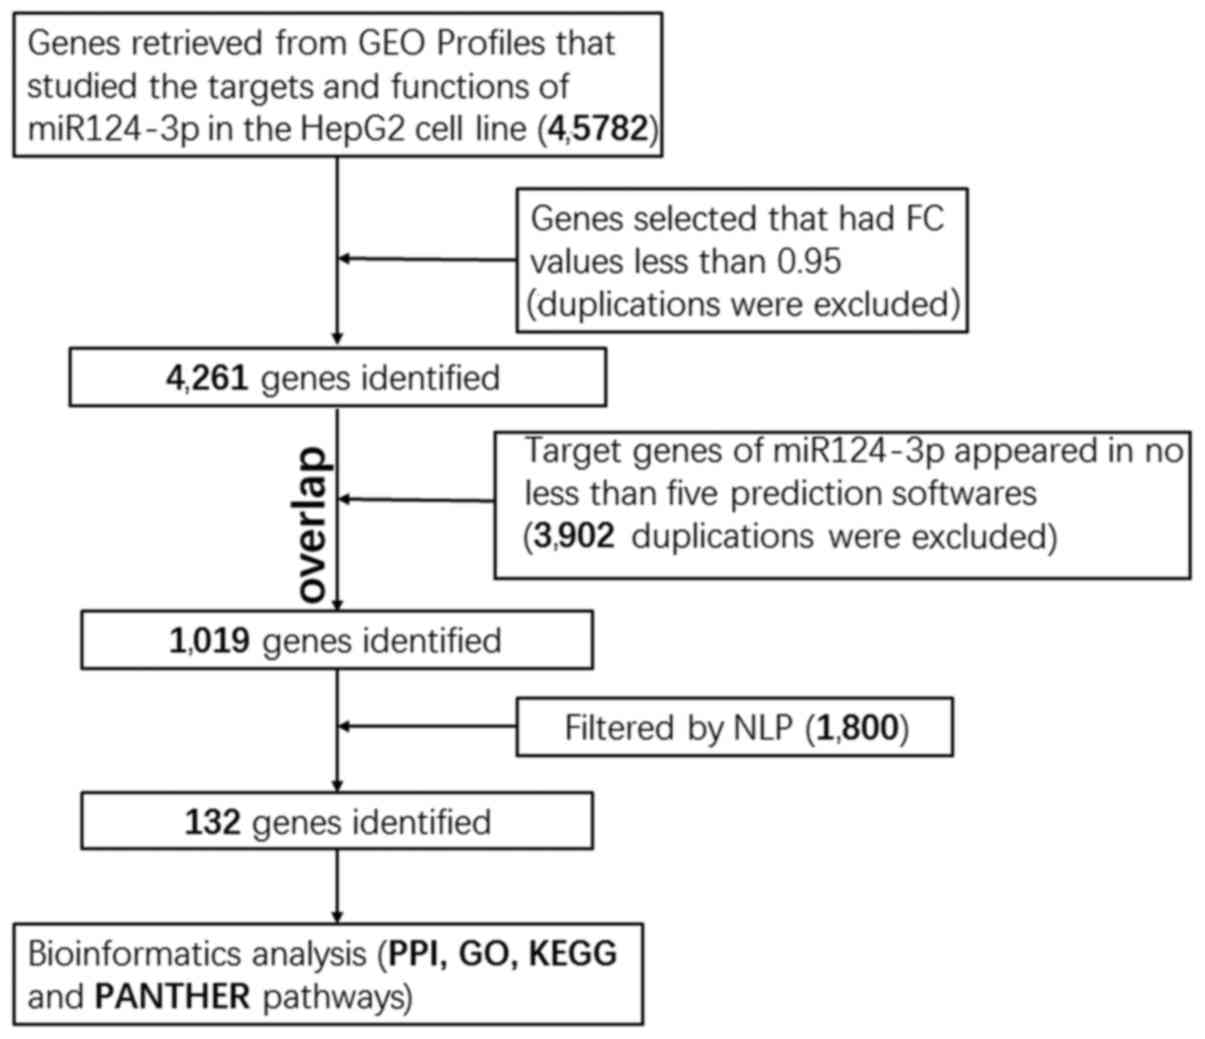 | Figure 4.Illustration of the workflow
pipeline. The genes selected for bioinformatics analysis overlapped
in the GEO database, prediction software and NLP analysis,
resulting in the identification of 132 genes. miR-124-3p,
microRNA-124-3p; GEO, gene expression omnibus; FC, fold change;
NLP, natural language processing; PPI, protein-protein interaction;
GO, gene ontology; KEGG, Kyoto Encyclopedia of Genes and Genomes;
PANTHER, Protein Annotation Through Evolutionary Relationships. |
| Table II.Identified potential target genes of
microRNA-124-3p in hepatocellular carcinoma. |
Table II.
Identified potential target genes of
microRNA-124-3p in hepatocellular carcinoma.
| ZNF148 | ZDHHC2 | ZBTB20 | YAP1 | WSB1 | WHSC1 | WASF2 | VIM | VASH1 | UBE3C | TNFRSF10B | TLR7 |
|---|
| TLN2 | TJP1 | TGFA | TFRC | TFPI | TET1 | TCF4 | TCF3 | SULF1 | ST8SIA2 | SREBF1 | SQSTM1 |
| SPTBN1 | SPRY2 | SPRY1 | SPHK1 | SPARC | SPAG9 | SP1 | SOX9 | SOS1 | SORT1 | SOD2 | SMYD3 |
| SMAD5 | SMAD4 | SEC62 | SEC13 | SART3 | ROCK1 | RELA | RAB27A | PVRL2 | PTPN12 | PTP4A1 | PSEN1 |
| PRRX1 | PRLR | PPP1R13L | PPARA | PIK3CA | PEA15 | PAQR3 | NAAA | MYB | MTR | MTAP | MPZL1 |
| MAPRE1 | MAPK14 | MAPK10 | MAPK1 | LRP6 | LRP1 | LOX | KLF4 | KIF14 | JAG1 | ITGB1 | IQGAP1 |
| ING3 | IL7R | IL11 | IGFBP3 | HTATIP2 | HNMT | HLA-E | HIPK2 | HDLBP | HDAC4 | GYPA | GSN |
| GSC | GRIN1 | GGPS1 | G3BP1 | FMNL2 | FGFR2 | FGFR1 | ETS1 | ERN1 | ERBB3 | ERBB2 | EPHA7 |
| EPHA3 | EGR1 | E2F5 | DTL | DPP4 | DLGAP5 | DAB2IP | DAB2 | CTGF | CRKL | CHEK1 | CEACAM1 |
| CDK6 | CDK4 | CDK2 | CDC25B | CD44 | CCNG2 | CAPN2 | C1GALT1 | BMP6 | BCL2L2 | BCL2L11 | AURKA |
| ASPH | ARHGDIA | ARHGAP1 | ARAF | ANXA7 | ANGPT2 | AKT2 | AHR | ABI1 | ABCC4 | ABCC12 | ABCA2 |
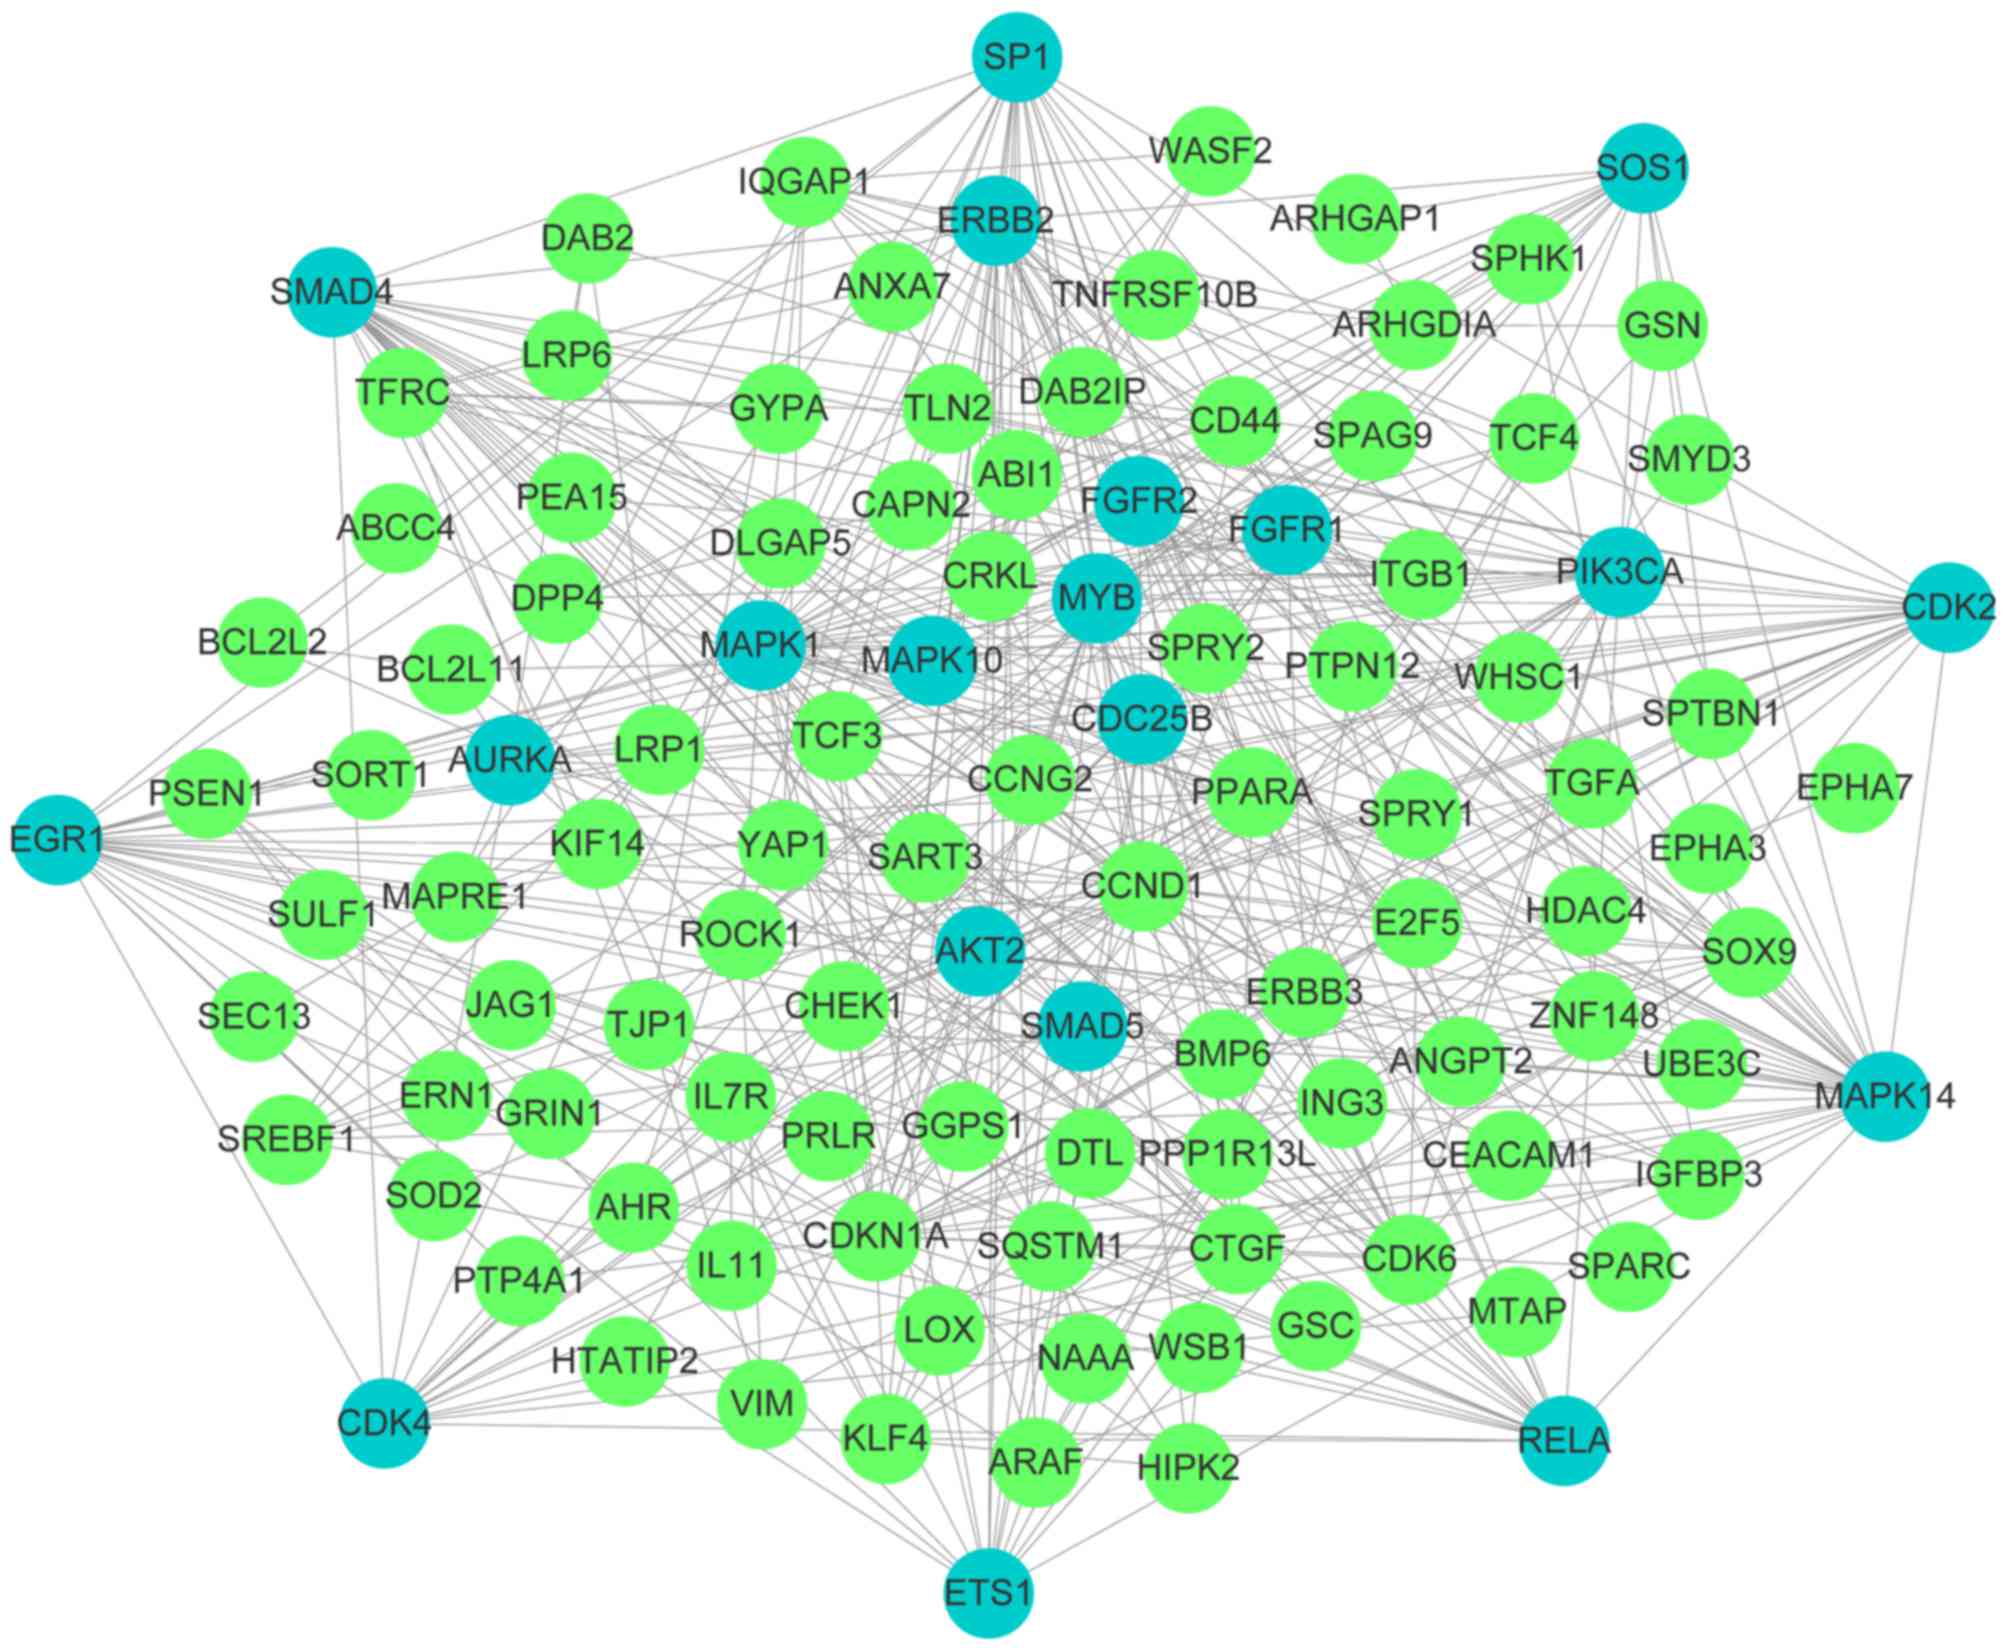
Analysis of PPI networks
The influence of multiple genes, interacting through
a signaling pathway, on cellular function is more significant than
the influence of a single gene. Therefore, a PPI network was
constructed with 132 genes imported into the STRING software.
Consequently, a total of 109 nodes and 386 edges were involved in
the constructed network. Furthermore, 20 key genes with >10
nodes were identified, including mitogen-activated protein kinase 1
(MAPK1), MAPK14, early growth response 1 (EGR1),
phosphatidylinositol-4,5-biphosphate 3-kinase catalytic subunit α
(PIK3CA), RELA proto-oncogene, nuclear factor κ B subunit (RELA),
SOS Ras/Rac guanine nucleotide exchange factor 1 (SOS1), SMAD
family member 4 (SMAD4), erb-b2 tyrosine kinase 2, cyclin dependent
kinase 2 (CDK2), ETS proto-oncogene 1, transcription factor (ETS1),
Sp1 transcription factor (SP1), MYB proto-oncogene, transcription
factor, fibroblast growth factor receptor 1 (FGFR1), AKT
serine/threonine kinase 2 (AKT2), aurora kinase A, CDK4, FGFR2,
SMAD5, MAPK10 and cell division cycle 25B. A total of 23 genes and
proteins acted independently. PPI networks are presented in
Fig. 5.
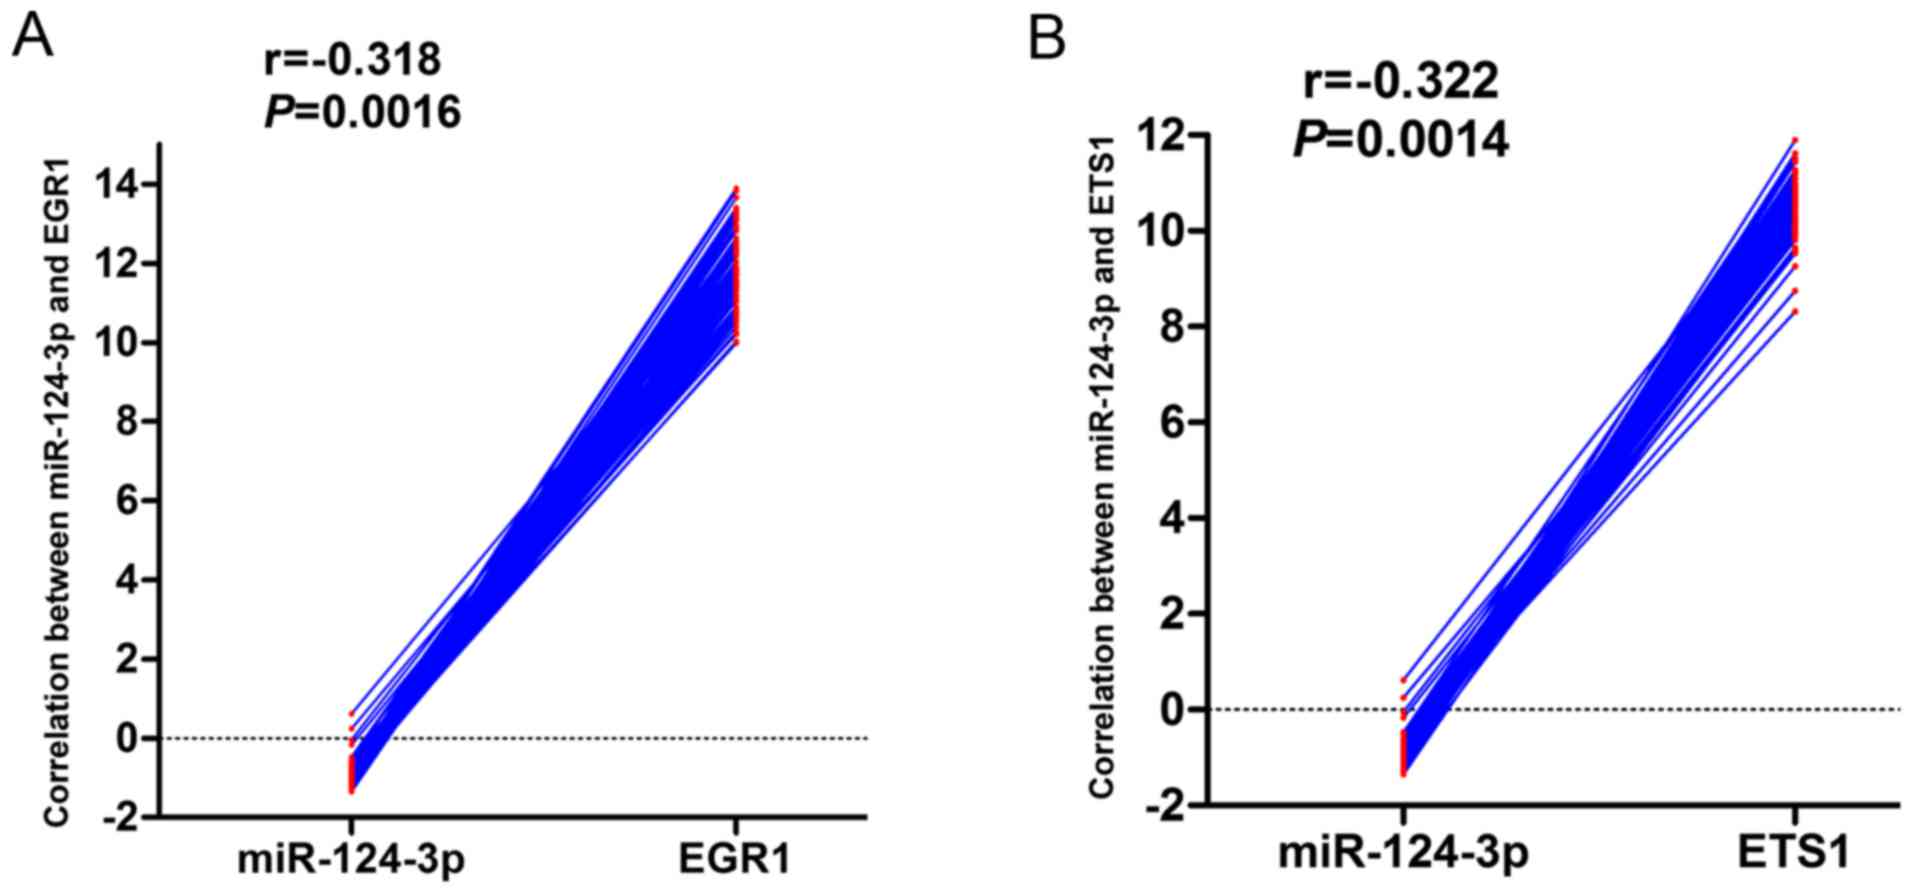
In order to further study the potential role of
miR-124-3p and the 20 key genes identified in HCC, the literature
was reviewed and validated prediction software was searched. The
target genes that had been validated by a luciferase report assay
were subsequently determined. The results revealed that MAPK14,
EGR1, RELA, CDK2, CDK4, ETS1, SOS1 and SP1 were upregulated
following miR-124-3p knockdown. GSE22058 data were also mined to
examine the genome-wide expression profiles of miRNAs and mRNAs of
96 HCC samples and their adjacent non-cancerous liver tissues. This
revealed that EGR1 and ETS1 were negatively correlated with
miR-124-3p expression (Fig. 6).
Additionally, validation of the association between miR-124-3p and
the 20 identified key genes based on TCGA data was attempted, but
insufficient data was available.
Validation of potential target gene
expression based on TCGA with data from The Human Protein
Atlas
Based on the literature review and prediction
software search, 11/20 key genes identified by the PPI network were
selected for further analysis, namely MAPK14, EGR1, RELA, PIK3CA,
SOS1, SMAD4, CDK2, CDK4, ETS1, SP1 and AKT2. The relative
expression of these 11 genes calculated with TCGA data revealed
that no significant differences were detected in the expression of
PIK3CA, SMAD4 and AKT2 between the HCC and adjacent non-cancerous
liver tissues. EGR1 and ETS1 were downregulated in the HCC tissues
when compared with adjacent non-cancerous tissues (data not shown).
Notably, MAPK14, RELA, SOS1, CDK2, CDK4 and SP1 were significantly
overexpressed in liver cancer tissues, compared with expression in
adjacent liver tissues (P<0.01).
The protein expression of the six aforementioned
genes was also collected, as they were more likely to be direct
miR-124-3p targets. The immunohistochemical data downloaded from
The Human Protein Atlas revealed that all these genes were
overexpressed in HCC tissues, with the exception of SOS1, which was
also positively stained in normal tissues. Therefore, MAPK14, RELA,
CDK2, CDK4 and SP1 were considered direct targets of miR-124-3p in
HCC. Expression profiles of the five mRNAs with their corresponding
immunohistochemical results are presented in Fig. 7.
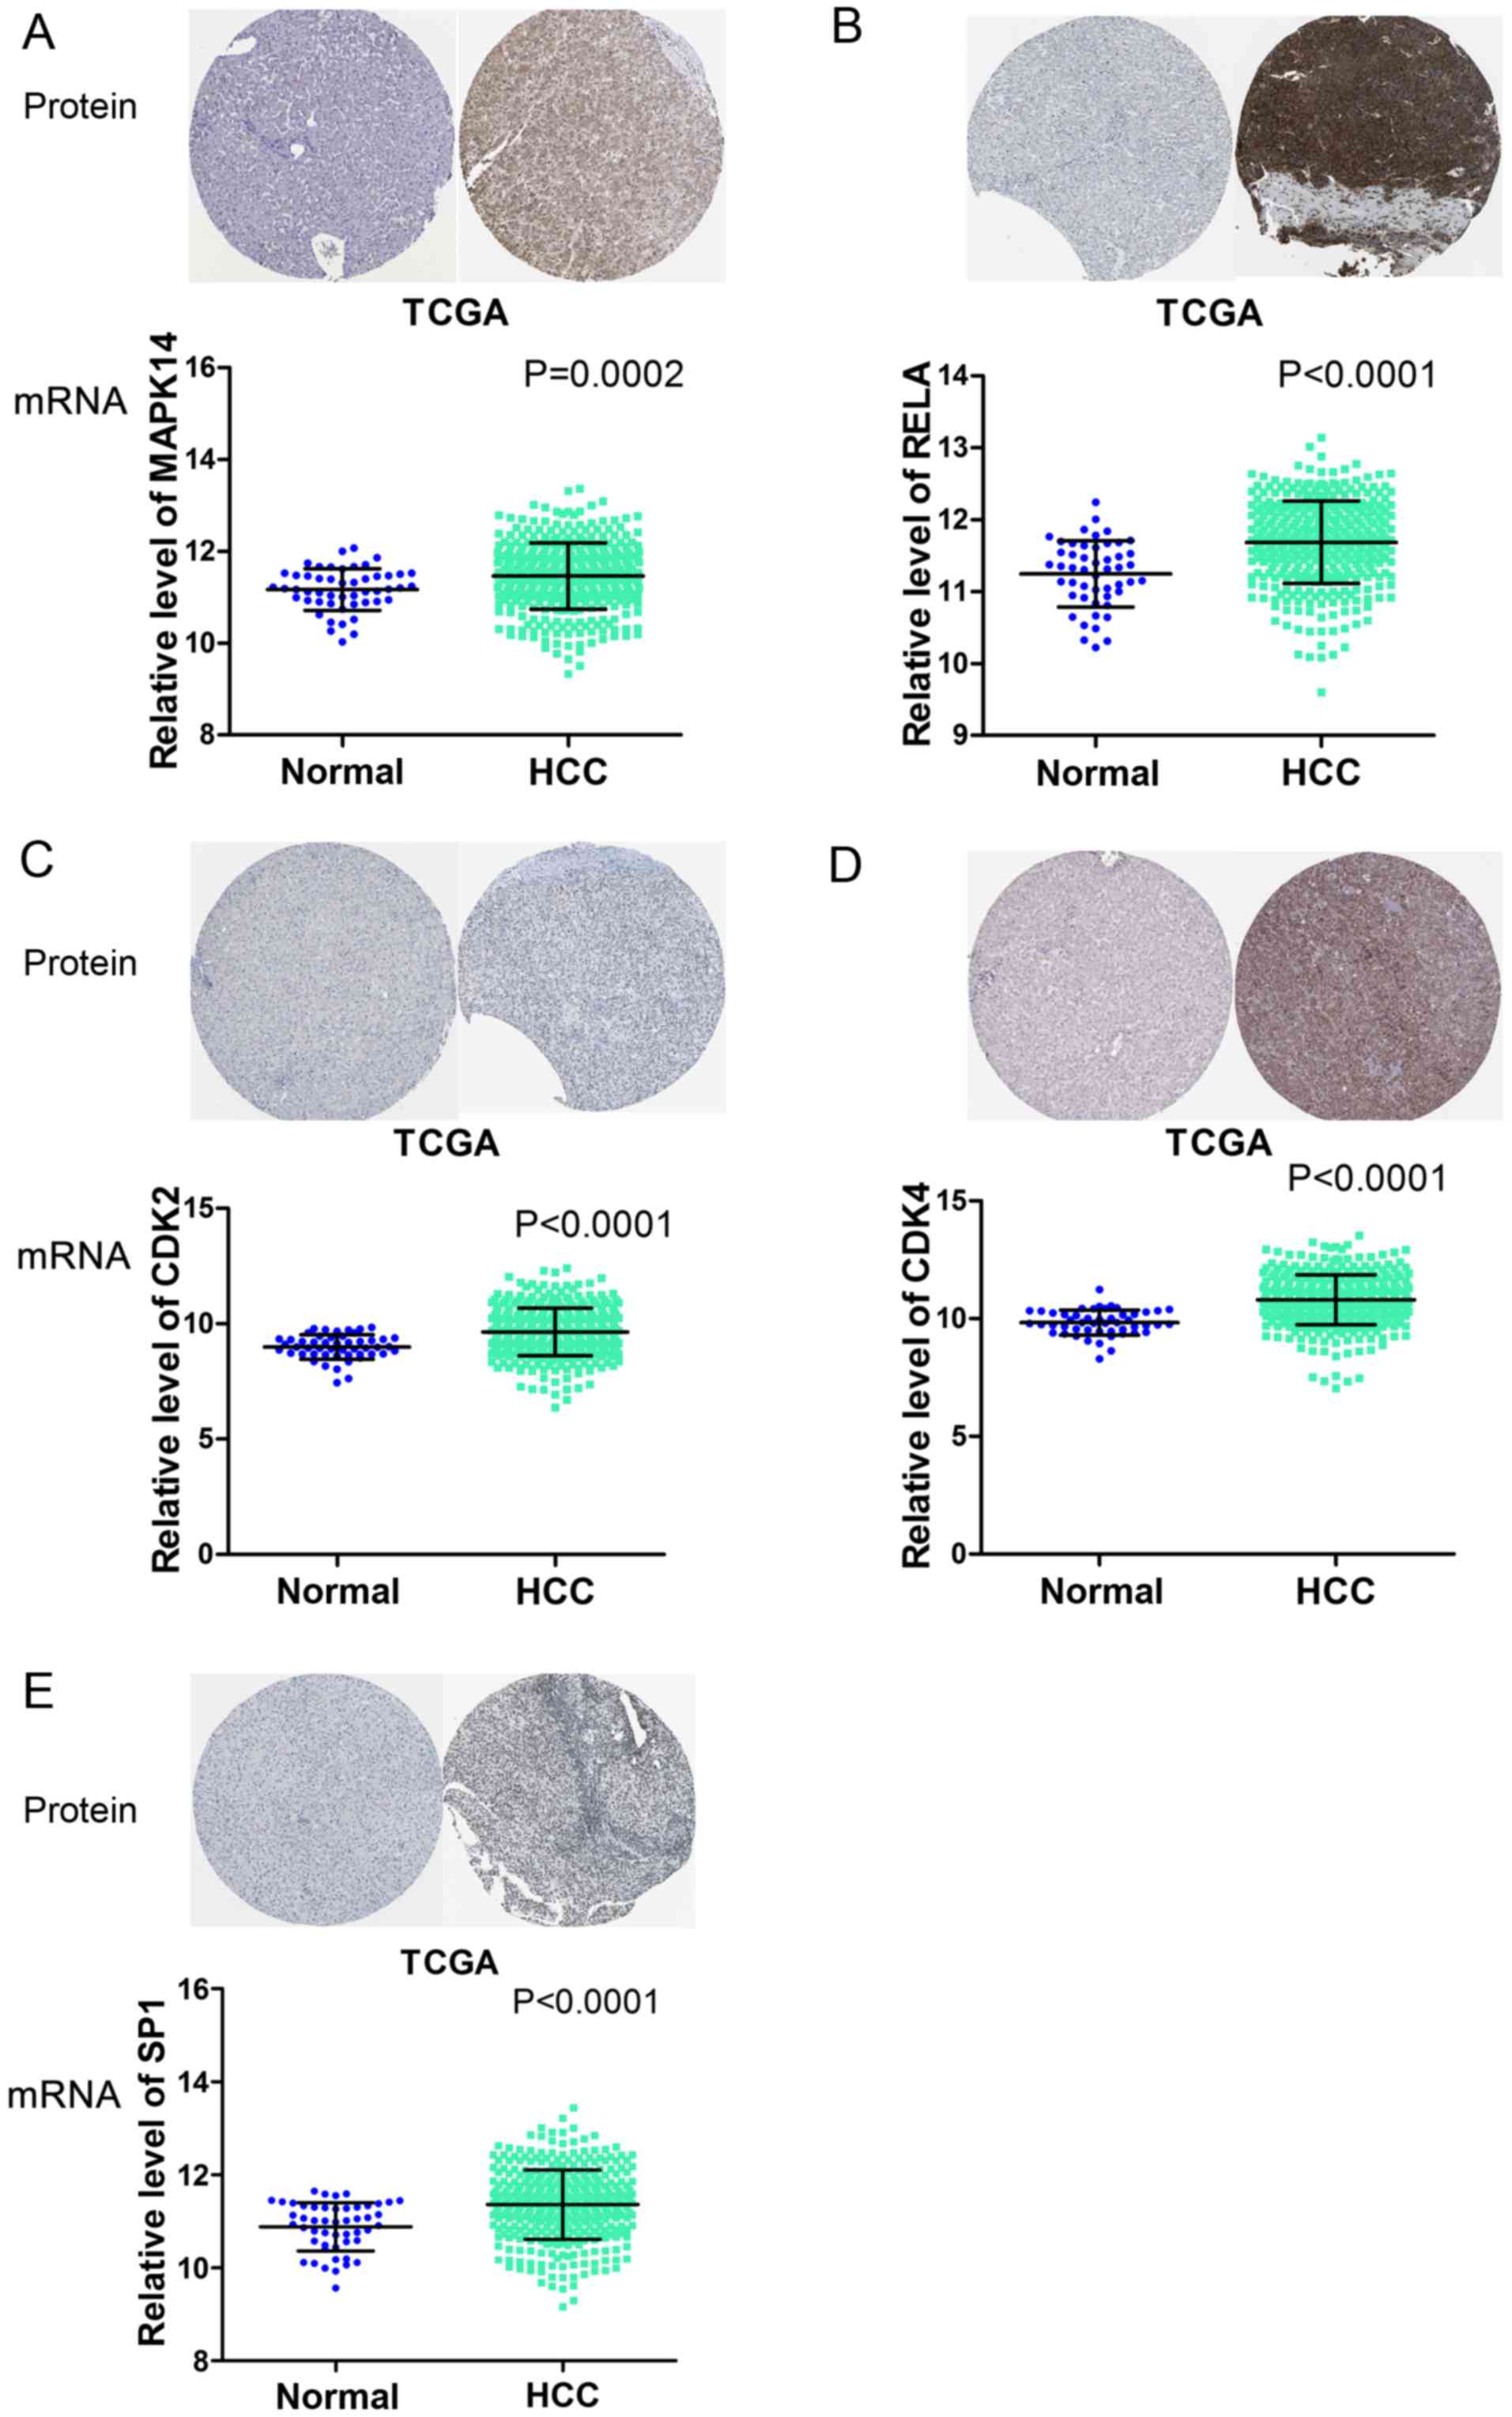 | Figure 7.Overexpression of five potential
target genes of microRNA 124-3p in HCC, based on TCGA and The Human
Protein Atlas data. The TCGA RNAseq profiles of HCC were extracted
to explore the relative expression of (A) MAPK14, (B) RELA, (C)
CDK2, (D) CDK4 and (E) SP1 in HCC and adjacent non-cancerous liver
tissues. Immunohistochemical data was downloaded from The Human
Protein Atlas. TCGA, The Cancer Genome Atlas; HCC, hepatocellular
carcinoma; MAPK14, mitogen-activated protein kinase 14; RELA, RELA
proto-oncogene, nuclear factor κB subunit; CDK2, cycle dependent
kinase 2; CDK4, cycle dependent kinase 4; SP1, SP1 transcription
factor. |
Functional and signaling pathway
analyses
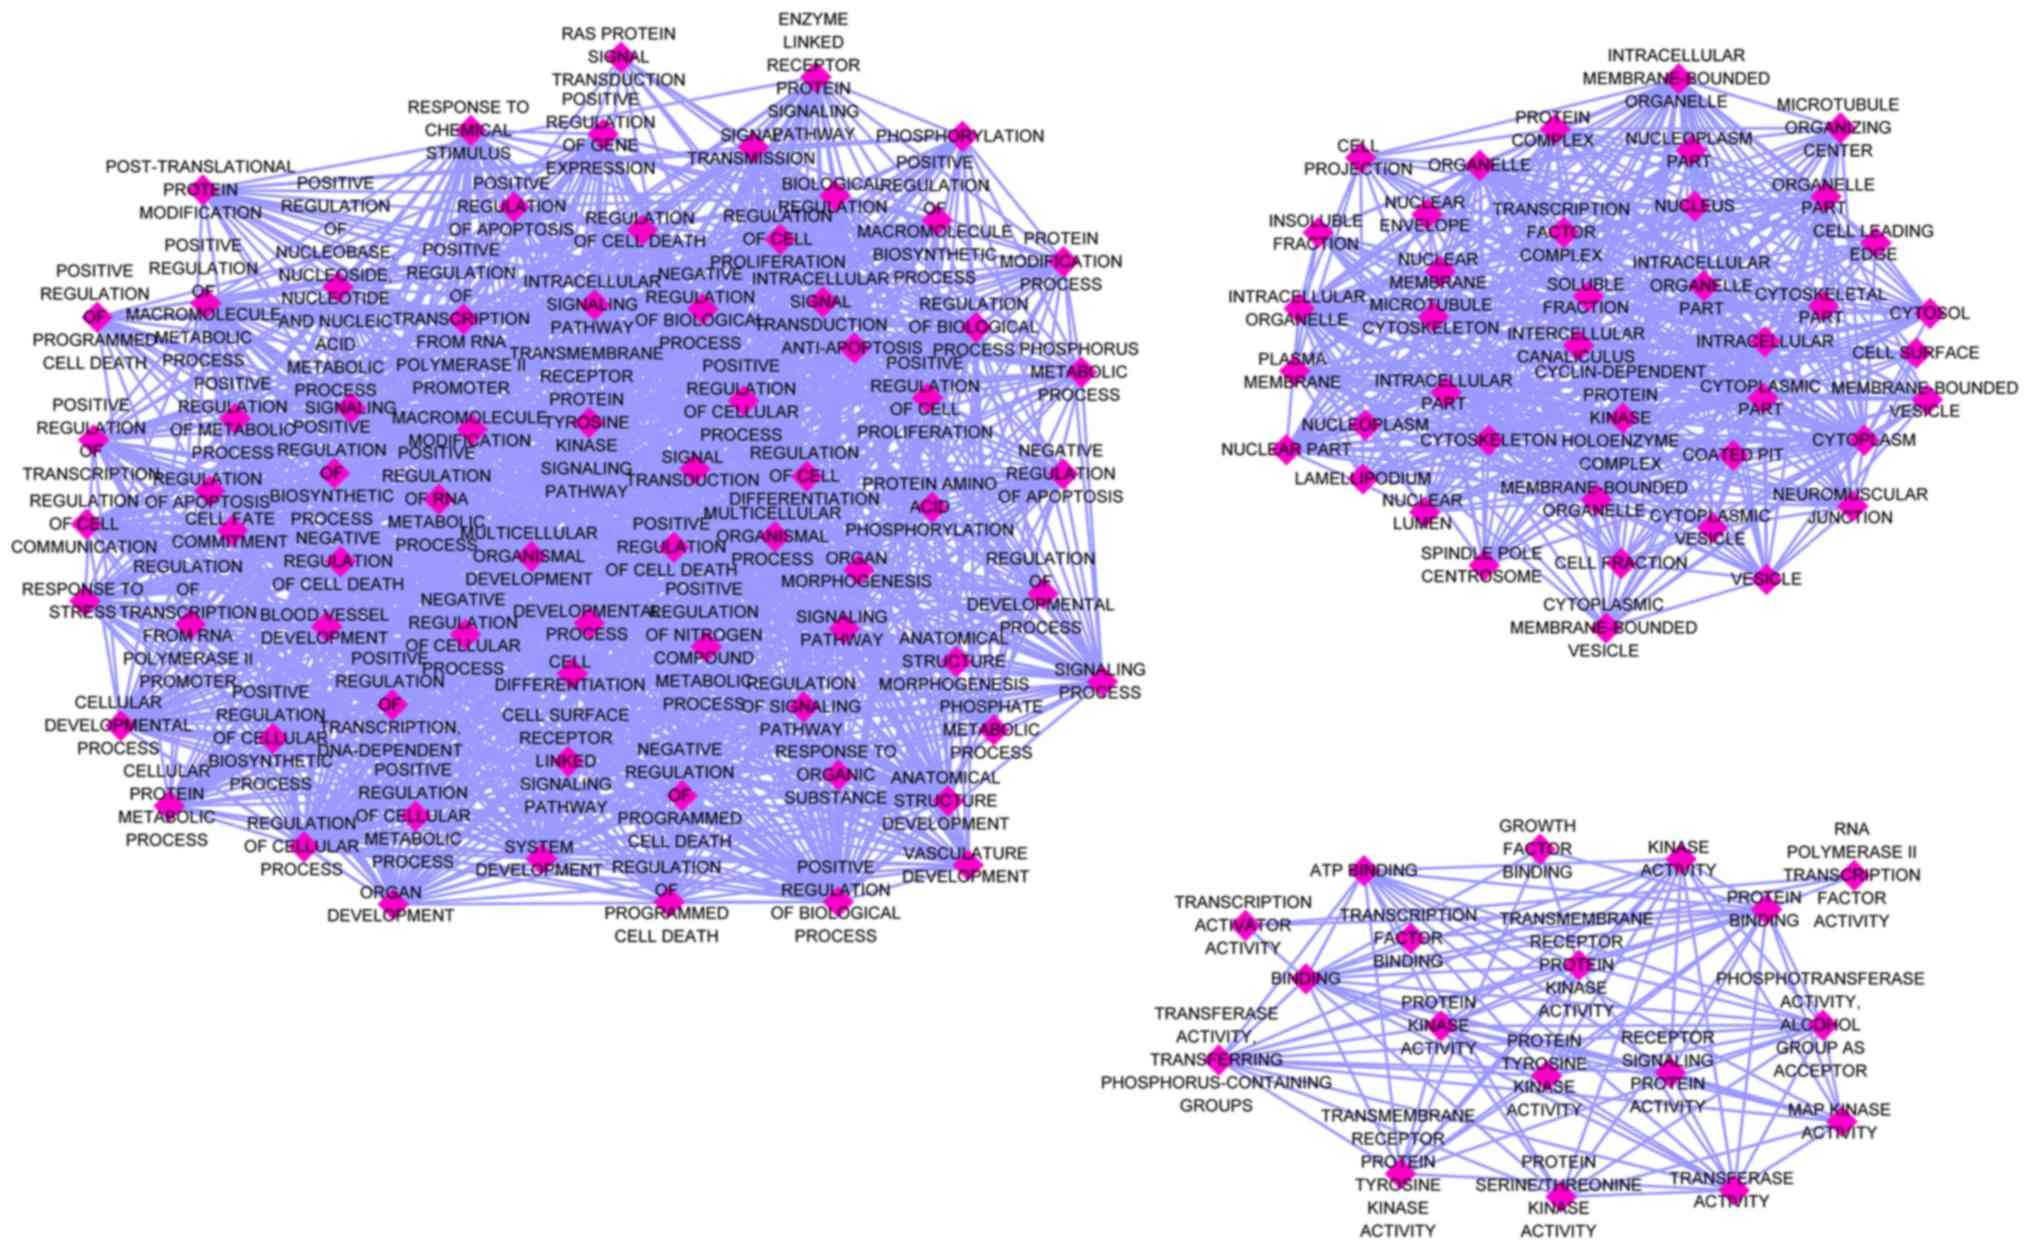
The 132 identified genes were classified into three
GO categories using the online analysis tool DAVID. The BP genes
exhibited significant enrichment in the regulation of cell
proliferation (GO, 0042127; P=1.71×10⁻¹⁰), positive
regulation of cellular biosynthetic processes (GO, 0031328;
P=1.86×10⁻¹⁰) and positive regulation of biosynthetic
processes (GO, 0009891; P=2.57×10⁻¹⁰). Among the CC
genes, the top three functional items were cell leading edge (GO,
0031252; P=4.06×10⁻⁷), cytosol (GO, 0005829;
P=1.12×10⁻⁵) and cell projection (GO, 0042995;
P=1.18×10⁻⁵). Among the MF genes, the most clustered GO
terms were protein kinase activity (GO, 0004672;
P=4.92×10⁻⁷), transcription activator activity (GO,
0016563; P=8.83×10⁻⁵) and enzyme binding (GO, 0019899;
P=2.77×10⁻⁴). Three visualized GO maps (BP, CC and MF)
were drawn by EnrichmentMap, a Cytoscape v3.4.0 plug-in. In the
enrichment map, the number of nodes and edges of the three GO
categories was: BP, 72 and 1366; CC, 41 and 461; MF, 18 and 92,
respectively (Fig. 8). The top 10
categories for 3 GO terms are presented in Table III.
| Table III.GO functional annotation for most
significantly associated targets of microRNA-124-3p. |
Table III.
GO functional annotation for most
significantly associated targets of microRNA-124-3p.
| GO ID | GO term | Count (%) | P-value | Benjamini | FDR | Gene symbol |
|---|
| Biological
process |
|
|
|
|
|
|
|
GO:0042127 | Regulation of cell
proliferation | 30 (1.7) |
1.71×10⁻¹⁰ |
2.83×10⁻⁷ |
2.88×10⁻⁷ | FGFR2, FGFR1,
ERBB3, ERBB2, PRRX1, CHEK1, ABI1, JAG1, SOX9, ITGB1, IL11, TGFA,
ASPH, TCF3, RELA, etc.. |
|
GO:0031328 | Positive regulation
of cellular biosynthetic process | 28 (1.6) |
1.86×10⁻¹⁰ |
1.54×10⁻⁷ |
3.13×10⁻⁷ | PPARA, SOX9, TLR7,
IL11, ZNF148, SQSTM1, YAP1, TCF4, TCF3, AKT2, EGR1, SREBF1, RELA,
GRIN1, SMAD5, etc. |
|
GO:0009891 | Positive regulation
of biosynthetic process | 28 (1.6) |
2.57×10⁻¹⁰ |
1.42×10⁻⁷ |
4.32×10⁻⁷ | PPARA, SOX9, TLR7,
IL11, ZNF148, SQSTM1, YAP1, TCF4, TCF3, AKT2, EGR1, SREBF1, RELA,
GRIN1, SMAD5, etc. |
|
GO:0045944 | Positive regulation
of transcription from RNA polymerase II promoter | 21 (1.2) |
2.78×10⁻¹⁰ |
1.15×10⁻⁷ |
4.68×10⁻⁷ | SREBF1, EGR1,
PPARA, RELA, SMAD5, GRIN1, SMAD4, SOX9, AHR, IL11, HDAC4, SP1,
ZNF148, SQSTM1, ETS1, etc. |
|
GO:0010557 | Positive regulation
of macromolecule biosynthetic process | 27 (1.5) |
3.57×10⁻¹⁰ |
1.18×10⁻⁷ |
6.00×10⁻⁷ | PPARA, SOX9, TLR7,
IL11, ZNF148, SQSTM1, YAP1, TCF4, TCF3, AKT2, EGR1, SREBF1, RELA,
GRIN1, SMAD5, etc. |
|
GO:0006468 | Protein amino acid
phosphorylation | 27 (1.5) |
5.45×10⁻¹⁰ |
1.50×10⁻⁷ |
9.16×10⁻⁷ | FGFR2, FGFR1,
ERBB3, ERBB2, ABI1, AURKA, CHEK1, TGFA, PIK3CA, AKT2, ROCK1, CDK6,
MAPK10, CDK4, CDK2, etc. |
|
GO:0042981 | Regulation of
apoptosis | 29 (1.7) |
1.35×10⁻⁹ |
3.20×10⁻⁷ |
2.28×10⁻⁶ | ING3, HTATIP2,
ERBB3, ERBB2, BCL2L2, SOX9, PEA15, CD44, SQSTM1, SOS1, PIK3CA,
ARHGDIA, RAB27A, ROCK1, RELA, etc. |
|
GO:0043067 | Regulation of
programmed cell death | 29 (1.7) |
1.69×10⁻⁹ |
3.49×10⁻⁷ |
2.84×10⁻⁶ | ING3, HTATIP2,
ERBB3, ERBB2, BCL2L2, SOX9, PEA15, CD44, SQSTM1, SOS1, PIK3CA,
ARHGDIA, RAB27A, ROCK1, RELA, etc. |
|
GO:0010941 | Regulation of cell
death | 29 (1.7) |
1.84×10⁻⁹ |
3.37×10⁻⁷ |
3.08×10⁻⁶ | ING3, HTATIP2,
ERBB3, ERBB2, BCL2L2, SOX9, PEA15, CD44, SQSTM1, SOS1, PIK3CA,
ARHGDIA, RAB27A, ROCK1, RELA, etc. |
|
GO:0045941 | Positive regulation
of transcription | 24 (1.4) |
2.67×10⁻⁹ |
4.42×10⁻⁷ |
4.49×10⁻⁶ | SREBF1, EGR1,
PPARA, RELA, SMAD5, GRIN1, SMAD4, SOX9, AHR, CDK2, IL11, HDAC4,
MAPK1, SP1, ZNF148, etc. |
| Cellular
component |
|
|
|
|
|
|
|
GO:0031252 | Cell leading
edge | 11 (0.6) |
4.06×10⁻⁷ |
9.92×10⁻⁵ |
5.26×10⁻⁴ | SPRY1, TLN2, GSN,
WASF2, ARHGAP1, PIK3CA, ABI1, CDK6, ITGB1, IQGAP1, AKT2 |
|
GO:0005829 | Cytosol | 29 (1.7) |
1.12×10⁻⁵ | 0.00136 | 0.01446 | VIM, BCL2L2, ABI1,
ANXA7, SPRY2, SPRY1, GSN, SQSTM1, SOS1, PIK3CA, ARHGDIA, AKT2,
ROCK1, RELA, SMAD5, etc. |
|
GO:0042995 | Cell
projection | 20 (1.1) |
1.18×10⁻⁵ |
9.61×10⁻⁴ | 0.01530 | TLN2, ERBB2, VIM,
GRIN1, WASF2, CDK6, ABI1, ITGB1, IQGAP1, MAPK1, EPHA7, SPRY1, LRP1,
PSEN1, GSN, etc. |
|
GO:0005667 | Transcription
factor complex | 11 (0.6) |
1.78×10⁻⁵ | 0.00109 | 0.02304 | GSC, E2F5, RELA,
SMAD5, SMAD4, YAP1, TCF4, CDK4, TCF3, KLF4, CDK2 |
|
GO:0000267 | Cell fraction | 23 (1.3) |
2.00×10⁻⁴ | 0.00970 | 0.25820 | FGFR1, GYPA, GRIN1,
SPHK1, ABI1, CAPN2, ITGB1, BCL2L11, PTPN12, SOD2, ANXA7, MAPK1,
LRP1, PSEN1, ARAF, etc. |
|
GO:0009986 | Cell surface | 12 (0.7) |
2.74×10⁻⁴ | 0.01108 | 0.35385 | FGFR2, LRP1, PSEN1,
PRLR, CD44, SULF1, PVRL2, TGFA, SORT1, IL7R, ITGB1, DPP4 |
|
GO:0005654 | Nucleoplasm | 20 (1.1) |
2.79×10⁻⁴ | 0.00967 | 0.35999 | ING3, GSC, E2F5,
RELA, SMAD5, SMAD4, CHEK1, CDK4, SART3, CDK2, CDC25B, HDAC4, MAPK1,
SQSTM1, etc. |
|
GO:0031981 | Nuclear lumen | 27 (1.5) |
3.55×10⁻⁴ | 0.01078 | 0.45888 | ING3, E2F5, CHEK1,
SOX9, SART3, IQGAP1, ZNF148, SQSTM1, YAP1, TCF4, MYB, TCF3, ZBTB20,
GSC, RELA, etc. |
|
GO:0030027 | Lamellipodium | 6 (0.3) |
3.94×10⁻⁴ | 0.01063 | 0.50892 | SPRY1, GSN, WASF2,
PIK3CA, ABI1, AKT2 |
|
GO:0005856 | Cytoskeleton | 26 (1.5) |
4.10×10⁻⁴ | 0.00996 | 0.52974 | TLN2, VIM, WASF2,
ABI1, AURKA, ABCA2, CHEK1, SEC62, IQGAP1, SPRY2, PEA15, GSN, SOS1,
ARHGDIA, KIF14, etc. |
| Molecular
function |
|
|
|
|
|
|
|
GO:0004672 | Protein kinase
activity | 21 (1.2) |
4.92×10⁻⁷ |
1.73×10⁻⁴ |
6.73×10⁻⁴ | FGFR2, FGFR1,
ROCK1, ERBB3, ERBB2, CDK6, CHEK1, AURKA, MAPK10, CDK4, CDK2, EPHA3,
MAPK1, EPHA7, CRKL, etc. |
|
GO:0016563 | Transcription
activator activity | 14 (0.8) |
8.83×10⁻⁵ | 0.01542 | 0.12078 | EGR1, PPARA,
HTATIP2, SMAD5, SMAD4, PRRX1, SOX9, HDAC4, SP1, ZNF148, YAP1, MYB,
TCF3, KLF4 |
|
GO:0019899 | Enzyme binding | 15 (0.9) |
2.77×10⁻⁴ | 0.03193 | 0.37791 | FMNL2, ROCK1,
ERBB2, RELA, VIM, CHEK1, AURKA, IQGAP1, HDAC4, SPAG9, MAPK1, LRP1,
SP1, SQSTM1, SORT1 |
|
GO:0004714 | Transmembrane
receptor protein tyrosine kinase activity | 6 (0.3) |
3.51×10⁻⁴ | 0.03042 | 0.47936 | FGFR2, FGFR1,
EPHA7, ERBB3, ERBB2, EPHA3 |
|
GO:0004674 | Protein
serine/threonine kinase activity | 13 (0.7) |
5.34×10⁻⁴ | 0.03689 | 0.72816 | ROCK1, AURKA,
CHEK1, CDK6, MAPK10, CDK4, CDK2, MAPK1, MAPK14, ARAF, HIPK2, ERN1,
AKT2 |
|
GO:0005524 | ATP binding | 26 (1.5) | 0.00148 | 0.08344 | 2.01226 | FGFR2, FGFR1,
ERBB3, ERBB2, ABCA2, AURKA, CHEK1, PIK3CA, AKT2, KIF14, ROCK1,
G3BP1, SPHK1, CDK6, etc. |
|
GO:0003702 | RNA polymerase II
transcription factor activity | 9 (0.5) | 0.00172 | 0.08284 | 2.32651 | SREBF1, PPARA,
HTATIP2, SP1, ETS1, ZNF148, RELA, SOX9, KLF4 |
|
GO:0010843 | Promoter
binding | 5 (0.3) | 0.00177 | 0.07487 | 2.39182 | SREBF1, HDAC4, SP1,
SMAD4, TCF3 |
|
GO:0032559 | Adenyl
ribonucleotide binding | 26 (1.5) | 0.00179 | 0.06771 | 2.42412 | FGFR2, FGFR1,
ERBB3, ERBB2, ABCA2, AURKA, CHEK1, PIK3CA, AKT2, KIF14, ROCK1,
G3BP1, SPHK1, CDK6, etc. |
|
GO:0019838 | Growth factor
binding | 6 (0.3) | 0.00267 | 0.08983 | 3.59394 | ERBB3, CTGF, ERBB2,
SORT1, IL7R, IGFBP3 |
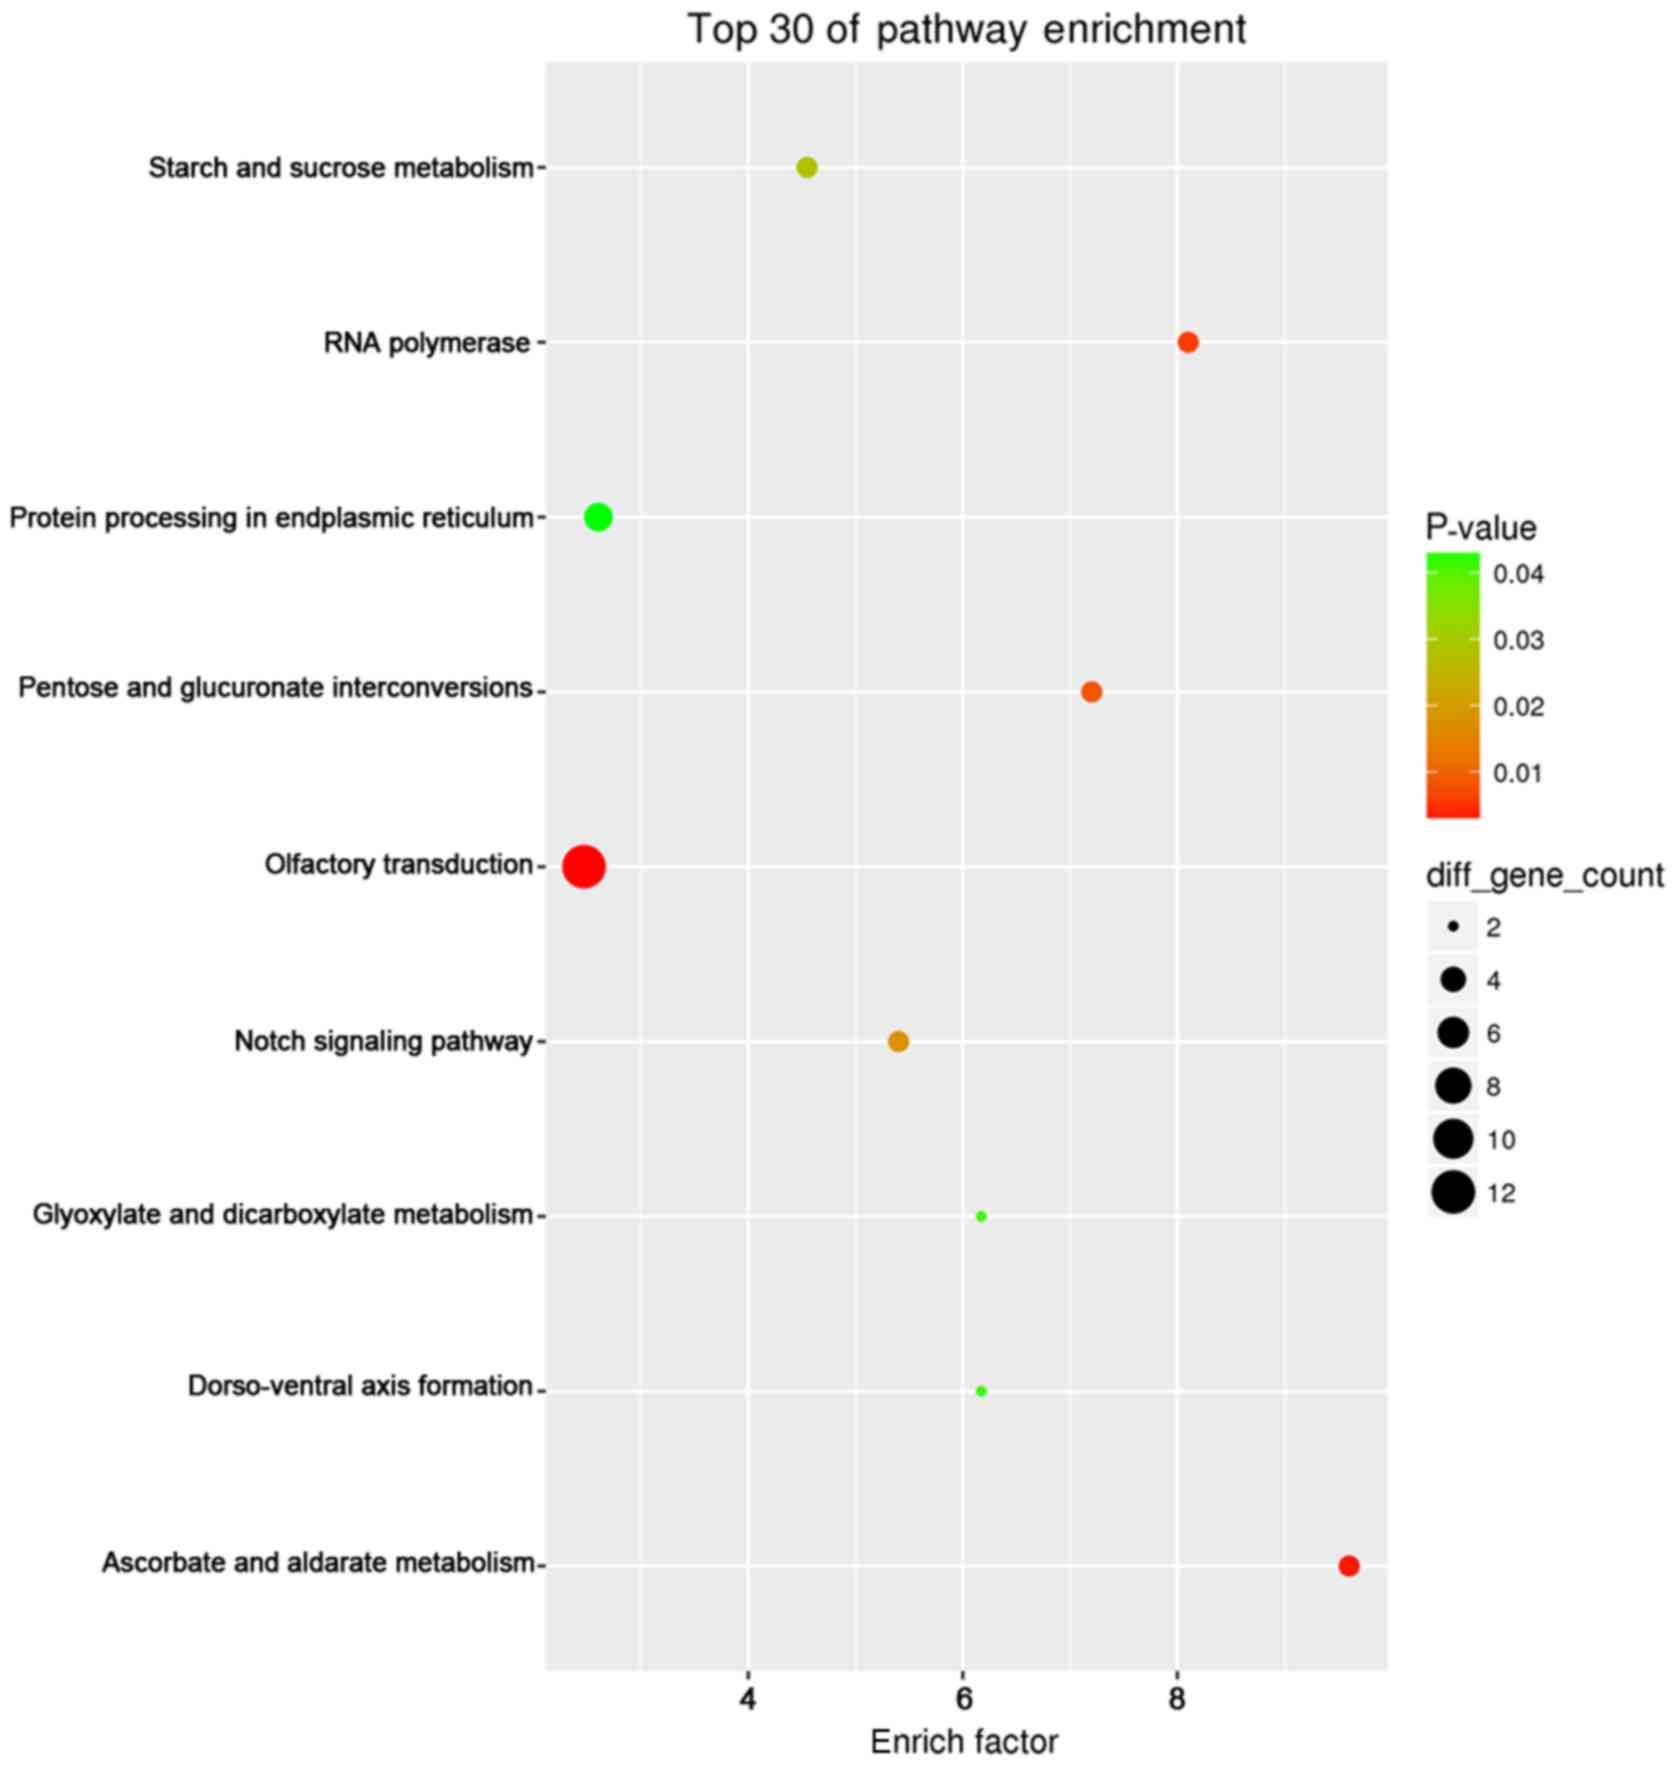
KEGG pathway enrichment analysis revealed that
pancreatic cancer (hsa05212; P=6.80×10⁻⁸), prostate
cancer (hsa05215; P=5.28×10⁻⁷), non-small cell lung
cancer (hsa05223; P=9.25×10⁻⁷), chronic myeloid leukemia
(hsa05220; P=1.16×10⁻⁶) and pathways in cancer
(hsa05200; P=3.64×10⁻⁶) had the most significant
enrichment. The top 30 enriched pathways were presented using the
ggplot2 (version 2.2.1) package of R/Bioconductor (version 3.4.2)
Project for Statistical Computing (https://www.r-project.org/), a free software
environment for statistical computing and graphics (32) (Fig.
9).
Regarding the PANTHER pathway, the following three
terms were identified as the most significant: Angiogenesis
(P00005; P=1.78×10⁻⁷), epidermal growth factor receptor
signaling pathway (P00018; P=1.54×10⁻⁶), and FGF
signaling pathway (P00021; P=4.32×10⁻⁵). The top 10
categories for KEGG and the PANTHER pathway are presented in
Table IV.
| Table IV.KEGG and PANTHER functional
annotation for most significantly associated targets of
miR-124-3p. |
Table IV.
KEGG and PANTHER functional
annotation for most significantly associated targets of
miR-124-3p.
| Database ID | Database term | Count (%) | P-value | Benjamini | FDR | Gene symbol |
|---|
| KEGG |
|
|
|
|
|
|
|
hsa05212 | Pancreatic
cancer | 11 (0.6) |
6.80×10⁻⁸ |
6.39×10⁻⁶ |
7.46×10⁻⁵ | MAPK1, RELA, ERBB2,
ARAF, SMAD4, TGFA, PIK3CA, CDK6, MAPK10, CDK4, AKT2 |
|
hsa05215 | Prostate
cancer | 11 (0.6) |
5.28×10⁻⁷ |
2.48×10⁻⁵ |
5.79×10⁻⁴ | FGFR2, FGFR1,
MAPK1, RELA, ERBB2, SOS1, ARAF, TGFA, PIK3CA, CDK2, AKT2 |
|
hsa05223 | Non-small cell lung
cancer | 9 (0.5) |
9.25×10⁻⁷ |
2.90×10⁻⁵ | 0.00101 | MAPK1, ERBB2, SOS1,
ARAF, TGFA, PIK3CA, CDK6, CDK4, AKT2 |
|
hsa05220 | Chronic myeloid
leukemia | 10 (0.6) |
1.16×10⁻⁶ |
2.74×10⁻⁵ | 0.00128 | MAPK1, CRKL, RELA,
SOS1, ARAF, SMAD4, PIK3CA, CDK6, CDK4, AKT2 |
|
hsa05200 | Pathways in
cancer | 18 (1.0) |
3.64×10⁻⁶ |
6.84×10⁻⁵ | 0.00399 | FGFR2, FGFR1,
ERBB2, RELA, SMAD4, CDK6, MAPK10, CDK4, ITGB1, CDK2, MAPK1, CRKL,
ETS1, SOS1, ARAF, TGFA, PIK3CA, AKT2 |
|
hsa04012 | ErbB signaling
pathway | 10 (0.6) |
4.13×10⁻⁶ |
6.47×10⁻⁵ | 0.00453 | MAPK1, CRKL, ERBB3,
ERBB2, SOS1, ARAF, TGFA, PIK3CA, MAPK10, AKT2 |
|
hsa04722 | Neurotrophin
signaling pathway | 11 (0.6) |
1.12×10⁻⁵ |
1.51×10⁻⁴ | 0.01230 | MAPK1, CRKL, PSEN1,
RELA, MAPK14, SOS1, SORT1, PIK3CA, MAPK10, ARHGDIA, AKT2 |
|
hsa05214 | Glioma | 8 (0.5) |
3.27×10⁻⁵ |
3.84×10⁻⁴ | 0.03585 | MAPK1, SOS1, ARAF,
TGFA, PIK3CA, CDK6, CDK4, AKT2 |
|
hsa05211 | Renal cell
carcinoma | 8 (0.5) |
6.52×10⁻⁵ |
6.81×10⁻⁴ | 0.07153 | MAPK1, CRKL, ETS1,
SOS1, ARAF, TGFA, PIK3CA, AKT2 |
|
hsa04520 | Adherens
junction | 8 (0.5) |
1.21×10⁻⁴ | 0.00113 | 0.13211 | FGFR1, MAPK1, TJP1,
ERBB2, WASF2, PVRL2, SMAD4, IQGAP1 |
| PANTHER |
|
|
|
|
|
|
|
P00005 | Angiogenesis | 17 (1.0) |
1.78×10⁻⁷ |
8.17×10⁻⁶ |
1.68×10⁻⁴ | FGFR2, FGFR1,
SPHK1, JAG1, MAPK10, EPHA3, MAPK1, EPHA7, CRKL, ETS1, MAPK14, SOS1,
ARAF, ARHGAP1, etc. |
|
P00018 | EGF receptor
signaling pathway | 13 (0.7) |
1.54×10⁻⁶ |
3.55×10⁻⁵ | 0.00146 | MAPK1, SPRY2,
DAB2IP, SPRY1, ERBB3, MAPK14, ERBB2, SOS1, ARAF, PIK3CA, TGFA,
MAPK10, AKT2 |
|
P00021 | FGF signaling
pathway | 11 (0.6) |
4.32×10⁻⁵ |
6.61×10⁻⁴ | 0.04078 | FGFR2, SPRY2,
FGFR1, MAPK1, SPRY1, MAPK14, SOS1, ARAF, PIK3CA, MAPK10, AKT2 |
|
P00056 | VEGF signaling
pathway | 8 (0.5) |
2.25×10⁻⁴ | 0.00259 | 0.21257 | MAPK1, ETS1,
MAPK14, ARAF, ARHGAP1, SPHK1, PIK3CA, AKT2 |
|
P04393 | Ras Pathway | 8 (0.5) |
5.48×10⁻⁴ | 0.00503 | 0.51707 | MAPK1, ETS1,
MAPK14, SOS1, ARAF, PIK3CA, MAPK10, AKT2 |
|
P00010 | B cell
activation | 6 (0.3) | 0.01190 | 0.08766 | 10.69454 | MAPK1, MAPK14,
SOS1, ARAF, PIK3CA, MAPK10 |
|
P00006 | Apoptosis signaling
pathway | 7 (0.4) | 0.01767 | 0.11053 | 15.50490 | MAPK1, TNFRSF10B,
RELA, PIK3CA, BCL2L2, MAPK10, AKT2 |
|
P04398 | p53 pathway
feedback loops 2 | 5 (0.3) | 0.01786 | 0.09846 | 15.66488 | MAPK14, PIK3CA,
CCNG2, CDK2, AKT2 |
|
P00054 | Toll receptor
signaling pathway | 5 (0.3) | 0.01987 | 0.09748 | 17.27652 | MAPK1, RELA,
MAPK14, MAPK10, TLR7 |
|
P00034 | Integrin signaling
pathway | 9 (0.5) | 0.02426 | 0.10682 | 20.71556 | MAPK1, CRKL,
MAPK14, SOS1, ARAF, PIK3CA, MAPK10, ITGB1, PTPN12 |
|
P00047 | PDGF signaling
pathway | 8 (0.5) | 0.02650 | 0.10625 | 22.42248 | MAPK1, ETS1, SOS1,
ARAF, ARHGAP1, PIK3CA, MAPK10, AKT2 |
|
P00053 | T cell
activation | 6 (0.3) | 0.04509 | 0.16213 | 35.34827 | MAPK1, SOS1, ARAF,
PIK3CA, MAPK10, AKT2 |
|
P00059 | p53 pathway | 6 (0.3) | 0.04510 | 0.16213 | 35.34827 | TNFRSF10B, PIK3CA,
IGFBP3, CCNG2, CDK2, AKT2 |
Discussion
The occurrence and development of HCC is a multistep
process that involves the activation of tumor oncogenes and/or the
inactivation of tumor suppressor genes. These factors are of vital
importance for the design of effective therapeutic strategies for
the treatment of HCC. Given that the prognosis of advanced HCC
remains poor regardless of improvements in innovative therapeutic
approaches, the development of a more effective method of diagnosis
and therapy and/or a novel biomarker for early stage HCC is
urgently required. Previous studies have demonstrated the crucial
involvement of miRNAs in carcinogenesis (33–35). The
function of miRNAs in hepatocarcinogenesis has also been assessed.
The ectopic expression of several miRNAs has been detected in HCC,
including miR-21, miR-542-5p, miR-29, miR-140-5p, miR-221 and
miR-490-3p. Previous studies have also reported low miR-124
expression in HCC (2,10,36,37),
prostate cancer (38), breast cancer
(39), gastric cancer (40) and pancreatic cancer (41). In line with the results of previous
studies, the present study demonstrated that miR-124-3p was
downregulated in HCC and that its downregulation was significantly
associated with certain clinical characteristics, including the TNM
stage. Additionally, the data indicated that miR-124-3p expression
is positively associated with RFS in patients with HCC (P=0.012).
Meta-analysis of GEO data only, and meta-analysis of GEO data plus
in-house PCR revealed no significant difference of miR-124-3p
between HCC and non-cancerous liver groups. Certain chips contained
fewer HCC samples than non-cancerous samples, while other chips
contained more HCC samples than non-cancerous samples.
Additionally, technology may be another cause of this difference.
For example, amongst the data included here, certain parts were
detected using gene chip technology, while a number were detected
by PCR. Conversely, seven microarrays come from different
platforms, which is another reason to cause the difference. TCGA
was used in order to validate the downregulation of miR-124-3p, but
this was unsuccessful due to the lack of available data.
miRNAs are a class of short endogenous non-coding
RNAs that inhibit gene expression by either degrading mRNA or
repressing mRNA translation. Theoretically, there are hundreds of
potential targets for a single miRNA. Previous studies have
demonstrated that miRNAs modulate a wide variety of targets,
indicating that a single miRNA may regulate cancer progression in
multiple steps by targeting numerous genes. Zheng et al
(37) reported that miR-124 inhibits
epithelial-mesenchymal transition by inhibiting the mRNA and
protein expression of ROCK2 and EZH2 in HCC. Lang and Ling
(10) demonstrated that miR-124
inhibits cell proliferation by targeting PIK3CA in HCC. The
literature search of the present study revealed that miR-124-3p
acts via the regulation of CTGF, ITGB1, RhoG and ROCK1 expression.
Recently, with the progression of high-throughput sequencing and
bioinformatics, circular RNAs (circRNAs) have received increasing
attention (42,43). Increasing evidence indicates that
circRNAs may serve a major role in various types of cancer
(44–46), including HCC. Shang et al
(47) identified hsa_circ_0005075 as
a potential HCC biomarker involved in HCC development. Qin et
al (48) and Xu et al
(49) also demonstrated that circRNAs
may serve as potential novel biomarkers in HCC. Notably, Zheng
et al (50) performed RNA
immunoprecipitation and luciferase screening, demonstrating that
circHIPK3 may function as a sponge for miRNAs, including miR-12, as
circHIPK3 is directly adsorbed to miR-124 and suppresses its
activation. In the present study, the target genes of miR-124-3p
were explored by assessing the overlapping genes retrieved from GEO
profiles, prediction software and NLP. A total of 132 potential
target mRNAs of miR-124-3p in HCC were identified. Based on the
prospective roles of circRNAs in human cancer, future studies
should aim to further investigate the association between circRNA
and miR-124-3p in HCC.
As the diagnosis of HCC at early stages is
difficult, when patients were diagnosed with HCC, it is generally
too late to remove the tumor with surgical excision. Various novel
therapies for advanced HCC are being actively pursued, including
molecular targeted therapy, systemic chemotherapy, immunotherapy
and arginine deprivation therapy (51). These treatment therapies are all
involved in the molecular pathways of HCC development. Furthermore,
the majority of the molecular targeted drugs currently being
investigated are multi-targeted drugs. Therefore, it is crucial to
elucidate the molecular pathogenesis of HCC. Following the
prediction of potential target genes, functional and signaling
pathway analyses were conducted. Additionally, enriched GO term,
KEGG pathway and PANTHER pathway analyses of miR-124-3p target
genes were performed. The results revealed that the predicted
target genes of miR-124-3p involved 396 GO terms. The top-ranking
terms all exhibited a large number of gene clusters, particularly
in BP terms. KEGG pathway enrichment analysis demonstrated that the
predicted target genes of miR-124-3p were concentrated in 41
signaling pathways, and the top ten signaling pathways were
involved in the occurrence and development of several types of
cancer. PANTHER pathway analysis indicated that the predicted
target genes of miR-124-3p were concentrated in 14 terms, which
were all involved in various molecular signaling pathways.
Therefore, taken together with the results of previous studies,
these observations suggested that miR-124-3p may target multiple
genes and may function spatiotemporally or in combination with
several diverse processes. For example, among the 14 terms of the
PANTHER pathway, ‘Angiogenesis’, ‘EGF receptor signaling pathway’,
‘FGF signaling pathway’, ‘VEGF signaling pathway’ and ‘PDGF
signaling pathway’ are all involved in angiogenesis. However, other
target genes involved in ‘B cell activation’, ‘Toll receptor
signaling pathway’ and ‘T cell activation’ indicated that
immunological mechanisms may be the other factor that affected the
genesis and the development of HCC. In addition, ‘Ras pathway’,
‘Apoptosis signaling pathway’ and ‘P53 pathway’ have also been
predicted. Further research on the mechanisms of above pathway may
be beneficial in the development of novel therapeutic agents
against HCC.
In conclusion, it was confirmed that miR-124-3p was
downregulated in HCC. Assessing the overlaps in GEO data,
miR-124-3p predicted target genes and NLP, 132 reliable potential
target genes of miR-124-3p were identified that may serve key
functions in HCC. The pathway analysis results suggested that the
functional characterization of the identified miR-124-3p targets
will offer novel insight into the underlying molecular mechanisms
that occur in HCC. Given the complexity of molecular pathway
involvement, the mechanism of hepatocarcinogenesis requires further
study with powerful analysis tools, as well as through the study of
in vitro and in vivo models. The identified
miR-124-3p target genes have the potential to be employed as
innovative prognosticators and/or therapeutic targets for HCC.
Competing interests
The authors declare that they have no competing
interests.
References
|
1
|
Huang DH, Wang GY, Zhang JW, Li Y, Zeng XC
and Jiang N: MiR-501-5p regulates CYLD expression and promotes cell
proliferation in human hepatocellular carcinoma. Jpn J Clin Oncol.
45:738–744. 2015. View Article : Google Scholar : PubMed/NCBI
|
|
2
|
Lu Y, Yue X, Cui Y, Zhang J and Wang K:
MicroRNA-124 suppresses growth of human hepatocellular carcinoma by
targeting STAT3. Biochem Biophys Res Commun. 441:873–879. 2013.
View Article : Google Scholar : PubMed/NCBI
|
|
3
|
Otsuka M, Kishikawa T, Yoshikawa T,
Yamagami M, Ohno M, Takata A, Shibata C, Ishibashi R and Koike K:
MicroRNAs and liver disease. J Hum Genet. 62:75–80. 2017.
View Article : Google Scholar : PubMed/NCBI
|
|
4
|
Huang Y, Shen XJ, Zou Q, Wang SP, Tang SM
and Zhang GZ: Biological functions of microRNAs: A review. J
Physiol Biochem. 67:129–139. 2011. View Article : Google Scholar : PubMed/NCBI
|
|
5
|
Torre LA, Bray F, Siegel RL, Ferlay J,
Lortet-Tieulent J and Jemal A: Global cancer statistics, 2012. CA
Cancer J Clin. 65:87–108. 2015. View Article : Google Scholar : PubMed/NCBI
|
|
6
|
Bosch FX, Ribes J, Diaz M and Cleries R:
Primary liver cancer: Worldwide incidence and trends.
Gastroenterology. 127 5 Suppl 1:S5–S16. 2004. View Article : Google Scholar : PubMed/NCBI
|
|
7
|
Sherman M: Hepatocellular carcinoma:
Epidemiology, surveillance, and diagnosis. Semin Liver Dis.
30:3–16. 2010. View Article : Google Scholar : PubMed/NCBI
|
|
8
|
Shangguan H, Tan SY and Zhang JR:
Bioinformatics analysis of gene expression profiles in
hepatocellular carcinoma. Eur Rev Med Pharmacol Sci. 19:2054–2061.
2015.PubMed/NCBI
|
|
9
|
Huang S and He X: The role of microRNAs in
liver cancer progression. Br J Cancer. 104:235–240. 2011.
View Article : Google Scholar : PubMed/NCBI
|
|
10
|
Lang Q and Ling C: MiR-124 suppresses cell
proliferation in hepatocellular carcinoma by targeting PIK3CA.
Biochem Biophys Res Commun. 426:247–252. 2012. View Article : Google Scholar : PubMed/NCBI
|
|
11
|
Furuta M, Kozaki KI, Tanaka S, Arii S,
Imoto I and Inazawa J: miR-124 and miR-203 are epigenetically
silenced tumor-suppressive microRNAs in hepatocellular carcinoma.
Carcinogenesis. 31:766–776. 2010. View Article : Google Scholar : PubMed/NCBI
|
|
12
|
World Health Organization (WHO), . WHO
Handbook for Reporting Results of Cancer Treatment. WHO; Geneva:
1979
|
|
13
|
Rong M, He R, Dang Y and Chen G:
Expression and clinicopathological significance of miR-146a in
hepatocellular carcinoma tissues. Ups J Med Sci. 119:19–24. 2014.
View Article : Google Scholar : PubMed/NCBI
|
|
14
|
Rong M, Chen G and Dang Y: Increased
miR-221 expression in hepatocellular carcinoma tissues and its role
in enhancing cell growth and inhibiting apoptosis in vitro. BMC
Cancer. 13:212013. View Article : Google Scholar : PubMed/NCBI
|
|
15
|
Chen G, Umelo IA, Lv S, Teugels E, Fostier
K, Kronenberger P, Dewaele A, Sadones J, Geers C and De Grève J:
miR-146a inhibits cell growth, cell migration and induces apoptosis
in non-small cell lung cancer cells. PLoS One. 8:e603172013.
View Article : Google Scholar : PubMed/NCBI
|
|
16
|
Liu Y, Ren F, Luo Y, Rong M, Chen G and
Dang Y: Down-regulation of miR-193a-3p dictates deterioration of
HCC: A clinical real-time qRT-PCR study. Med Sci Monit.
21:2352–2360. 2015. View Article : Google Scholar : PubMed/NCBI
|
|
17
|
Livak KJ and Schmittgen TD: Analysis of
relative gene expression data using real-time quantitative PCR and
the 2(-Delta Delta C(T)) method. Methods. 25:402–408. 2001.
View Article : Google Scholar : PubMed/NCBI
|
|
18
|
Egger M, Smith GD and Altman DG:
Systematic Reviews in Health Care. Meta-analysis in Context. 2nd.
BMJ Publishing Group; London: 2001, View Article : Google Scholar
|
|
19
|
Murakami Y, Kubo S, Tamori A, Itami S,
Kawamura E, Iwaisako K, Ikeda K, Kawada N, Ochiya T and Taguchi YH:
Comprehensive analysis of transcriptome and metabolome analysis in
Intrahepatic Cholangiocarcinoma and Hepatocellular Carcinoma. Sci
Rep. 5:162942015. View Article : Google Scholar : PubMed/NCBI
|
|
20
|
Diaz G, Melis M, Tice A, Kleiner DE,
Mishra L, Zamboni F and Farci P: Identification of microRNAs
specifically expressed in hepatitis C virus-associated
hepatocellular carcinoma. Int J Cancer. 133:816–824. 2013.
View Article : Google Scholar : PubMed/NCBI
|
|
21
|
Sato F, Hatano E, Kitamura K, Myomoto A,
Fujiwara T, Takizawa S, Tsuchiya S, Tsujimoto G, Uemoto S and
Shimizu K: MicroRNA profile predicts recurrence after resection in
patients with hepatocellular carcinoma within the Milan criteria.
PLoS One. 6:e164352011. View Article : Google Scholar : PubMed/NCBI
|
|
22
|
He XX, Chang Y, Meng FY, Wang MY, Xie QH,
Tang F, Li PY, Song YH and Lin JS: MicroRNA-375 targets AEG-1 in
hepatocellular carcinoma and suppresses liver cancer cell growth in
vitro and in vivo. Oncogene. 31:3357–3369. 2012. View Article : Google Scholar : PubMed/NCBI
|
|
23
|
Su H, Yang JR, Xu T, Huang J, Xu L, Yuan Y
and Zhuang SM: MicroRNA-101, down-regulated in hepatocellular
carcinoma, promotes apoptosis and suppresses tumorigenicity. Cancer
Res. 69:1135–1142. 2009. View Article : Google Scholar : PubMed/NCBI
|
|
24
|
Wang PR, Xu M, Toffanin S, Li Y, Llovet JM
and Russell DW: Induction of hepatocellular carcinoma by in vivo
gene targeting. Proc Natl Acad Sci USA. 109:pp. 11264–11269. 2012;
View Article : Google Scholar : PubMed/NCBI
|
|
25
|
Wang X and Wang X: Systematic
identification of microRNA functions by combining target prediction
and expression profiling. Nucleic Acids Res. 34:1646–1652. 2006.
View Article : Google Scholar : PubMed/NCBI
|
|
26
|
Dweep H and Gretz N: miRWalk2.0: A
comprehensive atlas of microRNA-target interactions. Nat Methods.
12:6972015. View Article : Google Scholar : PubMed/NCBI
|
|
27
|
Chang EK, Yu CY, Clarke R, Hackbarth A,
Sanders T, Esrailian E, Hommes DW and Runyon BA: Defining a patient
population with cirrhosis: An automated algorithm with natural
language processing. J Clin Gastroenterol. 50:889–894. 2016.
View Article : Google Scholar : PubMed/NCBI
|
|
28
|
Alsawas M, Alahdab F, Asi N, Li DC, Wang Z
and Murad MH: Natural language processing: Use in EBM and a guide
for appraisal. Evid Based Med. 21:136–138. 2016. View Article : Google Scholar : PubMed/NCBI
|
|
29
|
Zhang X, Tang W, Chen G, Ren F, Liang H,
Dang Y and Rong M: An encapsulation of gene signatures for
hepatocellular carcinoma, microRNA-132 predicted target genes and
the corresponding overlaps. PLoS One. 11:e01594982016. View Article : Google Scholar : PubMed/NCBI
|
|
30
|
Huang WT, Wang HL, Yang H, Ren FH, Luo YH,
Huang CQ, Liang YY, Liang HW, Chen G and Dang YW: Lower expressed
miR-198 and its potential targets in hepatocellular carcinoma: A
clinicopathological and in silico study. Onco Targets Ther.
9:5163–5180. 2016. View Article : Google Scholar : PubMed/NCBI
|
|
31
|
Liese J, Peveling-Oberhag J, Doering C,
Schnitzbauer AA, Herrmann E, Zangos S, Hansmann ML, Moench C,
Welker MW, Zeuzem S, et al: A possible role of microRNAs as
predictive markers for the recurrence of hepatocellular carcinoma
after liver transplantation. Transpl Int. 29:369–380. 2016.
View Article : Google Scholar : PubMed/NCBI
|
|
32
|
Ito K and Murphy D: Application of ggplot2
to Pharmacometric Graphics. CPT Pharmacometrics Syst Pharmacol.
2:e792013. View Article : Google Scholar : PubMed/NCBI
|
|
33
|
Xu C, Zeng Q, Xu W, Jiao L, Chen Y, Zhang
Z, Wu C, Jin T, Pan A, Wei R, et al: miRNA-100 inhibits human
bladder urothelial carcinogenesis by directly targeting mTOR. Mol
Cancer Ther. 12:207–219. 2013. View Article : Google Scholar : PubMed/NCBI
|
|
34
|
Ma Y, Han W, Yang L, He L and Wang H: The
regulation of miRNAs in inflammation-related carcinogenesis. Curr
Pharm Des. 21:3023–3031. 2015. View Article : Google Scholar : PubMed/NCBI
|
|
35
|
Wan X, Ding X, Chen S, Song H, Jiang H,
Fang Y, Li P and Guo J: The functional sites of miRNAs and lncRNAs
in gastric carcinogenesis. Tumour Biol. 36:521–532. 2015.
View Article : Google Scholar : PubMed/NCBI
|
|
36
|
Xu L, Dai W, Li J, He LI, Wang F, Xia Y,
Chen K, Li S, Liu T, Lu J, et al: Methylation-regulated miR-124-1
suppresses tumorigenesis in hepatocellular carcinoma by targeting
CASC3. Oncotarget. 7:26027–26041. 2016.PubMed/NCBI
|
|
37
|
Zheng F, Liao YJ, Cai MY, Liu YH, Liu TH,
Chen SP, Bian XW, Guan XY, Lin MC, Zeng YX, et al: The putative
tumour suppressor microRNA-124 modulates hepatocellular carcinoma
cell aggressiveness by repressing ROCK2 and EZH2. Gut. 61:278–289.
2012. View Article : Google Scholar : PubMed/NCBI
|
|
38
|
Shi XB, Xue L, Ma AH, Tepper CG,
Gandour-Edwards R, Kung HJ and deVere White RW: Tumor suppressive
miR-124 targets androgen receptor and inhibits proliferation of
prostate cancer cells. Oncogene. 32:4130–4138. 2013. View Article : Google Scholar : PubMed/NCBI
|
|
39
|
Lv XB, Jiao Y, Qing Y, Hu H, Cui X, Lin T,
Song E and Yu F: miR-124 suppresses multiple steps of breast cancer
metastasis by targeting a cohort of pro-metastatic genes in vitro.
Chin J Cancer. 30:821–830. 2011. View Article : Google Scholar : PubMed/NCBI
|
|
40
|
Li H, Xie S, Liu M, Chen Z, Liu X, Wang L,
Li D and Zhou Y: The clinical significance of downregulation of
mir-124-3p, mir-146a-5p, mir-155-5p and mir-335-5p in gastric
cancer tumorigenesis. Int J Oncol. 45:197–208. 2014. View Article : Google Scholar : PubMed/NCBI
|
|
41
|
Wang P, Chen L, Zhang J, Chen H, Fan J,
Wang K, Luo J, Chen Z, Meng Z and Liu L: Methylation-mediated
silencing of the miR-124 genes facilitates pancreatic cancer
progression and metastasis by targeting Rac1. Oncogene. 33:514–524.
2014. View Article : Google Scholar : PubMed/NCBI
|
|
42
|
Zhao W, Cheng Y, Zhang C, You Q, Shen X,
Guo W and Jiao Y: Genome-wide identification and characterization
of circular RNAs by high throughput sequencing in soybean. Sci Rep.
7:56362017. View Article : Google Scholar : PubMed/NCBI
|
|
43
|
Becker HF, Heliou A, Djaout K, Lestini R,
Regnier M and Myllykallio H: High-throughput sequencing reveals
circular substrates for an archaeal RNA ligase. RNA Biology.
14:1075–1085. 2017. View Article : Google Scholar : PubMed/NCBI
|
|
44
|
Nair AA, Niu N, Tang X, Thompson KJ, Wang
L, Kocher JP, Subramanian S and Kalari KR: Circular RNAs and their
associations with breast cancer subtypes. Oncotarget.
7:80967–80979. 2016. View Article : Google Scholar : PubMed/NCBI
|
|
45
|
Wang X, Zhang Y, Huang L, Zhang J, Pan F,
Li B, Yan Y, Jia B, Liu H, Li S and Zheng W: Decreased expression
of hsa_circ_001988 in colorectal cancer and its clinical
significances. Int J Clin Exp Pathol. 8:16020–16025.
2015.PubMed/NCBI
|
|
46
|
Li P, Chen S, Chen H, Mo X, Li T, Shao Y,
Xiao B and Guo J: Using circular RNA as a novel type of biomarker
in the screening of gastric cancer. Clin Chim Acta. 444:132–136.
2015. View Article : Google Scholar : PubMed/NCBI
|
|
47
|
Shang X, Li G, Liu H, Li T, Liu J, Zhao Q
and Wang C: Comprehensive circular RNA profiling reveals that
hsa_circ_0005075, a new circular RNA biomarker, is involved in
hepatocellular crcinoma development. Medicine (Baltimore).
95:e38112016. View Article : Google Scholar : PubMed/NCBI
|
|
48
|
Qin M, Liu G, Huo X, Tao X, Sun X, Ge Z,
Yang J, Fan J, Liu L and Qin W: Hsa_circ_0001649: A circular RNA
and potential novel biomarker for hepatocellular carcinoma. Cancer
Biomark. 16:161–169. 2016. View Article : Google Scholar : PubMed/NCBI
|
|
49
|
Xu L, Zhang M, Zheng X, Yi P, Lan C and Xu
M: The circular RNA ciRS-7 (Cdr1as) acts as a risk factor of
hepatic microvascular invasion in hepatocellular carcinoma. J
Cancer Res Clin Oncol. 143:17–27. 2017. View Article : Google Scholar : PubMed/NCBI
|
|
50
|
Zheng Q, Bao C, Guo W, Li S, Chen J, Chen
B, Luo Y, Lyu D, Li Y, Shi G, et al: Circular RNA profiling reveals
an abundant circHIPK3 that regulates cell growth by sponging
multiple miRNAs. Nat Commun. 7:112152016. View Article : Google Scholar : PubMed/NCBI
|
|
51
|
Gong XL and Qin SK: Progress in systemic
therapy of advanced hepatocellular carcinoma. World J
Gastroenterol. 22:6582–6594. 2016. View Article : Google Scholar : PubMed/NCBI
|