Introduction
Neuroendocrine neoplasms (NENs) are derived from
neuroendocrine cells throughout the human body, and the
gastroenteropancreatic tract and lung are two main sites of this
disease (1). Pancreatic NENs (pNENs)
are a subtype of gastroenteropancreatic NENs (2). pNENs are rare tumors accounting for only
1–2% of all pancreatic tumors. However, the morbidity has increased
substantially in the last four decades (from 1.09 to 5.25 per
100,000 individuals between 1973 and 2004) (1,3). In 2017,
the updated WHO classification for pNENs divided NENs into G1, G2,
G3 neuroendocrine tumor (NET) and neuroendocrine carcinoma (NEC)
based on the histological differentiation, including the Ki-67
proliferation index and the mitotic rate (4). One of the most important aspects to
tailor the optimal treatment for the pNENs patients is tumor
grading. Patients with well-differentiated pNENs are usually
managed with treatment with somatostatin analogues and further
treatment such as surgery or peptide receptor radionuclide therapy
(PRRT) can be considered (5,6). Patients with poorly differentiated NEC
should be referred to the oncology department with no delay
(7–9).
Although G1 and G2 NET are generally treated as the same entity,
there are some differences to the treatment strategies of the two
in clinical practice. So, an accurate preoperative assessment of
grading is a prerequisite for individually tailored lesion
therapies and prediction of patient outcomes. The current grading
system is based on post-surgery or biopsy pathology, which is
time-delayed and invasive. At present, sporadic reports about the
preoperative grading of pNENs using CT and magnetic resonance (MR)
can be found (10–12), but they were almost retrospective and
based on morphology research. Meanwhile their observation points
covered many aspects, including lesion morphology, border, size,
bile duct dilatation, vascular invasion, signal intensity, and
enhancement ratio, which was multifarious and inconvenient in
application.
Dynamic contrast-enhanced MR imaging (DCE-MRI),
which allows in vivo imaging of the physiology of the
microcirculation, provides information related to the vascularity
(13,14). By using appropriate pharmacokinetic
model, DCE-MRI can generate a series of quantitative parameters,
such as volume transfer constant (Ktrans),
contrast transfer rate constant (kep),
extravascular extracellular space (EES) volume fraction
(ve) and plasma volume fraction (vp). It has
been demonstrated that these quantitative parameters can provide
valuable information in clinical including characterization of
cancers, guidance for treatment planning, early prediction of
treatment responses and evaluation of treatment outcomes (15–22).
However, to our best knowledge, no study has been done to
investigate the DCE-MRI pharmacokinetic parameters and its value in
grading of pNENs. Thus, the purpose of this study was to evaluate
the quantitative DCE-MRI pharmacokinetic parameters in pNENs and
their role in pNENs grading.
Materials and methods
Patient population
Ethical approval was obtained for this prospective
research from the Ethics Committee Board and the informed consent
was obtained from all participants before collecting information.
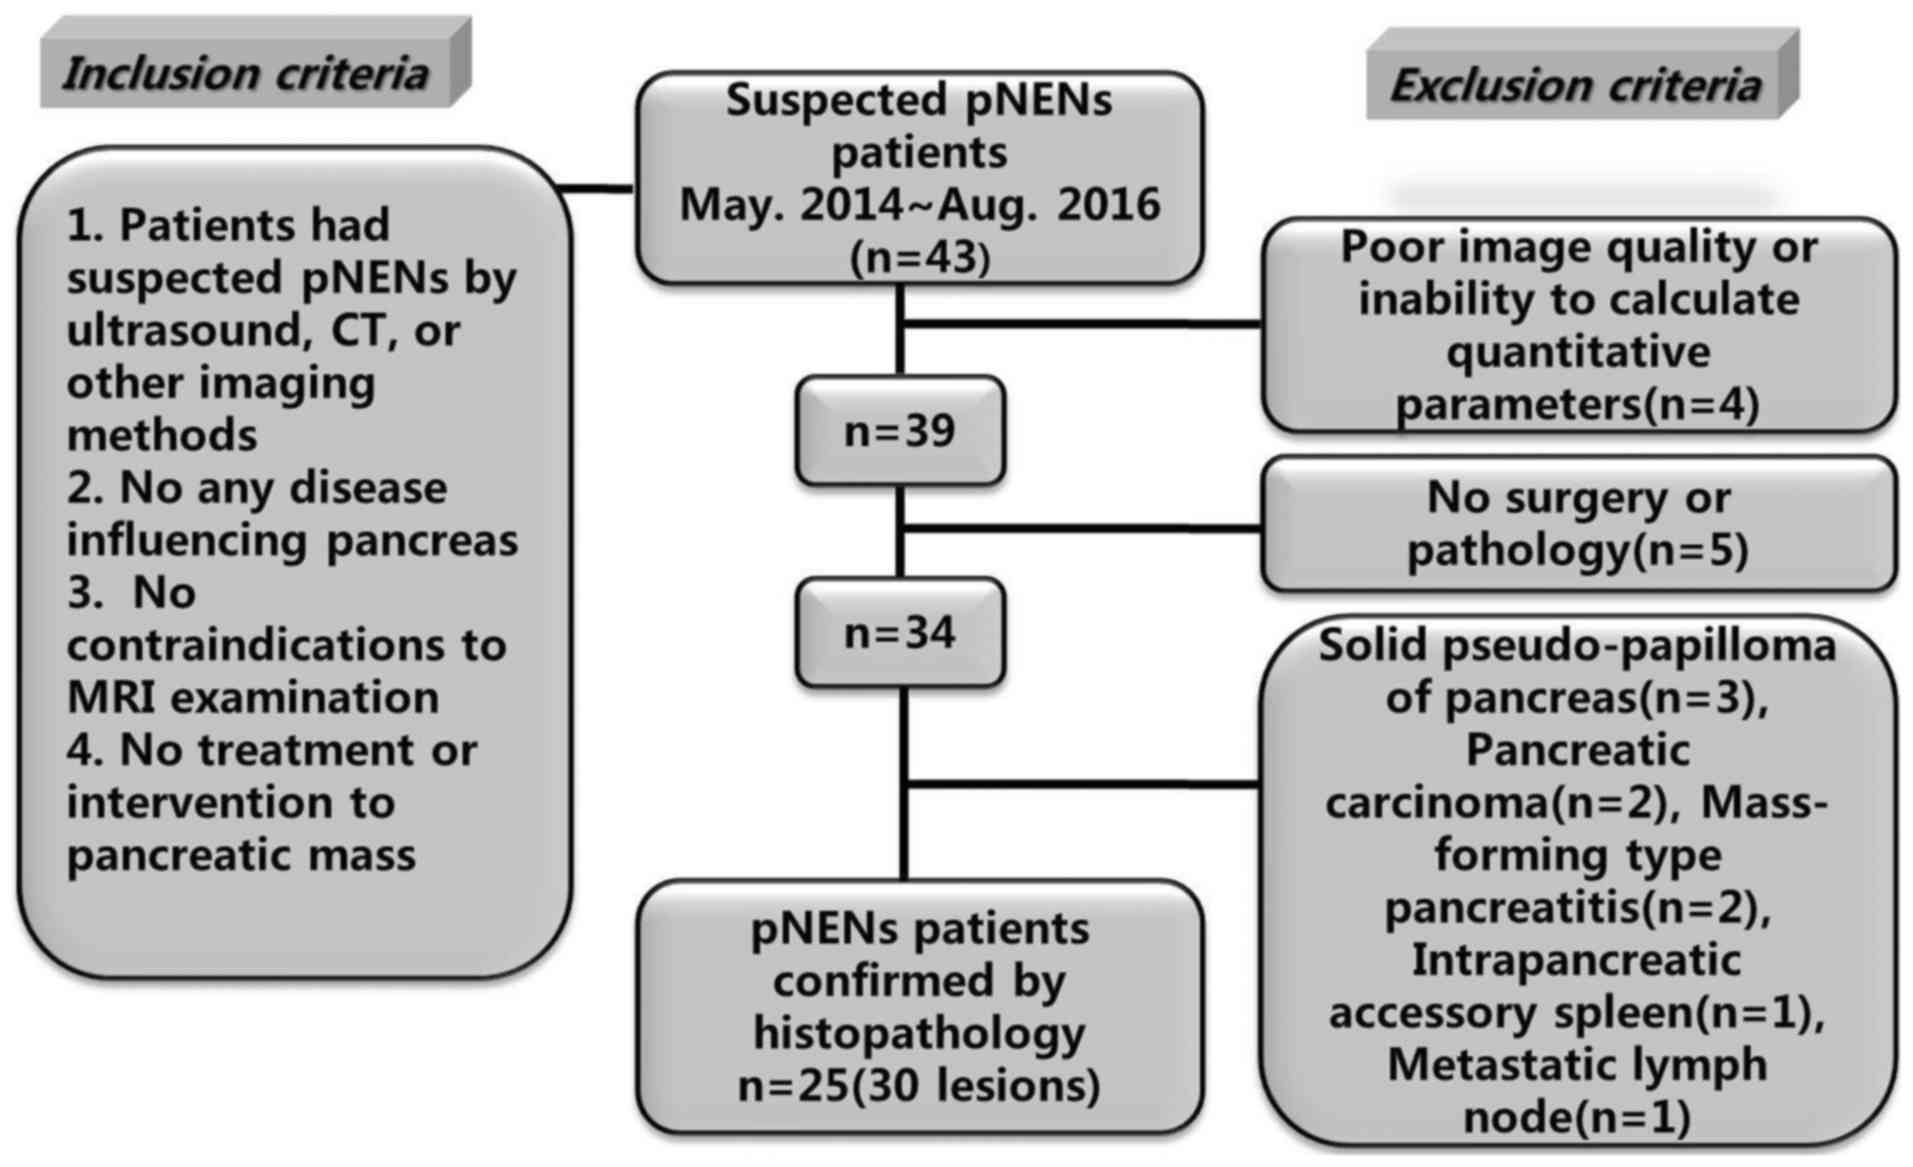
From May 2014 to August 2016, 43 patients with suspected pNENs were
referred from the Endocrine Department and the Department of
Hepatobiliary Surgery in our hospital. For inclusion, the
candidates should have documentation of eligibility criteria
including: Suspected pNENs by ultrasound, CT or other imaging
methods; no any disease influencing pancreas; no contraindications
to raceanisodamine hydrochloride injection and MRI examination; and
no treatment or intervention to pancreatic mass. Among 43 patients,
18 were excluded due to various reasons. Finally, 25 pNENs patients
(30 lesions) confirmed by histopathology were included. The case
accrual process was summarized in Fig.
1.
MRI protocol
Prior to scanning, patients were requested to fast
at least 4 h. Then, 10 mg anisodamine (Raceanisodamine
Hydrochloride Injection; Minsheng Pharmaceutical Co., Hangzhou,
China) was injected intramuscularly 10 min before examination. MR
images of the pancreases were acquired in our institution on a
whole body 3.0 T MR scanner (Discovery MR750; GE Medical Systems,
Chicago, IL, USA) with an eight-channel phased-array Torso coil
positioned on the superior abdomen. Using variable flip angle T1
mapping, pre-contrast three-dimensional spoiled gradient recalled
echo sequence series were performed with flip angles of 3°, 6°, 9°
and 12°. The other imaging parameters of T1 mapping were set as
follows: Repetition time (TR)=3.2 msec, echo time (TE)=1.5 msec,
slices number=60, slice thickness=4 mm, matrix=260×160, field of
view (FOV)=360×360 mm2. Then, DCE-MRI scans were
performed by a three-dimensional fast spoiled gradient recalled
echo sequence with the following parameters: TR=3.2 msec, TE=1.5
msec, flip angle=12°, FOV=360×360 mm2, matrix=260×160,
slice thickness=4 mm, slice number=60, bandwidth was 83.33
Hz/pixel. It took 320 sec to complete the DCE-MRI scanning with 40
phases acquired and 8 sec for each phase. Three pre-contrast phases
were obtained before bolus injection, then an administration of 0.1
mmol/kg of Gd-DTPA (Omniscan; GE Healthcare Co., Ltd., Shanghai,
China) was performed with a venous cannula at a rate of 2 ml/sec
followed by a 20 ml saline flush.
Data manipulation
Two abdominal radiologists, each with more than
8-year experience in clinical MRI, evaluated the acquired images
and determined the placement of regions of interest (ROIs). Another
experienced radiologist with more than 20 years of experience
reviewed the images and made the decision in consensus when the
former 2 observers had differences in reading images.
All the DCE-MRI images were transmitted to a
workstation for quantitative analysis using DCE-MRI software
package (Omni Kinetics, Version 2.00; GE Healthcare Co., Ltd.).
First, The DCE-MRI images were post processed by Markov random
fields (MRF) 3D non rigid registration algorithms to correct for
patient motion that occurs between acquired phases of the dynamic
data due to respiration and other involuntary movements. Second,
the individual arterial input function (AIF) was obtained from a
ROI in abdominal aorta. Third, identical ROIs were manually drawn
on corresponding pancreatic lesions and tumor-free areas
respectively. The distance of the two ROIs was at least 2 cm. ROIs
were drawn manually over the entire lesion on multiple slices
without reaching the perimeter to avoid partial volume effect,
necrosis, cystic area and vessel. Finally, Extended Tofts Linear
model (23,24) was used to calculate the quantitative
parameters: Ktrans, kep,
ve and vp. The mean of each parameter in the
ROIs was used for statistical analysis.
Histopathological analysis and
grouping
The resected specimens were sent to the Department
of Pathology in our hospital for further analysis. All lesions were
divided into 3 groups based on Ki-67 proliferation index and
mitotic rate according to 2017 WHO Neuroendocrine Tumor
Classification Guideline (4). i) G1
NET group: Mitoses Per 10 high-power field (HPF) was <2 and
Ki-67 Index was <3%; ii) G2 NET group: Mitoses Per 10 HPF was
2–20 and/or Ki-67 Index was 3–20%; and iii) G3 NET/NEC group:
Mitoses Per 10 HPF was >20 and/or Ki-67 Index was >20%.
Meanwhile, tumor-free areas with the same ROI size but staying away
from the lesions at least 2 cm were selected as tumor-free group
(normal control group).
Statistical analysis
All statistical analyses were carried out using SPSS
software Version 19.0 (SPSS, Inc., Chicago, IL, USA) and MedCalc
software Version 12.3.0.0 (MedCalc Software,. Ostend, Belgium).
Data from tumor-free areas, G1 and G2 NET were compared using
one-way analysis of variance (ANOVA). Multiple comparison between
the groups was performed using LSD method. To find the optimal
cut-off levels of DCE parameters to distinguish pNENs grading, the
sensitivity and specificity of Ktrans and
kep cut-off values were calculated. Receiver
operator characteristics (ROC) analysis was conducted to evaluate
the diagnostic ability and assess the appropriate threshold values
of Ktrans and kep. P<0.05
was considered to indicate a statistically significant
difference.
Results
Clinical and pathological
characteristics of patients and lesions
The clinical and pathological characteristics of
patients and lesions are summarized in Table I. In the final cohort, 25 patients
were enrolled in this study (mean age 48.3 years, range 24–68
years; 11 males with a mean age of 50.9 years and age range of
33–68 years; 14 females with a mean age of 45.7 years and age range
of 26–54 years). There were 22 patients with a single lesion, 3
patients with multiple lesions. The total number of lesions were
30. The maximum in-plane diameter of these lesions ranged from 0.8
to 5.4 cm. The lesions were located in different regions: Head of
pancreas (n=12), neck of pancreas (n=5), body of pancreas (n=7),
tail of pancreas (n=6). The grades of lesions were as follows: G1
lesions (n=16), G2 lesions (n=13), G3 lesions (n=1). G1, G2 and G3
lesions were classified as G1, G2 NET and G3 NET/NEC groups,
respectively. According to the 2017 WHO classification of pNENs
(4), lesion which is well
differentiated morphology, mitotic index >20, and/or ki-67 index
>20% belongs to G3 NET; lesion which is poor differentiated
morphology, mitotic index >20, and/or ki-67 index >20%
belongs to NEC. So we set lesions whose mitoses index >20 and/or
ki-67 index >20% into G3 NET/NEC group. There was one lesion in
G3 NET/NEC group. In fact, according to the pathology, one
well-differentiated G3 NET and zero NEC was in this group.
 | Table I.Clinical and pathological
characteristics of patients and lesions. |
Table I.
Clinical and pathological
characteristics of patients and lesions.
| Characteristic | No. of
patients | No. of lesions |
|---|
| Sex |
|
|
|
Male | 11 |
|
|
Female | 14 |
|
|
Single/multiple |
|
|
| Single
lesion | 22 |
|
|
Multiple lesions | 3 |
|
| All
lesions |
| 30 |
| Grading |
|
|
| G1
NET |
| 16 |
| G2
NET |
| 13 |
| G3
NET |
| 1 |
|
NEC |
| 0 |
| Site |
|
|
| Head of
pancreas |
| 12 |
| Neck of
pancreas |
| 5 |
| Body of
pancreas |
| 7 |
| Tail of
pancreas |
| 6 |
| Clinical
behaviour |
|
|
|
Functional pNENs |
| 19 |
|
Non-functional pNENs |
| 11 |
| Maximum diameter,
cm |
|
|
| ≤1 |
| 4 |
| >1
and ≤2 |
| 15 |
| >2
and ≤4 |
| 8 |
|
>4 |
| 3 |
| Heterogeneity |
|
|
|
Uniform |
| 12 |
|
Non-uniform |
| 18 |
| Pattern of
enhancement |
|
|
| Fast-in
and fast-out |
| 9 |
| Fast-in
and slow-out |
| 15 |
| Slow-in
and slow-out |
| 6 |
Comparison of DCE-MRI parameters
between pNENs grades
The mean (± SD) values of Ktrans,
kep, ve and vp for
tumor-free areas, G1 and G2 NET are presented in Table II. There was only one case in G3
NET/NEC group, so no statistical analysis was performed to this
group. Significant differences were found between tumor-free areas
and G1, G2 NET regarding Ktrans,
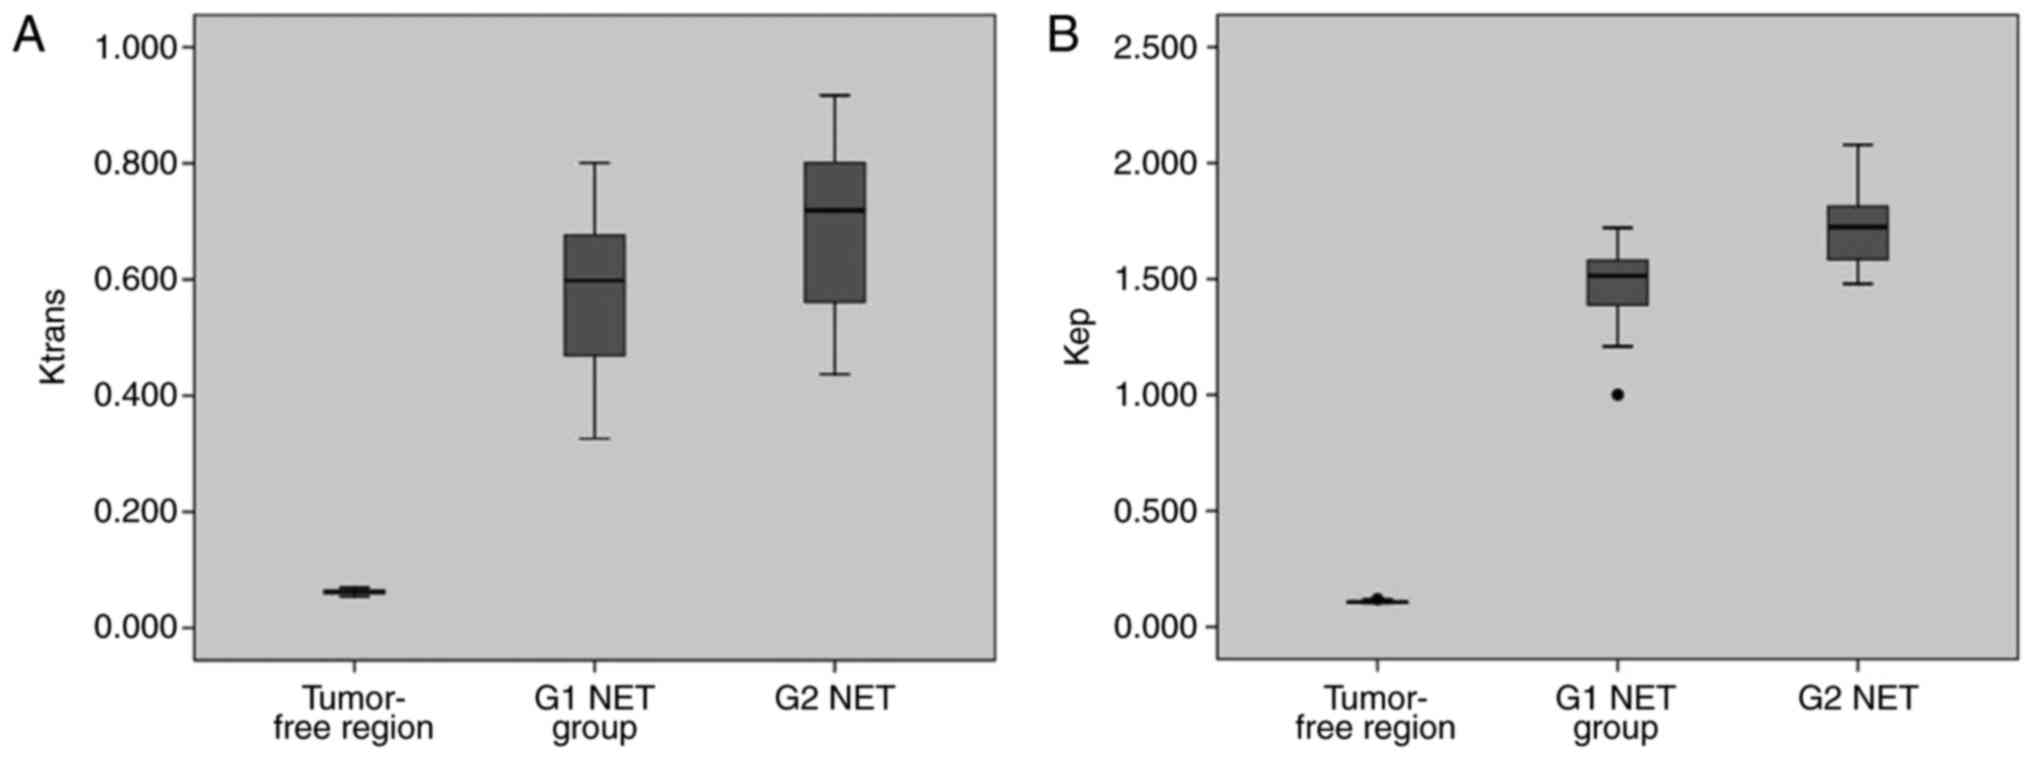
kep, ve and vp (Table II). The Ktrans,
kep and vp of tumor-free areas were
significantly lower than those of G1 and G2 NET. However, the
ve of tumor-free areas was significantly higher than
that of G1 and G2 NET. For the above comparisons, P-values were all
less than 0.001. The Ktrans and
kep of G1 NET were significantly lower than those
of G2 ones (P=0.002 and P<0.001, respectively; Table II and Fig.
2). No significant difference was found between G1 and G2 NET
for ve and vp (P=0.822 and P=0.419,
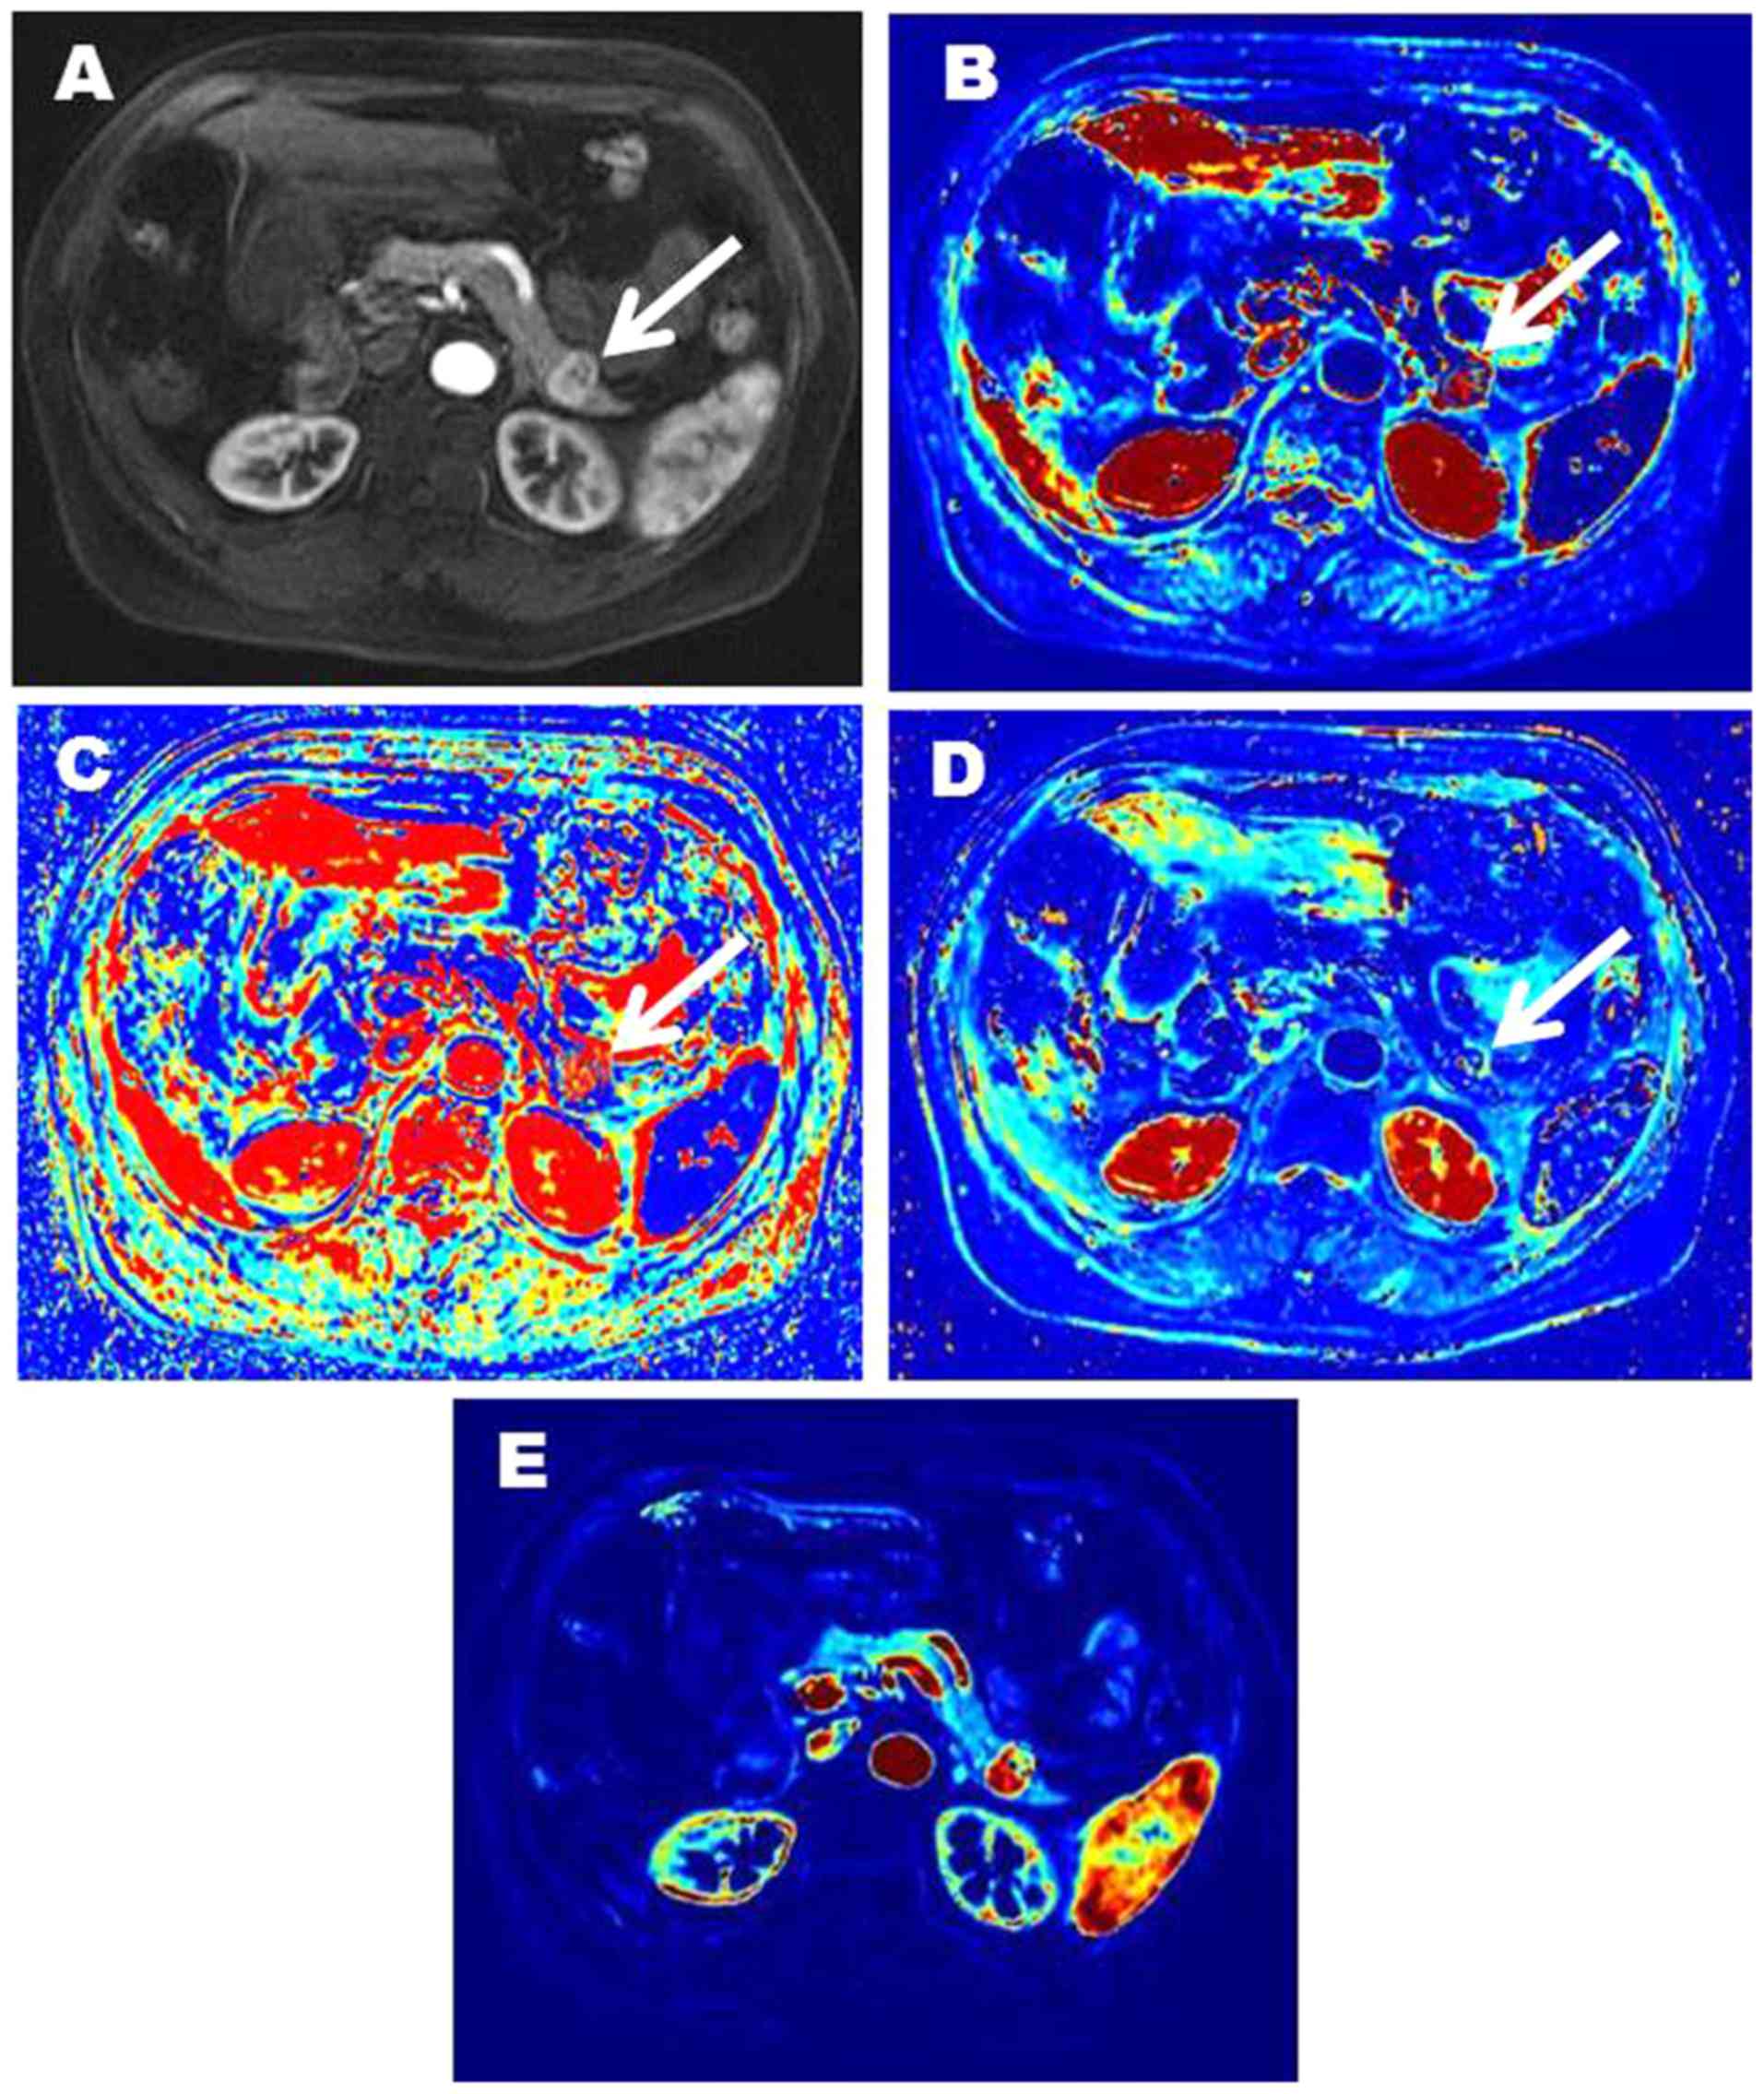
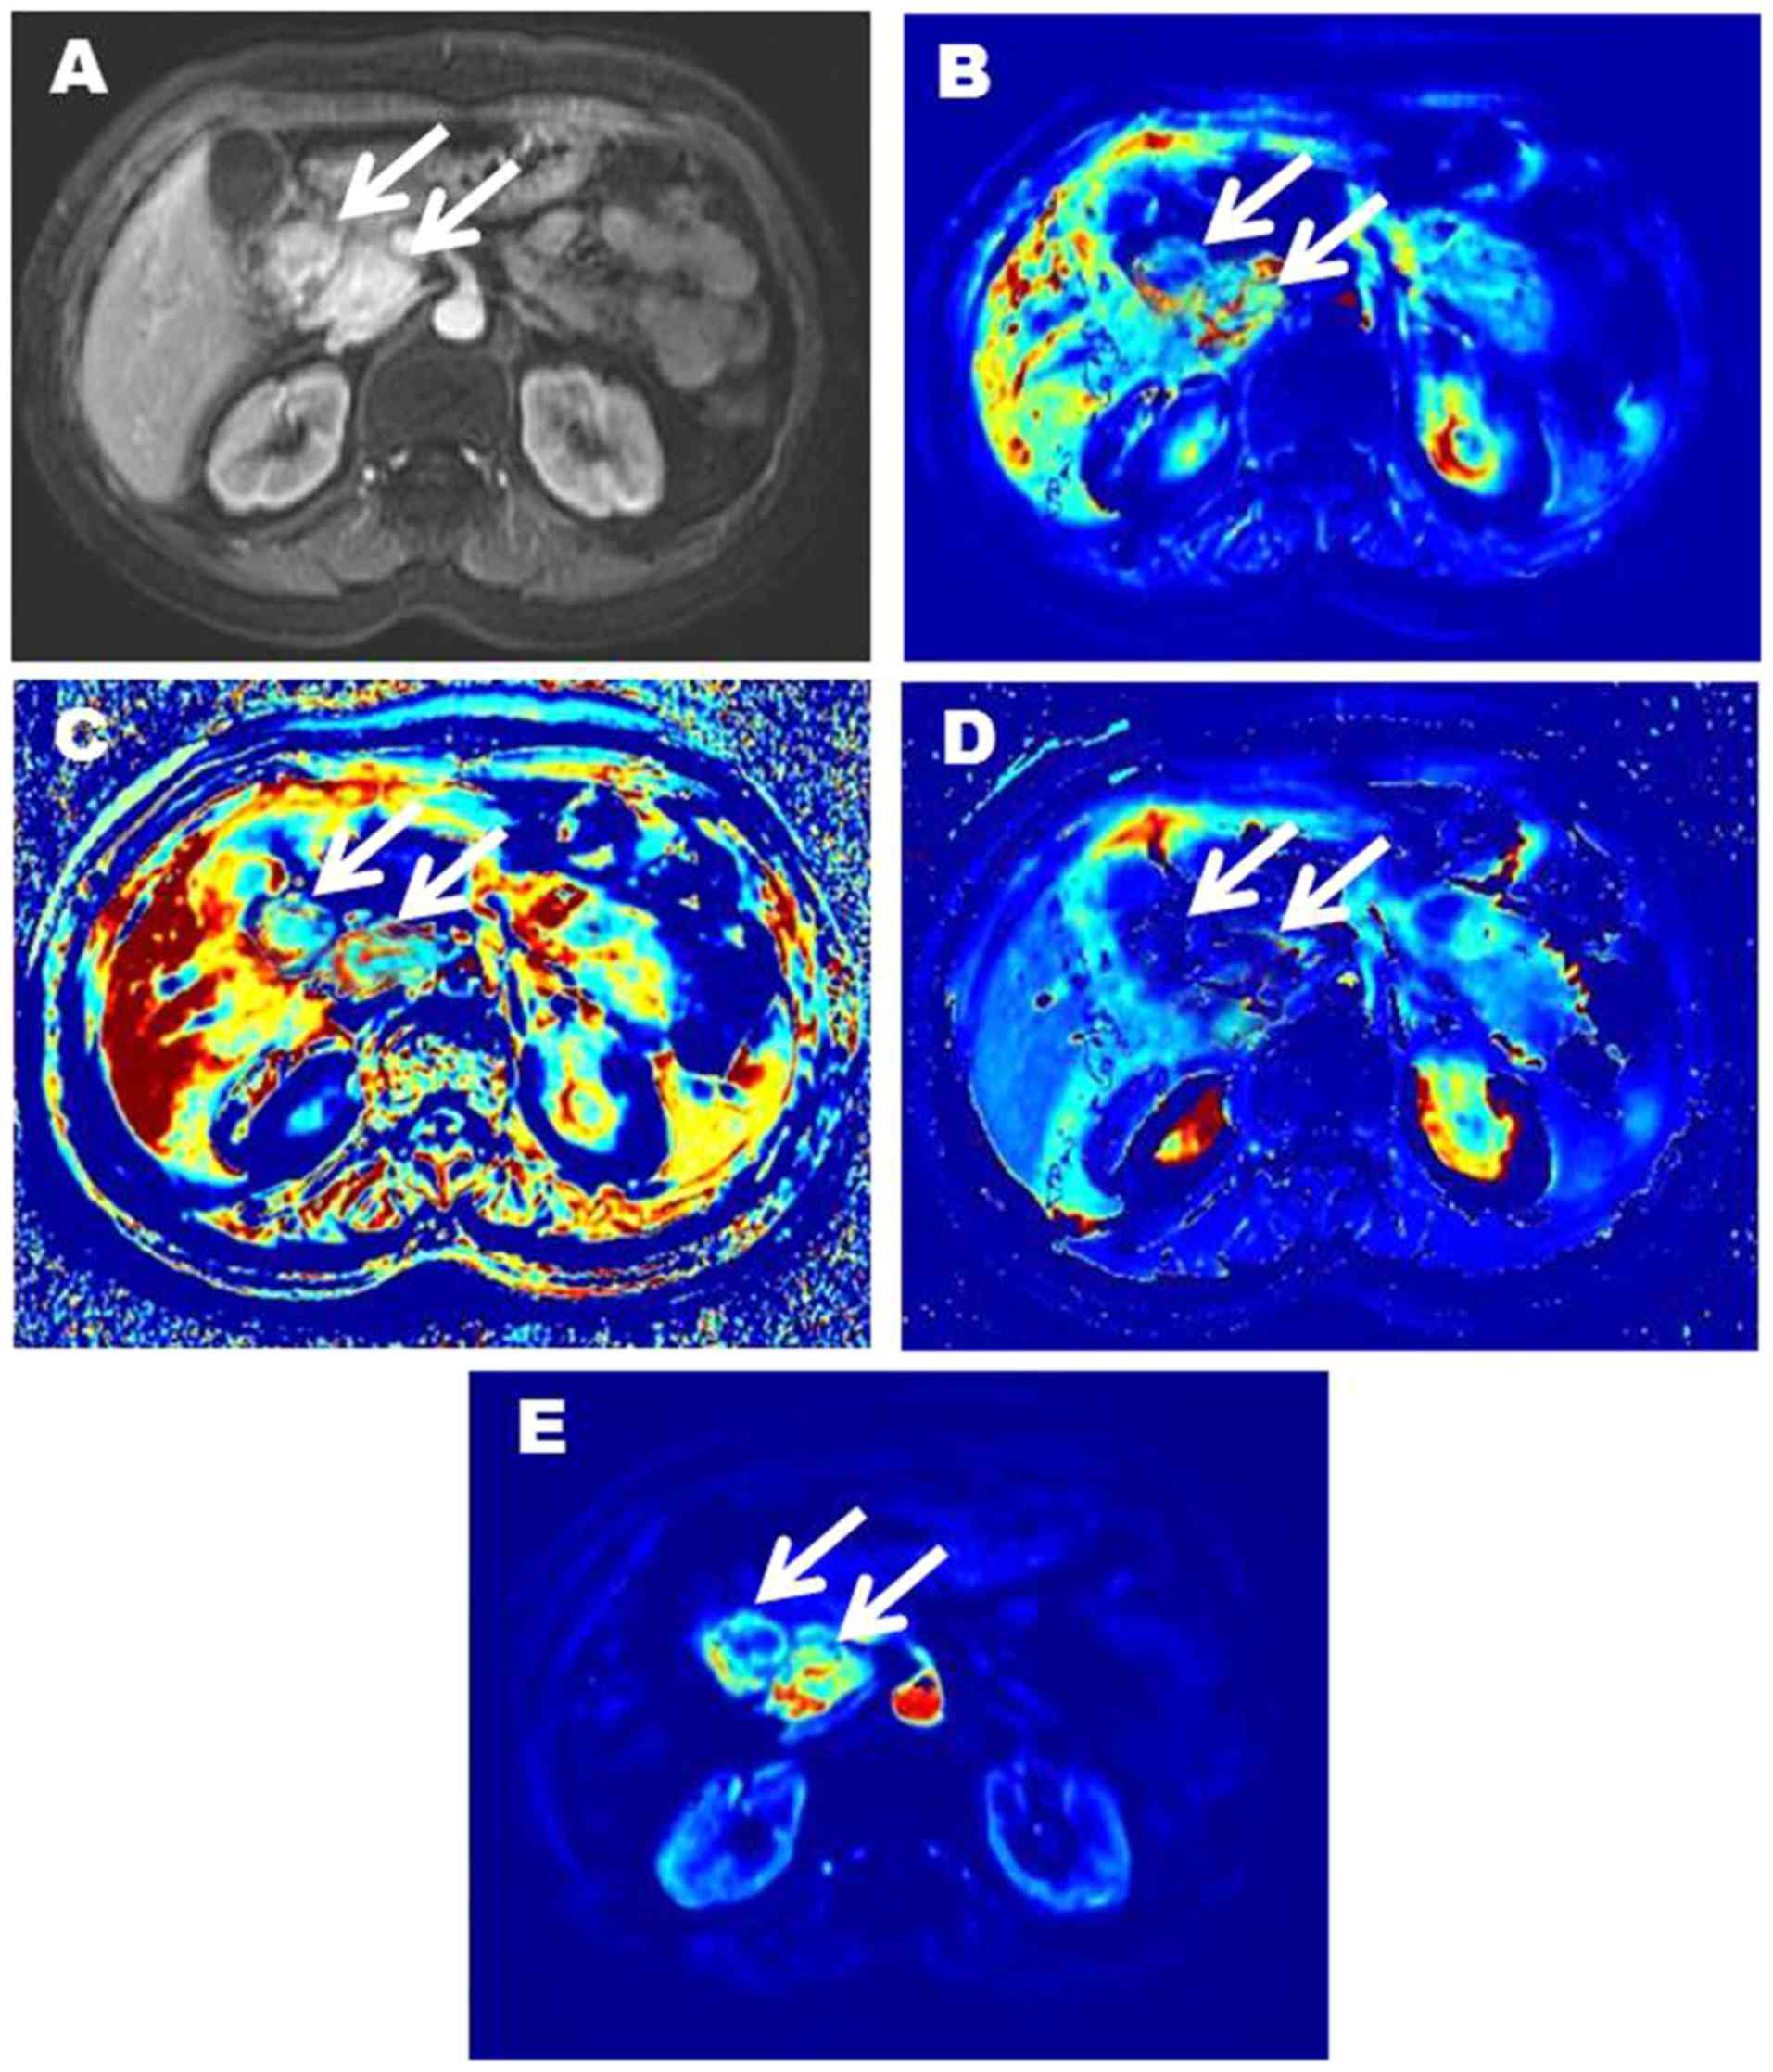
respectively). Representative images of two patients with pNENs
were showed in Figs. 3 and 4.
| Table II.Comparison of DCE-MRI parameters
between different groups. |
Table II.
Comparison of DCE-MRI parameters
between different groups.
| Parameter | Tumor-free | G1 NET | G2 NET | P-valuea |
P-valueb | P-valuec |
|---|
|
Ktrans (ml/min) | 0.062±0.004 | 0.571±0.143 | 0.696±0.155 | <0.001 | <0.001 | 0.002 |
|
kep (ml/min) | 0.108±0.005 | 1.464±0.193 | 1.726±0.176 | <0.001 | <0.001 | <0.001 |
| ve
(ml/ml) | 0.604±0.042 | 0.411±0.043 | 0.408±0.045 | <0.001 | <0.001 | 0.822 |
| vp
(ml/ml) | 0.247±0.041 | 0.439±0.075 | 0.456±0.087 | <0.001 | <0.001 | 0.419 |
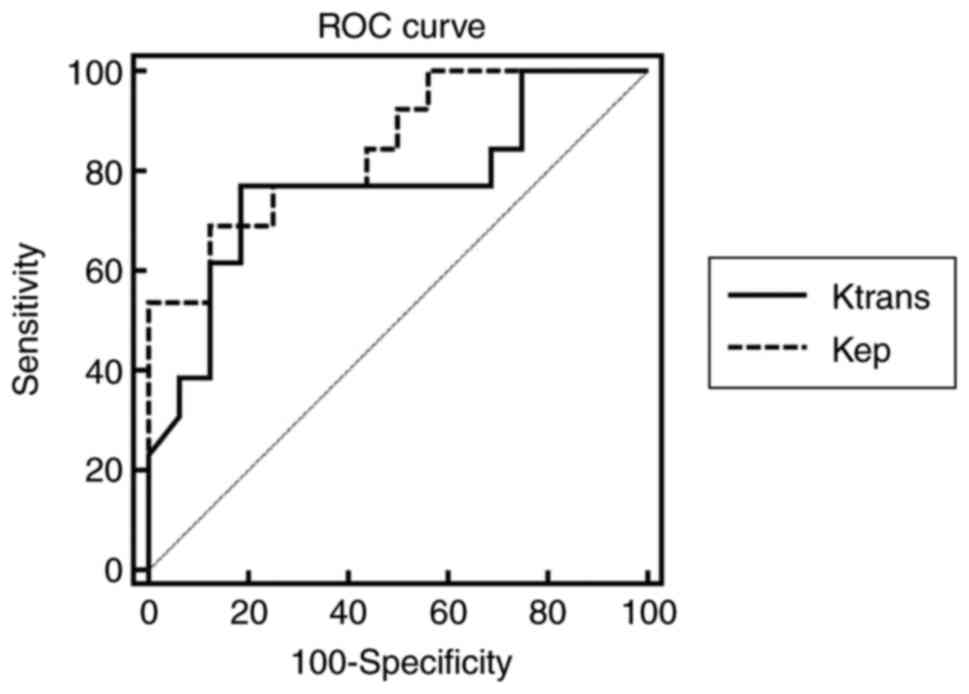
Differential diagnostic efficacy of
DCE-MRI quantitative parameters in pNENs grading
The diagnostic efficacy of Ktrans
and kep in differentiating G2 from G1 NET are
listed in Table III. The ROC curves
of Ktrans and kep are shown in
Fig. 5. The AUCs for
Ktrans and kep in
differentiating G2 from G1 NET were 0.767 and 0.846 respectively.
In the two DCE parameters, Ktrans cut-off value
of 0.667 provided a specificity of 81.25%; however, the
corresponding sensitivity was only 76.92%. The
kep cut-off value of 1.644 offered moderate
diagnostic performance (sensitivity, 69.23%; specificity, 87.50%).
When Ktrans was over than 0.667 and
kep exceeded 1.644, the sensitivity of diagnosing
G2 NET was the lowest (53.85%), but the specificity was the highest
(93.75%). When Ktrans was over than 0.667 or
kep exceeded 1.644, the sensitivity of diagnosing
G2 NET was 92.31%, but the specificity is 75.00%.
| Table III.The diagnostic efficacy of DCE-MRI
quantitative parameters in differentiating G2 from G1 NET. |
Table III.
The diagnostic efficacy of DCE-MRI
quantitative parameters in differentiating G2 from G1 NET.
| Parameter | Sensitivity | Specificity | PPV | NPV | Accuracy |
|---|
|
Ktrans alone | 0.7692 | 0.8125 | 0.7692 | 0.8125 | 0.7931 |
|
kep alone | 0.6923 | 0.8750 | 0.8182 | 0.7778 | 0.7931 |
| Ktrans or
kep | 0.9231 | 0.7500 | 0.7500 | 0.9231 | 0.8276 |
|
Ktrans and
kep | 0.5385 | 0.9375 | 0.8750 | 0.7143 | 0.7586 |
Discussion
pNENs are divided into G1, G2, G3 NET and NEC
according to the updated 2017 WHO classification of tumor. The
histological grades are related to the biological behavior and the
treatment strategy. The preoperative determination of tumor grade
is helpful for appropriate treatment planning. Imaging techniques
have been tentatively used to grade pNENs, such as dynamic enhanced
CT, MRI based on morphology and diffusion-weighted imaging (DWI)
(10–12). Kim et al (11) found ill-defined borders (P=0.001) and
hypo-SI on venous and delayed-phase (P=0.016) were more common in
G2/3 NET than in G1 ones. The apparent diffusion coefficient (ADC)
value showed a statistical difference between G1 and G2 NET
(1.60±0.41×10⁻³ mm2/s vs.
1.24±0.13×10⁻³, P=0.007). Jang et al (12) classified grade 1 pNENs into benign
group and grade 2 or 3 tumors into non-benign group. They found the
benign pNENs were more often round or ovoid in shape than
non-benign ones. Main pancreatic duct dilatation was demonstrated
only in non-benign pNENs (P=0.021). In addition, non-benign pNENs
had more frequent hypointensity compared with pancreatic parenchyma
than benign ones in the arterial phase (P=0.029). The benign pNENs
were significantly smaller than that of the non-benign group
(P=0.0019). The ADC values of benign pNENs were higher than that of
non-benign ones (P=0.003). Above research were almost retrospective
and based on morphology except ADC value. Not surprisingly, above
two researchers encountered the same problems as we were in
grouping: The number of G3 was too small due to low incidence. So
they all set G1 NET as a group, and G2/G3 NET as another group.
However, the biological behavior and the treatment strategy are
markedly different between G2 and G3 NET, such grouping may not be
appropriate. Our original intention was to evaluate the diagnostic
efficacy of pharmacokinetic parameters derived from DCE-MRI in
prospective evaluation of pNENs grading. Finally, only one G3 NET
patient was recruited in the last three years due to the low
incidence. So we had to temporarily abandon G3 NET and only analyze
the role of pharmacokinetic parameters in distinguishing G1 from G2
ones. As we put in the introduction, there are some differences to
the treatment strategies of G1 and G2 pNENs in clinical practice.
For example, for the small nonfunctional G1 NET located in
pancreatic head, a follow-up can be chosen because of the
significant mortality and complications of pancreaticoduodenectomy.
However, for G2 NET, which has a higher Ki-67 proliferation index
and mitotic rate, the treatment strategy may be aspiring and the
follow-up time should be shortened. So it will tailor the optimal
treatment for patients with pNENs if G1 and G2 NET could be well
classified.
DCE-MRI relies on the use of fast imaging techniques
with high temporal resolution and provides quantitative estimation
of physiologic parameters related to the microvascular environment
in vivo. Recent technical advancements, including parallel
imaging and higher magnetic field unit, have enabled us to obtain
continuous DCE-MRI images with high temporal resolution of a few
sec, which is critical in assessing microvascular circulation.
Pharmacokinetic parameters generated from DCE-MRI can help to
identify different hemodynamic characteristics and characterize
lesions in a quantitative manner. Ktrans and
kep have shown significant differences between G1
and G2 NET in our study. The G2 NET demonstrated a significantly
higher Ktrans and kep than G1
ones. These findings suggest that DCE-MRI has the potential in
differentiating G2 NET from G1 ones. The absorption and retention
of small molecular contrast agent (Gd-DTPA) on tumor mainly depends
on blood flow, vascular permeability and the volume of EES
(25). Ktrans
represents the transfer rate of contrast agents from vessels to
EES. kep represents reflux rate from EES to
vessels. Both are related to capillary permeability, meanwhile
Ktrans also depends on blood flow and capillary
surface area. In this study, higher Ktrans and
kep were found in G2 lesions than in G1 ones.
Similar phenomenon is also found in other kind of cancers in
previous studies. Koo et al (21) found mean Ktrans and
kep were all higher in breast cancers with a
higher histologic grade than lower histologic grade. Joo et
al (22) found poorly
differentiated gastric cancers showed a higher
Ktrans and kep than moderately
differentiated cancers. In most cases, the DCE pharmacokinetic
parameters yield composite information about the perfusion and
capillary permeability characteristics (13). The uncontrolled angiogenic process
requires that new capillaries be recruited from existing blood
vessels, in order to ensure a constant supply of nutrients and
oxygen, and to allow for the elimination of metabolic waste
(26). The increased immature
vasculatures contribute to higher perfusion and surface
permeability, which result in higher Ktrans and
kep.
ve represents the EES volume fraction,
approximately equals to the ratio of Ktrans to
kep. Previous studies have shown that
ve increased (22) or
decreased (21) with the progression
of malignancy. We did not observe higher or lower ve in
G2 lesions than in G1 ones. This may be due to tumor heterogeneity.
vp represents the plasma volume fraction. No statistical
difference was found in vp between G1 and G2 NET which
may be explained by the immaturity of neovascularization and leaky
tumor microcapillary.
In this study, the optimal AUC was achieved by
kep (AUC=0.846). A sensitivity (69.23%) and
specificity (87.50%) were obtained by adopting a
kep cut-off value of 1.644.
Ktrans value of 0.667 offered a moderate
sensitivity (76.92%) and specificity (81.25%). When
Ktrans was over than 0.667 and
kep exceeded 1.644, the sensitivity of diagnosing
G2 pNENs was the lowest (53.85%), but the specificity was the
highest (93.75%). When Ktrans was over than 0.667
or kep exceeded 1.644, the sensitivity of
diagnosing G2 pNENs was 92.31%, but the specificity is 75.00%. This
result is similar, even better than that of previous studies
(10–12). However, most of the previous studies
are not only based on morphological indicators except for ADC value
but also retrospective analysis. In addition, in order to get good
differential diagnostic efficacy, previous studies need to combine
multiple indicators to analyze. In our research, high sensitivity
(92.31%) and high specificity (93.75%) can be obtained only with
appropriate and combined cut-off values of
Ktrans, kep. Therefore,
Ktrans and kep may be a
potential and ideal screening indicator in the preoperative grading
of pNENs.
Small number of patients is a limitation of our
study, especially the limited number of patients in G3 NET/NEC
group deprived the statistical ability of investigating its
correlations between neoplasm grading and DCE-MRI results. This
study was a prospective study. Although we were eager, only 25
patients were recruited in the last three years due to the low
incidence of pNENs. Fortunately, our study demonstrated the
feasibility and potential value of DCE-MRI to differentiate G1 and
G2 NET. Further large studies are needed to assess the correlation
between DCE-MRI parameters and characteristics of lesions.
Therefore, studies are worth to be conducted in larger group of
patients, which would further confirm the diagnostic ability of
dynamic MR and evaluate cut-off levels depending on the
characteristics of patients, lesions and imaging techniques. Our
study has additional limitations with regard to the methods of
quantitation, including inaccuracies inherent to the manual
placement of ROIs. Also, the average values in the ROIs may not
reflect the heterogeneous nature of tumor tissue. In the future,
larger prospective cohort studies with voxel-based analysis will be
required given the relative rarity of pNENs. In addition, another
potential limitation which actually not only is a problem of our
study but almost of all quantitative precision medicine nowadays
needs to be mentioned. DCE-MRI parameters such as
Ktrans and kep could have
relatively high variations due to the absence of
inter-institutional protocol standardization and inter-vendor
differences in hardware/software and may hamper the
generalizability of results. Thus, one must take care to use the
proposed cut-off values directly in their research unless all
procedures are the same with ours described in the paper. In the
future, multi-center research and standardization of the procedures
are required and would no doubt benefit the generalizability of the
results.
In conclusion, our results have shown the potential
value of DCE-MRI in the assessment of pNENs grading. The
pharmacokinetic parameters of DCE-MRI, including
Ktrans and kep, could provide
complementary information in differentiating G2 NET from G1
ones.
Acknowledgements
Not applicable.
Funding
This study was funded by the National Natural
Science Foundation of China (grant nos. 81370039 and
81220108011).
Availability of data and materials
The datasets used and/or analyzed during the current
study are available from the corresponding author on reasonable
request.
Authors' contributions
YH designed the research, applied for funding and
advanced the progress of the research. WZ, ZQ and JR collected,
analyzed and interpreted the patient data. WZ and ZQ were major
contributors in writing the manuscript. XH, DW and GZ performed the
appointments and scanning of the subjects. ZS provided technical
support regarding the image post-processing. YH and HY supervised
the research group. In addition, HY played a role in the design of
the research and the interpretation of the results.
Ethics approval and consent to
participate
Ethical approval was obtained for this prospective
research from the Ethics Committee Board of Xijing Hospital (Xi'an,
China) and written informed consent was obtained from all
participants before collecting information.
Consent for publication
Written informed consent was obtained from all
participants and they consented to publication of their images.
Competing interests
The authors declare that they have no competing
interests.
Glossary
Abbreviations
Abbreviations:
|
DCE-MRI
|
dynamic contrast-enhanced magnetic
resonance imaging
|
|
pNENs
|
pancreatic neuroendocrine
neoplasms
|
|
NET
|
neuroendocrine tumor
|
|
NEC
|
neuroendocrine carcinoma
|
|
ROC
|
receiver operator characteristics
|
|
NENs
|
neuroendocrine neoplasms
|
|
PRRT
|
peptide receptor radionuclide
therapy
|
|
Ktrans
|
volume transfer constant
|
|
kep
|
contrast transfer rate constant
|
|
EES
|
extravascular extracellular space
|
|
ve
|
extravascular extracellular space
volume fraction
|
|
vp
|
plasma volume fraction
|
|
TR
|
repetition time
|
|
TE
|
echo time
|
|
FOV
|
field of view
|
|
ROI
|
region of interest
|
|
MRF
|
Markov random fields
|
|
AIF
|
arterial input function
|
|
HPF
|
high-power field
|
|
DWI
|
diffusion-weighted imaging
|
|
ADC
|
apparent diffusion coefficient
|
References
|
1
|
Yao JC, Hassan M, Phan A, Dagohoy C, Leary
C, Mares JE, Abdalla EK, Fleming JB, Vauthey JN, Rashid A and Evans
DB: One hundred years after ‘carcinoid’: Epidemiology of and
prognostic factors for neuroendocrine tumors in 35,825 cases in the
United States. J Clin Oncol. 26:3063–3072. 2008. View Article : Google Scholar : PubMed/NCBI
|
|
2
|
Dong M, Phan AT and Yao JC: New strategies
for advanced neuroendocrine tumors in the era of targeted therapy.
Clin Cancer Res. 18:1830–1836. 2012. View Article : Google Scholar : PubMed/NCBI
|
|
3
|
Halfdanarson TR, Rabe KG, Rubin J and
Petersen GM: Pancreatic neuroendocrine tumors (PNETs): Incidence,
prognosis and recent trend toward improved survival. Ann Oncol.
19:1727–1733. 2008. View Article : Google Scholar : PubMed/NCBI
|
|
4
|
Kim JY, Hong SM and Ro JY: Recent updates
on grading and classification of neuroendocrine tumors. Ann Diagn
Pathol. 29:11–16. 2017. View Article : Google Scholar : PubMed/NCBI
|
|
5
|
Boudreaux JP, Klimstra DS, Hassan MM,
Woltering EA, Jensen RT, Goldsmith SJ, Nutting C, Bushnell DL,
Caplin ME and Yao JC: North American Neuroendocrine Tumor Society
(NANETS): The NANETS consensus guideline for the diagnosis and
management of neuroendocrine tumors: Well-differentiated
neuroendocrine tumors of the jejunum, ileum, appendix, and cecum.
Pancreas. 39:753–766. 2010. View Article : Google Scholar : PubMed/NCBI
|
|
6
|
Crippa S, Partelli S, Bassi C, Berardi R,
Capelli P, Scarpa A, Zamboni G and Falconi M: Long-term outcomes
and prognostic factors in neuroendocrine carcinomas of the
pancreas: Morphology matters. Surgery. 159:862–871. 2016.
View Article : Google Scholar : PubMed/NCBI
|
|
7
|
Crippa S, Partelli S, Belfiori G, Palucci
M, Muffatti F, Adamenko O, Cardinali L, Doglioni C, Zamboni G and
Falconi M: Management of neuroendocrine carcinomas of the pancreas
(WHO G3): A tailored approach between proliferation and morphology.
World J Gastroenterol. 22:9944–9953. 2016. View Article : Google Scholar : PubMed/NCBI
|
|
8
|
Sorbye H, Strosberg J, Baudin E, Klimstra
DS and Yao JC: Gastroenteropancreatic high-grade neuroendocrine
carcinoma. Cancer. 120:2814–2823. 2014. View Article : Google Scholar : PubMed/NCBI
|
|
9
|
Kunz PL, Reidy-Lagunes D, Anthony LB,
Bertino EM, Brendtro K, Chan JA, Chen H, Jensen RT, Kim MK,
Klimstra DS, et al: Consensus guidelines for the management and
treatment of neuroendocrine tumors. Pancreas. 42:557–577. 2013.
View Article : Google Scholar : PubMed/NCBI
|
|
10
|
Kim DW, Kim HJ, Kim KW, Byun JH, Song KB,
Kim JH and Hong SM: Neuroendocrine neoplasms of the pancreas at
dynamic enhanced CT: Comparison between grade 3 neuroendocrine
carcinoma and grade 1/2 neuroendocrine tumour. Eur Radiol.
25:1375–1383. 2015. View Article : Google Scholar : PubMed/NCBI
|
|
11
|
Kim JH, Eun HW, Kim YJ, Han JK and Choi
BI: Staging accuracy of MR for pancreatic neuroendocrine tumor and
imaging findings according to the tumor grade. Abdom Imaging.
38:1106–1114. 2013. View Article : Google Scholar : PubMed/NCBI
|
|
12
|
Jang KM, Kim SH, Lee SJ and Choi D: The
value of gadoxetic acid-enhanced and diffusion-weighted MRI for
prediction of grading of pancreatic neuroendocrine tumors. Acta
Radiol. 55:140–148. 2014. View Article : Google Scholar : PubMed/NCBI
|
|
13
|
Tofts PS, Brix G, Buckley DL, Evelhoch JL,
Henderson E, Knopp MV, Larsson HB, Lee TY, Mayr NA, Parker GJ, et
al: Estimating kinetic parameters from dynamic contrast-enhanced
T(1)-weighted MRI of a diffusable tracer: Standardized quantities
and symbols. J Magn Reson Imaging. 10:223–232. 1999. View Article : Google Scholar : PubMed/NCBI
|
|
14
|
Morgan B, Thomas AL, Drevs J, Hennig J,
Buchert M, Jivan A, Horsfield MA, Mross K, Ball HA, Lee L, et al:
Dynamic contrast-enhanced magnetic resonance imaging as a biomarker
for the pharmacological response of PTK787/ZK 222584, an inhibitor
of the vascular endothelial growth factor receptor tyrosine
kinases, in patients with advanced colorectal cancer and liver
metastases: Results from two phase I studies. J Clin Oncol.
21:3955–3964. 2003. View Article : Google Scholar : PubMed/NCBI
|
|
15
|
Cho E, Chung DJ, Yeo DM, Sohn D, Son Y,
Kim T and Hahn ST: Optimal cut-off value of perfusion parameters
for diagnosing prostate cancer and for assessing aggressiveness
associated with Gleason score. Clin Imaging. 39:834–840. 2015.
View Article : Google Scholar : PubMed/NCBI
|
|
16
|
Park JJ, Kim CK, Park SY, Simonetti AW,
Kim E, Park BK and Huh SJ: Assessment of early response to
concurrent chemoradiotherapy in cervical cancer: Value of
diffusion-weighted and dynamic contrast-enhanced MR imaging. Magn
Reson Imaging. 32:993–1000. 2014. View Article : Google Scholar : PubMed/NCBI
|
|
17
|
Chakiba C, Cornelis F, Descat E,
Gross-Goupil M, Sargos P, Roubaud G and Houédé N: Dynamic contrast
enhanced MRI-derived parameters are potential biomarkers of
therapeutic response in bladder carcinoma. Eur J Radiol.
84:1023–1028. 2015. View Article : Google Scholar : PubMed/NCBI
|
|
18
|
Furukawa M, Parvathaneni U, Maravilla K,
Richards TL and Anzai Y: Dynamic contrast-enhanced MR perfusion
imaging of head and neck tumors at 3 Tesla. Head Neck. 35:923–929.
2013. View Article : Google Scholar : PubMed/NCBI
|
|
19
|
Huang B, Wong CS, Whitcher B, Kwong DL,
Lai V, Chan Q and Khong PL: Dynamic contrast-enhanced magnetic
resonance imaging for characterising nasopharyngeal carcinoma:
Comparison of semiquantitative and quantitative parameters and
correlation with tumour stage. Eur Radiol. 23:1495–1502. 2013.
View Article : Google Scholar : PubMed/NCBI
|
|
20
|
Yuan Y, Kuai YP, Chen XS and Tao XF:
Assessment of dynamic contrast-enhanced magnetic resonance imaging
in the differentiation of malignant from benign orbital masses. Eur
J Radiol. 82:1506–1511. 2013. View Article : Google Scholar : PubMed/NCBI
|
|
21
|
Koo HR, Cho N, Song IC, Kim H, Chang JM,
Yi A, Yun BL and Moon WK: Correlation of perfusion parameters on
dynamic contrast-enhanced MRI with prognostic factors and subtypes
of breast cancers. J Magn Reson Imaging. 36:145–151. 2012.
View Article : Google Scholar : PubMed/NCBI
|
|
22
|
Joo I, Lee JM, Han JK, Yang HK, Lee HJ and
Choi BI: Dynamic contrast-enhanced MRI of gastric cancer:
Correlation of the perfusion parameters with pathological
prognostic factors. J Magn Reson Imaging. 41:1608–1614. 2015.
View Article : Google Scholar : PubMed/NCBI
|
|
23
|
Filice S and Crisi G: Dynamic
contrast-enhanced perfusion MRI of high grade brain gliomas
obtained with arterial or venous waveform input function. J
Neuroimaging. 26:124–129. 2016. View Article : Google Scholar : PubMed/NCBI
|
|
24
|
Handayani A, Triadyaksa P, Dijkstra H,
Pelgrim GL, van Ooijen PM, Prakken NH, Schoepf UJ, Oudkerk M,
Vliegenthart R and Sijens PE: Intermodel agreement of myocardial
blood flow estimation from stress-rest myocardial perfusion
magnetic resonance imaging in patients with coronary artery
disease. Invest Radiol. 50:275–282. 2015. View Article : Google Scholar : PubMed/NCBI
|
|
25
|
Jennings D, Raghunand N and Gillies RJ:
Imaging hemodynamics. Cancer Metastasis Rev. 27:589–613. 2008.
View Article : Google Scholar : PubMed/NCBI
|
|
26
|
Turkbey B, Kobayashi H, Ogawa M, Bernardo
M and Choyke PL: Imaging of tumor angiogenesis: Functional or
targeted? AJR Am J Roentgenol. 193:304–313. 2009. View Article : Google Scholar : PubMed/NCBI
|