Introduction
Hepatocellular carcinoma (HCC) accounts for >90%
of liver cancer cases, making it the most common hepatic cancer
(1). HCC has recently become one of
the tumors to occur most frequently globally and is considered to
be among the most lethal cancer types, making up approximately
one-third of all cancer cases (2).
HCC progression is characterized by a series of sequential, complex
steps. Recent research has focused on the role of protein-coding
genes in HCC pathogenesis. However, as only 1% of the human genome
encodes protein, another 4–9% remains that are transcribed to
provide a number of short or long RNAs with restricted
protein-coding abilities (3).
MicroRNAs (miRNAs/miRs) are small, endogenous RNAs
that degrade mRNA or inhibit translation, thus regulating gene
expression (4). The aberrant
expression of miRNAs serves an essential role in the progression of
HCC. As such, miRNA replacement or inhibition therapies have a
great deal of potential as treatments for HCC (5).
Long non-coding RNAs (lncRNAs) are untranslated RNA
transcripts >200 nucleotides in length that bear a lot of the
structural characteristics of mRNAs, including a poly(A) tail,
5′-cap and a promoter structure, but no conserved open reading
frames (6,7). Numerous lncRNAs are expressed in a
temporal- and tissue-specific manner during development, exhibiting
a range of different splicing patterns. lncRNAs epigenetically
regulate the expression of protein-coding genes, exerting a strong
effect on a number of different cellular processes, including those
involved in the pathogenesis of multiple human cancer types
(8,9).
ncRNAs have been suggested to form a regulatory interaction
network; specifically, miRNAs and mRNAs, and miRNAs and lncRNAs
interact with each other, imposing an additional level of
post-transcriptional regulation (10).
In the present study, mRNA expression data and miRNA
expression data of HCC were downloaded from The Cancer Genome Atlas
(TCGA) and a lncRNA-miRNA-mRNA regulatory network was constructed.
In total, five miRNA-target gene-prediction databases, including
TargetScan6, microcosm, miRanda7, miRDB8 and picTar9, were
integrated as the support dataset of miRNA and mRNA pairs.
lncRNA-miRNA information in the lncRNA (10) database was also used as the support
dataset of lncRNA and mRNA pairs. The lncRNA, miRNA and mRNA
regulatory networks in HCC were analyzed with bioinformatics
software to provide a theoretical basis for the molecular mechanism
of HCC pathogenesis.
Materials and methods
Gene expression profiles
The gene expression dataset ‘batch8_9’ was
downloaded from the TCGA project webpage (https://tcga-data.nci.nih.gov/tcga/). This set
included 212 HCC samples and 50 matched non-cancerous samples for
miRNA analysis, as well as 269 other liver cancer samples and 51
matched non-cancerous samples for mRNA analysis. Data levels are
sorted by data type, platform and center in TCGA. The data
downloaded consisted of levels 1–4, from which, level 3 (for
segmented or interpreted data) was used for further study. The
median was calculated to standardize the original data.
Screening differentially expressed
mRNA and miRNA
DEGs were analyzed using the DESeq (11) package in R and by paired Student's
t-test. Differentially expressed mRNAs between the two groups of
samples were analyzed using DESeq by negative binomial
distribution. The edgeR (12) package
in R language and a t-test were used to analyze differentially
expressed miRNAs. The adjusted P-value (p.adj) was set as 0.05 and
the log2 fold change absolute value was set as 1. On the basis of
the analysis of differentially expressed miRNAs and mRNAs, a
correlation analysis was conducted on each significantly
differentially expressed miRNA and mRNA.
Function analysis of DEGs
Gene Ontology (GO) (13) enrichment analysis of DEGs was
conducted using the Database for Annotation, Visualization, and
Integrated Discovery (DAVID) (14). A
P-value cut-off of <0.05 was set as the screening condition.
Integrated analysis of miRNA target
gene prediction database
Integrated analysis of five miRNA target gene
predication databases, including TargetScan, microcosm, miRanda,
miRDB and PicTar (15–18), was conducted to identify the number of
miRNA-regulated target gene pairs. The correlation coefficient
threshold was set at −0.3 and the significance p.adj was set at
0.05. The pairs that were identified by two or more databases were
further processed and retained, and the pairs supported by two or
more databases were analyzed statistically.
Association analysis and regulatory
network visualization of lncRNA, and miRNA and lncRNA
The regulatory association between lncRNA and miRNA
was exploited using lncRNASNP (19,20).
Regulatory network visualization for the regulatory associations
between miRNAs and mRNAs, and lncRNAs and miRNAs was conducted
using Cytoscape (21).
Results
Screening differentially expressed
mRNA
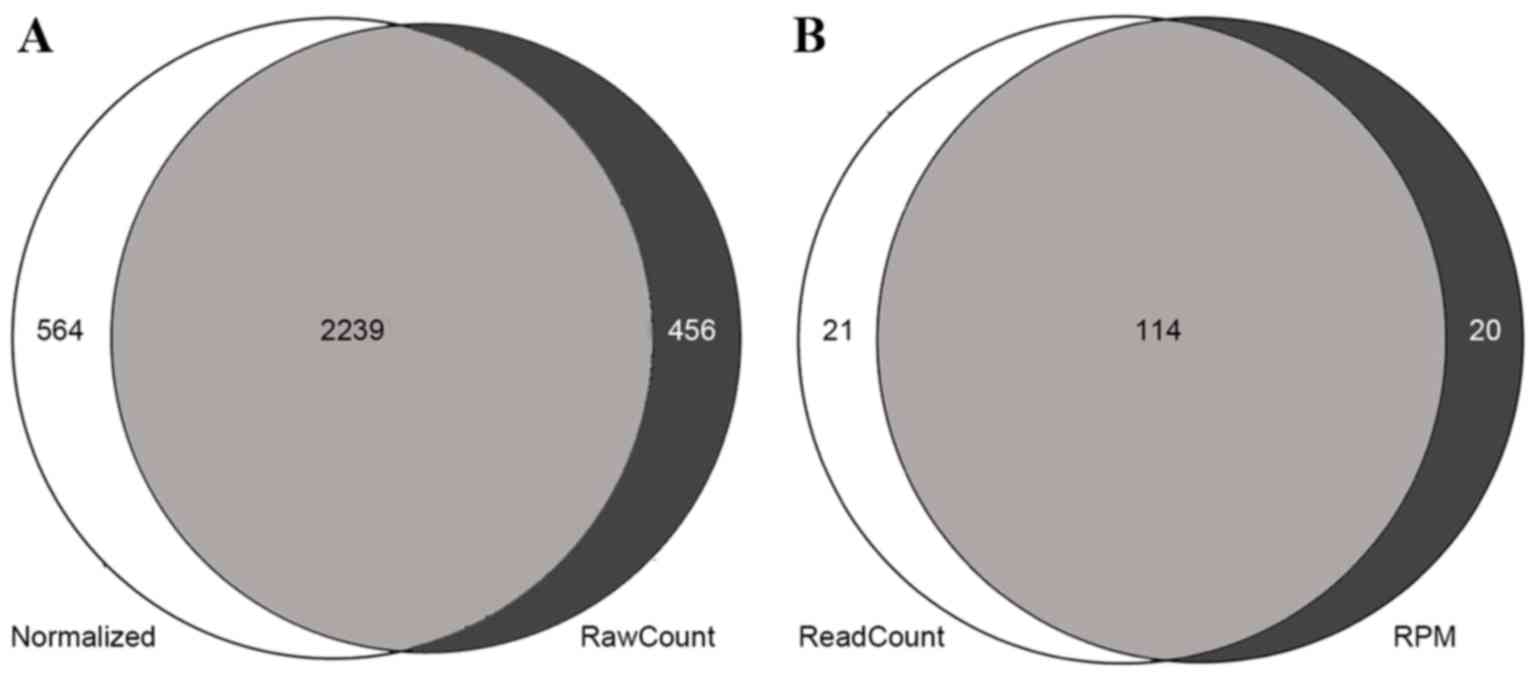
DEGs were used to compare gene expression levels
between 51 human non-cancerous samples and 269 HCC samples. The
original data were preprocessed and the expression data of 16,489
genes were obtained. DESeq identified 2,695 differentially
expressed mRNAs. A total of 687 upregulated genes and 1,515
downregulated genes were identified as being significantly
differentially expressed. The t-test identified 2,803
differentially expressed mRNAs. DESeq and the t-test identified
2,239 (Fig. 1A) differentially
expressed mRNAs, including 1,514 upregulated genes and 725
downregulated genes. edgeR identified 135 differentially expressed
miRNAs, and the t-test identified 134. The two methods identified
114 differentially expressed miRNAs, 94 of which were upregulated
and 20 of which were downregulated (Fig.
1B).
DEG functions and pathways
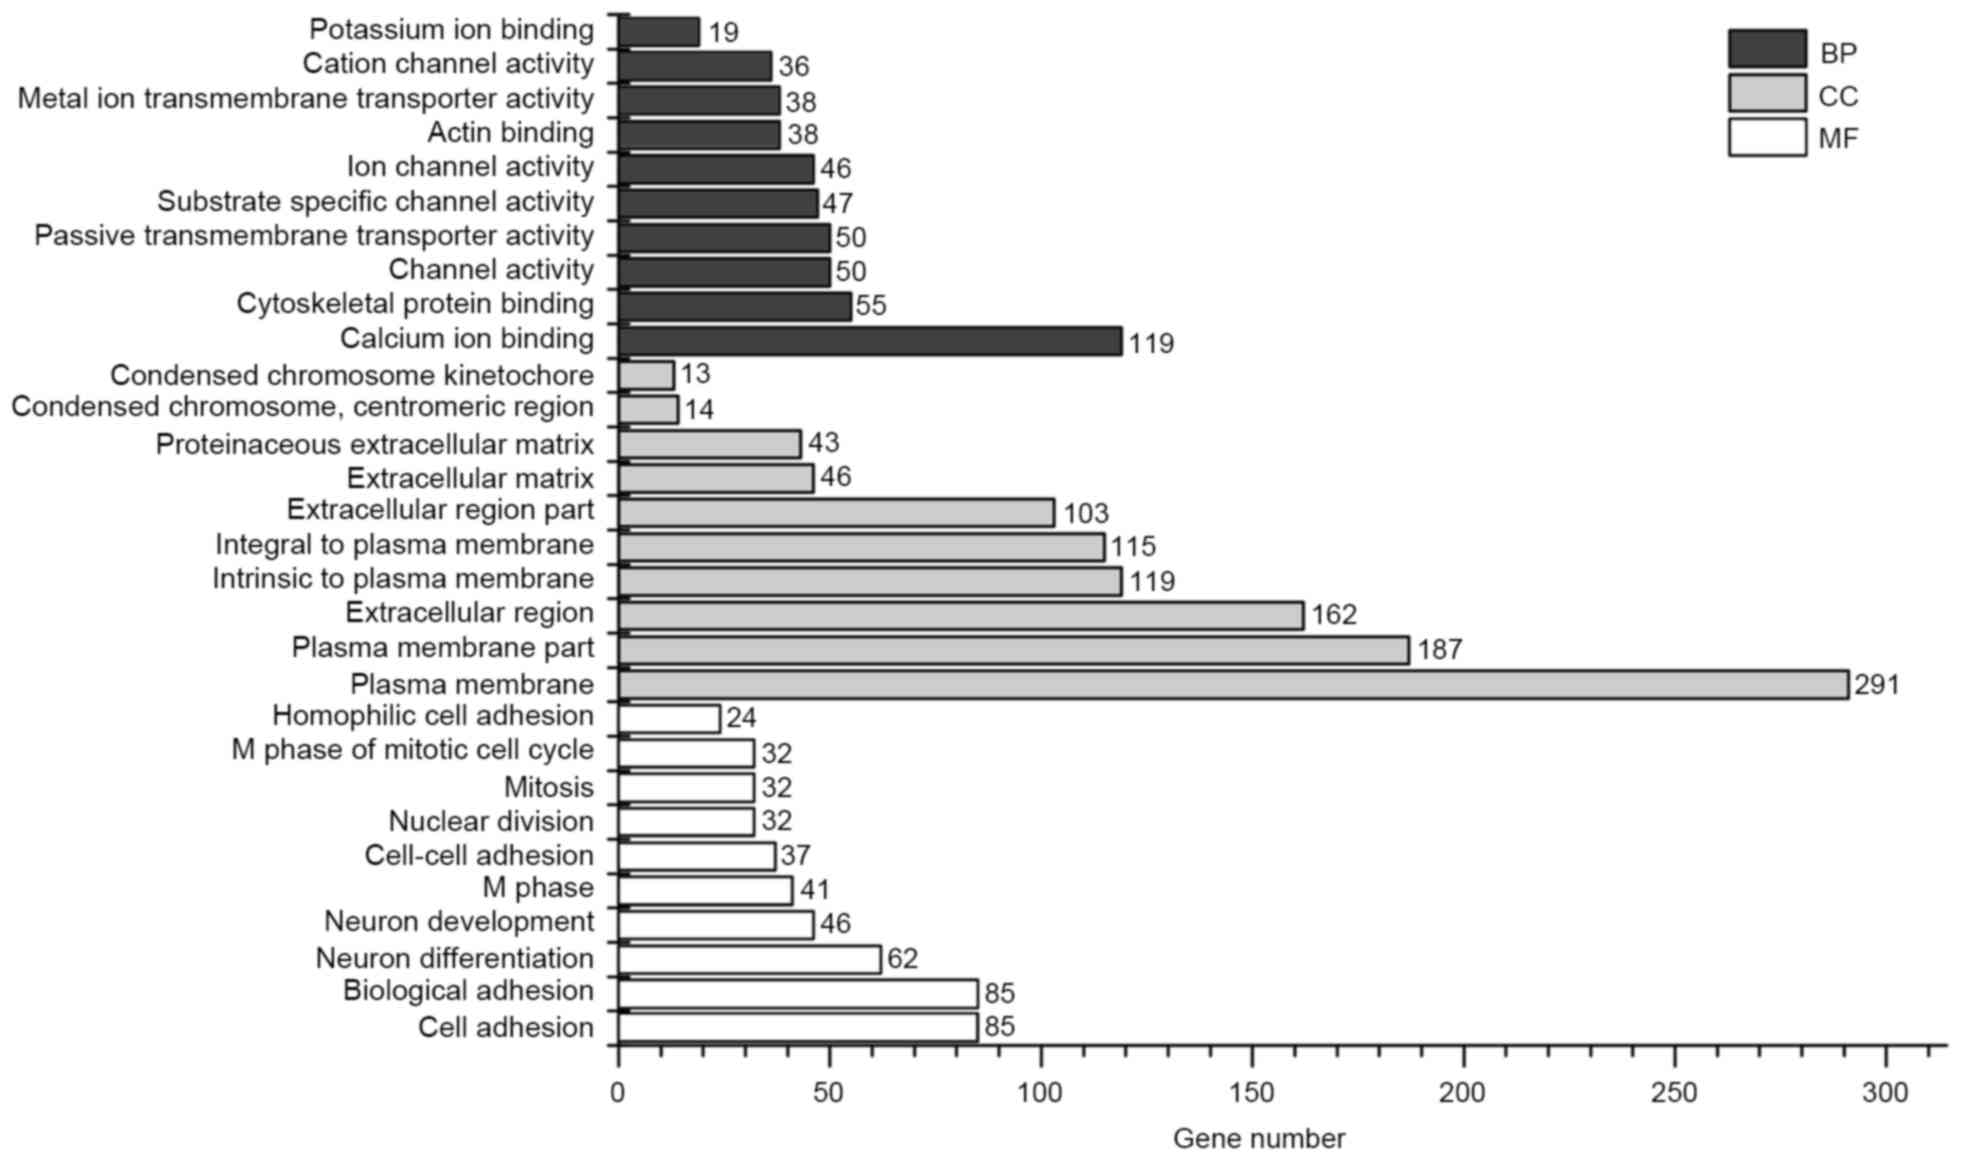
The GO enrichment bar chart may directly reflect the
distribution of DEGs for each enriched GO term with regard to
biological process (BP), cellular component (CC) and molecular
function (13). GO enrichment
analysis of DEGs was conducted using DAVID, and 10 significantly
enriched BP terms, 10 significantly enriched CC terms and 10
significantly enriched molecular function terms were selected to
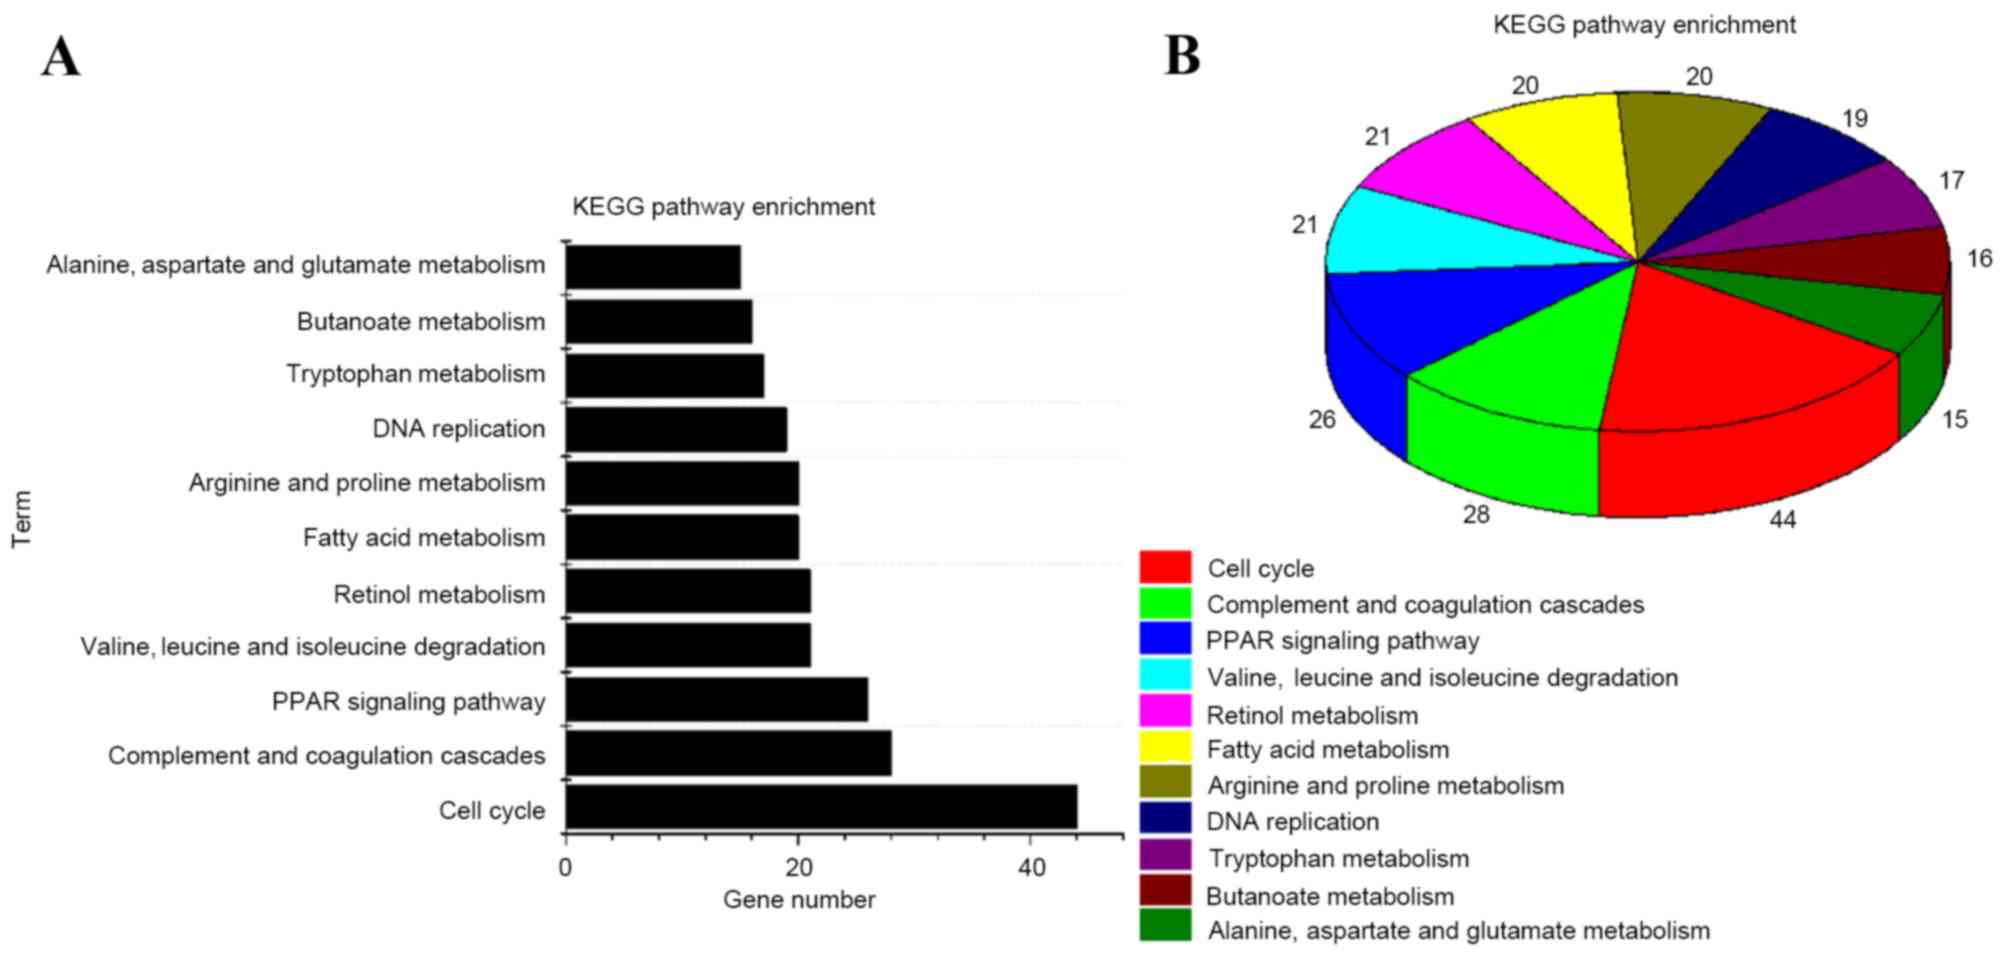
form the bar chart (Fig. 2). KEGG
enrichment analysis (22) on DEGs was
conducted using DAVID. The results showed that DEGs are mainly
involved in the complement and coagulation cascades, fatty acid
metabolism and butanoate metabolism (Fig.
3A). P<0.05 was set as the screening threshold. A pie
demonstrating the enriched pathways is presented in Fig. 3B.
Correlation analysis of miRNA and
mRNA
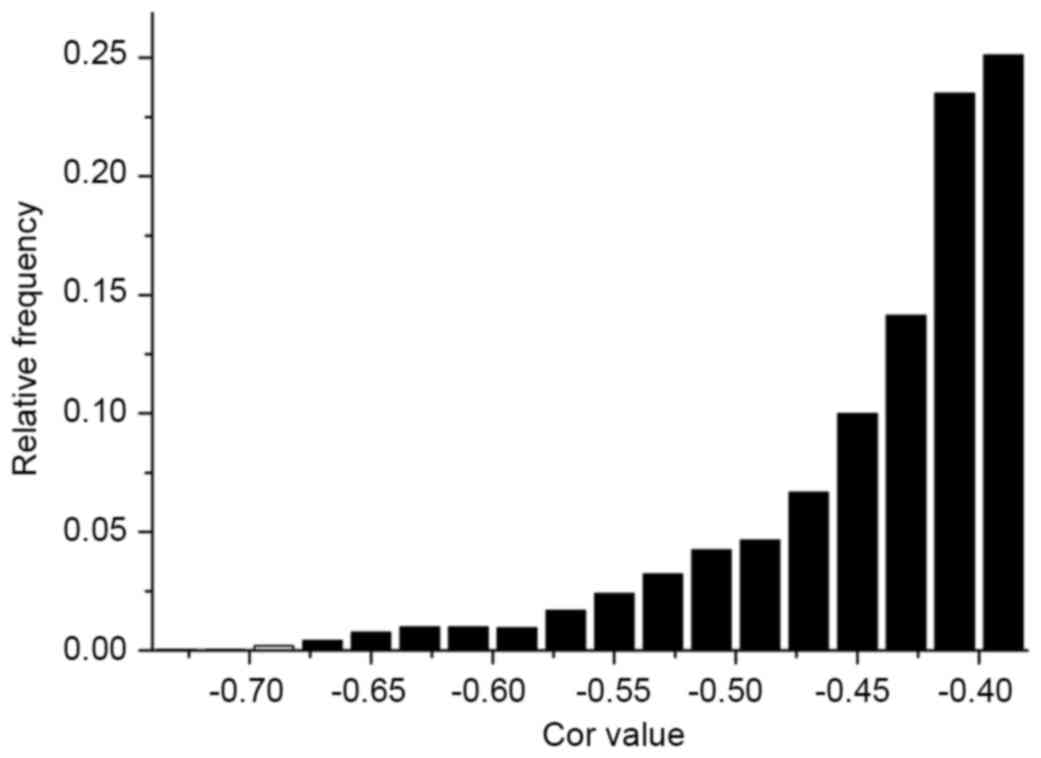
Correlation analysis was conducted on each
significantly differentially expressed miRNA and mRNA, based on the
analysis of differentially expressed miRNAs and mRNAs. As miRNAs
contribute to cell proliferation, differentiation, apoptosis and
other processes by inhibiting the translation of mRNA or degrading
it (5), negatively associated miRNA
and mRNA pairs were selected. In total, 3,133 miRNA and mRNA pairs
were identified for the analysis of frequency distribution for the
correlation of miRNA and mRNA (Fig.
4).
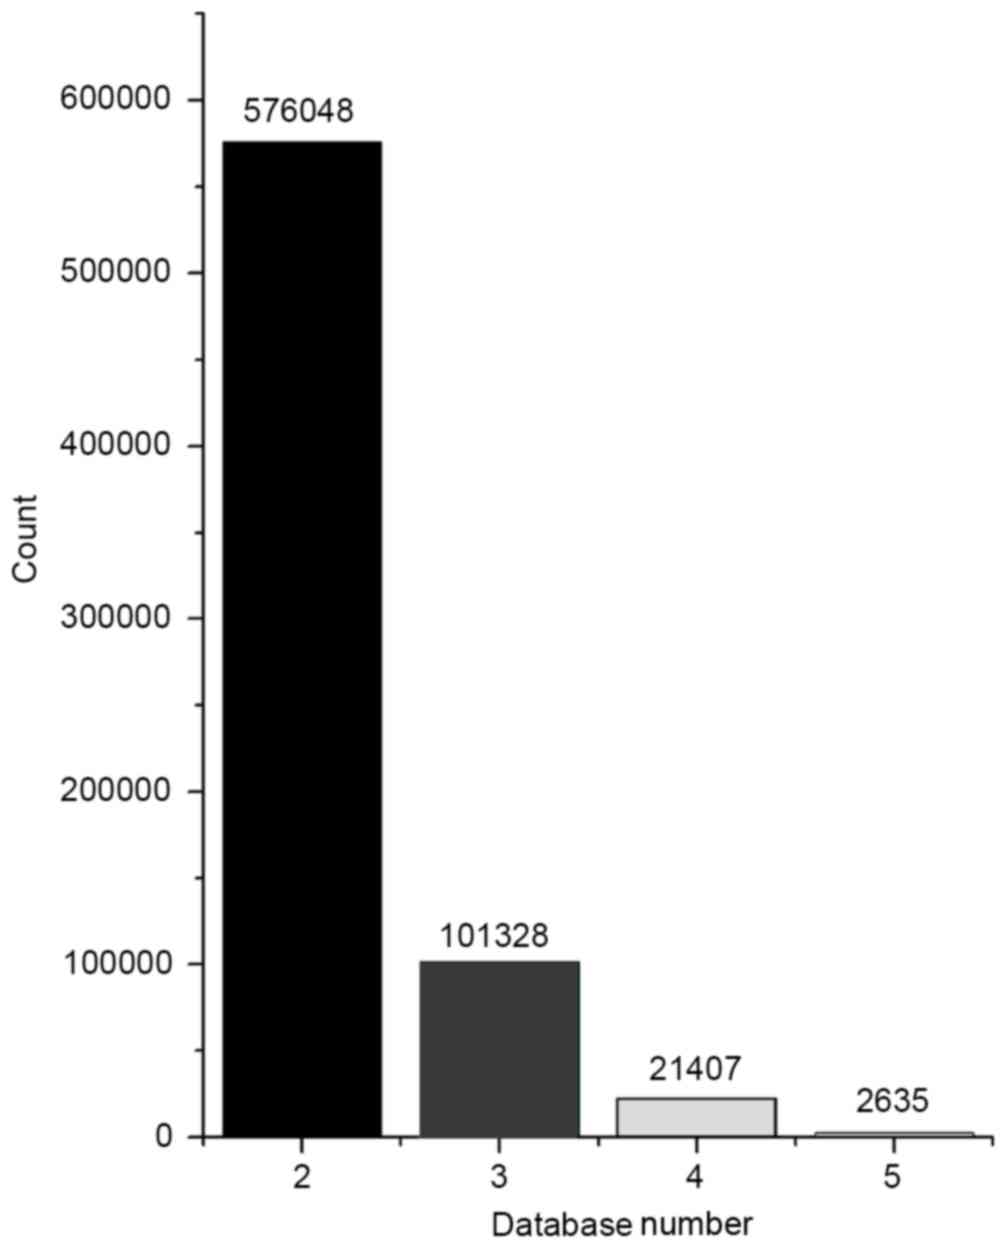
Analysis of miRNA target gene
database
Integrated analysis of five miRNA target gene
predication databases (TargetScan, microcosm, miRanda, miRDB and
PicTar) was conducted and 7,099,255 miRNA-regulated target gene
pairs were identified. The pairs supported by two or more databases
were further processed and retained, and totaled 701,418; these
pairs were then analyzed statistically (Fig. 5). Integrated analysis was conducted
for the pairs that met the conditions of correlation analysis and
pairs whose interaction was supported by at least two databases. A
total of 203 pairs was identified in the intersection of the two
databases, including 28 miRNAs and 170 mRNAs.
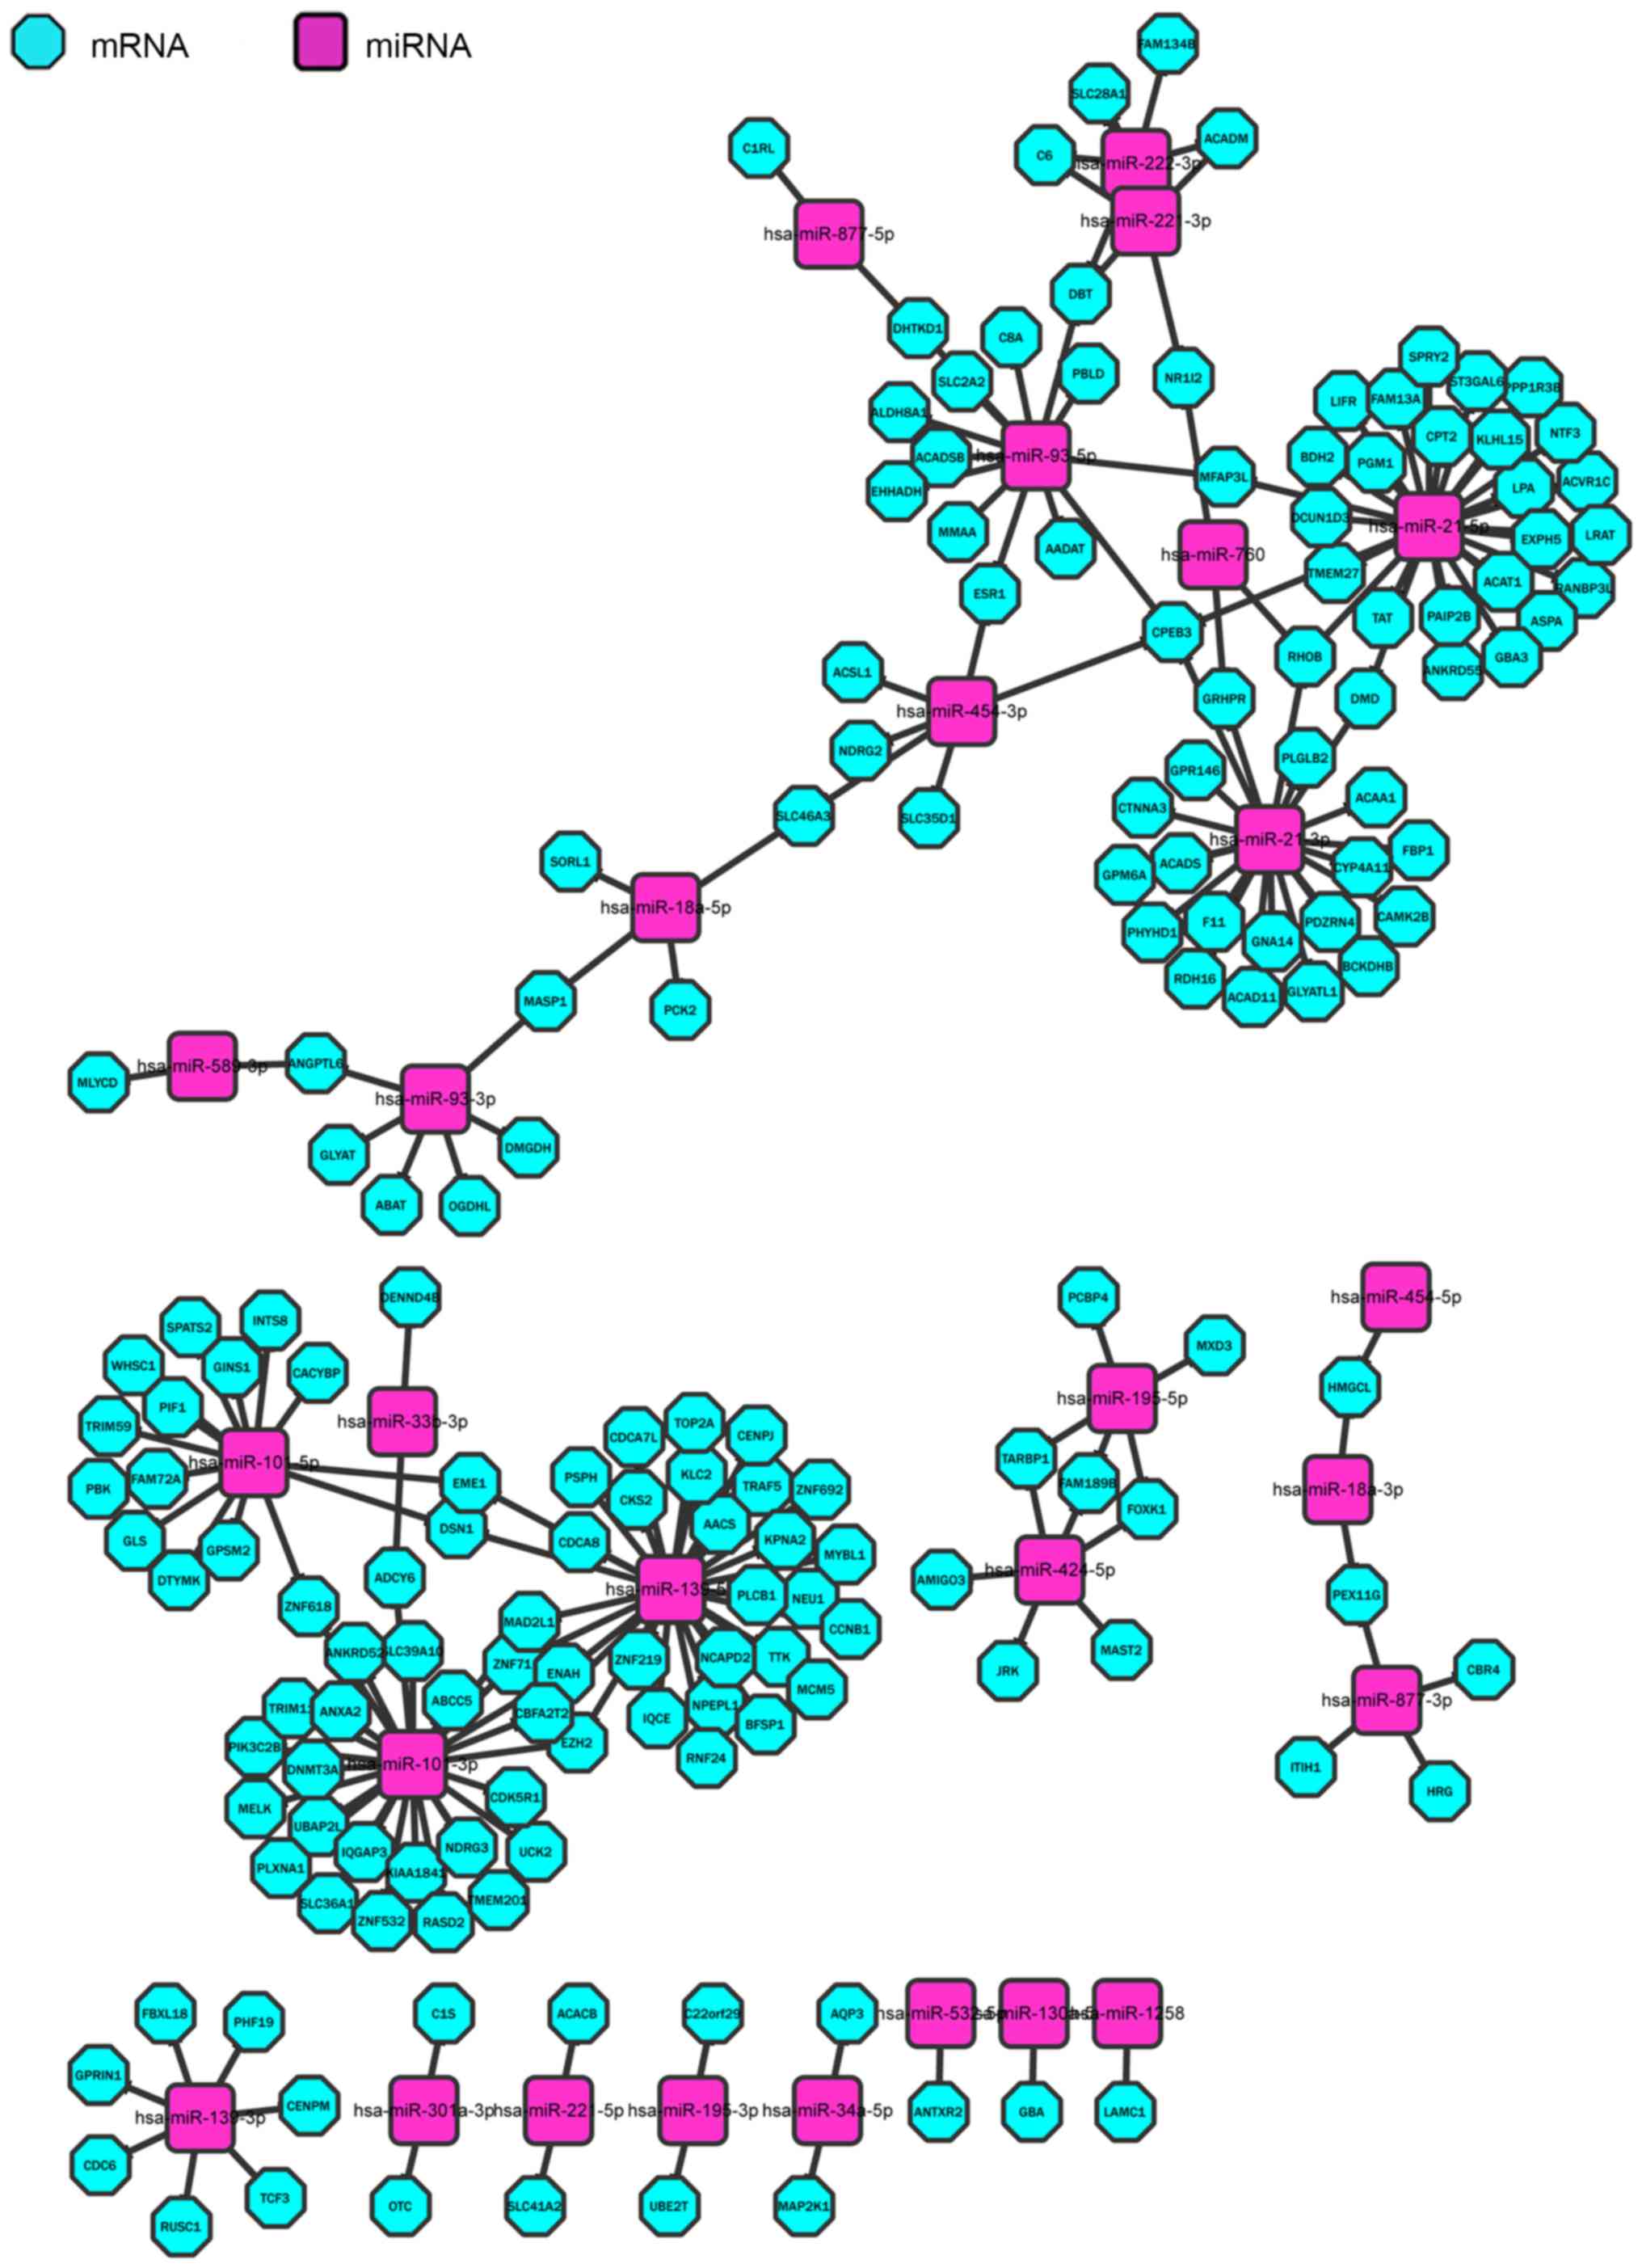
miRNA and mRNA regulatory network
visualization
In order to display the regulating network more
clearly, Cytoscape was used to visualize it for the 203 pairs,
including 170 miRNAs and 28 mRNAs (Fig.
6). Each node of the Cytoscape network represents a gene, miRNA
or other data point. The edge between nodes represents an
interaction between these biomolecules (17).
Association analysis of lncRNA, miRNA
and mRNA
The lncRNASNP database is a single nucleotide
polymorphism (SNP) database that records human lncRNAs and contains
SNP information on lncRNAs, structural changes caused by SNPs and
the binding sites of lncRNAs and miRNAs. The database contains
72,000 lncRNA and miRNA pairs in total, including 5,118
experimentally validated pairs. The naming method used in the
LNCipedia database, which provides comprehensive annotation of the
sequence and structure of human lncRNAs, was also used to name
lncRNAs in the lncRNASNP database. LNCipedia 3.0 is another
database, which contains 113,513 human annotated lncRNAs (19,20).
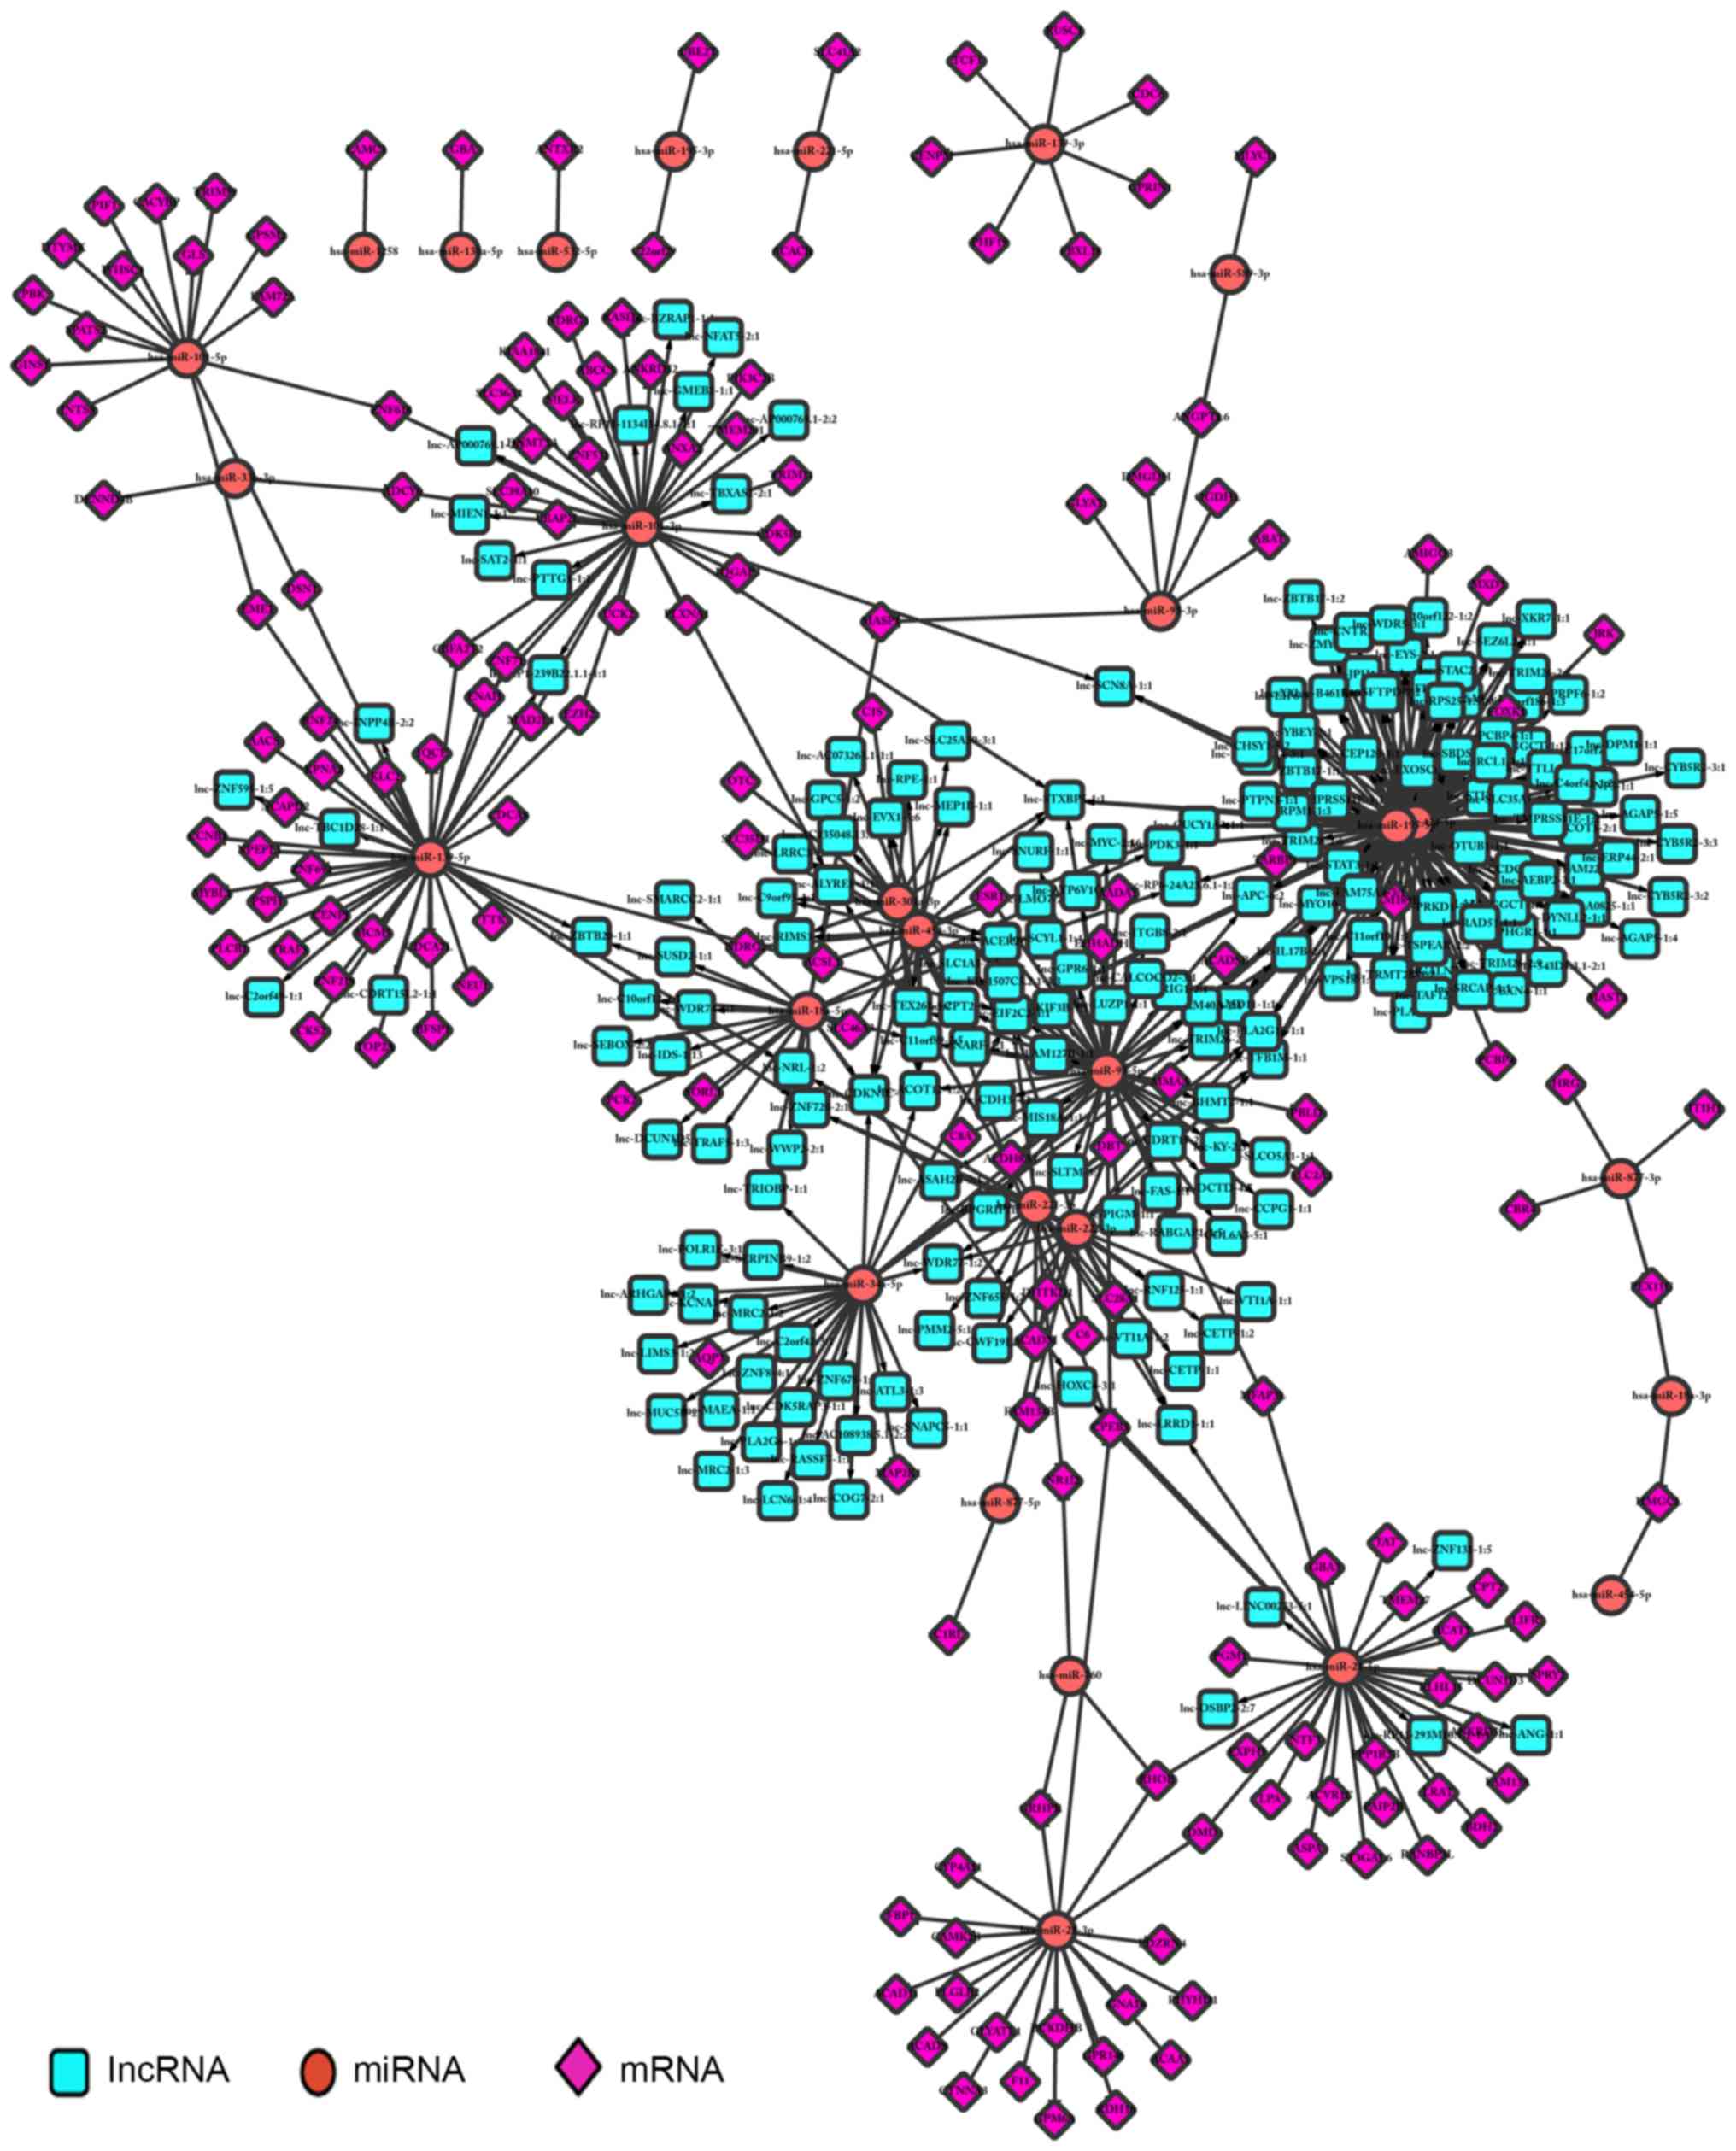
Regulatory associations were screened according to the
corresponding associations between lncRNAs and miRNAs, and miRNAs
and mRNAs; a total of 2,721 regulatory associations were
identified. Cytoscape was used to perform regulator network
visualization for the regulatory associations between lncRNAs,
miRNAs and mRNAs, including 12 miRNAs, 113 mRNAs and 199 lncRNAs
(Fig. 7).
Discussion
TCGA project was initiated by the National Cancer
Institute (NCI) and the National Human Genome Research Institute
(NHGRI) in 2006, and includes rich clinical data and large-scale
data of mRNA and miRNA expression profiles, copy number variations,
DNA methylation and mutations. Full exploitation of TCGA database
may lay the foundation for future studies (23).
In order to investigate the molecular mechanism of
HCC pathogenesis, the gene expression profiles of HCC in TCGA
database were downloaded. Of the selected 2,239 DEGs, 1,514 were
upregulated genes, including ANGPT1, CEBPA-AS1, ARRDC2, FAM213B,
SAMD1 and PCNXL3, and 725 were downregulated genes, including
PLA2G16, PXMP2, CDNF, GOT2, NR0B2 and DCXR. The upregulated genes
were separately extracted and underwent KEGG pathway enrichment
analysis using DAVID. Multiple genes, such as E2F1, E2F2, E2F5 and
DBF4, are involved in the cell cycle. LIG1, POLA1, POLA2, MCM2,
MCM3 and RNASEH2A are involved in DNA replication. CDK1, ADCY6,
SGOL1, PKMYT1, ESPL1 and AURKA are involved in
progesterone-mediated oocyte meiosis. These data suggest that it is
alterations to these functions and pathways that is the primary
cause of tumorigenesis in HCC.
miRNAs regulate the expression of target genes
post-transcriptionally via their complementarity with the mRNA seed
sequence (24). miRNAs present
tissue-specific expression, have numerous target genes, may
regulate multiple protein-coding genes and can be involved in
multiple molecular pathways associated with tumor evolution and
progression, which are associated with multiple cancer types
(25). The present study identified
114 differentially expressed miRNAs using TCGA, including
hsa-mir-183, hsa-mir-552, hsa-mir-184, hsa-mir-1269, hsa-mir-217,
hsa-mir-196a-1, hsa-mir-200c, hsa-mir-190b, hsa-mir-224 and
hsa-mir-541. miRNAs can post-transcriptionally regulate the
expression of their target genes through their incomplete
complementarity with the 3′ non-coding region of target mRNAs
(4). On the basis of the analysis of
differentially expressed miRNAs and mRNAs, negative correlation
analysis was conducted on each significantly differentially
expressed miRNA and mRNA. Through the integrated analysis of target
gene prediction databases, 203 pairs, including 170 miRNAs and 28
mRNAs (Fig. 5), were identified, such
as hsa-miR-101-5p and EZH2, hsa-miR-454-3p and ESR1,
hsa-miR-101-3p-5p and CBFA2T2, hsa-miR-93-5p and ESR1, and
hsa-mir-101-3P and DNMT3.
miR-125b was reported to exert its hepatic
tumor-suppressive effect by suppressing the expression of the
oncogene LIN28B, suggesting it could have a therapeutic application
(26). miR-375 regulates the
YY1-associated protein 1 oncogene, meaning it could have a
therapeutic role in HCC treatment (27).
At the same time, miR-375 targets AEG-1 in HCC and
suppresses liver cancer cell growth in vitro and in
vivo, which underlines the potential for the therapeutic use of
miR-375 in the treatment of HCC (28). The present results suggest that the
dysregulated expression of miRNAs may alter the expression of
functional genes and the post-transcriptional regulation of HCC,
cell proliferation, apoptosis, differentiation and metastasis.
lncRNAs can regulate the expression of genes via
transcriptional regulation, chromatin modification,
post-transcriptional processing, genomic imprinting and the
regulation of protein functions (29). Recent studies have suggested that
lncRNAs may exert functions by targeting miRNAs (30,31). In
the present study, the regulatory associations were screened out
according to the corresponding associations of lncRNA and miRNA,
and of miRNA and mRNA. The regulatory network visualization was
performed for the screened corresponding associations. The
regulatory networks included 12 miRNAs, 113 mRNAs and 199 lncRNAs,
an example being the association between the lncRNA lnc-AC073263,
the miRNA hsa-miR-182-5p and the mRNA BDNF (Fig. 7A). Numerous studies have suggested
that lncRNAs and miRNAs may competitively reduce the expression of
mRNAs, which may cause tumor evolution and progression (32–34). For
example, HULC may downregulate a number of miRNAs, including
miR-372. Inhibition of miR-372 reduces the translational repression
of its target gene, PRKACB, which allows it to be expressed and
allows for its protein product to phosphorylate CREB (35). The interactions between lncRNAs
microRNAs and mRNAs, and their role during tumorigenesis, can
provide novel insights into the regulatory mechanisms that underlie
several classes of important ncRNAs in cancer.
The present study established a novel HCC network to
facilitate data mining. In addition, the present study conducted
functional module analysis within the network. However, further
analyses are required to unravel the roles and mechanisms of the
identified RNAs in the process of tumorigenesis and the development
in HCC. In conclusion, the present data provide a comprehensive
bioinformatic analysis of genes and pathways that may be involved
in the pathogenesis of HCC.
Acknowledgements
The present study was supported by grants from the
Technical New Star of Zhujiang, Pan Yu District, Guangzhou (nos.
2014-special-15-3.09 and 2013-special-15-6.09), the National
Natural Science Foundation of China (no. 81502557), the
Administration of Traditional Chinese Medicine of Guangdong
Province (no. 20151057), the Science and Technology Planning
Project of Guangdong Province (no. 2015110) and the Research Fund
of The First Affiliated Hospital of Jinan University (no.
2014106).
Competing interests
The authors declare that there are no competing
interests.
Glossary
Abbreviations
Abbreviations:
|
BP
|
biological process
|
|
CC
|
cellular component
|
|
DAVID
|
Database for Annotation,
Visualization, and Integrated Discovery
|
|
DEGs
|
differentially expressed genes
|
|
GO
|
gene ontology
|
|
KEGG
|
Kyoto Encyclopedia of Genes and
Genomes
|
|
lncRNAs
|
long non-coding RNAs
|
|
miRNAs
|
microRNAs
|
|
HCC
|
hepatocellular carcinoma
|
|
TCGA
|
The Cancer Genome Atlas
|
|
CC
|
cellular component
|
|
BP
|
biological process
|
References
|
1
|
Lim L, Balakrishnan A, Huskey N, Jones KD,
Jodari M, Ng R, Song G, Riordan J, Anderton B, Cheung ST, et al:
MicroRNA-494 within an oncogenic microRNA megacluster regulates
G1/S transition in liver tumorigenesis through suppression of
mutated in colorectal cancer. Hepatology. 59:202–215. 2014.
View Article : Google Scholar : PubMed/NCBI
|
|
2
|
Li H, An J, Wu M, Zheng Q, Gui X, Li T, Pu
H and Lu D: LncRNA HOTAIR promotes human liver cancer stem cell
malignant growth through downregulation of SETD2. Oncotarget.
6:27847–27864. 2014.
|
|
3
|
Huang JL, Zheng L, Hu YW and Wang Q:
Characteristics of long non-coding RNA and its relation to
hepatocellular carcinoma. Carcinogenesis. 35:507–514. 2014.
View Article : Google Scholar : PubMed/NCBI
|
|
4
|
Zhu W and Kan X: Neural network cascade
optimizes microRNA biomarker selection for nasopharyngeal cancer
prognosis. PLoS One. 9:e1105372014. View Article : Google Scholar : PubMed/NCBI
|
|
5
|
Kota J, Chivukula RR, O'Donnell KA,
Wentzel EA, Montgomery CL, Hwang HW, Chang TC, Vivekanandan P,
Torbenson M, Clark KR, et al: Therapeutic microRNA delivery
suppresses tumorigenesis in a murine liver cancer model. Cell.
137:1005–1017. 2009. View Article : Google Scholar : PubMed/NCBI
|
|
6
|
Gutschner T and Diederichs S: The
hallmarks of cancer: A long non-coding RNA point of view. RNA Biol.
9:703–719. 2012. View Article : Google Scholar : PubMed/NCBI
|
|
7
|
Chen G, Wang Z, Wang D, Qiu C, Liu M, Chen
X, Zhang Q, Yan G and Cui Q: LncRNA disease: A database for
long-non-coding RNA-associated diseases. Nucleic Acids Res.
41:D983–D986. 2013. View Article : Google Scholar : PubMed/NCBI
|
|
8
|
Geisler S and Coller J: RNA in unexpected
places: Long non-coding RNA functions in diverse cellular contexts.
Nat Rev Mol Cell Boil. 14:699–712. 2013. View Article : Google Scholar
|
|
9
|
Ellis BC, Graham LD and Molloy PL: CRNDE,
a long non-coding RNA responsive to insulin/IGF signaling,
regulates genes involved in central metabolism. Biochim Biophys
Acta. 1843:372–386. 2014. View Article : Google Scholar : PubMed/NCBI
|
|
10
|
Juan L, Wang G, Radovich M, Schneider BP,
Clare SE, Wang Y and Liu Y: Potential roles of microRNAs in
regulating long intergenic noncoding RNAs. BMC Med Genomics. 6
Suppl 1:S72013. View Article : Google Scholar : PubMed/NCBI
|
|
11
|
Anders S and Huber W: Differential
expression analysis for sequence count data. Genome Biol.
11:R1062010. View Article : Google Scholar : PubMed/NCBI
|
|
12
|
Robinson MD, McCarthy DJ and Smyth GK:
edgeR: A Bioconductor package for differential expression analysis
of digital gene expression data. Bioinformatics. 26:139–140. 2010.
View Article : Google Scholar : PubMed/NCBI
|
|
13
|
Huang da W, Sherman BT and Lempicki RA:
Bioinformatics enrichment tools: Paths toward the comprehensive
functional analysis of large gene lists. Nucleic Acids Res.
37:1–13. 2009. View Article : Google Scholar : PubMed/NCBI
|
|
14
|
Huang da W, Sherman BT and Lempicki RA:
Systematic and integrative analysis of large gene lists using DAVID
bioinformatics resources. Nat Protoc. 4:44–57. 2009. View Article : Google Scholar : PubMed/NCBI
|
|
15
|
Grimson A, Farh KK, Johnston WK,
Garrett-Engele P, Lim LP and Bartel DP: MicroRNA targeting
specificity in mammals: Determinants beyond seed pairing. Mol Cell.
27:91–105. 2007. View Article : Google Scholar : PubMed/NCBI
|
|
16
|
Betel D, Wilson M, Gabow A, Marks DS and
Sander C: The microRNA.org resource: Targets and expression.
Nucleic Acids Res. 36:D149–D153. 2008. View Article : Google Scholar : PubMed/NCBI
|
|
17
|
Wang X: miRDB: A microRNA target
prediction and functional annotation database with a wiki
interface. RNA. 14:1012–1017. 2008. View Article : Google Scholar : PubMed/NCBI
|
|
18
|
Krek A, Grün D, Poy MN, Wolf R, Rosenberg
L, Epstein EJ, MacMenamin P, da Piedade I, Gunsalus KC, Stoffel M
and Rajewsky N: Combinatorial microRNA target predictions. Nat
Genet. 37:495–500. 2005. View
Article : Google Scholar : PubMed/NCBI
|
|
19
|
Volders PJ, Helsens K, Wang X, Menten B,
Martens L, Gevaert K, Vandesompele J and Mestdagh P: LNCipedia: A
database for annotated human lncRNA transcript sequences and
structures. Nucleic Acids Res. 41:D246–D251. 2013. View Article : Google Scholar : PubMed/NCBI
|
|
20
|
Volders PJ, Verheggen K, Menschaert G,
Vandepoele K, Martens L, Vandesompele J and Mestdagh P: An update
on LNCipedia: A database for annotated human lncRNA sequences.
Nucleic Acids Res. 43:4363–4364. 2014. View Article : Google Scholar
|
|
21
|
Shannon P, Markiel A, Ozier O, Baliga NS,
Wang JT, Ramage D, Amin N, Schwikowski B and Ideker T: Cytoscape: A
software environment for integrated models of biomolecular
interaction networks. Genome Res. 13:2498–2504. 2003. View Article : Google Scholar : PubMed/NCBI
|
|
22
|
Kanehisa M, Araki M, Goto S, Hattori M,
Hirakawa M, Itoh M, Katayama T, Kawashima S, Okuda S, Tokimatsu T
and Yamanishi Y: KEGG for linking genomes to life and the
environment. Nucleic Acids Res. 36:D480–D484. 2008. View Article : Google Scholar : PubMed/NCBI
|
|
23
|
Braun R, Finney R, Yan C, Chen QR, Hu Y,
Edmonson M, Meerzaman D and Buetow K: Discovery analysis of TCGA
data reveals association between germline genotype and survival in
ovarian cancer patients. PLoS One. 8:e550372013. View Article : Google Scholar : PubMed/NCBI
|
|
24
|
Kim YK and Kim VN: Processing of intronic
microRNAs. EMBO J. 26:775–783. 2007. View Article : Google Scholar : PubMed/NCBI
|
|
25
|
Ling H, Fabbri M and Calin GA: MicroRNAs
and other non-coding RNAs as targets for anticancer drug
development. Nat Rev Drug Discov. 12:847–865. 2013. View Article : Google Scholar : PubMed/NCBI
|
|
26
|
Liang L, Wong CM, Ying Q, Fan DN, Huang S,
Ding J, Yao J, Yan M, Li J, Yao M, et al: MicroRNA-125b
suppressesed human liver cancer cell proliferation and metastasis
by directly targeting oncogene LIN28B2. Hepatology. 52:1731–1740.
2010. View Article : Google Scholar : PubMed/NCBI
|
|
27
|
Liu AM, Poon RT and Luk JM: MicroRNA-375
targets Hippo-signaling effector YAP in liver cancer and inhibits
tumor properties. Biochem Biophys Res Commun. 394:623–627. 2010.
View Article : Google Scholar : PubMed/NCBI
|
|
28
|
He XX, Chang Y, Meng FY, Wang MY, Xie QH,
Tang F, Li PY, Song YH and Lin JS: MicroRNA-375 targets AEG-1 in
hepatocellular carcinoma and suppresses liver cancer cell growth in
vitro and in vivo. Oncogene. 31:3357–3369. 2012. View Article : Google Scholar : PubMed/NCBI
|
|
29
|
Prensner JR and Chinnaiyan AM: The
emergence of lncRNAs in cancer biology. Cancer Discov. 1:391–407.
2011. View Article : Google Scholar : PubMed/NCBI
|
|
30
|
He JH, Zhang JZ, Han ZP, Wang L, Lv YB and
Li YG: Reciprocal regulation of PCGEM1 and miR-145 promote
proliferation of LNCaP prostate cancer cells. J Exp Clin Cancer
Res. 33:722014. View Article : Google Scholar : PubMed/NCBI
|
|
31
|
Bayoumi AS, Sayed A, Broskova Z, Teoh JP,
Wilson J, Su H, Tang YL and Kim IM: Crosstalk between long
noncoding RNAs and MicroRNAs in health and disease. Int J Mol Sci.
17:3562016. View Article : Google Scholar : PubMed/NCBI
|
|
32
|
He X, Tan X, Wang X, Jin H, Liu L, Ma L,
Yu H and Fan Z: C-Myc-activated long noncoding RNA CCAT1 promotes
colon cancer cell proliferation and invasion. Tumour Biol.
35:12181–12188. 2014. View Article : Google Scholar : PubMed/NCBI
|
|
33
|
Cesana M, Cacchiarelli D, Legnini I,
Santini T, Sthandier O, Chinappi M, Tramontano A and Bozzoni I: A
long noncoding RNA controls muscle differentiation by functioning
as a competing endogenous RNA. Cell. 147:358–369. 2011. View Article : Google Scholar : PubMed/NCBI
|
|
34
|
Wang K, Liu F, Zhou LY, Long B, Yuan SM,
Wang Y, Liu CY, Sun T, Zhang XJ and Li PF: The long noncoding RNA
CHRF regulates cardiac hypertrophy by targeting miR-489. Circ Res.
114:1377–1388. 2014. View Article : Google Scholar : PubMed/NCBI
|
|
35
|
Wang J, Liu X, Wu H, Ni P, Gu Z, Qiao Y,
Chen N, Sun F and Fan Q: CREB up-regulates long non-coding RNA,
HULC expression through interaction with microRNA-372 in liver
cancer. Nucleic Acids Res. 38:5366–5383. 2010. View Article : Google Scholar : PubMed/NCBI
|