Introduction
Lung cancer (LC) is a leading cause of
cancer-associated mortalities worldwide. Histologically, LC is
stratified into two categories, small cell lung cancer (SCLC) and
non-small cell lung cancer (NSCLC), of which the latter is more
prevalent (1). NSCLC can be further
classified into three major subtypes, where adenocarcinoma (AC) and
squamous cell carcinoma (SCC) together account for ~70% of the
total cases of LC (2). Since AC and
SCC differ in cell of origin, location within the lung, growth
pattern and molecular mechanisms, they are regarded as two distinct
diseases (3). Until recently,
however, NSCLC subtypes had been typically treated with same
therapeutic approaches (1). Apart
from a lack of timely detection of tumors, the administration of
homogenous treatments to NSCLC patients regardless of the histology
subtypes might account for why no substantial improvement in the
5-year survival rate of patients with NSCLC has been made over the
years (3,4). Therefore, more ‘personalized’
therapeutic strategies for AC and SCC patients are highly
desirable, which necessitates the identification of
subtype-specific prognostic molecular markers for AC and SCC.
Feature selection or variable selection, which aims
at selecting a gene signature (subset) among thousands of genes
with objectives, including diagnosis of diseases, segmentation of
disease subtypes and drug response or survival prediction for
patients, is currently becoming a routine practice in
bioinformatics (5,6). Regarding NSCLC, extensive efforts have
been devoted to distinguishing AC from SCC and also to distinguish
patients with good prognosis from those with poor prognosis with
the aid of feature selection algorithms (3,7–11). Compared with the diagnosis task or the
classification task, it has been demonstrated that the prognosis
task is more difficult to accomplish (12,13).
Furthermore, the present study focused on subtype-specific
prognosis, with extra consideration on subtype information to
introduce more complexity to statistical modeling. Subtype-specific
prognostic genes may be identified by either separate application
of a feature selection method to each subtype or by a modification
of an existing method to enable the identification of
subtype-specific prognostic genes (14). Compared with a separate modeling
method where feature selection algorithms that can handle survival
data (LASSO method and random forest method) was implemented on
each subtype, a natural extension is more theoretically sound but
accompanied with extra statistical complexity (15). The two feature selection algorithms,
the Cox filter method and the Cox-Threshold Gradient Descent
Regularization (Cox-TGDR) method (15,16),
belong to the natural extension category. (Both the Cox filter
method and the Cox-TGDR method were proposed by the authors). These
two methods are all based on the seminal model of survival
analysis: A Cox regression model (17).
Gene expression profiles contain grouping structure
with genes inside each group that are highly correlated and
therefore more likely to co-function together to affect biological
processes (18,19). However, both the Cox filter method and
the Cox-TGDR method are typical gene-based feature selection
methods where the underlying grouping structure is ignored
(20). By contrast, a pathway-based
feature selection method incorporates the grouping structure either
explicitly or implicitly to guide the selection of relevant genes
(21). Many studies have demonstrated
that a pathway-based feature selection method is usually superior
to its gene-based counterpart in terms of predictive capacity,
model stability and biological interpretation (21–25).
Furthermore, a failure to account for the
correlations among genes may result in many ‘redundant’ genes being
included, and therefore an increase in the false positive rate. As
the Cox filter method screens the relevant genes individually (see
the Materials and Methods section for details), it has no control
over the false positive rate. The simulations conducted in previous
studies (15,16) have justified this point. Until the
drawback of false positive rate is fully addressed, the widespread
application of the Cox filter method remains challenging.
In this article, the Cox filter method was extended
so that the resulting extension not only accounts for the
interactions/dependency among genes but also eliminates many
redundant genes. The GeneRank method (26) was employed to pre-filter genes and
subsequently average correlation coefficients were calculated to
determine the correlation of a specific gene with other genes in
the search space. Given that the GeneRank method was also used to
pre-filter genes in a previous study by the present authors
(14), these two studies have some
similarities. Nevertheless, the objectives of the studies differ
dramatically. The aim of the previous study (14) was to illustrate that for different
outcomes of interest (e.g., segmentation of different subtypes
versus predicted survival time), the corresponding relevant genes
differ and therefore a supervised learning method is preferred over
an unsupervised method. By contrast, the present study focuses on
the identification of subtype-specific gene signatures.
After the proposed procedure was applied to the
NSCLC gene expression data and compared with several relevant
algorithms, whether the proposed procedure can identify gene
signatures with better predictive performance and more meaningful
biological implication than other methods was determined.
Materials and methods
Experimental data
The microarray data included GSE30219, GSE37745 and
GSE50081 datasets, which were publicly assessable from the Gene
Expression Omnibus (GEO, https://www.ncbi.nlm.nih.gov/geo/) repository. The
inclusion criteria were: i) Being profiled on the Affymetrix
HG-U133 Plus 2.0 platform; ii) inclusion of AC and SCC subtypes;
iii) inclusion of early pathological stages (stage I or II); iv) no
administration of adjuvant therapy to patients; and v) availability
of the raw data so that the same pre-processing procedure was used
to obtain the gene expression values. There were 85 AC and 21 SCC
patients, 40 AC and 24 SCC patients, 127 AC and 42 SCC patients in
GSE30219, GSE37745 and GSE50081, respectively. In total, there were
339 patients in the integrated dataset that combined these three
datasets together, which served as the training set in the present
study.
The RNA-Seq data were downloaded from The Cancer
Genome Atlas Data Portal (level 3) (https://tcga-data.nci.nih.gov/tcga/). The cohorts that
were considered are: LUAD for AC subtype and LUSC for SCC subtype.
By restricting the patients to those at early stages of disease,
not undergone any adjuvant treatment and where survival information
was available, 70 AC and 55 SCC patients were included.
Pre-processing procedures
Raw data (CEL files) of the microarray data sets
were downloaded from the GEO repository. The expression values were
obtained using the fRMA algorithm (27) and were normalized using quantile
normalization separately for each experiment. Then, the expression
values of these three studies were combined together and the COMBAT
algorithm (28) was used to eliminate
the potential batch effects. The resulting data served as the
training set and were referred to as the integrated dataset.
Counts-per-million (CPM) values for the RNA-seq data
were calculated and log2 transformed by Voom function
(29) in R limma package (30). The RNA-seq data were used as the test
set to validate the performance of resulting prognostic signatures.
There were 14,573 unique genes annotated by both the microarray
data and the RNA-seq data. The protein-to-protein interaction
information was retrieved from the Human Protein Reference Database
(HPRD, http://www.hprd.org). There were 9,672
protein-coding genes annotated by the HPRD database (Release 9).
The downstream analysis was carried out using the overlapped 8,023
genes annotated by the microarray data, the RNA-seq data and the
HPRD database. Compared with a previous study by the authors, the
training set and the total genes under consideration were different
in the present study. Specifically, the data from GSE50081
experiment were used to train the prognostic signatures, and a
number of pre-filtering steps were performed to downsize the number
of genes under consideration in the microarray data to 6,202
(16).
Statistical methods
Cox filter method. The Cox filter method (16) was used to identify genes that were
informative of survival rate for AC/SCC histology subtypes. In this
method, each gene was fit with a Cox model. The hazard function of
patient i for gene g (g=1,…,p) is given by:
λijg(t)=λ0g(t)exp(β1gI(j=SCC)+β2gXijg+β3gI(j=SCC)×Xijg)
where,
Xij=(Xij1,…,Xijp)T
represents the actual expression values for the p genes
under consideration and λ0g(t) is an unknown baseline
hazard function. I (j=SCC) is an indicator, it takes the value of 1
if the histology subtype j of patient i is SCC or
otherwise the value of 0. The values of βACg
(i.e., β2g) and βSCCg (i.e.,
β2g+β3g) determine if
subtype-specific prognostic genes exist. Specifically,
βACg≠0 but βSCCg=0 corresponds to an
AC-specific gene while βSCCg≠0 but βACg=0
corresponds to an SCC-specific gene.
GeneRank
The GeneRank method (26) calculates ranks for genes by accounting
for both the gene expression values and the connectivity
information among them. Firstly, according to whether a connection
is recorded between genes in the HPRD database, a pxp adjacency
matrix was made (here, p is the number of genes under
consideration) whose ijth and jith components are 1 if gene i and
gene j are connected, 0 otherwise. Then, the GeneRank method solves
the following equation:
(I–dWD1–)r=(1–d)exp
where W stands for the adjacency matrix of
genes, and D is a diagonal matrix, where diagonal components
record the number of genes that a specific gene is connected to in
the gene network graph. The gene expression value is represented by
exp. In the GeneRank method, d is a tuning parameter,
balancing the effect of the expression value of a gene and its
level of importance inside the whole gene-to-gene interaction
network. The gene expression values only determine the ranks of the
genes when d equals to 0. On the other hand, the GeneRanks
depend completely on the connectivity level of genes when d=1. The
default value of d is 0.5.
In the present study, the ranks generated by the
GeneRank method were used to rearrange genes in the ascending order
and then the search domain was restricted to the top ranked genes
in the resulting list. With this filter, the least important genes
in both pathway connectivity and expression difference were ruled
out.
Redundant gene elimination
To eliminate the redundant genes, which are highly
correlated with the true causal genes and therefore tend to be also
selected by a feature selection algorithm, particularly a filter
method, a method proposed previously (31) was adopted to account for the
correlation coefficients between genes during the filtering
process. Specifically, the average correlation coefficient between
a candidate gene g and other genes in the restricted search space
was calculated as follows:
corgs=∑j=1|s||cor(g, j)||S|
where, |cor(g.j)| represents the absolute
value of Pearson's correlation coefficient (PCC) between gene
g and gene j, and |S| is the total number of genes in
the search space. Then, a gene is regarded to be relevant if it
fits two conditions: i) its corresponding adjusted P-values of the
Cox filter model are <0.05. (The BH procedure was used to adjust
for multiple comparison problem); and ii) its average absolute
correlation coefficients in the search space are <0.2. With the
second restriction, i.e., the restriction on the average PCC value
of a gene, some control over the redundant genes is provided.
Originally, a new statistic was defined that multiplied the
adjusted P-value by corgs for gene g, and this
was used to determine the significance level of genes. The newly
defined statistic was named as RRP (P-value with redundant gene
removal). However, it is realized that RRP has some fatal
drawbacks. For instance, if the PCCs of a gene with other genes in
the search space are all close to 0, then its RRP is extremely
small although the P-value in the Cox filter model for this
specific gene is 1. As a result, the RRP statistic had been
overruled.
Sign average
A regression model would become non-identifiable
when the number of covariates exceeds the number of samples. To
avoid this, the risk profile of a patient was summarized as the
sign average (13,32) of the expression values over all
selected genes. Specifically for each subtype, all genes inside the
selected gene subset, i.e., the AC-specific and SCC-specific
prognostic genes are stratified into either the hazardous group H
or the preventive group P according to the signs of their estimated
effects in the Cox filter method, i.e., β2g for
AC and β2g+β3g for SCC. In the
hazardous group, the genes for which increased expression is
associated with a higher hazard are included. Conversely, the genes
for which an increment in expression is associated with a lower
hazard of mortality are put in the preventive group. Of note, there
are two sets of notations, i.e., HAC in which
β2g >0 and PAC in which
β2g <0 for AC patients, and HSCC in
which β2g+β3g >0 and
PSCC in which
β2g+β3g <0 for SCC patients
in the present study. Denoting the number of genes inside the gene
set GS as |GS|, the sign average for AC patient i(i=1,…,
n1) and SCC patient j (j= n1+1,…, n) is
defined respectively as:
sign_avei=∑g=1|AC|sign(βˆ2g)×Xigsign_avej=∑g=1|SCC|sign(βˆ2g+βˆ3g)×Xig
Statistical metrics
The first metric used to evaluate the performance of
a resulting prognostic gene signature is the censoring-adjusted
C-statistic (33) over the follow-up
period (0, τ). It is defined as:
Cτ(β)=P(g(Xi)>g(Xj)|Ti<Tj,Ti<τ)
where g(X) is the risk score for a subject with
predictor vector X. Although a value of 0.5 for the C-index
corresponds to the random guess model, a moderate value in between
0.6–0.7 already indicates a satisfactory performance as discussed
previously (34).
In order to evaluate the stability or robustness of
the resulting signatures, a Rand index was also calculated. With
k runs (e.g., the resulting gene lists by training on
k different datasets) of an algorithm, the Rand index is
defined as
rand=2k(k–1)∑i=1k–1∑j=i+1k∩|gsi,gsj|∪|gsi,gsj|
where ∩ represents the size of intersection between
two gene lists, and ∪ represents the size of union between two gene
subsets gsi and gsj, where
gsi and gsj were obtained from
the ith and jth runs, respectively. Given the present
study aims to select subtype-specific prognostic genes for AC and
SCC, these metrics were calculated separately for AC and SCC.
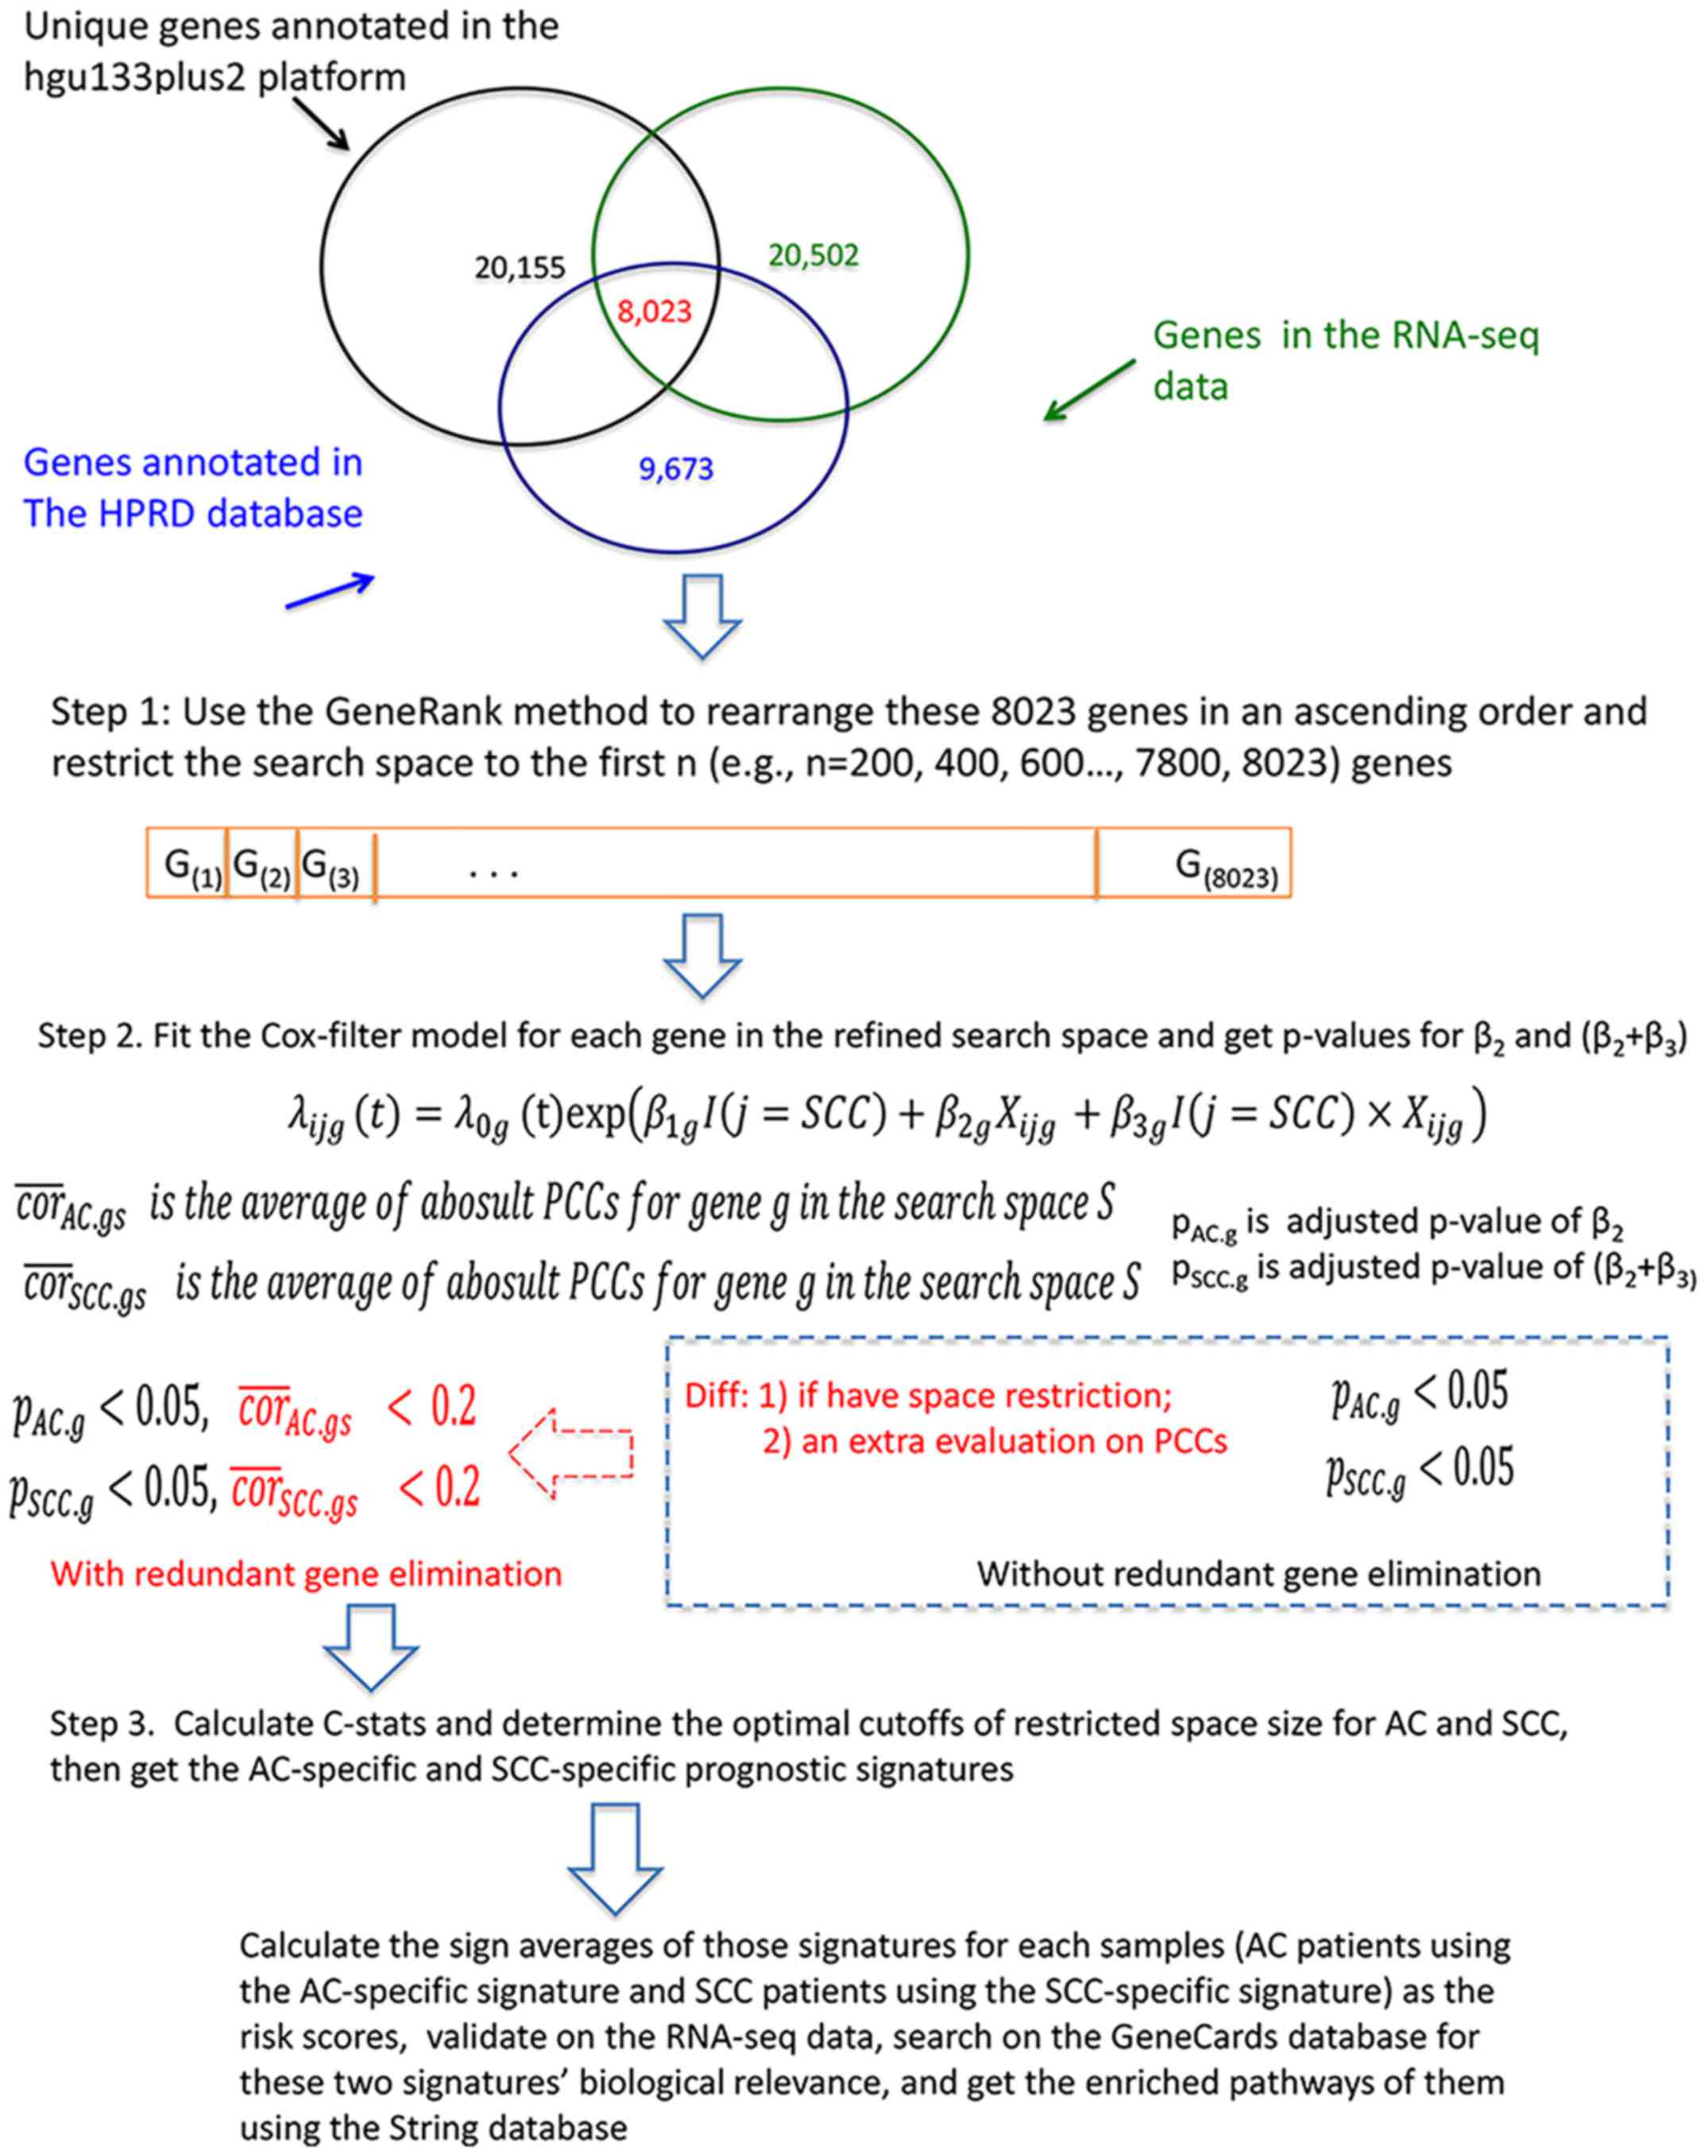
The proposed procedure consisted of three steps.
Firstly, all 8,023 genes were ranked in the ascending order
according to their GeneRanks. Secondly, for a specific k
value (k varies from 200 to 7,800 with an increment of 200
to 8,023), the search space (the number of genes under
consideration) was restricted to those on the top k of this
ordered gene list, and the corresponding adjusted P-values for
β2 and (β2+β3) coefficients
for a gene and the absolute average of its correlation coefficients
with other genes in the search space were considered together to
select prognostic genes for AC and SCC. Finally, the sign averages
for AC- and SCC-specific genes and the performance statistics were
calculated. Steps 2 and 3 were repeated over all possible k
values. The optimal k value for AC and SCC subtypes is the
one with the largest C-statistics and the smallest sizes of the
resulting gene signatures on the training set. Fig. 1 illustrates the proposed procedure,
which is referred to as the Cox filter method with redundant gene
elimination (RGE) herein.
The proposed procedure first imposed search space
restriction and subsequently removed redundant genes inside the
restricted search space. One may argue a procedure in the reverse
order, i.e., the removal of redundant genes followed by search
space restriction, may lead to same or at least similar results.
However, conducting redundant gene elimination first may result in
the remaining genes being almost uncorrelated with each other. The
connectivity weights of those genes are approximately at the same
level, and the rearrangement of genes according to GeneRanks
becomes meaningless. This method also does not take into
consideration pathway information, Alternatively, a strategy
instead of a combination of the GeneRank method and redundant gene
elimination may be employed. However, this was not investigated as
it is beyond the scope of the present study.
Biological relevance and gene set
enrichment analysis
The GeneCards database (www.genecards.org) was used to search for the
biological relevance of the selected genes, and the String software
(www.string-db.org) was used to obtain
enriched pathways/gene sets for the AC-specific and SCC-specific
prognostic signatures.
Statistical language and packages
R language (version 3.2; www.r-project.org) was used to carry out all
statistical analysis in the present study. The R packages used
included survival, survAUC, gelnet, pathClass, limma, annotation,
affy and hgu133plus2.db.
Results
In the present study, the integrated data of three
microarray experiments were used to train the final models. The
performance of the resulting prognostic signatures was validated on
the RNA-Seq dataset, which is independent from the microarray
datasets. Firstly, Schoenfeld residuals were calculated to test the
proportional hazards assumption of the Cox models. The P-values for
those tests ranged from 0.003 to 0.9999; P<0.05 for 141 values
and P<0.01 for 27 values. These numbers were <5% and 1% of
the total number of genes. Therefore, the proportional hazard
assumption is valid in the present study.
The C-statistics and the model sizes on the
training set are given in Fig. 2.
Based on these two statistics, the resulting signatures of the
first 1,000 genes for AC and the first 4,000 genes for SCC were
chosen and presented in Table I. In
the same table, the performance statistics for the Cox filter
method (15) with search space
restriction but without redundant gene elimination, the Cox filter
method with redundant gene elimination but no space restriction and
the original Cox filter method (corresponding to the Cox filter
method without both redundant gene elimination and space
restriction) and two other relevant algorithms (the Cox-TGDR method
(16) and the LASSO (35) for AC and SCC, respectively) were also
listed.
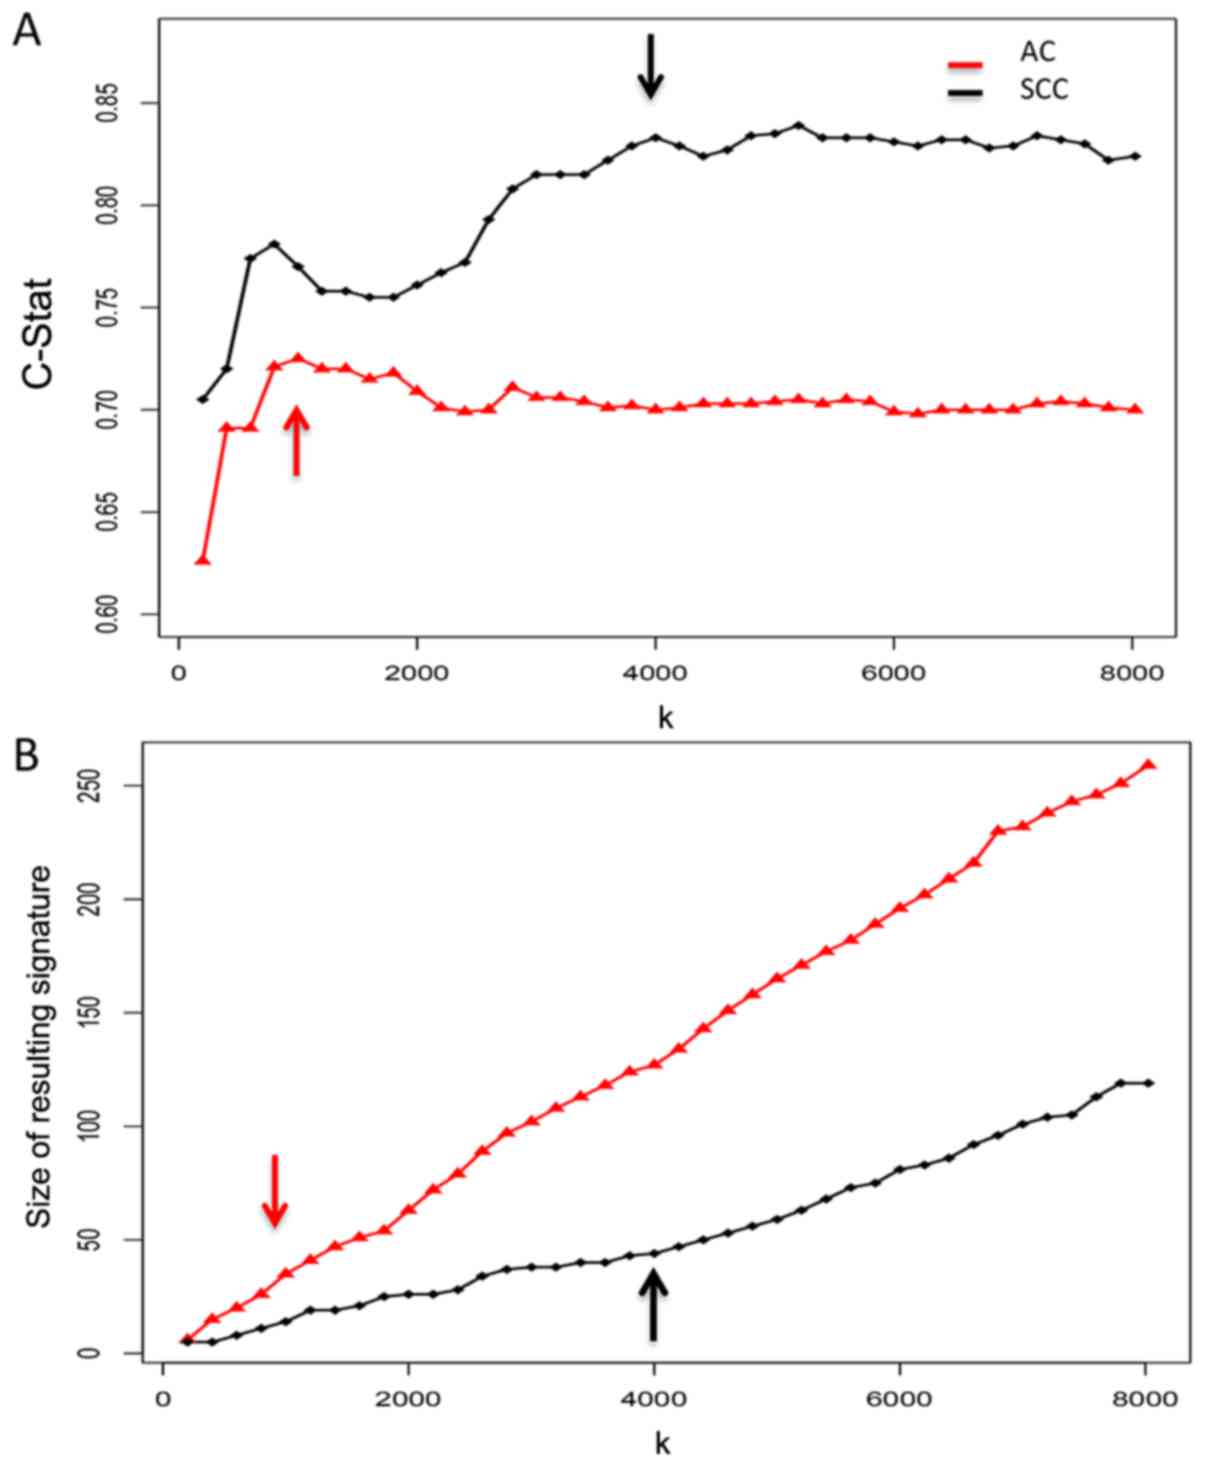 | Figure 2.Determination of the optimal cutoffs
for AC subtype and SCC subtype search spaces by training of the
NSCLC microarray data: (A) The C-statistic under all scenarios
(with k taking different values, i.e., k=200, 400,
…7800, 8023; (B) The sizes of resulting prognostic signatures under
all scenarios. The C-statistic and the final sizes determine the
optimal cutoffs for the restricted search space of AC and SCC,
respectively, i.e., the one with the largest C-index and the
smallest final model size was chosen. AC, adenocarcinoma; NSCLC,
non-small cell lung cancer; SCC, squamous cell carcinoma. |
 | Table I.Performance statistics for the
non-small cell lung cancer application using different
algorithms. |
Table I.
Performance statistics for the
non-small cell lung cancer application using different
algorithms.
|
|
|
| C-statistics |
|---|
|
|
|
|
|
|---|
| Variable | Size | Rand index (%) | Training set | Test set |
|---|
|
G(1)~G(1000) + RGE:
AC | 35 | 26.97 | 0.725 | 0.694 |
|
G(1)~G(4000) +RGE:
SCC | 44 | 16.84 | 0.833 | 0.817 |
|
G(1)~G(1000):
AC | 45 | 26.04 | 0.703 | 0.714 |
|
G(1)~G(4000):
SCC | 380 | 26.91 | 0.702 | 0.771 |
| Cox-filter +RGE:
AC | 259 | 16.67 | 0.699 | 0.610 |
| Cox-filter +RGE:
SCC | 119 | 15.44 | 0.824 | 0.805 |
| Cox-filter: AC | 329 | 24.05 | 0.681 | 0.538 |
| Cox-filter:
SCC | 836 | 27.85 | 0.714 | 0.778 |
| Cox-TGDR: AC | 62 | 7.78 | 0.684 | 0.559 |
| Cox-TGDR: SCC | 76 | 5.77 | 0.721 | 0.567 |
| LASSO: AC | 9 | 14.87 | 0.724 | 0.583 |
| LASSO: SCC | 10 | 12.39 | 0.814 | 0.706 |
The most important finding is that the additional
redundant gene elimination indicates significant gains in terms of
performance statistics, i.e., better C-statistics and smaller sizes
of the resulting signatures, which is in consistent with the
findings of other investigators (31,36). Of
note, it is usually common that the test set has a poorer
performance compared with the training set, due to the following
reasons: i) The different characteristics among patients in the
training set and the test set; or/and ii) the potential of
over-fitting. Given a moderate value of >0.6 for the C-index is
regarded to have a satisfactory performance (33), the predictive performances of the
resulting prognostic signatures obtained by the proposed procedure
are all acceptable. Furthermore, the training set used previously
(i.e., the data of GSE50081) has a moderate sample size. To date, a
perfect performance has not been achieved with the test set using
this specific training set (14–16). To
address this, two additional microarray experiments were included,
and the training set used in the present study is a combination of
all three studies. The resulting signatures trained from the
integrated data outperform the signatures from GSE50081.
Another finding is that with a suitable restriction
on the search space, the resulting prognostic signatures tend to
have a better performance than those without such a restriction (as
shown in Table I and Fig. 2). This supports the use of a
pre-filtering process (e.g., ranking genes using the GeneRank
method on expression levels and importance level in the gene
network following by selecting the top genes in the resulting list)
prior to downstream analysis. A pre-filtering process may screen
out the genes that are highly unlikely to be relevant genes and
thus reduces the computing burden. Compared with other relevant
algorithms, the Cox filter method has the best performance. The Cox
filter method is easier to implement and more computationally
efficient than the Cox-TGDR method, which may make the advantage of
a pre-filtering procedure with regards to reducing the computing
burden less obvious. However, the present authors do not exclude
the probability that the Cox-TGDR method is optimal for some
specific data structures, and therefore such an advantage is more
essential in those applications.
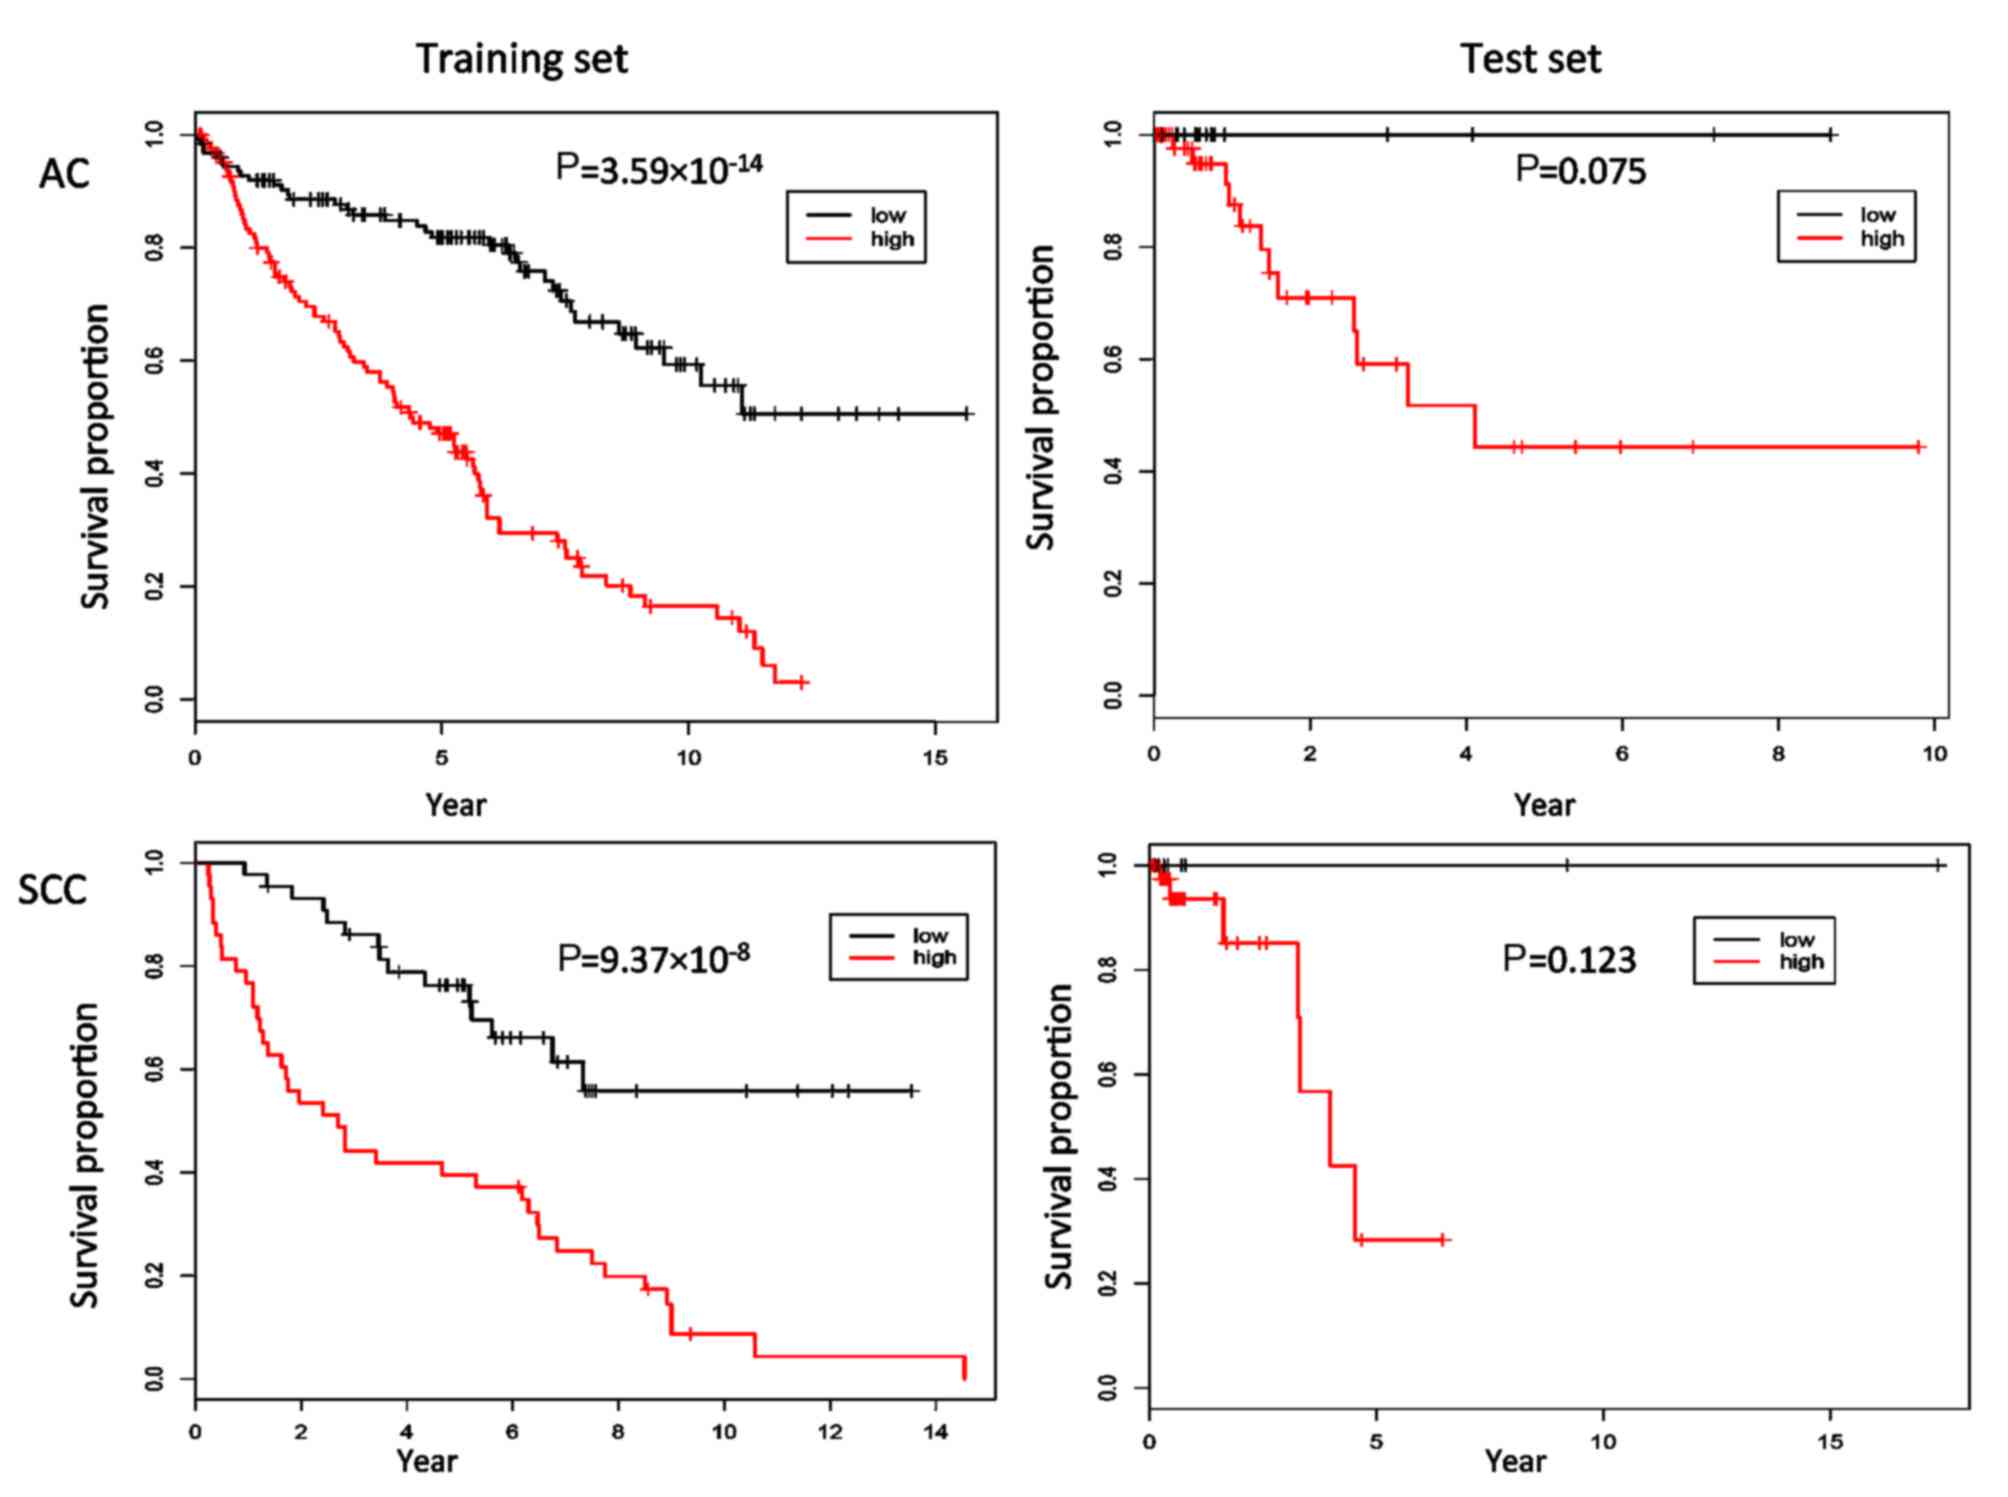
The patients were stratified into two
groups-patients with a high risk of mortality and those with a low
risk of mortality-by using the median values of the resulting sign
average scores for the patients in the training set. Then, the
Kaplan-Meier curves were constructed (Fig. 3), and the two curves were compared
using log-rank tests. In the training set, the P-values of the
corresponding log-rank tests were 3.59×10⁻¹⁴ for AC and
9.37×10⁻⁸ for SCC, respectively. However, the
corresponding P-values were 0.075 and 0.123 in the test set,
indicating a statistically non-significant difference between the
survival curves of the high-risk and low-risk groups. Furthermore,
other cutoffs (mean, the first and third quartiles) were used, and
the results remained the same. Given there were few mortalities
recorded for the RNA-seq data and there were no mortalities in the
identified low-risk groups, the predictive performance evaluated on
the basis of the log-rank tests is still acceptable.
For the 35-gene AC-specific prognostic signature
and the 44-gene SCC-specific prognostic signature, the GeneCards
database was searched for the biological relevance of these
selected genes. According to the GeneCards database, CYP1A2, EGAG9,
BRDT, DDC, ADCYAP1R1, PIWIL4, CENT2, TACR1, ABCA2 and NEFH are
directly associated with LC. EGAG9, CYP1A2, CRISP3, BRDT, BRSK1,
DDC, TACR1, ABCA2, CTNNA3, CCNO, TAC3 and CA6 are directly
associated with AC among the AC-specific signatures. Among the
SCC-specific signatures, CP19A1, CYP3A4, KLF2, ACLY, MASP1, SOX18,
SERPINE2, BHLHE41, PDYN, FGF4, NUAK1, GCNT1, CCT4 and EBNA1BP2 are
directly associated with LC. FGF4, CYP19A1, PTPN2, CYP3A4,
SERPINE2, SOX18, MMP20, MASP1, KLF2, ERP44, NUAK1 and RAET1E are
directly associated with SCC. All respective remaining genes in
each category were indirectly associated with LC, AC and SCC. Among
the indirectly related genes, many genes were associated with the
corresponding diseases through their association with the
well-known cancer gene: TP53. Additionally, there was no overlap
between the AC-specific and SCC-specific prognostic signatures.
Likewise, there was no overlap between the AC-specific prognostic
and SCC-specific prognostic signatures when the LASSO method
implemented separately for each subtype. By contrast, there were
substantial overlaps (32/106, 30.19%) between the AC-specific
prognostic signature and the SCC-specific prognostic signature when
the Cox-TGDR method was used. The resulting prognostic signatures
by the proposed procedure, the Cox-TGDR and the separate LASSO
analysis are listed in Table II. The
overlapping signatures as identified by the LASSO method, the
Cox-TGDR method and the proposed procedure for AC and SCC are
presented in Fig. 4.
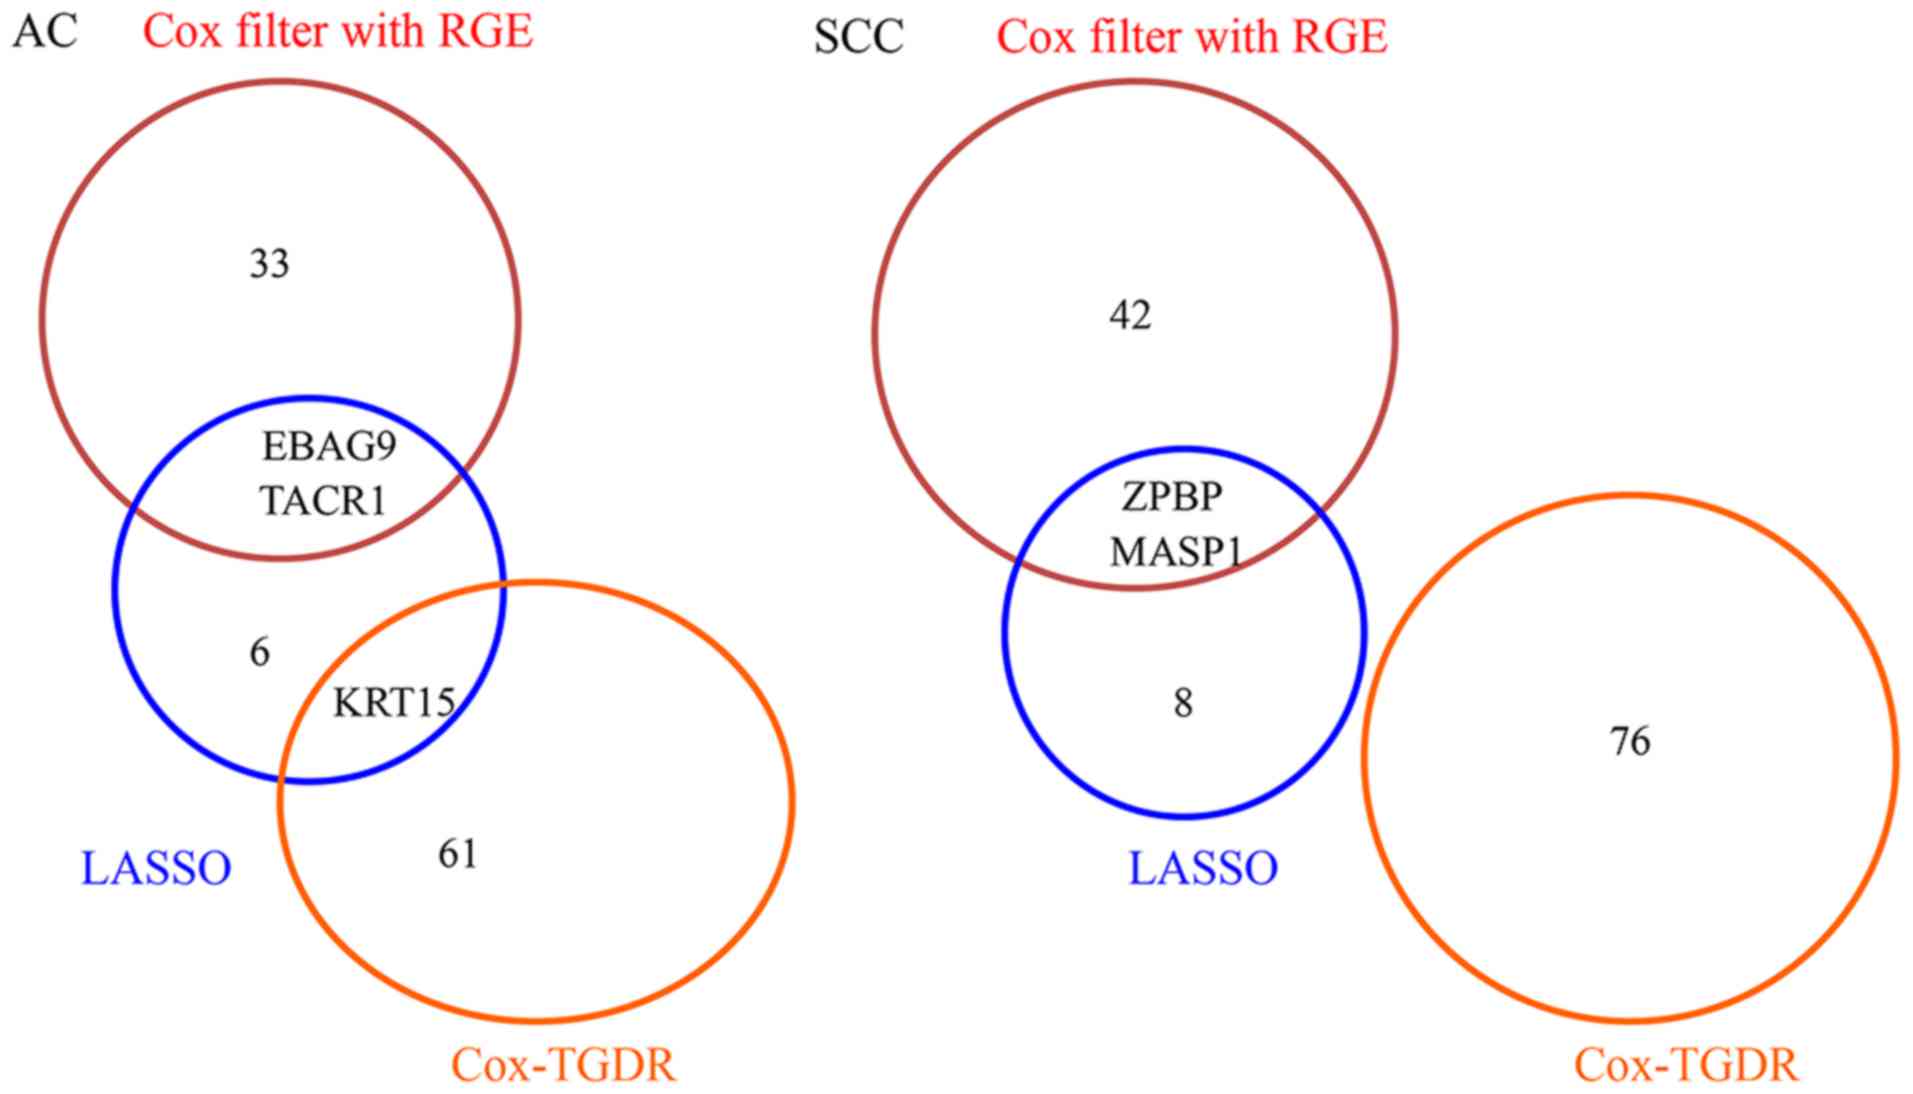 | Figure 4.Venn-diagrams of the respective
AC-specific and SCC-specific prognostic signatures as selected by
the proposed method, the Cox-TGDR method and the LASSO method.
These two Venn-diagrams showed there were no or few overlaps
between the signatures selected by different feature selection
methods. AC, lung adenocarcinoma; EBAG9, estrogen receptor binding
site associated, antigen, 9; KRT15, keratin 15; MASP1, mannan
binding lectin serine peptidase 1; RGE, redundant gene elimination;
SCC, lung squamous cell carcinoma; TACR1, tachykinin receptor 1;
TGDR, Threshold Gradient Descent Regularization; ZBP1, Z-DNA
binding protein 1. |
| Table II.Resulting prognostic gene signatures
by the proposed procedure, the Cox-TGDR method and the separate
LASSO analysis for each subtype. |
Table II.
Resulting prognostic gene signatures
by the proposed procedure, the Cox-TGDR method and the separate
LASSO analysis for each subtype.
| Cox filter with
RGE | LASSO | Cox-TGDR |
|---|
|
|
|
|---|
| AC-specific
(44.3%) | SCC-specific
(55.7%) | AC-specific
(47.4%) | SCC-specific
(52.6%) | AC-specific
(28.3%) | SCC-specific
(41.5%) | Overlapped
genesa (30.2%) |
|---|
| N4BP3 | PASK | EBAG9 | ZPBP | ELSPBP1 | N4BP3 | COMMD6 |
| NLRP4 | EIF1AY | KRT15 | TENC1 | AKAP4 | GNRHR | DR1 |
| ADCYAP1R1 | SLC22A9 | TACR1 | RAD50 | RHOD | PAH | MICALCL |
| GRM6 | ZNF518A | FCER1A | CRYAA | CD177 | MBD6 | PRMT6 |
| ERMAP | CYP3A4 | C6orf203 | MASP1 | ALOX12B | VAV2 | SEMA3A |
| GRK7 | PLAC8 | WNT7A | IL1A | MMP3 | APIP | IBTK |
| TACR1 | EBNA1BP2 | ENG | SATB1 | ACTR1B | RDX | HUS1B |
| CTNNA3 | NYNRIN | LMTK2 | CDH5 | ABCC2 | CLNK | DDB2 |
| PAH | BHLHE41 |
NF2 | TMF1 | TTPAL | SLC1A6 | RNF32 |
| CCNO | EVC2 |
| AKT1 | DNAJB2 | STXBP6 | PPCDC |
| RAB3C | NCOA7 |
|
| SLC6A2 | HIST1H1C | ZNF91 |
| CA6 | NUAK1 |
|
| PKP1 | LMX1A | DRD4 |
| SPINK5 | CPN2 |
|
| GCNT1 | GPR26 | IL5RA |
| PIWIL4 | CYP19A1 |
|
| STRA13 | RAPSN | ASCL2 |
| RABGAP1 | BCAP29 |
|
| NUMA1 | PSMF1 | GABARAPL1 |
| SLC22A4 | KCNJ8 |
|
| IL1F10 | EPHA4 | NRG1 |
| NEURL2 | FAM115A |
|
| E2F2 | UPK2 | GTF2A1L |
| SNX24 | CKAP2 |
|
| SLC2A4 | RGS13 | PRLHR |
| BRDT | KLF2 |
|
| RNF220 | NUP88 | DCP1B |
| NEFH | SOX18 |
|
| AP4E1 | RRP1B | NUP205 |
| PLCD4 | ANKRD7 |
|
| LSM10 | FUBP3 | PLEKHG4 |
| ABCA2 | PKN2 |
|
| CPSF7 | NFIB | EMB |
| DDC | FGF4 |
|
| TRIM63 | KRT85 | ADAM2 |
| CRISP3 | PTPN2 |
|
| ALOX12 | RAD52 | SSR4 |
| SIRPB1 | GCNT1 |
|
| CEACAM3 | PRKAG1 | FAM71C |
| CWC25 | GABRA4 |
|
| CARD16 | CD3EAP | KRT2 |
| AAGAB | TAF1B |
|
| COL23A1 | ARG1 | SIM1 |
| SAP30L | CCT4 |
|
| SARS2 | KCNA10 | PAPPA2 |
| FBXO44 | CCDC42 |
|
| PITX1 | FGF10 | EPB41L1 |
| EBAG9 | BFSP2 |
|
| NGFR | ZNF417 | PAIP2B |
| BRSK1 | ZFAND5 |
|
|
| MAP4 | TM4SF1 |
| GABRB1 | SERPINE2 |
|
|
| ATG4B | KRT15 |
| CYP1A2 | RBM11 |
|
|
| FANCC |
|
| CETN2 | PDYN |
|
|
| JDP2 |
|
| TAC3 | PGS1 |
|
|
| EIF2B1 |
|
|
| RAET1E |
|
|
| KLK6 |
|
|
| RYR3 |
|
|
| LINGO1 |
|
|
| ZPBP |
|
|
| RFXAP |
|
|
| SLC17A1 |
|
|
| ZBTB25 |
|
|
| ACLY |
|
|
| IL5 |
|
|
| MMP20 |
|
|
| S100A1 |
|
|
| NUDT5 |
|
|
| BIRC3 |
|
|
| ERP44 |
|
|
| GRIN2B |
|
|
| MASP1 |
|
|
| FBXW7 |
|
Given there was no overlap between the AC-specific
and SCC-specific prognostic signatures, how these signatures
intersected at the pathway level was examined. Using the String
software, enriched pathways/gene sets for the AC-specific
prognostic SCC-specific prognostic signatures were searched
separately. Using the default cutoff value of 0.05 for the False
Discovery Rate (FDR), there were 5 GO Biological Process (BP)
terms, 1 GO Molecular Function (MF) terms, 4 GO Cellular Component
(CC) terms and 0 KEGG pathways that were significantly enriched by
the AC-specific prognostic genes, respectively. These sets of gene
are listed in Table III. By
contrast, there were 11 BP terms, 0 MF terms, 23 CC terms and 2
KEGG pathways that were significantly enriched for the SCC-specific
genes. The enriched gene sets for the SCC-specific prognostic
signature are listed in Table IV.
Furthermore, there was no overlap between the enriched gene sets
for AC and SCC, indicating the pathways enriched by the
subtype-specific genes differ. With redundant gene elimination, the
identified AC-specific and SCC-specific signatures differ
completely at the levels of genes and pathways. By contrast,
without redundant gene elimination, there were substantial overlaps
between the identified signatures, which suggest redundant gene
elimination is beneficial for identifying those genes that are
specific for a particular subtype.
| Table III.Enriched GO terms and Kyoto
Encyclopedia of Genes and Genomes pathways using the 35-gene lung
adenocarcinoma-specific prognostic signature. |
Table III.
Enriched GO terms and Kyoto
Encyclopedia of Genes and Genomes pathways using the 35-gene lung
adenocarcinoma-specific prognostic signature.
| Pathway ID | Pathway
description | FDR |
|---|
| Cellular
component |
|
|
|
GO.0002199 | Zona pellucida
receptor complex |
4.84×10⁻¹⁴ |
|
GO.0005832 |
Chaperonin-containing T-complex |
8.25×10⁻¹² |
|
GO.0044297 | Cell body |
3.66×10⁻⁴ |
|
GO.0005874 | Microtubule |
5.04×10⁻³ |
| Biological
process |
|
|
|
GO.0007339 | Binding of sperm to
zona pellucida |
1.39×10⁻⁸ |
|
GO.1901998 | Toxin
transport |
1.50×10⁻⁶ |
|
GO.0051084 | De novo
posttranslational protein folding |
3.32×10⁻⁶ |
|
GO.0007338 | Single
fertilization |
6.64×10⁻⁶ |
|
GO.0006457 | Protein
folding |
5.19×10⁻⁴ |
| Molecular
function |
|
|
|
GO.0051082 | Unfolded protein
binding |
2.37×10⁻³ |
| Table IV.Enriched GO terms and KEGG pathways
using the 44-gene SCC subtype specific prognostic signature. |
Table IV.
Enriched GO terms and KEGG pathways
using the 44-gene SCC subtype specific prognostic signature.
| Pathway ID | Pathway
description | FDR |
|---|
| Cellular
component |
|
|
|
GO.0005681 | Spliceosomal
complex |
1.12×10⁻¹³ |
|
GO.0071013 | Catalytic step 2
spliceosome |
5.34×10⁻¹² |
|
GO.0030529 | Ribonucleoprotein
complex |
2.33×10⁻⁷ |
|
GO.0071942 | XPC complex |
7.11×10⁻⁶ |
|
GO.0097525 | Spliceosomal snRNP
complex |
9.11×10⁻⁶ |
|
GO.0005686 | U2 snRNP |
2.25×10⁻⁴ |
|
GO.0016607 | Nuclear speck |
1.37×10⁻³ |
|
GO.0005654 | Nucleoplasm |
4.32×10⁻³ |
|
GO.0044428 | Nuclear part |
4.32×10⁻³ |
|
GO.0000974 | Prp19 complex |
5.58×10⁻³ |
|
GO.0005684 | U2-type
spliceosomal complex |
1.66×10⁻² |
|
GO.0043227 | Membrane-bounded
organelle |
1.68×10⁻² |
|
GO.0032991 | Macromolecular
complex |
1.76×10⁻² |
|
GO.0043226 | Organelle |
1.76×10⁻² |
|
GO.0044424 | Intracellular
part |
1.76×10⁻² |
|
GO.0031981 | Nuclear lumen |
2.31×10⁻² |
|
GO.0097458 | Neuron part |
2.40×10⁻² |
|
GO.0031410 | Cytoplasmic
vesicle |
2.49×10⁻² |
|
GO.0044446 | Intracellular
organelle part |
2.49×10⁻² |
|
GO.0005622 | Intracellular |
3.01×10⁻² |
|
GO.0016023 | Cytoplasmic
membrane-bounded vesicle |
4.67×10⁻² |
|
GO.0036477 | Somatodendritic
compartment |
4.67×10⁻² |
|
GO.0043231 | Intracellular
membrane-bounded organelle |
4.67×10⁻² |
| Biological
process |
|
|
|
GO.0000398 | mRNA splicing, via
spliceosome |
3.62×10⁻¹¹ |
|
GO.0008380 | RNA splicing |
2.74×10⁻¹⁰ |
|
GO.0006397 | mRNA
processing |
2.33×10⁻⁹ |
|
GO.0007217 | Tachykinin receptor
signaling pathway |
2.60×10⁻⁹ |
|
GO.0060359 | Response to
ammonium ion |
4.28×10⁻³ |
|
GO.0000715 | Nucleotide-excision
repair, DNA damage recognition |
9.43×10⁻³ |
|
GO.0043279 | Response to
alkaloid |
1.64×10⁻² |
|
GO.0032355 | Response to
estradiol |
2.00×10⁻² |
|
GO.0043278 | Response to
morphine |
4.27×10⁻² |
|
GO.0046878 | Positive regulation
of saliva secretion |
4.27×10⁻² |
|
GO.0006289 | Nucleotide-excision
repair |
4.38×10⁻² |
| KEGG pathways |
|
|
|
3040 | Spliceosome |
4.66×10⁻¹⁹ |
|
3420 | Nucleotide excision
repair |
3.49×10⁻² |
Discussion
In this article, the Cox filter model was extended
to solve two additional issues. One issue was how to incorporate
pathway information by excluding the genes with less importance in
the gene-to-gene interaction network. The other issue involved
eliminating the potential redundant genes by adding an extra
restriction on the average absolute correlation coefficients of a
gene with other genes in the search space.
Using NSCLC gene expression data, it was
demonstrated that the proposed method does outperform the original
Cox-filter method and the Cox-TGDR method. Similar to the Cox
filter method, the Cox-TGDR method is capable of identifying
subtype-specific prognostic genes and does not take pathway
information into consideration. However, it is superior to the
original Cox-filter method in terms of redundant gene elimination,
since it considers the additive effects among genes, so the
proposed method presents certain advantages.
Apart from different objectives, there are
substantial differences between the present study and a previous
study by the authors (14). Firstly,
the patients were classified into either the high-risk group or the
low-risk group according to survival time in the previous study
(14). Secondly, no separation on AC
and SCC subtypes was made in the previous study (14), therefore the resulting signatures were
general for these two subtypes instead of being specific for each
subtype. Thirdly, the Radical Coordinate Visualization plot
(36), which was used for feature
selection in the previous study (14), imposes restrictions on the maximal
size of a resulting gene signature. Finally, GSE50081, which was
used as the training set in the previous study (14), accounted for 40% of the size of the
integrated data. In the previous study, it was concluded that no
good separation between the two risk groups was obtained; since the
best C-index (the same test set was used in these two studies) was
only 0.54 (14). By contrast, the
present study used survival time data directly and a larger data
set to identify subtype-specific prognostic genes with the Cox
filter method, which has no restriction on the maximal size of a
signature. With these advantages, the C-statistics have been
improved dramatically in the present study.
Consistent with other studies (31,37), it
was demonstrated in the present study that redundant gene
elimination has beneficial effects on feature selection. With
redundant gene elimination by comparing the Cox filter method with
RGE and the original Cox filter method, the resulting signatures
have better predictive performance, smaller model sizes and more
subtype-specific genes. Furthermore, the present study demonstrated
that the use of a pre-filtering process prior to downstream
analysis is very beneficial, which is consistent with previous
findings by the authors (9) and the
work by others (38,39). Therefore, it is highly recommended to
carry out the pre-filtering process, particularly when a very
complicated and time-consuming statistical method was selected for
downstream analysis. Certainly, the method of conducting the
pre-filtering procedure is also of importance. In the present
study, the GeneRank method was used, which considers pathway
information. Numerous studies have previously demonstrated that
incorporating pathway information improves the predictive capacity
of a feature selection method (21–25).
Likewise, a pre-filtering procedure that incorporates pathway
information is also more helpful for a feature selection process.
To conclude, the GeneRank method is preferable as a pre-filtering
procedure over a method that does not consider any pathway
information, such as moderated t-tests in the R limma package
(30).
Acknowledgements
The author would like to thank Ms. Bing Wang of
Jilin University for preparing the TIFF formatted figures.
Funding
The present study was supported by the Natural
Science Foundation of China (grant no. 31401123).
Availability of data and materials
All data used in present study were publicly
assessable. Specifically, the microarray data included GSE30219,
GSE37745 and GSE50081 datasets from the Gene Expression Omnibus
(GEO, https://www.ncbi.nlm.nih.gov/geo/) repository, and
the RNA-Seq data were downloaded from The Cancer Genome Atlas Data
Portal (level 3) (https://tcga-data.nci.nih.gov/tcga/).
Authors' contributions
ST conceived and designed the study, analyzed the
data and interpreted the results and wrote the paper.
Ethics approval and consent to
participate
Not applicable.
Consent for publication
Not applicable.
Competing interests
The authors declare that they have no competing
interests.
References
|
1
|
Lemjabbar-Alaoui H, Hassan OU, Yang YW and
Buchanan P: Lung cancer: Biology and treatment options. Biochim
Biophys Acta. 1856:189–210. 2015.PubMed/NCBI
|
|
2
|
Lu C, Onn A and Vaporciyan A: Cancer of
the lungHolland-Frei Cancer Medicine. Kufe DW, Pollock RE,
Weichselbaum RR, Bast RC, Gansler TS, Holland JF and Frei E: 8th
edition. People's Medical Publishing House; Shelton, CT: 2010
|
|
3
|
Pikor LA, Ramnarine VR, Lam S and Lam WL:
Genetic alterations defining NSCLC subtypes and their therapeutic
implications. Lung Cancer. 82:179–189. 2013. View Article : Google Scholar : PubMed/NCBI
|
|
4
|
Siegel R, Naishadham D and Jemal A: Cancer
statistics, 2012. CA Cancer J Clin. 62:10–29. 2012. View Article : Google Scholar : PubMed/NCBI
|
|
5
|
Saeys Y, Inza I and Larrañaga P: A review
of feature selection techniques in bioinformatics. Bioinformatics.
23:2507–2517. 2007. View Article : Google Scholar : PubMed/NCBI
|
|
6
|
Hira ZM and Gillies DF: A review of
feature selection and feature extraction methods applied on
microarray data. Adv Bioinformatics. 2015:1983632015. View Article : Google Scholar : PubMed/NCBI
|
|
7
|
Ben-Hamo R, Boue S, Martin F, Talikka M
and Efroni S: Classification of lung adenocarcinoma and squamous
cell carcinoma samples based on their gene expression profile in
the sbv IMPROVER Diagnostic Signature Challenge. Syst Biom.
1:83–92. 2013.
|
|
8
|
Tian S and Suárez-fariñas M:
Hierarchical-TGDR: Combining biological hierarchy with a
regularization method for multi-class classification of lung cancer
samples via high-throughput gene-expression data. Syst Biom.
1:93–102. 2013.
|
|
9
|
Tian S and Suárez-Fariñas M: Multi-TGDR: A
regularization method for multi-class classification in microarray
experiments. PLoS One. 8:e783022013. View Article : Google Scholar : PubMed/NCBI
|
|
10
|
Zhu CQ, Ding K, Strumpf D, Weir BA,
Meyerson M, Pennell N, Thomas RK, Naoki K, Ladd-Acosta C, Liu N, et
al: Prognostic and predictive gene signature for adjuvant
chemotherapy in resected non-small-cell lung cancer. J Clin Oncol.
28:4417–4424. 2010. View Article : Google Scholar : PubMed/NCBI
|
|
11
|
Der SD, Sykes J, Pintilie M, Zhu CQ,
Strumpf D, Liu N, Jurisica I, Shepherd FA and Tsao MS: Validation
of a histology-independent prognostic gene signature for
early-stage, non-small-cell lung cancer including stage IA
patients. J Thorac Oncol. 9:59–64. 2014. View Article : Google Scholar : PubMed/NCBI
|
|
12
|
Zhao Q, Shi X, Xie Y, Huang J, Shia B and
Ma S: Combining multidimensional genomic measurements for
predicting cancer prognosis: Observations from TCGA. Brief
Bioinform. 16:291–303. 2014. View Article : Google Scholar : PubMed/NCBI
|
|
13
|
Zhao SD, Parmigiani G, Huttenhower C and
Waldron L: Más-o-menos: A simple sign averaging method for
discrimination in genomic data analysis. Bioinformatics.
30:3062–3069. 2014. View Article : Google Scholar : PubMed/NCBI
|
|
14
|
Tian S: Classification and survial
prediction for early-stage lung adenocarcinoma and squamous cell
carcinoma patients. Oncol Lett. 14:5464–5470. 2017.PubMed/NCBI
|
|
15
|
Tian S: Identification of subtype-specific
prognostic genes for early-stage lung adenocarcinoma and squamous
cell carcinoma patients using an embedded feature selection
algorithm. PLoS One. 10:e01346302015. View Article : Google Scholar : PubMed/NCBI
|
|
16
|
Tian S, Wang C and An MW: Test on
existence of histology subtype-specific prognostic signatures among
early stage lung adenocarcinoma and squamous cell carcinoma
patients using a Cox-model based filter. Biol Direct. 10:152015.
View Article : Google Scholar : PubMed/NCBI
|
|
17
|
Cox DR: Regression models and life-tables.
J R Stat Soc B. 34:187–220. 1972.
|
|
18
|
Wang S, Nan B, Zhou N and Zhu J:
Hierarchically penalized Cox regression with grouped variables.
Biometrika. 96:307–322. 2009. View Article : Google Scholar
|
|
19
|
Breheny P and Hunag J: Penalized methods
for bi-level variable selection. Stat Interface. 2:369–380. 2009.
View Article : Google Scholar : PubMed/NCBI
|
|
20
|
Tian S, Wang C, Chang HH and Sun G:
Identification of prognostic genes and gene sets for early-stage
non-small cell lung cancer using bi-level selection methods. Sci
Rep. 7:461642017. View Article : Google Scholar : PubMed/NCBI
|
|
21
|
Tian S, Chang HH and Wang C:
Weighted-SAMGSR: Combining significance analysis of microarray-gene
set reduction algorithm with pathway topology-based weights to
select relevant genes. Biol Direct. 11:502016. View Article : Google Scholar : PubMed/NCBI
|
|
22
|
Johannes M, Brase JC, Fröhlich H, Gade S,
Gehrmann M, Fälth M, Sültmann H and Beissbarth T: Integration of
pathway knowledge into a reweighted recursive feature elimination
approach for risk stratification of cancer patients.
Bioinformatics. 26:2136–2144. 2010. View Article : Google Scholar : PubMed/NCBI
|
|
23
|
Chen L, Xuan J, Riggins RB, Clarke R and
Wang Y: Identifying cancer biomarkers by network-constrained
support vector machines. BMC Syst Biol. 5:1612011. View Article : Google Scholar : PubMed/NCBI
|
|
24
|
Sun H, Lin W, Feng R and Li H:
Network-regularized high-dimensional Cox regression for analysis of
genomic data. Stat Sin. 24:1433–1459. 2014.PubMed/NCBI
|
|
25
|
Sokolov A, Carlin DE, Paull EO, Baertsch R
and Stuart JM: Pathway-based genomics prediction using generalized
elastic net. PLoS Comput Biol. 12:e10047902016. View Article : Google Scholar : PubMed/NCBI
|
|
26
|
Morrison JL, Breitling R, Higham DJ and
Gilbert DR: GeneRank: Using search engine technology for the
analysis of microarray experiments. BMC Bioinformatics. 6:2332005.
View Article : Google Scholar : PubMed/NCBI
|
|
27
|
McCall MN, Bolstad BM and Irizarry RA:
Frozen robust multiarray analysis (fRMA). Biostatistics.
11:242–253. 2010. View Article : Google Scholar : PubMed/NCBI
|
|
28
|
Johnson WE, Li C and Rabinovic A:
Adjusting batch effects in microarray expression data using
empirical bayes methods. Biostatistics. 8:118–127. 2007. View Article : Google Scholar : PubMed/NCBI
|
|
29
|
Law CW, Chen Y, Shi W and Smyth GK: Voom:
Precision weights unlock linear model analysis tools for RNA-seq
read counts. Genome Biol. 15:R292014. View Article : Google Scholar : PubMed/NCBI
|
|
30
|
Smyth GK: Limma: Linear Models for
Microarray Data. In Bioinformatics and Computational Biology
Solutions Using R and Bioconductor. 397–420. 2005. View Article : Google Scholar
|
|
31
|
Gu J, Lu Y, Liu C and Lu H: Multiclass
classification of sarcomas using pathway based feature selection
method. J Theor Biol. 362:3–8. 2014. View Article : Google Scholar : PubMed/NCBI
|
|
32
|
Eng KH, Wang S, Bradley WH, Rader JS and
Kendziorski C: Pathway-index models for construction of
patient-specific risk profiles. Stat Med. 32:1524–1535. 2013.
View Article : Google Scholar : PubMed/NCBI
|
|
33
|
Uno H, Cai T, Pencina MJ, D'Agostino RB
and Wei LJ: On the C-statistics for evaluating overall adequacy of
risk prediction procedures with censored survival data. Stat Med.
30:1105–1117. 2011.PubMed/NCBI
|
|
34
|
Laimighofer M, Krumsiek J, Buettner F and
Theis FJ: Unbiased prediction and feature selection in
high-dimensional survival regression. J Comput Biol. 23:279–290.
2016. View Article : Google Scholar : PubMed/NCBI
|
|
35
|
Tibshirani R: Regression shrinkage and
selection via the Lasso. J Royal Statistical Society Series B
(Methodological). 58:267–288. 1996.
|
|
36
|
Hoffman P, Grinstein G, Marx K, Grosse I
and Stanley E: DNA visual and analytic data mining. Proceedings
Vis'97. (cat no. 97CB36155). 1997.
|
|
37
|
Ge R, Zhou M, Luo Y, Meng Q, Mai G, Ma D,
Wang G and Zhou F: McTwo: A two-step feature selection algorithm
based on maximal information coefficient. BMC Bioinformatics.
17:1422016. View Article : Google Scholar : PubMed/NCBI
|
|
38
|
Chu W, Li R and Reimherr M: Feature
screening fo time-varying coefficient models with ultrahigh
dimensional longitudinal data. Ann Appl Stat. 10:596–617. 2016.
View Article : Google Scholar : PubMed/NCBI
|
|
39
|
Yang G, Yu Y, Li R and Buu A: Feature
screening in ultrahigh dimensional Cox's model. Stat Sin.
26:881–901. 2016.PubMed/NCBI
|