Introduction
Gastric cancer (GC) is the fourth most common type
of cancer, and the second leading cause of cancer-associated
mortality worldwide (1). GC mortality
rates continue to increase yearly, particularly in low- and
middle-income countries (2). The
long-term prognosis remains poor due to postoperative recurrence
and metastasis; and therefore, it is important to identify new
prognostic markers for the identification of higher risk patients,
and to direct the application of adjuvant chemotherapy
regimens.
Several factors have been previously associated with
the prognosis of patients with GC including tumor diameter,
histological differentiation, lymph node status and surgical margin
status. However, it has been demonstrated that the number of
metastatic lymph nodes may be one of the most reliable prognostic
markers available (3). At present,
the 7th edition of the Tumor-Node-Metastasis (TNM) staging system
by the American Joint Committee on Cancer (AJCC) (4) is commonly used to determine the stage of
GC and its prognosis. N stage is determined by the number of
metastatic lymph nodes. According to this classification, it is
necessary to examine sufficient lymph nodes, with ≥15 required for
the accurate diagnosis of the N stage in GC (4). However, an insufficient number of lymph
nodes commonly hampers the clinical application of lymph node
staging in GC specimens (5,6). Previously, the lymph node ratio (rN),
defined as the ratio of metastatic lymph nodes to the total lymph
nodes examined, has been demonstrated as a valuable prognostic
factor for the overall survival (OS) of resectable GC (7–10). rN has
been demonstrated as more reliable and accurate than N stage in
predicting survival outcomes (11–13);
however, another study has contradicted these studies (14). Further investigation is therefore
required in order to resolve this conflict.
The Lauren classification sub-classifies GC into
diffuse, intestinal and mixed type, with each type demonstrating
distinct clinical and pathological characteristics (15,16). It
has been demonstrated that diffuse type gastric carcinomas are
associated with a worse prognosis than intestinal type gastric
carcinoma, and that the Lauren classification type exhibits
independent prognostic significance (17). However, to the best of our knowledge,
there has been no study analyzing the association between Lauren
classification and rN on predicting the OS time for patients with
GC.
The aims of the present study were to: i) Evaluate
the prognostic value of the rN and Lauren classification in
patients with GC; ii) compare the accuracy of prognosis between the
rN and N stages in patients with GC; iii) investigate the
prognostic relevance of the rN in each Lauren classification
subtype.
Materials and methods
Eligible patients
For this retrospective study, the medical records
for 332 patients who underwent curative GC resection between May
2007 and May 2011 at the Affiliated Hospital of Qing Dao University
were reviewed and analyzed.
The inclusion criteria included: i) Pathologically
confirmed adenocarcinoma; ii) the absence of distant metastasis at
the time of primary diagnosis; iii) complete preoperative staging
data was available; iv) the patient received radical tumor
resection (R0) with D1 or D2 lymph adenectomy; v) complete
postoperative pathological data was available.
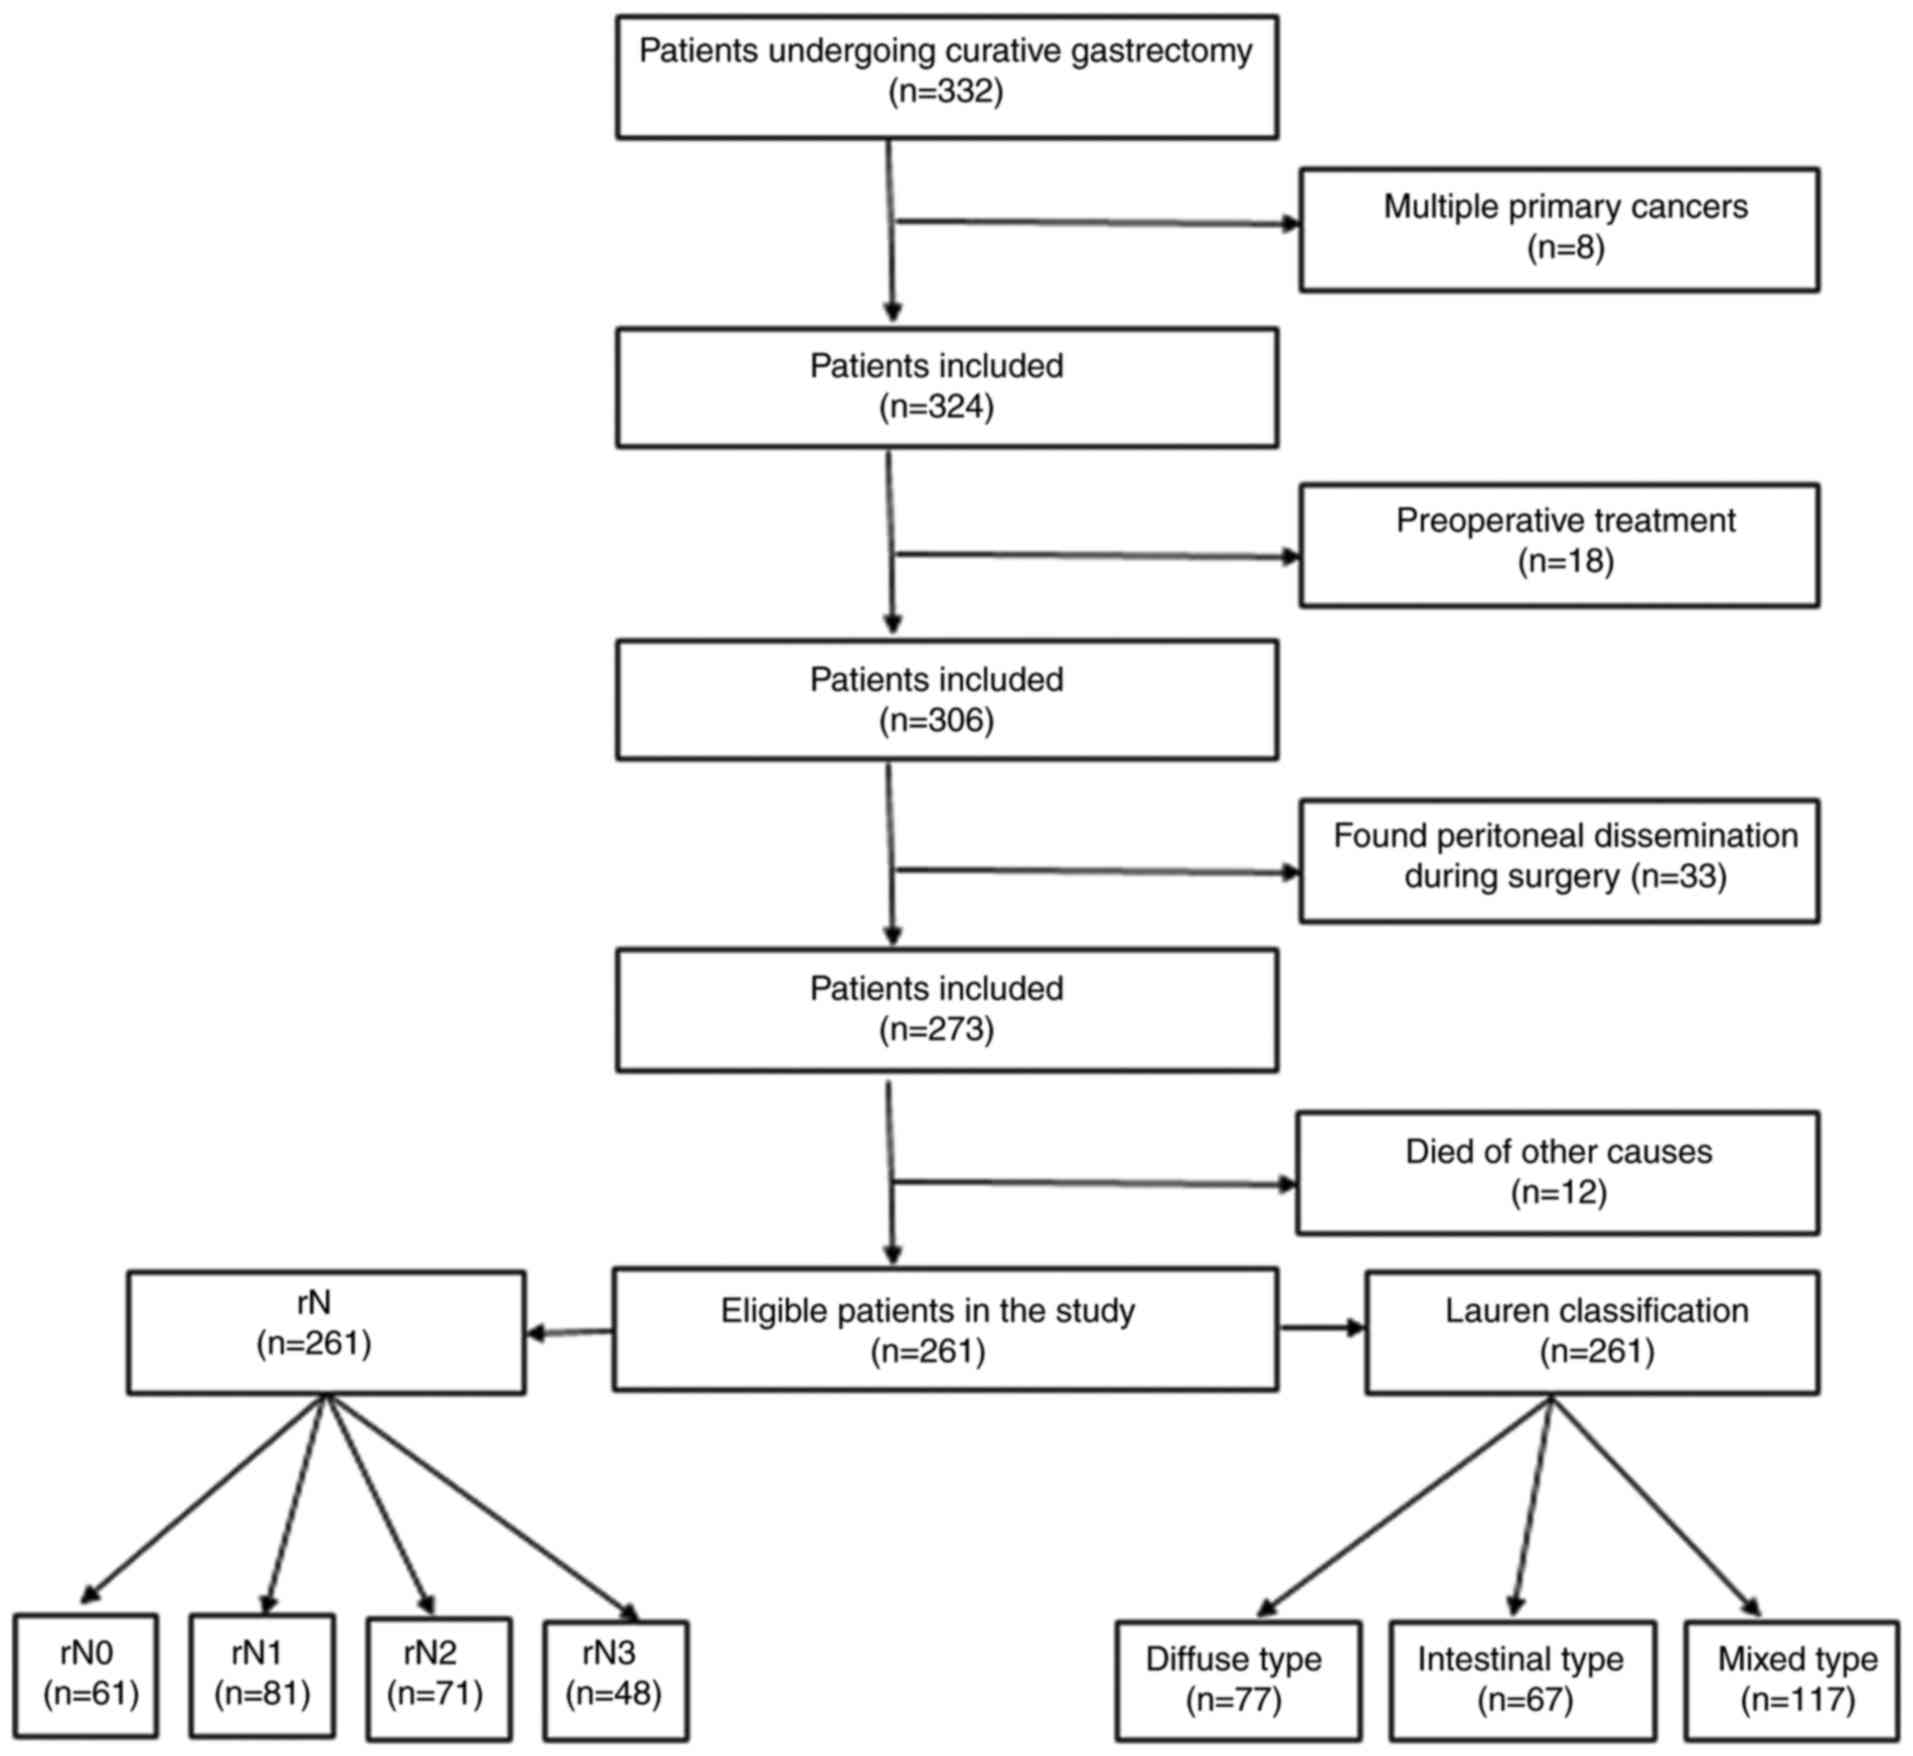
The exclusion criteria included: i) Patients
presented with multiple primary cancers; ii) patients received
preoperative treatment; iii) patients had peritoneal dissemination
during surgery; iv) patient mortality was caused by factors other
than GC.
In total, 261 eligible patients were included in the
present study (Fig. 1). Pathological
lymph node status and Lauren classification were evaluated by
pathologists, and the rN was calculated for each patient.
Clinical and pathological data
collection and variable classification
Information on clinical and pathological variables
were obtained from medical records and pathological reports, which
included age, sex, smoking status, drinking status, tumor diameter,
differentiation, pathological type, venous invasion, Lauren
classification, node status, the number of lymph nodes examined,
number of metastatic lymph nodes, T stage, N stage and the TNM
stage evaluated according to the 7th edition of AJCC TNM staging
system (18). Classification
thresholds for tumor diameter (≤4, 4–6, 6–8, >8 cm) were defined
by comparing survival rates between different sized groups using 1
cm as the standard interval, and the prognostic accuracy of all
tumor diameter categories were evaluated based on the Harrell
concordance index (19–24). The independent Ethics Committee of The
Affiliated Hospital of Qingdao University (Shandong, China)
approved the study.
According to the number of lymph nodes examined,
patients were divided into two groups, ≥15 and <15 lymph nodes
examined. rN was defined as the number of metastatic lymph nodes
divided by the total number of lymph nodes examined. According to
previous studies, rNs were divided into four score categories: i)
rN0 (no lymph nodes involved); ii) rN1 (ratio >0 and ≤0.2); iii)
rN2 (ratio >0.2 and ≤0.5); iv) rN3 (ratio >0.5) (25,26).
Follow-up
During the first 2 years after radical resection,
patients were followed up via telephone contact at 3-month
intervals. Between 2 and 5 years, follow-up was performed at
6-month intervals. After 5 years, patients were followed up once a
year. In total, 16 patients lost to follow-up within the first year
after surgery. In total, the follow-up period was between August
2007 and May 2016. The endpoint was the OS time, which was the time
between the date of surgery and the date of final follow-up or
patient mortality.
Statistical analysis
Patient characteristics were evaluated using a
Student's t-test for continuous data and a χ2 test for
categorical variables. Univariate analysis of survival was
performed using Kaplan-Meier estimator curves. The differences
between groups were compared using the Log-rank χ2 test.
Multivariate analysis was performed using Cox proportional hazards
modeling to identify independent predictors, which only included
the variables with statistical significance (P<0.05) obtained
from univariate analysis. Hazard ratios (HR) and 95% confidence
intervals (CI) were calculated in order to compare the relative
risk associated with various factors. Receiver operating
characteristic (ROC) curves were used to evaluate which variable
demonstrated a higher prognostic value. Kaplan-Meier estimator
curves for OS and Cox proportional hazard regression models were
used to analyze the prognosis associated with the rN score in
Lauren classification subgroups. The χ2 test was applied
to evaluate the association between the rN score and the Lauren
classification. All statistical analysis was performed using SPSS
(version 22.0; IBM Corp., Armonk, NY, USA). P<0.05 was
considered to indicate a statistically significant difference.
Results
Patient characteristics
Patient characteristics are summarized in Table I. In total, 188 (72.03%) male and 73
(27.97%) female patients with a mean age of 54 years, primarily
presenting with stage II and III disease (n=118, 45.21%), were
enrolled in to the present study. Histopathological examination
revealed that the majority of patients (n=213, 81.61%) were
diagnosed with poorly differentiated adenocarcinoma, and 106
patients (40.61%) had <15 examined lymph nodes. The N-stage
distribution was even among the 4 groups, whereas rN3 (n=48,
18.39%) was the least common category. Mixed type carcinoma (n=117,
44.83%) was the most common Lauren classification. In total, 103
patients (40.61%) survived and 158 patients (60.54%) had succumbed
to GC by the end of the study. Overall, the median survival time
was 30 months (range, 3–63 months).
 | Table I.The characteristics of 261 patients
with gastric cancer. |
Table I.
The characteristics of 261 patients
with gastric cancer.
| Variable | n | % |
|---|
| Sex |
|
|
| Male | 188 | 72.03 |
|
Female | 73 | 27.97 |
| Age, years |
|
|
|
<60 | 181 | 69.35 |
|
≥60 | 80 | 30.65 |
| Tumor pathological
differentiation |
|
|
|
Well | 4 | 1.53 |
|
Moderate | 43 | 16.48 |
|
Poorly | 213 | 81.61 |
|
Unknown | 1 | 0.38 |
| Pathologic
type |
|
|
|
Adenocarcinoma | 245 | 93.87 |
| Ring
cell carcinoma | 16 | 6.13 |
|
Tumor-node-metastasis stage |
|
|
| I | 25 | 9.58 |
| II | 118 | 45.21 |
|
III | 118 | 45.21 |
| Lymph nodes
examined, n |
|
|
|
≥15 | 155 | 59.39 |
|
<15 | 106 | 40.61 |
| Lymph node
stage |
|
|
| 0 | 61 | 23.37 |
| 1 | 70 | 26.82 |
| 2 | 65 |
24.9 |
| 3 | 65 |
24.9 |
| Metastatic lymph
node ratio score |
|
|
| 0 | 61 | 23.37 |
| 1 | 81 | 31.03 |
| 2 | 71 | 27.20 |
| 3 | 48 | 18.39 |
| Lauren
classification |
|
|
|
Intestinal type | 67 | 25.67 |
| Diffuse
type | 77 | 29.5 |
| Mixed
type | 117 | 44.83 |
| Status |
|
|
|
Surviving | 103 | 39.46 |
|
Deceased | 158 | 60.54 |
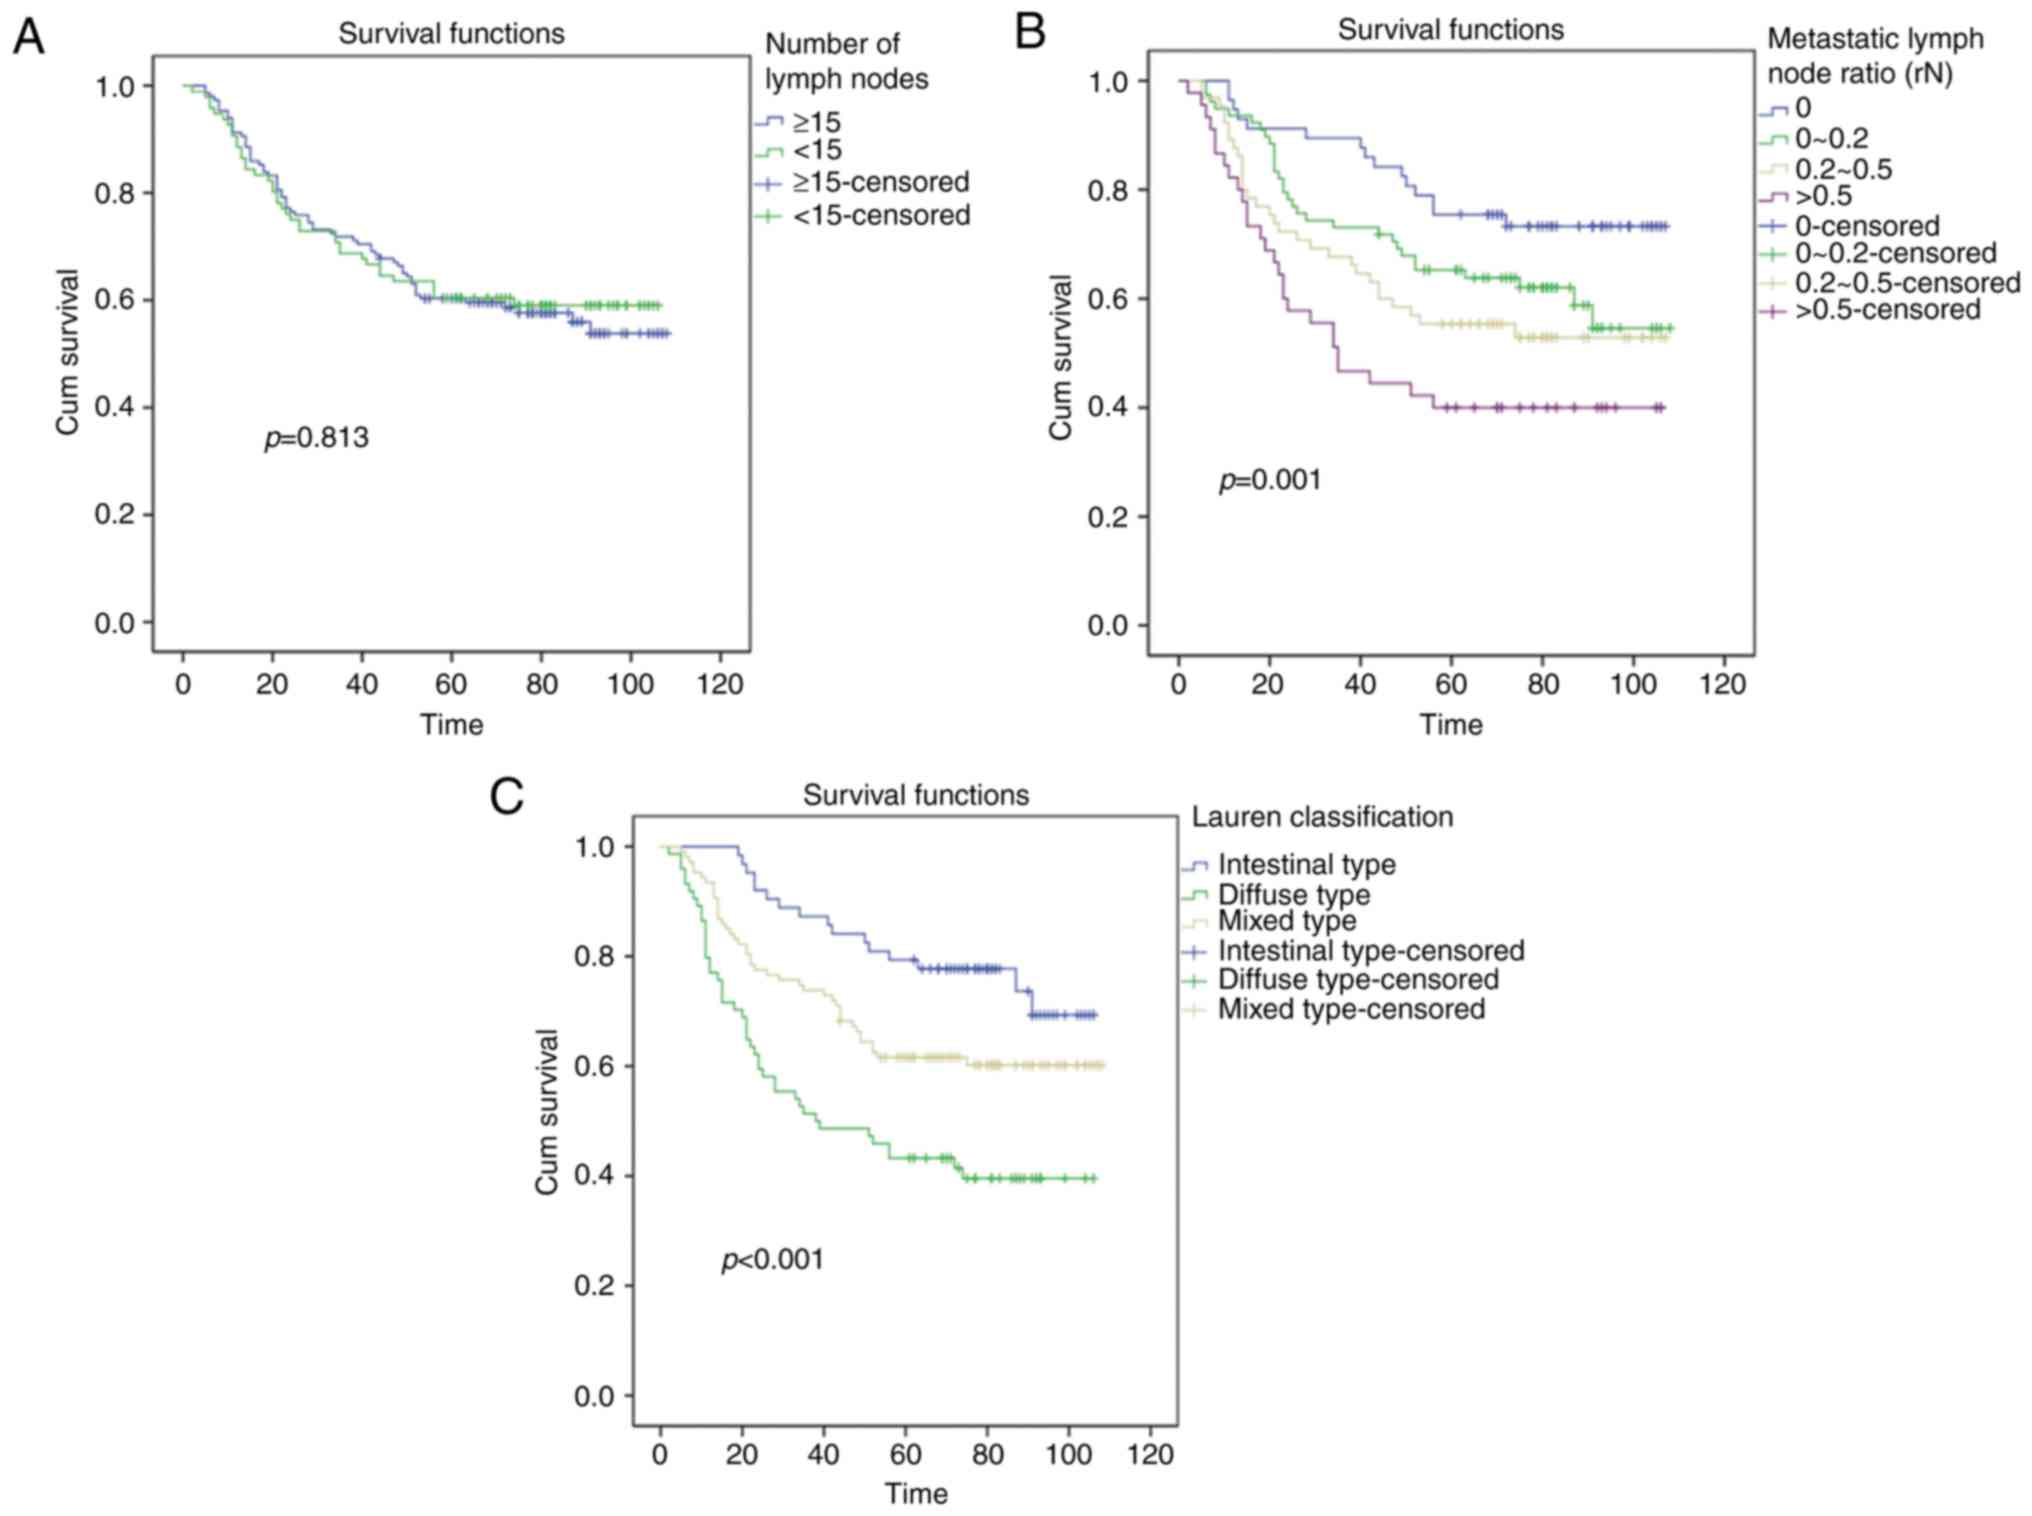
Analysis of prognostic factors in the
whole patient cohort
As presented in Table
II, the univariate survival analysis with Kaplan-Meier curves
demonstrated that the significant prognostic factors for OS
included tumor diameter (P<0.001), node status (P=0.004), rN
score (P=0.001), Lauren classification (P<0.001), N stage
(P=0.001) and TNM stage (P<0.001), whereas sex (P=0.486), age
(P=0.169), T stage (P=0.104), pathological differentiation
(P=0.43), the number of lymph nodes examined (P=0.813), vessel
cancer embolus (P=0.675), smoking status (P=0.843), drinking status
(P=0.85) and pathological type (P=0.189) were not significantly
associated with OS (Fig. 2).
| Table II.Univariate analysis of the potential
predictive factors for overall survival time. |
Table II.
Univariate analysis of the potential
predictive factors for overall survival time.
| Variable | Median | Standard error | 95% confidence
interval | χ2 | P-value |
|---|
| Sex |
|
|
|
|
|
|
Male | 74.73 | 3.01 | 68.83–80.63 | 0.485 | 0.486 |
|
Female | 70.36 | 5.27 | 60.03–80.69 |
|
|
| Age, years |
|
|
|
|
|
|
<60 | 76.14 | 3.11 | 70.03–82.24 | 1.891 | 0.169 |
|
≥60 | 67.59 | 4.85 | 58.09–77.09 |
|
|
| Tumor diameter,
cm |
|
|
|
|
|
| ≤4 | 86.31 | 3.93 | 78.6–94.01 | 19.276 | <0.001 |
|
4–6 | 72.44 | 4.41 | 63.8–81.07 |
|
|
|
6–8 | 53.03 | 6.22 | 40.83–65.23 |
|
|
|
>8 | 65.07 | 7.71 | 49.96–80.17 |
|
|
| T stage |
|
|
|
|
|
| 1 | 93.33 | 10.06 | 73.62–113.04 | 6.166 | 0.104 |
| 2 | 85.38 | 6.29 | 73.06–97.7 |
|
|
| 3 | 74.71 | 3.59 | 67.67–81.76 |
|
|
| 4 | 48.92 | 4.06 | 40.96–56.88 |
|
|
|
Differentiation |
|
|
|
|
|
|
Well | 39.75 | 10.14 | 19.88–59.62 | 2.759 | 0.430 |
|
Moderate | 72.58 | 6.42 | 59.99–85.18 |
|
|
|
Poor | 75 | 3.03 | 69.07–80.94 |
|
|
|
Unknown | 52 | 0 | 52.00–52.00 |
|
|
| Pathological
type |
|
|
|
|
|
|
Adenocarcinoma | 75.97 | 2.77 | 70.54–81.41 | 1.728 | 0.189 |
| Ring
cell carcinoma | 55.85 | 11.3 | 33.71–77.99 |
|
|
| Node status |
|
|
|
|
|
|
Negative | 88.33 | 4.32 | 79.86–96.81 | 8.398 | 0.004 |
|
Positive | 69.27 | 3.11 | 63.18–75.36 |
|
|
| Lymph nodes
examined, n |
|
|
|
|
|
|
≥15 | 73.72 | 3.35 | 67.14–80.29 | 0.056 | 0.813 |
|
<15 | 73.03 | 4.2 | 64.79–81.27 |
|
|
| N stage |
|
|
|
|
|
| 0 | 88.33 | 4.32 | 79.86–96.81 | 15.804 | 0.001 |
| 1 | 74.7 | 5 | 64.9–84.5 |
|
|
| 2 | 73.77 | 5.17 | 63.63–83.9 |
|
|
| 3 | 57.9 | 5.5 | 47.12–68.69 |
|
|
| Metastatic lymph
node ratio score |
|
|
|
|
|
| 0 | 87.52 | 2.72 | 82.19–92.85 | 19.407 | 0.001 |
| 1 | 76.28 | 2.57 | 71.24–81.32 |
|
|
| 2 | 65.91 | 2.56 | 60.89–70.93 |
|
|
| 3 | 54.29 | 3.08 | 48.25–60.33 |
|
|
| TNM stage |
|
|
|
|
|
| I | 88.13 | 6.91 | 74.6–101.66 | 20.616 | <0.001 |
| II | 83.95 | 3.51 | 77.07–90.82 |
|
|
|
III | 59.61 | 4.16 | 51.46–67.75 |
|
|
| Lauren
classification |
|
|
|
|
|
|
Intestinal type | 89.07 | 2.79 | 83.60–94.54 | 23.746 | <0.001 |
| Diffuse
type | 54.65 | 4.97 | 44.91–64.39 |
|
|
| Mixed
type | 74.85 | 3.65 | 67.70–82.00 |
|
|
| Vessel cancer
embolus |
|
|
|
|
|
|
Negative | 74.1 | 2.69 | 68.83–79.37 | 0.176 | 0.675 |
|
Positive | 58.78 | 12.85 | 33.6–83.96 |
|
|
| Smoking status |
|
|
|
|
|
| No | 73.98 | 3.34 | 67.43–80.53 | 0.039 | 0.843 |
|
Yes | 72.34 | 4.26 | 63.98–80.69 |
|
|
| Drinking
status |
|
|
|
|
|
| No | 73.33 | 3.31 | 66.83–79.82 | 0.036 | 0.85 |
|
Yes | 73.68 | 4.32 | 65.21–82.15 |
|
|
As presented in Table
III, multivariate analysis with Cox regression model further
identified the independent prognostic factors for OS, including
tumor diameter (P=0.03), rN score (P<0.001) and Lauren
classification (P<0.001). Multivariate analysis also indicated
that patients with an increased rN were associated with the
shortest OS time, and the diffuse type of Lauren classification was
also associated with a poorer prognosis. In the analysis of rN
score, using rN3 as the reference group, the HRs for rN0, rN1, and
rN2 were 0.16 (95% CI, 0.14–0.19), 0.22 (95% CI, 0.2–0.25) and 0.3
(95% CI, 0.28–0.31), respectively. In Lauren classification
analysis, using mixed type as the reference group (HR: 1), the HRs
for intestinal and diffuse type were 0.56 (95% CI, 0.32–0.97) and
1.9 (95% CI, 1.26–2.86), respectively.
| Table III.Multivariable Cox regression analysis
to identify independent predictors of overall survival time. |
Table III.
Multivariable Cox regression analysis
to identify independent predictors of overall survival time.
| Variable | HR | % confidence 95
interval | P-value |
|---|
| Tumor diameter |
|
| 0.030 |
| 1 | 0.72 | 0.27–1.95 | 0.520 |
| 2 | 0.78 | 0.34–1.81 | 0.560 |
| 3 | 2.44 | 1.24–4.93 | 0.023 |
| 4 | 1 |
|
|
| Lymph
node metastasis | 1.42 | 0.45–4.49 | 0.550 |
| rN score |
|
| <0.001 |
| 0 | 0.16 | 0.14–0.19 | <0.001 |
| 1 | 0.22 | 0.20–0.25 | <0.001 |
| 2 | 0.3 | 0.28–0.31 | <0.001 |
| 3 | 1 |
|
|
| Lauren
classification |
|
| <0.001 |
|
Intestinal type | 0.56 | 0.32–0.97 | 0.043 |
| Diffuse
type | 1.9 | 1.26–2.86 | 0.003 |
| Mixed
type | 1 |
|
|
| N stage |
|
| 0.270 |
| N0 | 2.36 | 0.57–9.88 | 0.310 |
| N1 | 1.9 | 0.83–4.32 | 0.250 |
| N2 | 0.67 | 0.32–1.40 | 0.290 |
| N3 | 1 |
|
|
| TNM stage |
|
| 0.390 |
| I | 0.34 | 0.06–1.87 | 0.210 |
| II | 0.61 | 0.25–1.49 | 0.280 |
|
III | 1 |
|
|
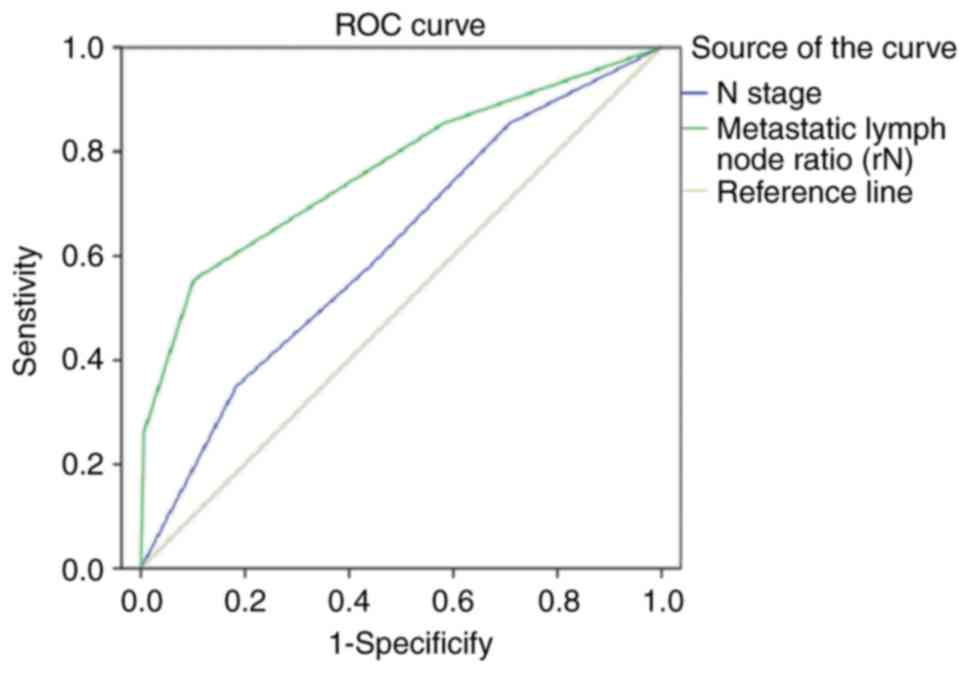
As demonstrated in ROC curves from multivariate
analysis, the area under the curve for rN and N stage was 0.765
(95% CI, 0.704–0.827) and 0.614 (95% CI, 0.544–0.683),
respectively, a statistically significant difference (P=0.002). The
rN score had a greater prognostic value for OS compared with N
stage (Fig. 3). In the ROC curve
analysis, N stage and the rN score were used as test variables, and
the survival status of patients was used as the outcome variable;
these variables were incorporated into a model and a correction
curve was generated.
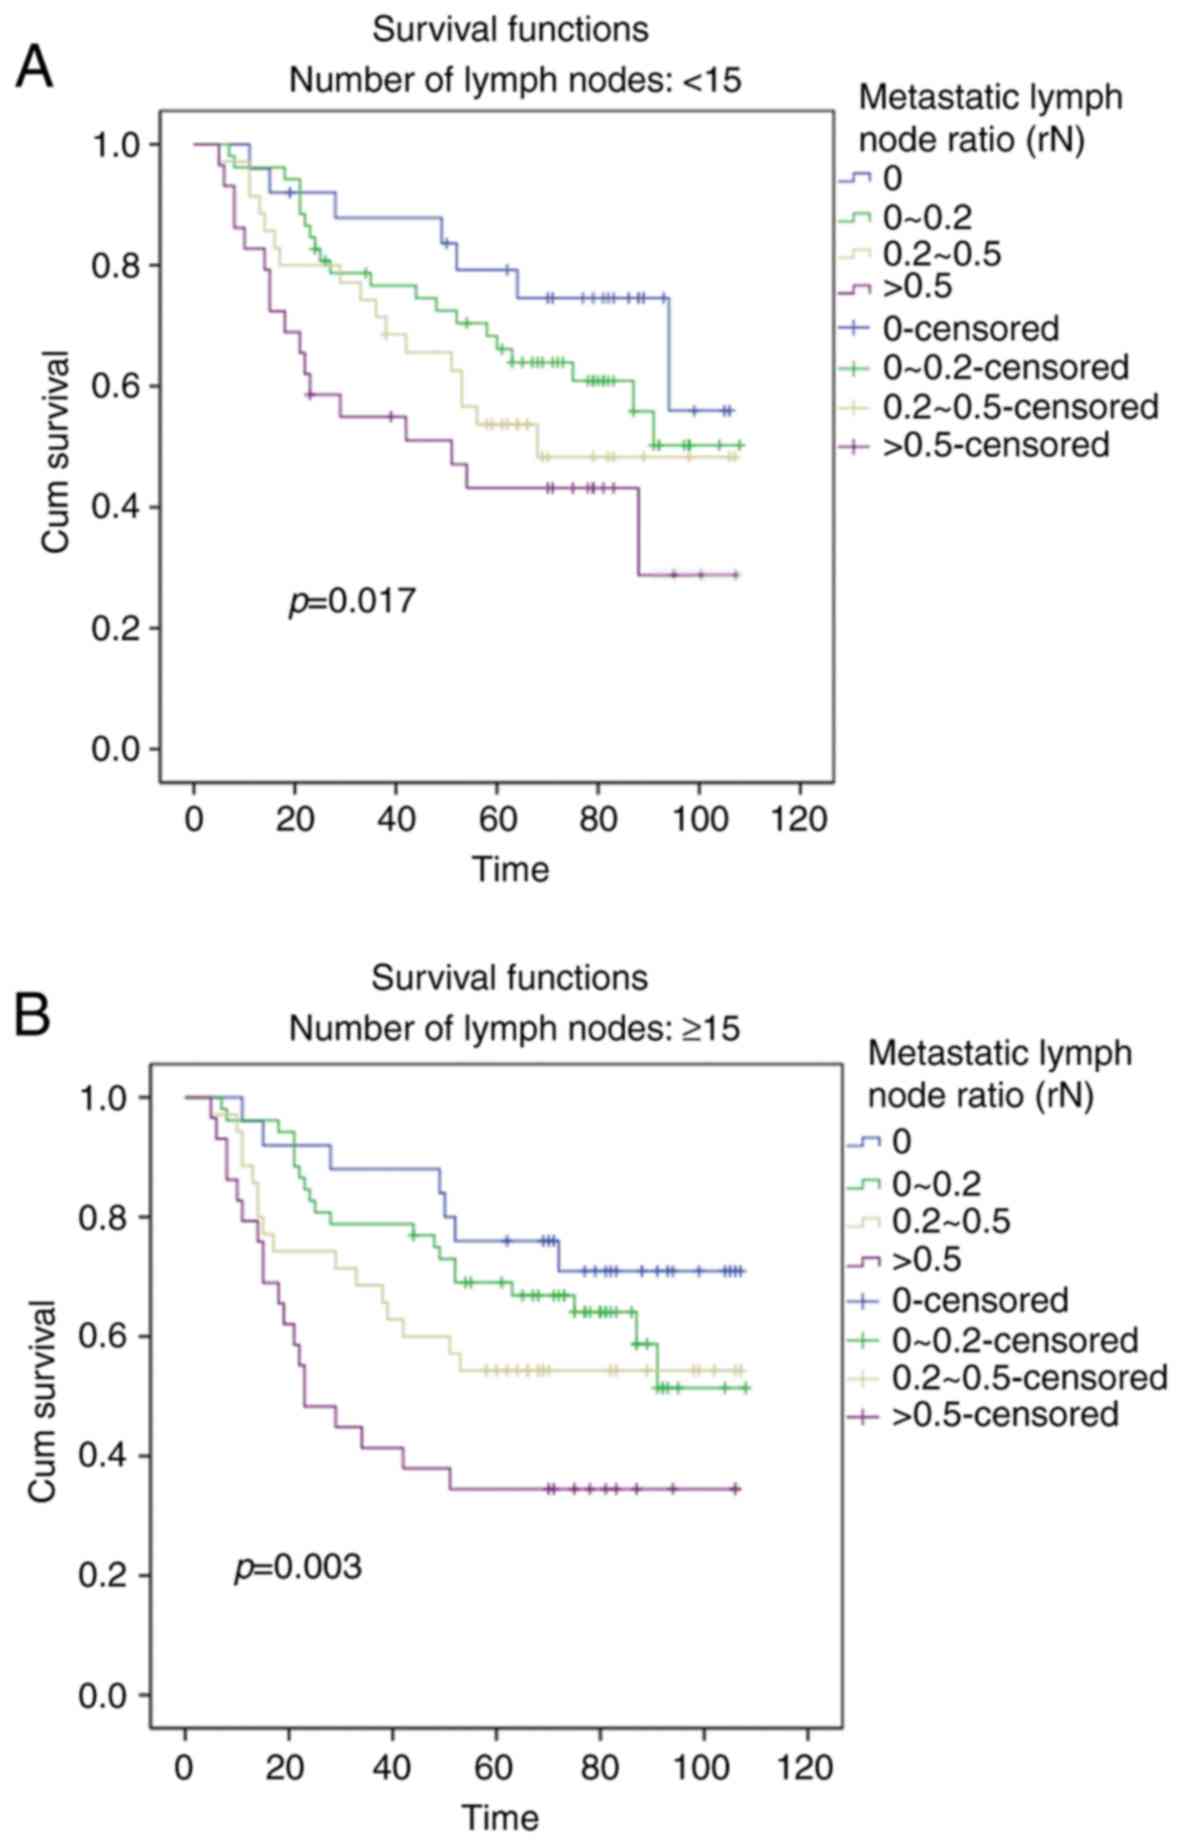
Subgroup analysis for OS
Kaplan-Meier estimator curves were used to analyze
whether the number of lymph nodes examined (≥15 or <15) had an
effect on the prognostic value of rN. An association analysis was
performed separately for the two groups and demonstrated that rN
was significantly associated with OS in both groups (P=0.003 and
P=0.017, respectively). The results confirmed that the rN score was
an independent prognostic factor for survival rate, independent of
the number of lymph nodes examined (Fig.
4). The survival rates associated with different rN scores were
calculated at 1, 3 and 5 years. The results demonstrated that
increased rN was associated with shorter OS (Table IV).
| Table IV.Survival rates stratified by rN
score. |
Table IV.
Survival rates stratified by rN
score.
|
| Survival rate,
% |
|---|
|
|
|
|---|
| rN score | 1-year | 3-year | 5-year |
|---|
| 0 | 91.23 | 84.21 | 75.44 |
| 1 | 79.49 | 70.49 | 63.71 |
| 2 | 72.31 | 58.46 | 55.34 |
| 3 | 60.00 | 44.44 | 39.89 |
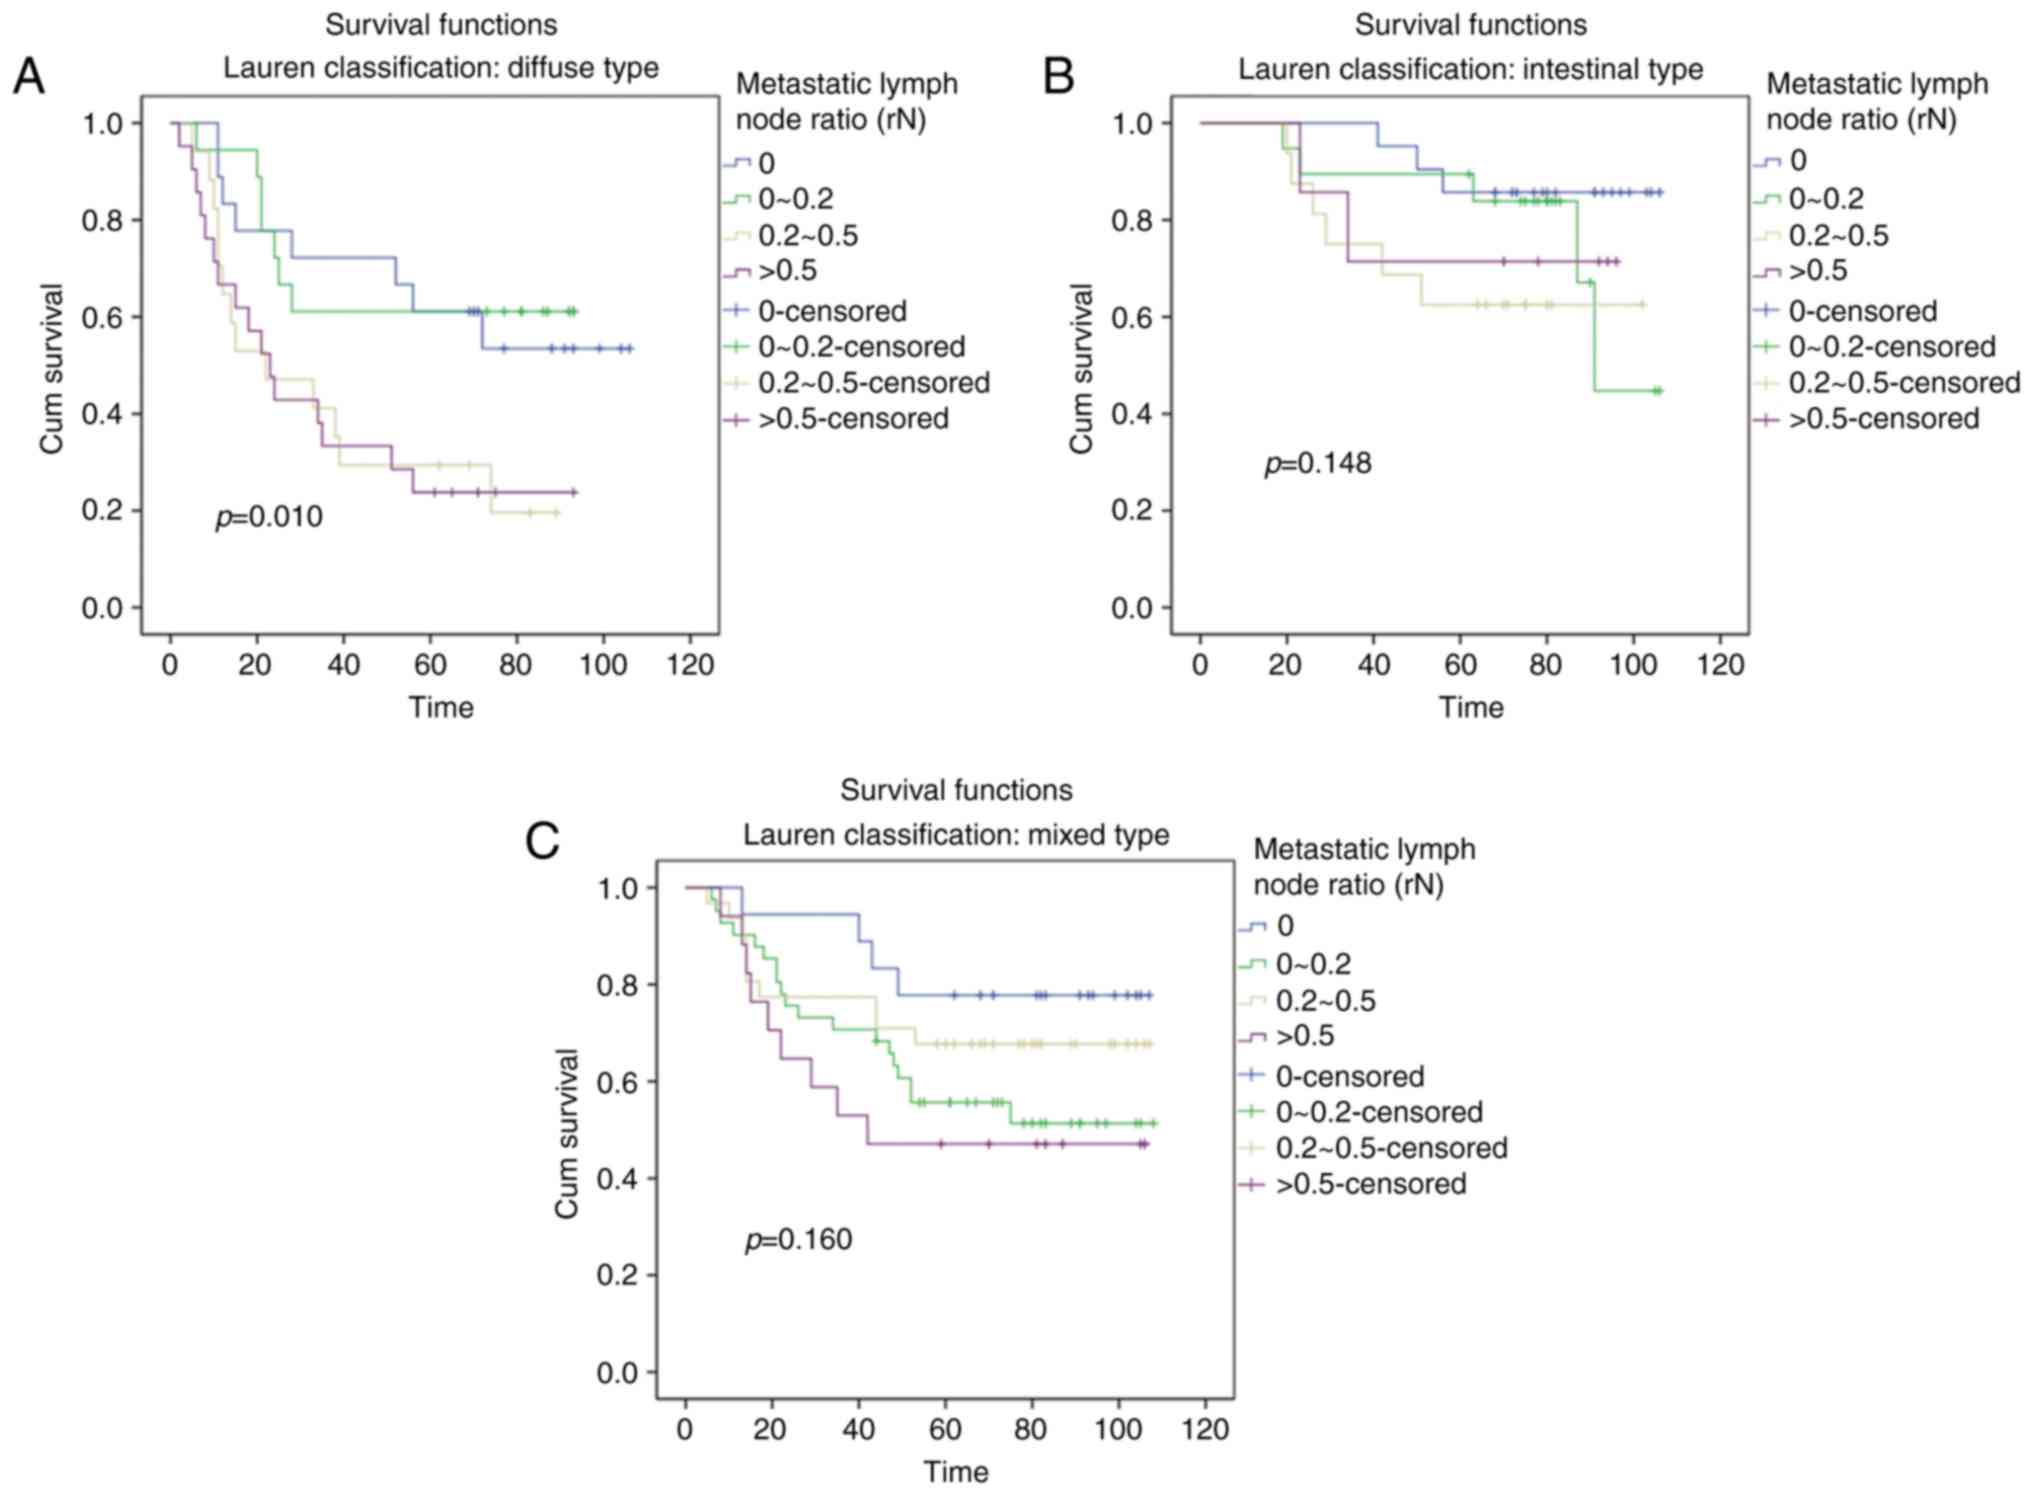
The association between rN scores and the Lauren
classification for OS was evaluated using subgroup analyses.
Kaplan-Meier curves and Cox's proportional hazard regression models
were used to analyze the prognostic relevance of the rN score
categories in each Lauren classification (diffuse, intestinal and
mixed type). A significant association with survival was only
observed in the diffuse type subgroup (P=0.01; Fig. 5 and Table
V). The χ2 test was applied to evaluate the
association between the rN score and the diffuse type subgroup. No
association was identified between the two factors (P=0.223;
Table VI), implying that the rN
score may be used as an independent prognostic factor for OS in the
diffuse type subgroup. Cox regression model analysis in the diffuse
type subgroup further confirmed this (Table VII). In the diffuse type subgroup,
univariate analysis with Kaplan-Meier estimator curves were used to
select significant factors, including the rN score (P=0.01), N
stage (P=0.032) and TNM stage (P=0.004). Multivariate analysis with
Cox regression model demonstrated that the rN score was an
independent predictor for OS time (P<0.001).
| Table V.Cox's proportional hazard regression
models to analyze the prognosis associated with rN score for each
Lauren classification type. |
Table V.
Cox's proportional hazard regression
models to analyze the prognosis associated with rN score for each
Lauren classification type.
| Lauren
classification | rN score | Median | Hazard ratio | 95% confidence
interval | P-value |
|---|
| Intestinal
type | 0 | 92.89 | 0.81 | 0.640–1.025 | 0.080 |
|
| 1 | 86.34 | 0.85 | 0.713–1.014 | 0.070 |
|
| 2 | 78.61 | 0.87 | 0.715–1.058 | 0.164 |
|
| 3 | 70.88 | 1 | – | – |
| Diffuse type | 0 | 72.06 | 0.67 | 0.573–0.784 | <0.001 |
|
| 1 | 70.38 | 0.71 | 0.595–0.847 | <0.001 |
|
| 2 | 40.62 | 0.97 | 0.862–1.091 | 0.665 |
|
| 3 | 36.41 | 1 | – | – |
| Mixed type | 0 | 87.42 | 0.84 | 0.677–1.042 | 0.113 |
|
| 1 | 76.43 | 0.91 | 0.778–1.064 | 0.238 |
|
| 2 | 67.08 | 0.93 | 0.811–1.067 | 0.299 |
|
| 3 | 60.23 | 1 | – | – |
| Table VI.χ2 test analysis of the
association between rN score and Lauren classification. |
Table VI.
χ2 test analysis of the
association between rN score and Lauren classification.
|
| rN score |
|
|
|---|
|
|
|
|
|
|---|
| Lauren
classification | 0 | 1 | 2 | 3 |
χ2 | P-value |
|---|
| Intestinal
type | 21 | 19 | 18 | 8 | 8.217 | 0.223 |
| Diffuse type | 19 | 19 | 17 | 22 |
|
|
| Mixed type | 21 | 43 | 35 | 18 |
|
|
| Table VII.Cox regression analysis to identify
independent prognostic predictors of survival in the diffuse type
subgroup. |
Table VII.
Cox regression analysis to identify
independent prognostic predictors of survival in the diffuse type
subgroup.
| Variable | Hazard ratio | 95% confidence
interval | P-value |
|---|
| Lymph node
stage |
|
| 0.163 |
| 1 | 0.90 | 0.77–1.05 | 0.187 |
| 2 | 1.21 | 0.92–1.59 | 0.173 |
| 3 | 0.77 | 0.59–1.01 | 0.054 |
| 4 | 1 |
|
|
|
Tumor-node-metastasis stage |
|
| 0.281 |
| I | 0.78 | 0.58–1.04 | 0.100 |
| II | 0.70 | 0.41–1.18 | 0.191 |
|
III | 1 |
|
|
| Metastatic lymph
node ratio score |
|
| <0.001 |
| 0 | 0.58 | 0.49–0.70 | <0.001 |
| 1 | 0.63 | 0.48–0.81 | <0.001 |
| 2 | 0.95 | 0.85–1.07 | 0.366 |
| 3 | 1 |
|
|
Discussion
The present study demonstrated that the score and
Lauren classification had independent prognostic relevance on
predicting the survival of postoperative patients with GC. Overall,
the rN score demonstrated a better prognostic value compared with
the N stage, and an increased rN score was associated with a
shorter OS time.
The N stage is based on the number of local lymph
nodes exhibiting metastasis, and has been used in routine clinical
practice for years, as it possesses significant diagnostic value
for patients with GC. However, it has been demonstrated that an
insufficient or extended number of lymph nodes being examined may
cause staging deviation (4), which is
observed in ~15% of patients with GC when using the TNM staging
system (27). rN therefore is
associated with potential advantages in minimizing the stage
migration phenomenon for patients with an insufficient number of
assessed lymph nodes. Using rN alongside the TNM system may assist
in predicting the relapse and survival rates for patients with GC.
However, another study could not confirm this result and reported
no benefit of rN over N stage in the prediction of patient outcome
(28). In the present study, ROC
curves were used to compare the prediction accuracy between rN and
N stage. The results demonstrated that rN was a better metric than
N stage for predicting the patient outcome. However, as the sample
size was small, future investigations with a larger cohort are
required in order to validate these results.
According to the current TNM staging system, it is
necessary to examine ≥15 lymph nodes. However, this is often not
achievable in practice due to a surgeon's lack of experience and
the low extent of surgical lymph node dissection. This may lead to
stage underestimation and affect the management and/or prognosis of
a patient. Previous studies have suggested that rN may still
accurately predict patient prognosis, despite requiring an
examination of <15 lymph nodes (10,26). The
present study is in accord with these results. In Western
countries, extended lymph node dissection is not considered to
provide survival benefit for patients; D1 radical resection is
frequently performed, leading to <15 lymph nodes being examined
(29,30). The results from the present study
suggested that the number of examined lymph nodes did not exhibit
significant prognostic value for OS.
A number of studies have focused on the prognostic
significance of rN in other types of malignant tumor, including
esophageal carcinoma (31), breast
cancer (32), non-small cell lung
cancer (33), colon cancer (34), pancreatic adenocarcinoma (35) and carcinoid tumors (36). The rN was identified to be an
independent prognostic marker in these types of tumor, with the
exception of carcinoid tumors (36).
Consistent with these results, the present study demonstrated that
the rN score was a significant prognostic factor based on
univariate and multivariate analyses, as an increased rN score was
associated with a reduced OS time.
Lauren classification is the most commonly used
histological system for GC, dating back to 1965. Each
classification type has distinct pathological, epidemiological and
prognostic characteristics. Previous studies have reported the
relevance of the Lauren classification, especially the diffuse and
intestinal type, in regards to survival prediction (16,17,37). Qiu
et al (38) demonstrated that
Lauren classification was an independent prognostic factor, as the
patients with diffuse type GC had a worse prognosis compared with
the patients with intestinal type GC (38). However, Berlth et al (39) indicated that the Lauren classification
was not associated with patient OS. The study did not identify that
the diffuse type was independently associated with a poor
prognosis, and the Lauren classification was only associated
significantly with prognosis in univariate analysis and not in
multivariate analysis (39). In the
present study, Lauren classification was identified as an
independent prognostic factor for OS in univariate and multivariate
analysis. The diffuse type classification was associated with the
worst prognosis, consistent with the results presented by Qiu et
al (38). The present study also
conducted subgroup analysis based on the Lauren classification. The
association of the rN score with the prognosis in each subgroup was
assessed. The rN score was identified as an independent predictor
of survival in the diffuse type subgroup. The χ2 test
was applied to assess whether the rN score and the Lauren
classification influenced one another; it was demonstrated that
there was no association between the rN score and the diffuse type
subgroup. Therefore, rN may be suitable as an independent
prognostic marker for patients with diffuse type GC. Cox regression
modal analysis of the diffuse type subgroup further supported this
conclusion. To the best of our knowledge, this is the first report
to demonstrate that rN exhibited particular prognostic significance
for patients with diffuse type GC.
The results of the present study should be
considered in the context of its limitations. The sample size of
the present study was not large enough for analysis by further
subgroup stratification. Therefore, future studies with larger
sample sizes are required in order to validate the results obtained
from subgroup analysis. Additionally, univariate analysis
demonstrated that tumor diameter was a significant predictor of GC
whereas the T stage was not. This may have been due to stage
distribution bias in the cohort of the present study. The use of a
larger sample size may allow the production of more consistent
results.
In conclusion, the present study demonstrated that
the rN score and the Lauren classification were independent
prognostic factors for the OS for patients with GC following
radical resection. It was determined that the rN score was more
effective at predicting OS for patients with GC following radical
resection than N staging. The data also demonstrated that rN may be
used as an independent predictor of survival in patients with
diffuse type GC.
References
|
1
|
Torre LA, Siegel RL, Ward EM and Jemal A:
Global cancer incidence and mortality rates and trends-an update.
Cancer Epidemiol Biomarkers Prev. 25:16–27. 2016. View Article : Google Scholar : PubMed/NCBI
|
|
2
|
Chen W, Zheng R, Baade PD, Zhang S, Zeng
H, Bray F, Jemal A, Yu XQ and He J: Cancer statistics in China,
2015. CA Cancer J Clin. 66:115–132. 2016. View Article : Google Scholar : PubMed/NCBI
|
|
3
|
Siewert JR, Böttcher K, Stein HJ and Roder
JD: Relevant prognostic factors in gastric cancer: Ten-year results
of the German Gastric Cancer Study. Ann Surg. 228:449–461. 1998.
View Article : Google Scholar : PubMed/NCBI
|
|
4
|
Edge SB and Compton CC: The American Joint
Committee on Cancer: The 7th edition of the AJCC cancer staging
manual and the future of TNM. Ann Surg Oncol. 17:1471–1474. 2010.
View Article : Google Scholar : PubMed/NCBI
|
|
5
|
Inoue K, Nakane Y, Iiyama H, Sato M,
Kanbara T, Nakai K, Okumura S, Yamamichi K and Hioki K: The
superiority of ratio-based lymph node staging in gastric carcinoma.
Ann Surg Oncol. 9:27–34. 2002. View Article : Google Scholar : PubMed/NCBI
|
|
6
|
Nitti D, Marchet A, Olivieri M, Ambrosi A,
Mencarelli R, Belluco C and Lise M: Ratio between metastatic and
examined lymph nodes is an independent prognostic factor after D2
resection for gastric cancer: Analysis of a large European
monoinstitutional experience. Ann Surg Oncol. 10:1077–1085. 2003.
View Article : Google Scholar : PubMed/NCBI
|
|
7
|
Wang J, Dang P, Raut CP, Pandalai PK,
Maduekwe UN, Rattner DW, Lauwers GY and Yoon SS: Comparison of a
lymph node ratio-based staging system with the 7th AJCC system for
gastric cancer: Analysis of 18,043 patients from the SEER database.
Ann Surg. 255:478–485. 2012. View Article : Google Scholar : PubMed/NCBI
|
|
8
|
Wu XJ, Miao RL, Li ZY, Bu ZD, Zhang LH, Wu
AW, Zong XL, Li SX, Shan F, Ji X, et al: Prognostic value of
metastatic lymph node ratio as an additional tool to the TNM stage
system in gastric cancer. Eur J Surg Oncol. 41:927–933. 2015.
View Article : Google Scholar : PubMed/NCBI
|
|
9
|
Zeng WJ, Hu WQ, Wang LW, Yan SG, Li JD,
Zhao HL, Peng CW, Yang GF and Li Y: Lymph node ratio is a better
prognosticator than lymph node status for gastric cancer: A
retrospective study of 138 cases. Oncol Lett. 6:1693–1700. 2013.
View Article : Google Scholar : PubMed/NCBI
|
|
10
|
Dikken JL, van de Velde CJ, Gönen M,
Verheij M, Brennan MF and Coit DG: The New American Joint Committee
on Cancer/International Union Against Cancer staging system for
adenocarcinoma of the stomach: Increased complexity without clear
improvement in predictive accuracy. Ann Surg Oncol. 19:2443–2451.
2012. View Article : Google Scholar : PubMed/NCBI
|
|
11
|
Zhang BY, Yuan J, Cui ZS, Li ZW, Li XH and
Lu YY: Evaluation of the prognostic value of the metastatic lymph
node ratio for gastric cancer. Am J Surg. 207:555–565. 2014.
View Article : Google Scholar : PubMed/NCBI
|
|
12
|
Deng J, Zhang R, Wu L, Zhang L, Wang X,
Liu Y, Hao X and Liang H: Superiority of the ratio between negative
and positive lymph nodes for predicting the prognosis for patients
with gastric cancer. Ann Surg Oncol. 22:1258–1266. 2015. View Article : Google Scholar : PubMed/NCBI
|
|
13
|
Zhao LY, Li CC, Jia LY, Chen XL, Zhang WH,
Chen XZ, Yang K, Liu K, Wang YG, Xue L, et al: Superiority of lymph
node ratio-based staging system for prognostic prediction in 2575
patients with gastric cancer: Validation analysis in a large single
center. Oncotarget. 7:51069–51081. 2016.PubMed/NCBI
|
|
14
|
Espín F, Bianchi A, Llorca S, Feliu J,
Palomera E, García O, Remon J and Suñol X: Metastatic lymph node
ratio versus number of metastatic lymph nodes as a prognostic
factor in gastric cancer. Eur J Surg Oncol. 38:497–502. 2012.
View Article : Google Scholar : PubMed/NCBI
|
|
15
|
Yamashita K, Sakuramoto S, Katada N,
Futawatari N, Moriya H, Hirai K, Kikuchi S and Watanabe M: Diffuse
type advanced gastric cancer showing dismal prognosis is
characterized by deeper invasion and emerging peritoneal cancer
cell: The latest comparative study to intestinal advanced gastric
cancer. Hepatogastroenterology. 56:276–281. 2009.PubMed/NCBI
|
|
16
|
Zheng H, Takahashi H, Murai Y, Cui Z,
Nomoto K, Miwa S, Tsuneyama K and Takano Y: Pathobiological
characteristics of intestinal and diffuse-type gastric carcinoma in
Japan: An immunostaining study on the tissue microarray. J Clin
Pathol. 60:273–277. 2007. View Article : Google Scholar : PubMed/NCBI
|
|
17
|
Chen YC, Fang WL, Wang RF, Liu CA, Yang
MH, Lo SS, Wu CW, Li AF, Shyr YM and Huang KH: Clinicopathological
variation of lauren classification in gastric cancer. Pathol Oncol
Res. 22:197–202. 2016. View Article : Google Scholar : PubMed/NCBI
|
|
18
|
Washington K: 7th edition of the AJCC
cancer staging manual: Stomach. Ann Surg Oncol. 17:3077–3079. 2010.
View Article : Google Scholar : PubMed/NCBI
|
|
19
|
Lee SR, Kim HO, Son BH, Shin JH and Yoo
CH: Prognostic significance of the metastatic lymph node ratio in
patients with gastric cancer. World J Surg. 36:1096–1101. 2012.
View Article : Google Scholar : PubMed/NCBI
|
|
20
|
Riediger H, Keck T, Wellner U, zur Hausen
A, Adam U, Hopt UT and Makowiec F: The lymph node ratio is the
strongest prognostic factor after resection of pancreatic cancer. J
Gastrointest Surg. 13:1337–1344. 2009. View Article : Google Scholar : PubMed/NCBI
|
|
21
|
Zhang J, Lv L, Ye Y, Jiang K, Shen Z and
Wang S: Comparison of metastatic lymph node ratio staging system
with the 7th AJCC system for colorectal cancer. J Cancer Res Clin
Oncol. 139:1947–1953. 2013. View Article : Google Scholar : PubMed/NCBI
|
|
22
|
Wilson M, Rosato EL, Chojnacki KA,
Chervoneva I, Kairys JC, Cohn HE, Rosato FE Sr and Berger AC:
Prognostic significance of lymph node metastases and ratio in
esophageal cancer. J Surg Res. 146:11–15. 2008. View Article : Google Scholar : PubMed/NCBI
|
|
23
|
Lee SY, Hwang I, Park YS, Gardner J and Ro
JY: Metastatic lymph node ratio in advanced gastric carcinoma: A
better prognostic factor than number of metastatic lymph nodes? Int
J Oncol. 36:1461–1467. 2010.PubMed/NCBI
|
|
24
|
Liu YP, Ma L, Wang SJ, Chen YN, Wu GX, Han
M and Wang XL: Prognostic value of lymph node metastases and lymph
node ratio in esophageal squamous cell carcinoma. Eur J Surg Oncol.
36:155–159. 2010. View Article : Google Scholar : PubMed/NCBI
|
|
25
|
Sun Z, Zhu GL, Lu C, Guo PT, Huang BJ, Li
K, Xu Y, Li DM, Wang ZN and Xu HM: The impact of N-ratio in
minimizing stage migration phenomenon in gastric cancer patients
with insufficient number or level of lymph node retrieved: Results
from a Chinese mono-institutional study in 2159 patients. Ann
Oncol. 20:897–905. 2009. View Article : Google Scholar : PubMed/NCBI
|
|
26
|
Wong J, Rahman S, Saeed N, Lin HY,
Almhanna K, Shridhar R, Hoffe S and Meredith KL: Prognostic impact
of lymph node retrieval and ratio in gastric cancer: A U.S. single
center experience. J Gastrointest Surg. 17:2059–2066. 2013.
View Article : Google Scholar : PubMed/NCBI
|
|
27
|
Bando E, Yonemura Y, Taniguchi K, Fushida
S, Fujimura T and Miwa K: Outcome of ratio of lymph node metastasis
in gastric carcinoma. Ann Surg Oncol. 9:775–784. 2002. View Article : Google Scholar : PubMed/NCBI
|
|
28
|
Dings PJ, Elferink MA, Strobbe LJ and de
Wilt JH: The prognostic value of lymph node ratio in node-positive
breast cancer: A Dutch nationwide population-based study. Ann Surg
Oncol. 20:2607–2614. 2013. View Article : Google Scholar : PubMed/NCBI
|
|
29
|
Taat CW, van Laschot JJ, Gouma DJ and
Obertop H: Role of extended lymph node dissection in the treatment
of gastrointestinal tumours: A review of the literature. Scand J
Gastroenterol Suppl. 212:109–116. 1995. View Article : Google Scholar : PubMed/NCBI
|
|
30
|
McCulloch P, Nita ME, Kazi H and
Gama-Rodrigues J: Extended versus limited lymph nodes dissection
technique for adenocarcinoma of the stomach. Cochrane Database Syst
Rev: CD001964. 2004.
|
|
31
|
Huang J, Hu W, Pang L, Chen J and Yang H:
Value of positive lymph node ratio for predicting postoperative
distant metastasis and prognosis in esophageal squamous cell
carcinoma. Oncol Res Treat. 38:424–428. 2015. View Article : Google Scholar : PubMed/NCBI
|
|
32
|
Chang YJ, Chung KP, Chen LJ and Chang YJ:
Recursive partitioning analysis of lymph node ratio in breast
cancer patients. Medicine (Baltimore). 94:e2082015. View Article : Google Scholar : PubMed/NCBI
|
|
33
|
Sun G, Xue L, Wang M and Zhao X: Lymph
node ratio is a prognostic factor for non-small cell lung cancer.
Oncotarget. 6:33912–33918. 2015. View Article : Google Scholar : PubMed/NCBI
|
|
34
|
Mirzaei Zare A, Abdorrazaghi F, Lotfi M,
Nejad Kazemi B and Shayanfar N: Prognostic value of lymph node
ratio in comparison to lymph node metastases in stage III colon
cancer. Iran J Pathol. 10:127–135. 2015.PubMed/NCBI
|
|
35
|
Zhan HX, Xu JW, Wang L, Zhang GY and Hu
SY: Lymph node ratio is an independent prognostic factor for
patients after resection of pancreatic cancer. World J Surg Oncol.
13:1052015. View Article : Google Scholar : PubMed/NCBI
|
|
36
|
Flatow V, Warner RR, Overbey J and Divino
CM: The prognostic significance of lymph node ratio in carcinoid
tumors. Pancreas. 45:342–344. 2016. View Article : Google Scholar : PubMed/NCBI
|
|
37
|
Choi JK, Park YS, Jung DH, Son SY, Ahn SH,
Park DJ and Kim HH: Clinical relevance of the tumor
location-modified lauren classification system of gastric cancer. J
Gastric Cancer. 15:183–190. 2015. View Article : Google Scholar : PubMed/NCBI
|
|
38
|
Qiu MZ, Cai MY, Zhang DS, Wang ZQ, Wang
DS, Li YH and Xu RH: Clinicopathological characteristics and
prognostic analysis of Lauren classification in gastric
adenocarcinoma in China. J Transl Med. 11:582013. View Article : Google Scholar : PubMed/NCBI
|
|
39
|
Berlth F, Bollschweiler E, Drebber U,
Hoelscher AH and Moenig S: Pathohistological classification systems
in gastric cancer: Diagnostic relevance and prognostic value. World
J Gastroenterol. 20:5679–5684. 2014. View Article : Google Scholar : PubMed/NCBI
|