Introduction
Breast cancer is the most common female malignancy
worldwide and its incidence increases annually (1,2). The
caveolin-1 (Cav-1) gene is a member of the caveolin gene family,
which is located at chromosomal locus 7q31.1 (3,4), and
encodes the Cav-1 protein, which is a principal component of plasma
membrane caveolae (5,6). Cav-1 is expressed in various breast cell
types, including mammary gland epithelial cells, fibroblasts,
adipocytes, endothelial cells and smooth muscle cells (7–9), and
functions in tumorigenesis primarily through lipid transport,
membrane transport, gene regulation and signal transduction
(10). Its abnormal expression in
breast cancer, where it is a putative tumor suppressor (11), is associated with the occurrence,
progression and poor prognosis of breast cancer (12–14).
Epidermal growth factor receptor (EGFR) interacts directly with the
caveolin-scaffolding domain through a caveolin-binding sequence
motif located in the intracellular kinase domain of the receptor
(5,15), and this interaction has been
demonstrated to modulate EGFR-mediated signaling (16,17).
Cav-1 mutation or abnormal expression is able to
positively regulate the expression of EGFR (15,18,19), which
is overexpressed in ~33% of breast cancers (20). Abnormal activation of EGFR often
indicates poor prognosis and has a marked association with
differentiation and metastasis of tumor cells (21–27).
Importantly, EGFR is highly concentrated in caveolae membrane
fractions and binds Cav-1 via a caveolin-binding motif of the
kinase domain (15,28,29).
Considering the prognostic capacity of EGFR in
breast cancer, the wide expression of Cav-1 in numerous breast
cancers and the association between them, the present study sought
to use a combination approach analyzing two proteins as a combined
prognostic marker for breast cancer, something which, to the best
of our knowledge, has not previously been reported.
Materials and methods
Tissue microarray (TMA)
Archived paraffin blocks of 306 female breast cancer
tumor tissues and 50 adjacent normal tissues were obtained from The
Third Affiliated Hospital of Harbin Medical University (Harbin,
China) between January 2007 and December 2007 (age range, 27–82
years; median age, 49 years; operated). Tissue samples used in the
present study were approved by The Hospital Ethics Committee for
Ethical Review of Research Involving Human Subjects at Harbin
Medical University. None of the patients in the present study
received radiation or chemotherapy prior to the surgery that
produced the paraffin-embedded tissues. Breast cancer TMAs created
from each of the 356 total tissue samples were used for
immunohistochemistry (IHC). Primary cancers were evaluated in
accordance with the 7th edition of the American Joint Committee on
Cancer tumor-node-metastasis (TNM) staging system (30). Estrogen receptor (ER)(+), progesterone
receptor (PR)(+), human epidermal growth factor receptor 2 (HER-2)
(+), p53 (+) and Ki-67 (+) patients were identified by a review of
the pathological report. Median follow-up time for overall survival
(OS) of 306 patients was 68.27 months (range, 3.85–75.02 months),
and median follow-up time for disease-free survival (DFS) of 306
patients was 69.41 months (range, 2.14–75.02 months). Follow-ups
for all patients continued until December 2013 or until mortality.
The clinicopathological features of the 306 patients included are
summarized in Table I.
 | Table I.Patient baseline and disease
characteristics. |
Table I.
Patient baseline and disease
characteristics.
| Feature | Patients |
|---|
| Total, n (%) | 306 (100) |
| Median age, years
(range) | 49 (27–82) |
| Age, years, n
(%) |
|
| ≤50 | 175 (57.19) |
|
>50 | 131 (42.81) |
| Tumor size, cm, n
(%) |
|
|
<2 | 121 (39.54) |
| >2 and
≤5 | 171 (55.88) |
|
>5 | 14 (4.58) |
| Differentiation, n
(%) |
|
| High | 20 (6.54) |
|
Moderate | 260 (84.97) |
|
Poor | 26 (8.49) |
| Adjuvant
chemotherapy, n (%) |
|
|
Yes | 249 (81.37) |
| No | 57 (18.63) |
| Histological type,
n (%) |
|
|
IDC | 276 (90.20) |
| Other
types | 30 (9.80) |
| ATCC stage, n
(%) |
|
| I | 63 (20.59) |
| II | 192 (62.75) |
|
III–IV | 51 (16.66) |
| Lymph node status,
n (%) |
|
| No | 152 (49.67) |
|
Yes | 154 (50.33) |
| Breast cancer
subtype, n (%) |
|
| Luminal
A | 145 (47.39) |
| Luminal
B | 119 (38.89) |
|
HER-2+ | 18 (5.91) |
|
Basal-like | 24 (7.81) |
| p53 status, n
(%) |
|
|
Negative | 207 (67.65) |
|
Positive | 99 (32.35) |
| ER status, n
(%) |
|
|
Negative | 110 (35.95) |
|
Positive | 196 (64.05) |
| PR status, n
(%) |
|
|
Negative | 59 (19.28) |
|
Positive | 247 (80.72) |
| HER-2 status, n
(%) |
|
|
Negative | 237 (77.45) |
|
Positive | 69 (22.55) |
| Ki-67 status, n
(%) |
|
|
Negative | 48 (15.69) |
|
Positive | 258 (84.31) |
| Survival status, n
(%) |
|
|
Deceased | 56 (18.30) |
|
Alive | 250 (81.70) |
| Relapse status, n
(%) |
|
|
Yes | 40 (13.07) |
| No | 266 (86.93) |
| Median disease-free
survival (range) | 69.41
(2.14–75.02) |
| Median overall
survival (range) | 68.27
(3.85–75.02) |
IHC
Paraffin-embedded breast cancer TMA (Shanghai Outdo
Biotech Co., Ltd.) sections (3 µm) were deparaffinized with pure
xylene for 15 min and rehydrated in a descending alcohol series
(from 70, 85 and 95% until pure alcohol for 5 min) at room
temperature. The TMAs were subsequently submerged in citrate (pH
6.0) and autoclaved at 120°C for 2 min, then quenched with 3%
H2O2 for 10 min and blocked with 5% goat
serum (OriGene Technologies, Inc., Beijing, China) for 10 min at
room temperature. TMAs were cooled for 30 min prior to incubation
with primary rabbit polyclonal antibody for Cav-1 (cat. no. 3238;
dilution, 1:100; Cell Signaling Technology, Inc., Danvers, MA, USA)
and a rabbit polyclonal instant antibody against EGFR (cat. no.
YT1488; dilution, 1:200; Immunoway Biotechnology Company, Plano,
TX, USA) overnight at 4°C. Finally, TMAs were incubated with
horseradish peroxidase-linked goat anti-rabbit secondary antibody
(cat. no. PV6001; OriGene Technologies, Inc.) for 20 min at room
temperature, the sections were then stained with DAB (OriGene
Technologies, Inc.) to detect the proteins for 2 min at 37°C,
followed by counterstaining with hematoxylin for 5 min at 37°C.
Slides were dehydrated through an ascending series of alcohols
(from 85 and 95% until pure alcohol for 5 min) and mounted. IHC and
scoring were performed using a light microscope at magnifications,
×100 and ×400, separately for all samples by two independent
investigators without any prior knowledge of the
clinicopathological data. The degree of Cav-1 IHC staining was
evaluated in tumor and stromal cells and scored
semi-quantitatively. Cav-1 staining in tumor and stromal cells was
scored semi-quantitatively as: 0, no staining; 1, either diffuse
weak or focal strong staining in <30% of cells; or 2, strong
staining of ≥30% cells (14).
Comparison with endothelial cell staining intensity was used to
assess the intensity of the immunoreactions and Cav-1
down-expression corresponded to grading scores 0 and 1. IHC
staining for EGFR was scored according to the following criteria:
-, 0–5%; +, 6–25%; ++, 26–50%; and +++, 51–100% of the cells
stained. To optimally balance the multitude of the two sides
divided on the basis of the positive staining rate, a threshold of
25% was used for EGFR. Positive values indicate that the positive
staining cell rates were increased compared with the threshold
value, whereas negative values indicate the rate was decreased
compared with or equal to the threshold value.
Statistical analysis
Statistical calculations were performed using the
SPSS statistical software package (version 19.0; IBM SPSS, Armonk,
NY, USA). P<0.05 was considered to indicate a statistically
significant difference. Correlation between expression levels was
determined using the Pearson coefficient. χ2 tests were
used to analyze the association between Cav-1 and EGFR expression
and clinicopathological features. Cumulative OS curves were
generated according to the Kaplan-Meier estimator method, and the
association between each of the variables and survival was assessed
using the log-rank test in a univariate analysis. To identify
independent predictors of survival, the parameters were then tested
using the multivariate Cox's proportional hazards model.
Results
Expression of cytoplasmic EGFR and
Cav-1 and stromal Cav-1 in breast cancer tissues
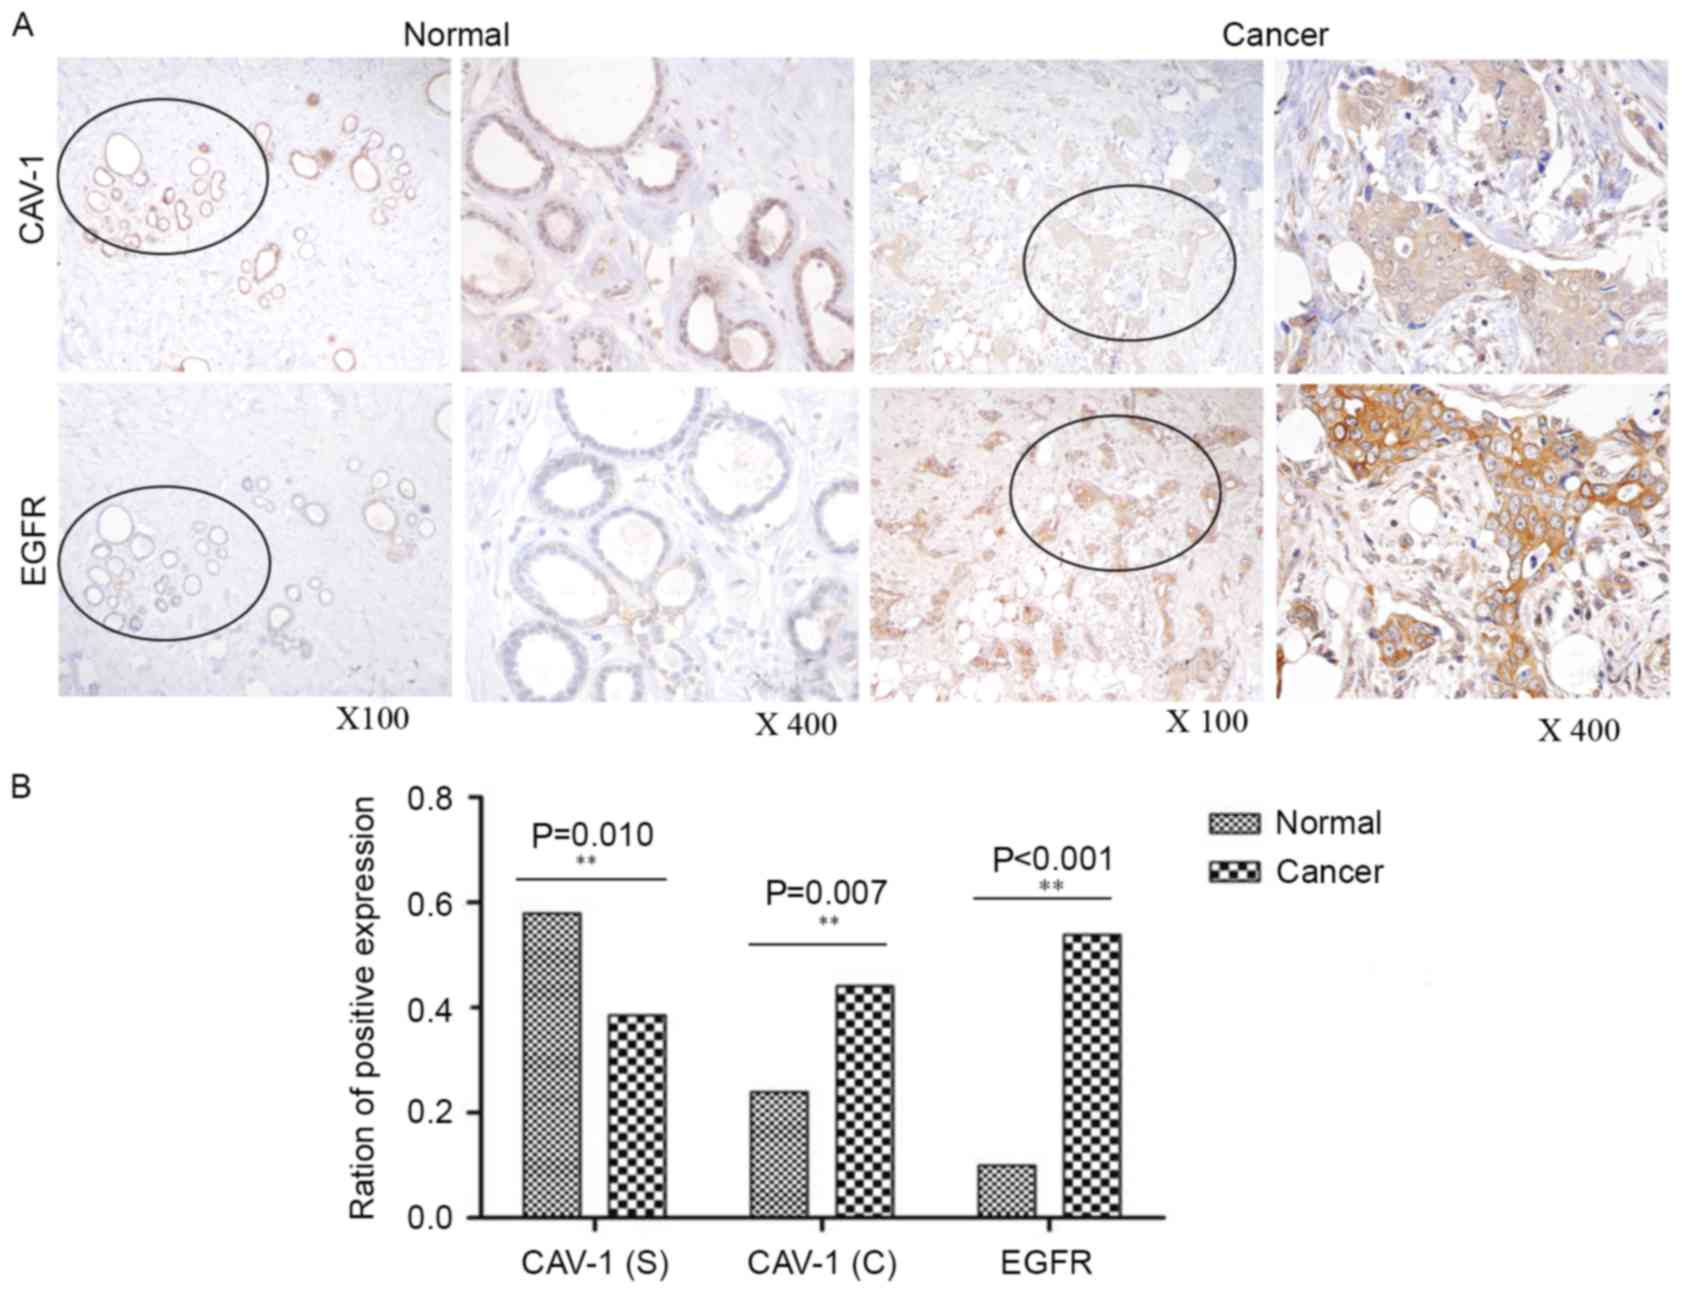
Using IHC, the expression of cytoplasmic EGFR and
Cav-1 and stromal Cav-1 was detected in patient breast tumor and
adjacent normal breast tissues. As presented in Fig. 1, cytoplasmic EGFR and Cav-1 were
significantly overexpressed (P<0.001 and P=0.007, respectively)
in tumor tissues relative to adjacent normal tissues, whereas
stromal Cav-1 appeared to be downregulated (P=0.010). IHC analysis
revealed that cytoplasmic EGFR and Cav-1 were overexpressed in
53.92% (165/306) and 44.12% (135/306), respectively, of tumor
tissues, whereas stromal Cav-1 was downregulated in 38.56%
(118/306) of tumor tissues.
Clinical significance of cytoplasmic
EGFR and Cav-1 and stromal Cav-1 expression in breast cancer
tissues
Downregulation of stromal Cav-1 in breast cancer was
associated with differentiation (P=0.050), p53 status (P=0.001) and
Ki-67 status (P=0.042), but not with any of the other clinical
parameters. Overexpression of cytoplasmic EGFR was positively
associated with HER-2 (P=0.015) and Ki-67 (P=0.015) expression
(data not shown). Statistical correlation analysis demonstrated
that EGFR expression was positively correlated with cytoplasmic
Cav-1 expression (r=0.177; P=0.002), but no correlation with
stromal Cav-1 expression in tumor tissues was identified; however,
low expression of stromal Cav-1 was negatively correlated with
cytoplasmic Cav-1 expression in tumor tissues of total patients
group (r=−0.325; P<0.001; Table
II). EGFR expression was positively correlated with cytoplasmic
Cav-1 expression (r=0.181; P=0.005), but no correlation with
stromal Cav-1 expression in tumor tissues was identified; however,
low expression of stromal Cav-1 was positively correlated with
cytoplasmic Cav-1 expression in tumor tissues of the total patients
group (r=−0.272; P<0.001; Table
III).
| Table II.Correlation of stromal Cav-1,
cytoplasmic Cav-1 and EGFR in the total group. |
Table II.
Correlation of stromal Cav-1,
cytoplasmic Cav-1 and EGFR in the total group.
| Variable | Stromal Cav-1 | EGFR |
|---|
| Cytoplasmic
Cav-1 |
|
|
|
Spearman's correlation | −0.325 | 0.177 |
|
P-valuea |
<0.001a | 0.002a |
| Stromal Cav-1 |
|
|
|
Spearman's correlation |
| 0.039 |
|
P-valuea |
| 0.511 |
| Table III.Correlation of stromal Cav-1,
cytoplasmic Cav-1 and EGFR in the chemotherapy group. |
Table III.
Correlation of stromal Cav-1,
cytoplasmic Cav-1 and EGFR in the chemotherapy group.
| Variable | Stromal Cav-1 | EGFR |
|---|
| Cytoplasmic
Cav-1 |
|
|
|
Spearman's correlation | −0.272 | 0.181 |
|
P-valuea |
<0.001a | 0.005a |
| Stromal Cav-1 |
|
|
|
Spearman's correlation |
| 0.016 |
|
P-valuea |
| 0.800 |
Clinical significance of combined
marker EGFR/stromal Cav-1 expression in breast cancer tissues
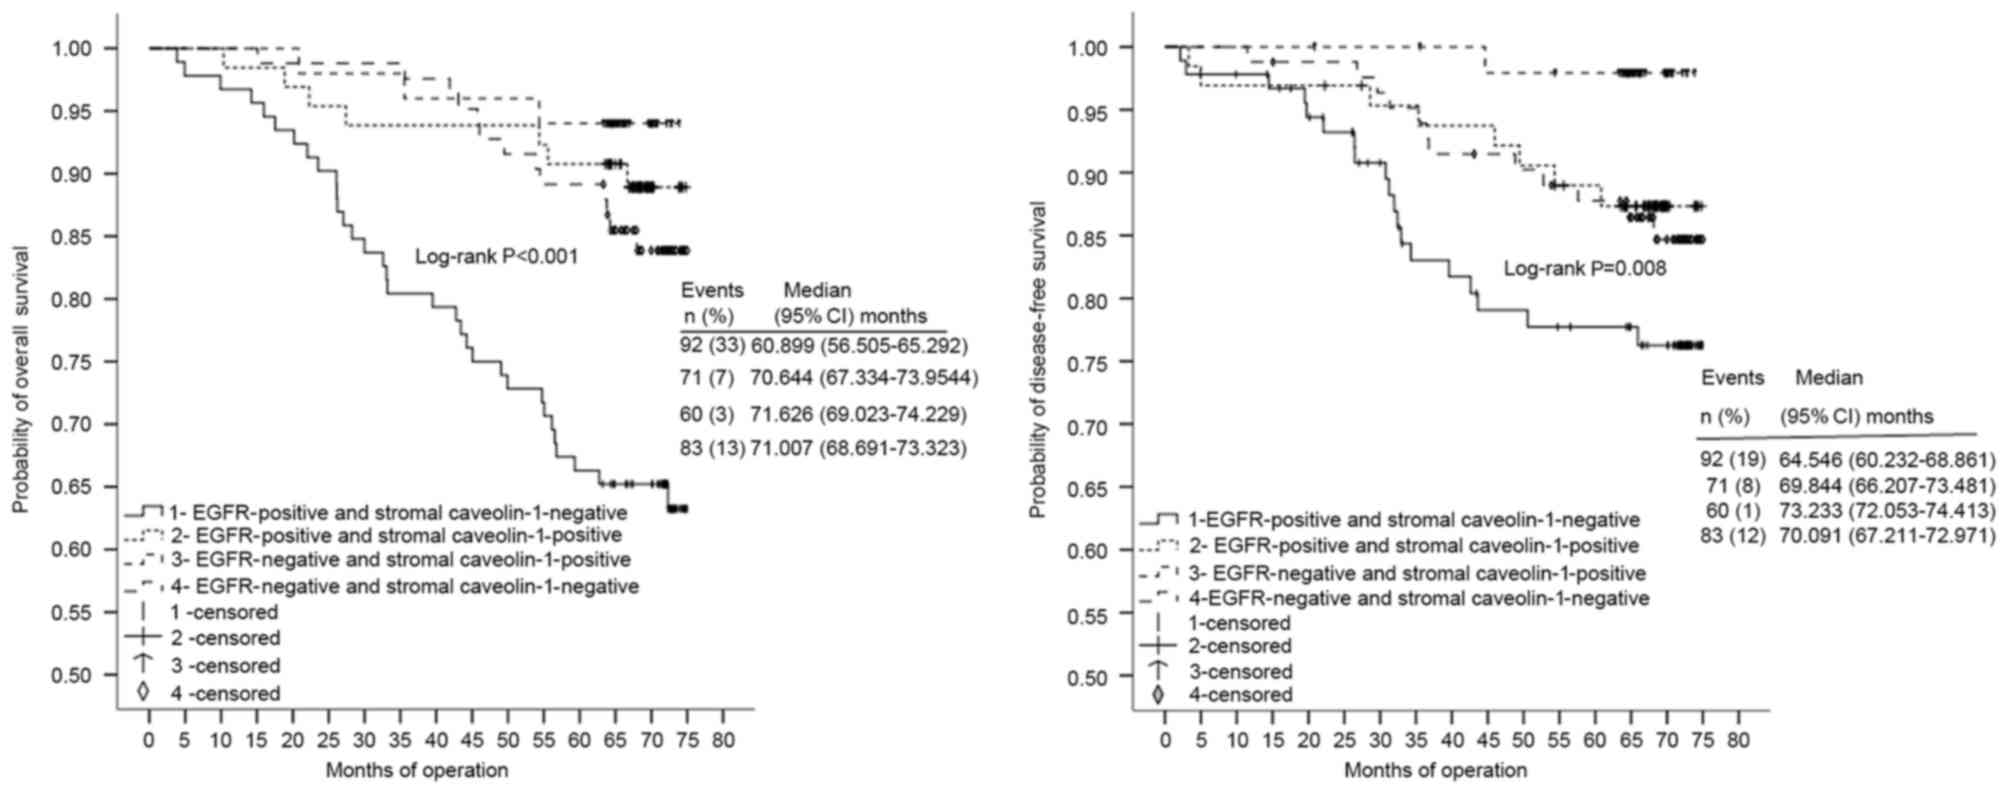
Four patient subgroups were classified according to
the combined expression status of EGFR and stromal Cav-1 (Fig. 2). For OS and DFS, patient tissues with
concordant high EGFR (P<0.001) and low stromal Cav-1 (P=0.008)
expression (n=92) were observed isolated from those of the other
three groups, classified as low EGFR/high stromal Cav-1 (n=60),
high EGFR/high stromal Cav-1 (n=71) and low EGFR/low stromal Cav-1
(n=83). To simplify the data and illustrate a mechanistic
framework, the four groups were consolidated into Cluster A
[EGFR(+) and stromal Cav-1(−), n=92] and Cluster B [either EGFR(−)
or stromal Cav-1(+), n=214]. Notably, there were significant
associations with differentiation (P=0.041), p53 status (P=0.019)
and PR status (P=0.036) for the Cluster A subgroup (data not
shown).
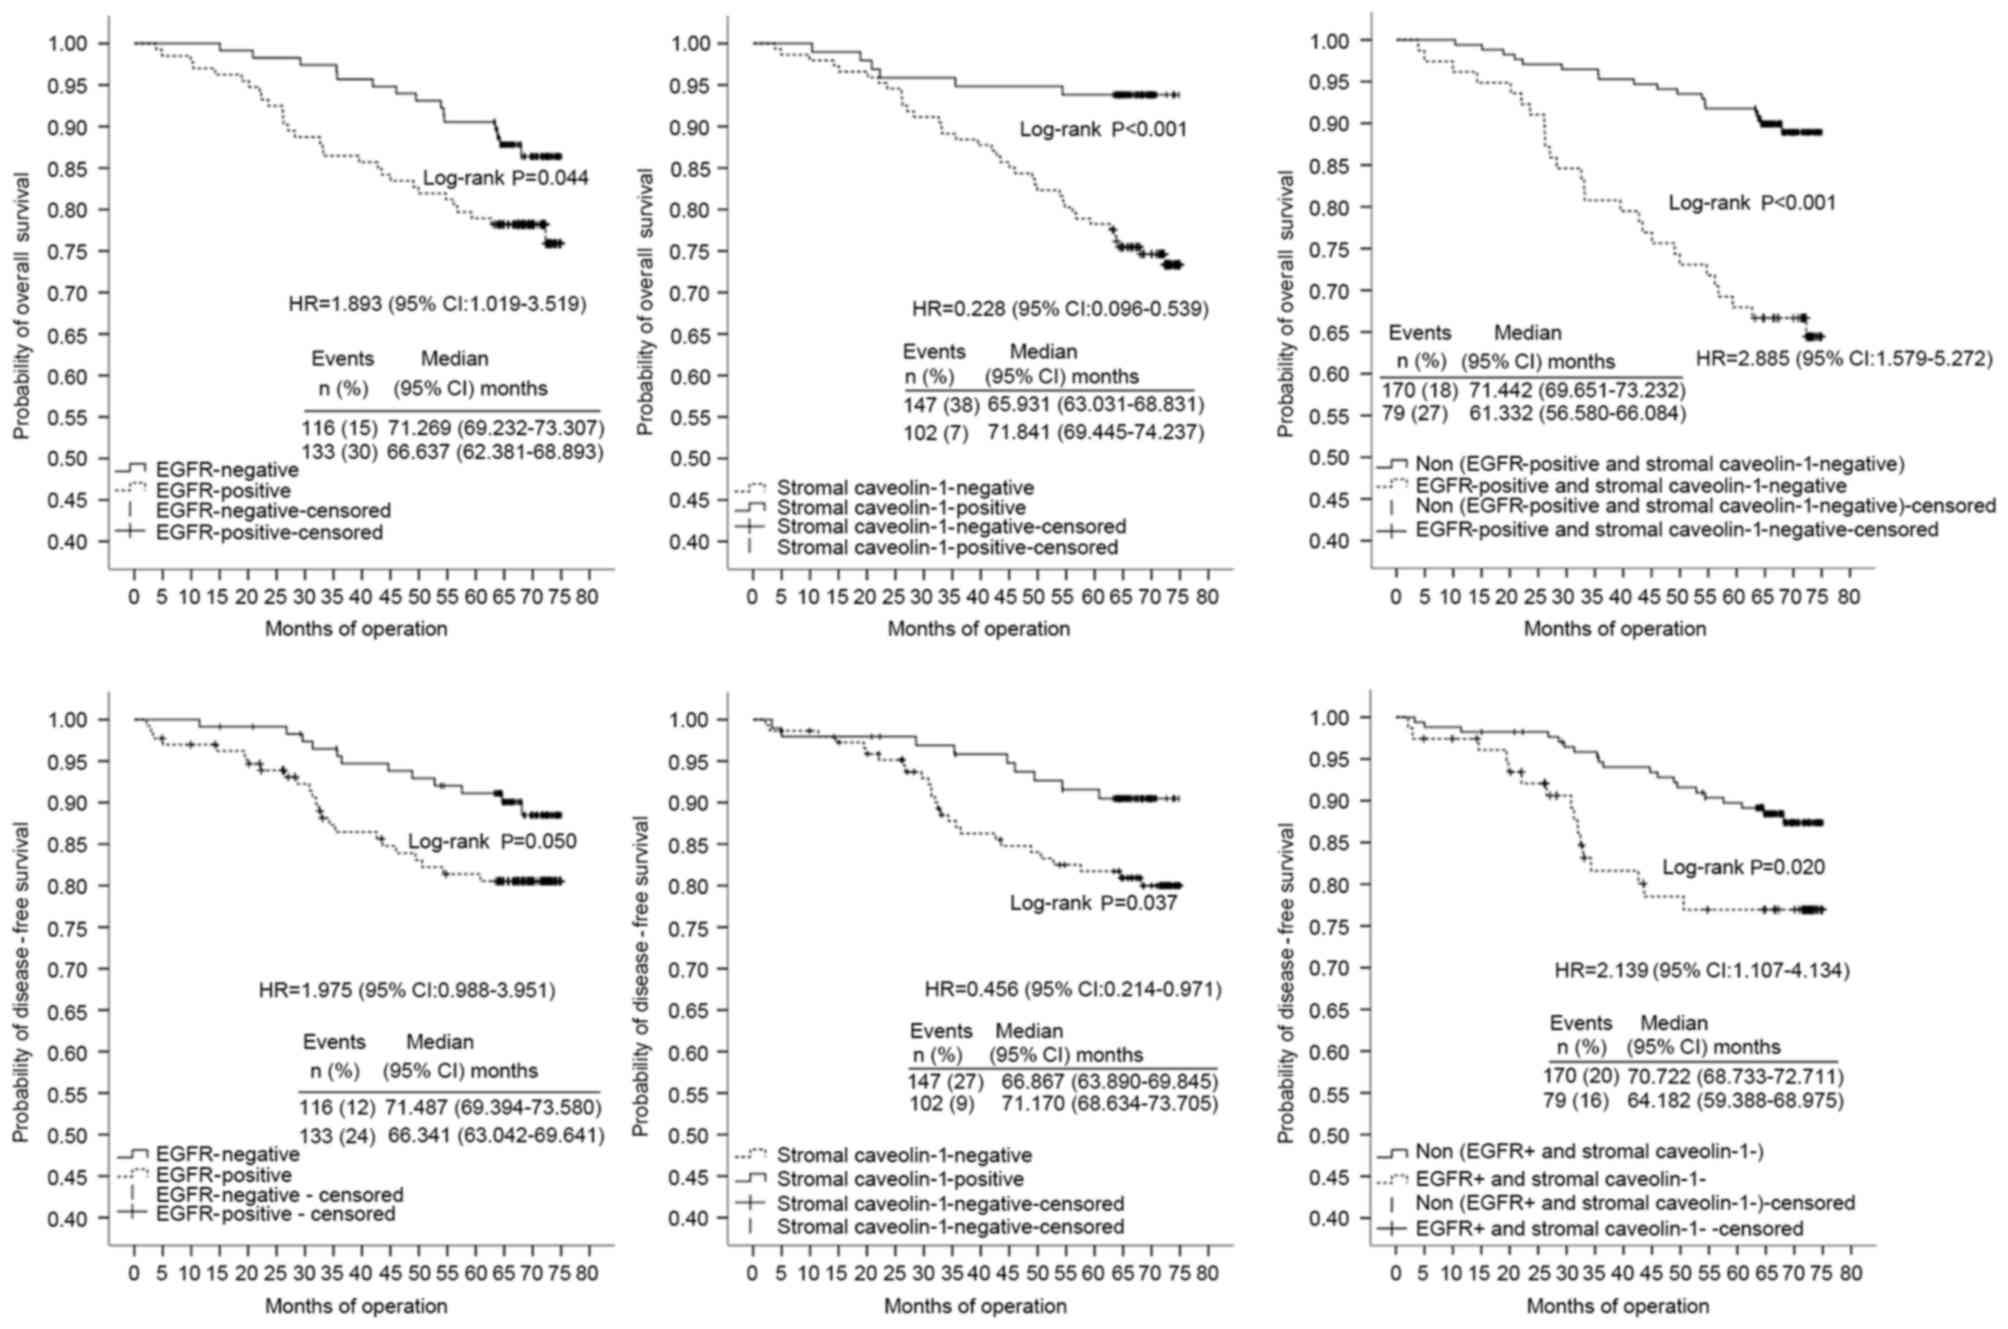
OS univariate and multivariate
analyses
The patients were divided into two further groups
(adjuvant chemotherapy-treated patients, n=249; non-adjuvant
chemotherapy-treated patients, n=57) on the basis of whether they
received adjuvant chemotherapy soon after surgical resection or
not. In multivariate analyses using stratified Cox regression, OS
rates of the adjuvant chemotherapy-treated patients were
significantly lower in tissues with poor/moderate differentiation
(HR, 4.463; 95% CI, 1.683–11.840), high TNM clinical stage (HR,
3.882; 95% CI, 2.237–6.739), stromal Cav-1(−) expression (HR,
0.296; 95% CI, 0.099–0.875) or those in the Cluster A subgroup (HR,
2.418; 95% CI, 1.139–5.133) (Table
IV; Fig. 3). TNM clinical stage,
p53 expression and combined expression of Cav-1 and EGFR markers
were significant independent prognostic factors for DFS of the
adjuvant chemotherapy-treated patients with HRs of 7.884 (95% CI,
4.029–15.429), 2.738 (95% CI, 1.304–5.748) and 2.688 (95% CI,
1.280–5.643), respectively (Table
IV; Fig. 3). Notably, combined
expression of Cav-1 and EGFR markers was the most marked
independent prognostic factor in multivariate analysis, as
presented in Fig. 3. For non-adjuvant
chemotherapy-treated patients, EGFR, stromal Cav-1 and combined
expression of Cav-1 and EGFR markers no significant correlation
with OS in the multivariate analysis was identified.
| Table IV.Univariate and multivariate analyses
of OS and DFS in patients with chemotherapy group (n=249). |
Table IV.
Univariate and multivariate analyses
of OS and DFS in patients with chemotherapy group (n=249).
|
| OS | DFS |
|---|
|
|
|
|
|---|
|
| Multivariate | Univariate | Multivariate | Univariate |
|---|
|
|
|
|
|
|
|---|
| Variable | HR (95% CI) |
P-valuea | HR (95% CI) |
P-valuea | HR (95% CI) | P-value | HR (95% CI) | P-value |
|---|
| Age, years (<50
vs. ≥50) | 1.586
(0.884–2.846) | 0.122 |
|
| 1.066
(0.550–2.069) | 0.85 |
|
|
| Differentiation
(poor/moderate vs. high) | 3.601
(1.516–8.555) | 0.004a | 4.463
(1.683–11.840) | 0.003a | 2.989
(1.052–8.496) | 0.040 |
| 0.056 |
| AJCC stage (III/IV
vs. I/II) | 12.305
(1.695–89.322) | 0.013a | 3.882
(2.237–6.739) | 0.000 | 4.877
(1.172–20.306) | 0.029 | 7.884
(4.029–15.426) | 0.000 |
| Histological type
(IDC vs. other types) | 0.503
(0.122–2.076) | 0.342 |
|
| 0.995
(0.305–3.246) | 0.994 |
|
|
| Breast cancer
subtype |
| 0.215 |
|
|
| 0.191 |
|
|
| Luminal
B vs. luminal A | 0.546
(0.234–1.277) | 0.163 |
|
|
0.692(0.247–1.942) | 0.485 |
|
|
|
Basal-like/HER-2 + vs. luminal
A | 0.922
(0.406–2.096) | 0.847 |
|
| 1.343
(0.498–3.617) | 0.56 |
|
|
| ER expression
(positive vs. negative) | 0.449
(0.250–0.807) | 0.007a |
| 0.223 | 0.571
(0.297–1.099) | 0.094 |
| 0.304 |
| PR expression
(positive vs. negative) | 0.735
(0.372–1.450) | 0.374 |
|
| 0.697
(0.328–1.482) | 0.348 |
|
|
| Ki-67 expression
(positive vs. negative) | 0.656
(0.258–1.671) | 0.377 |
|
| 1.519
(0.688–3.352) | 0.301 |
|
|
| HER-2 expression
(positive vs. negative) | 2.291
(1.232–4.259) | 0.009a |
| 0.432 | 1.552
(0.729–3.301) | 0.254 |
|
|
| p53 expression
(positive vs. negative) | 2.577
(1.417–4.687) | 0.002a |
| 0.412 | 2.901
(1.479–5.692) | 0.002 | 2.738
(1.304–5.748) | 0.008 |
| Cytoplasmic Cav-1
expression (positive vs. negative) | 1.197
(0.657–2.182) | 0.557 |
|
| 0.79
(0.562–2.130) | 1.094 |
|
|
| Stromal Cav-1
expression (positive vs. negative) | 0.228
(0.096–0.539) | 0.001a | 0.296
(0.099–0.875) | 0.028 | 0.456
(0.214–0.971) | 0.042 |
| 0.433 |
| EGFR expression
(positive vs. negative) | 1.893
(1.019–3.519) | 0.044a |
| 0.786 | 1.975
(0.988–3.951) | 0.054 |
| 0.233 |
| Combined markers
(Cluster A vs. Cluster B) | 2.885
(1.579–5.272) | 0.001a | 2.418
(1.139–5.133) | 0.021 | 2.139
(1.107–4.134) | 0.024 | 2.688
(1.280–5.643) | 0.009 |
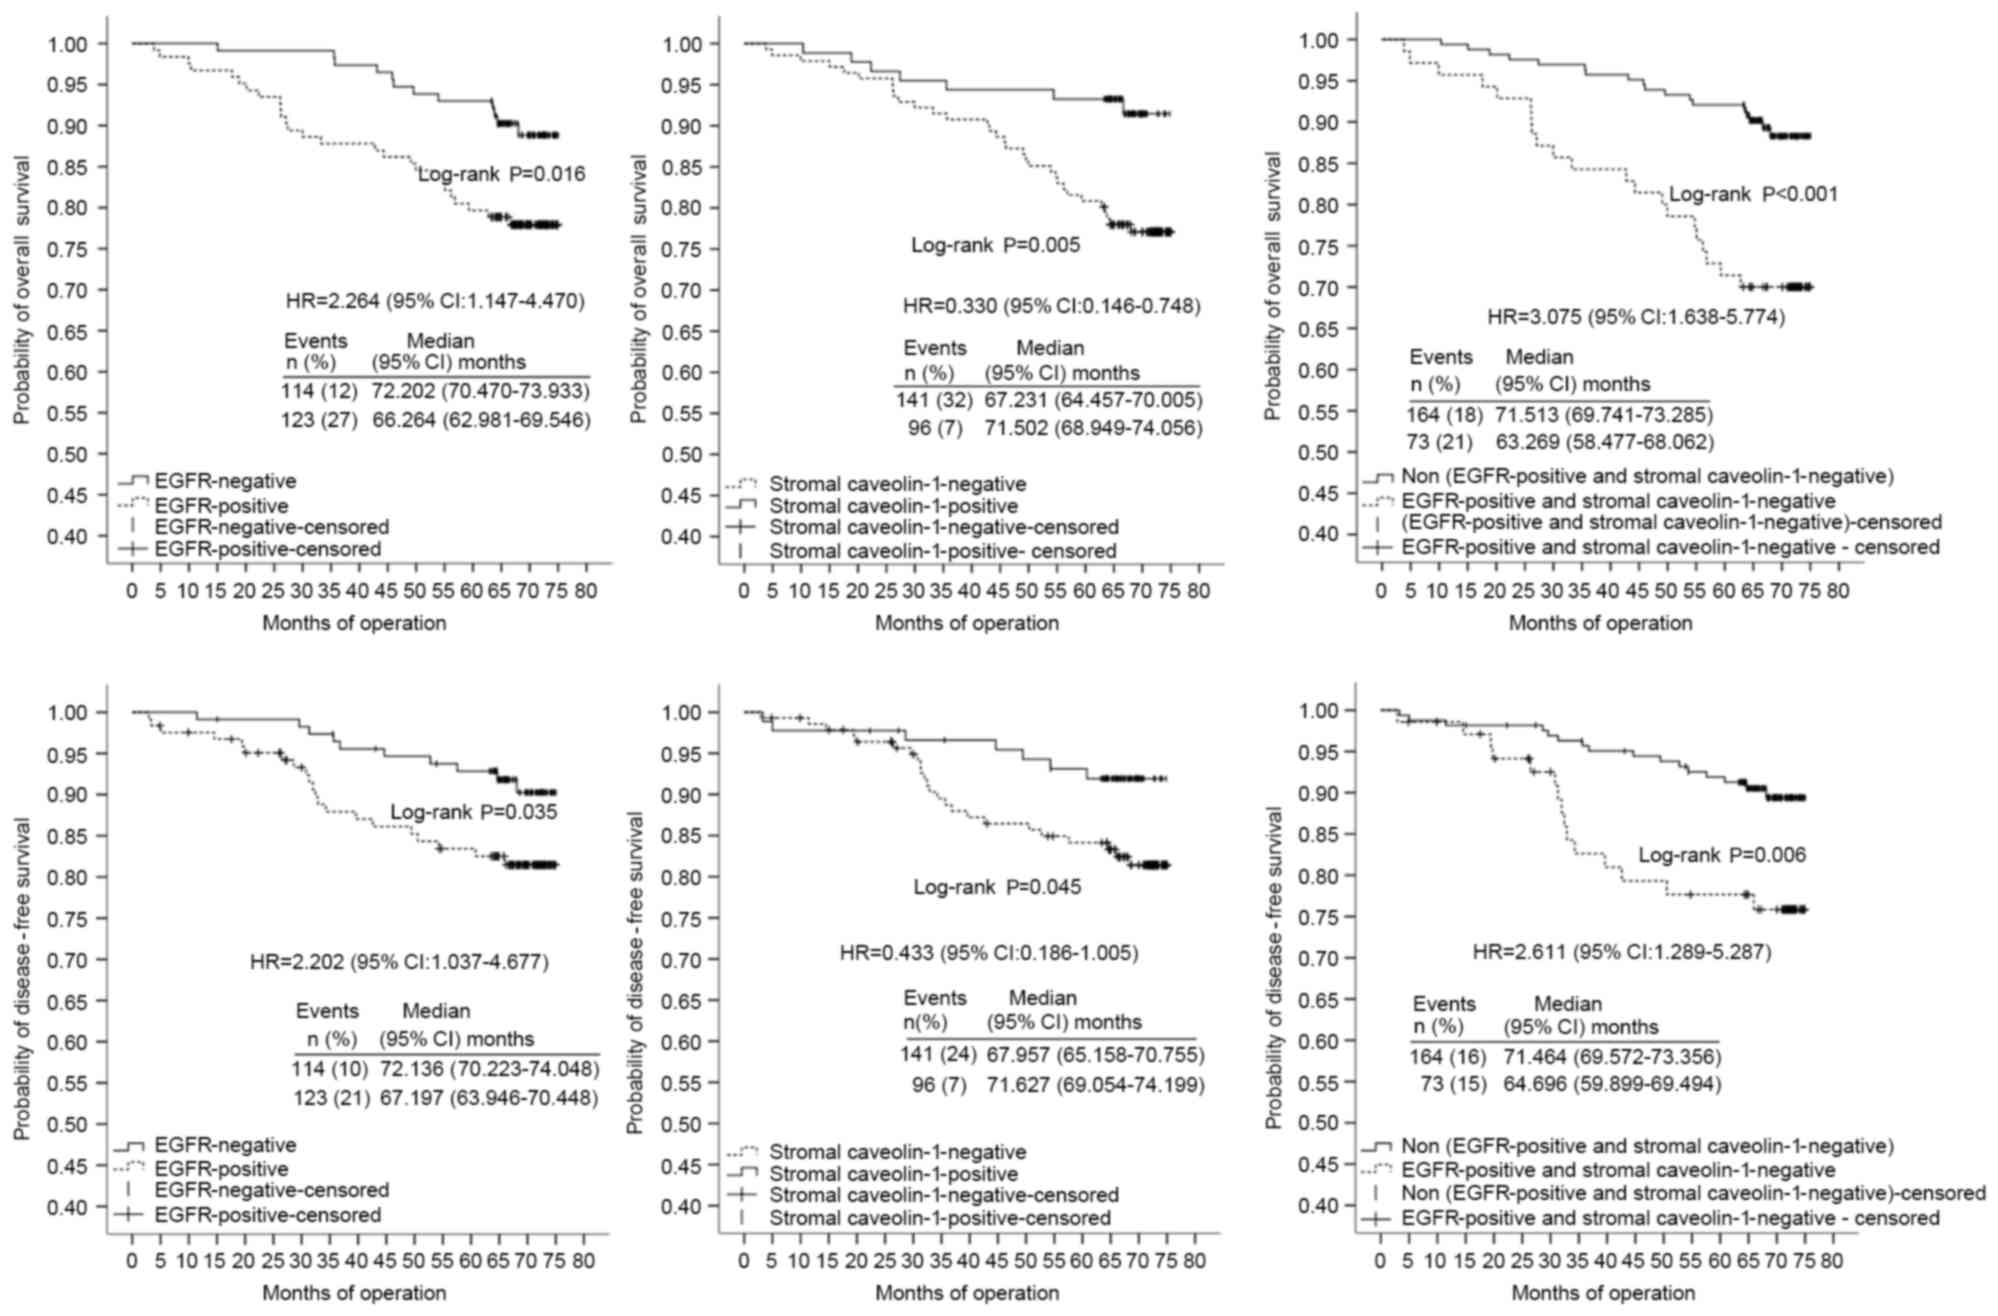
Patients were divided into two groups on the basis
of HER-2 and ER status. Multivariate analysis identified that
differentiation, TNM clinical stage and combined markers were
significant independent prognostic factors for OS of the HER-2(−)
group (n=237) with HRs of 5.589 (95% CI, 1.863–16.766), 11.326 (95%
CI, 1.545–83.025) and 3.287 (95% CI, 1.658–6.516), respectively
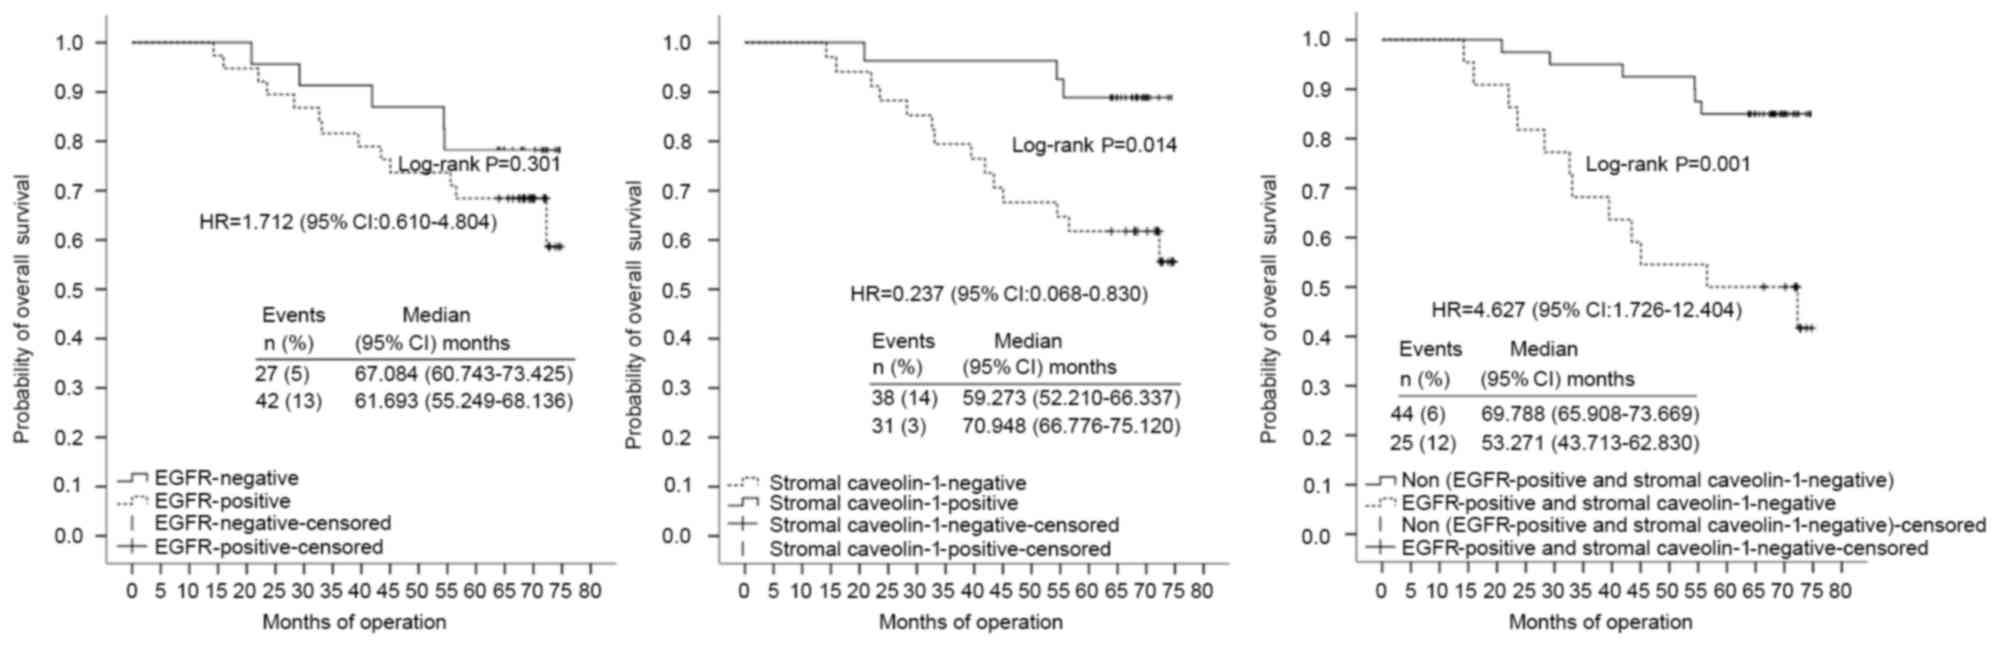
(Table V; Fig. 4). Poor/moderate differentiation (HR,
12.985; CI 95%, 3.325–50.713), high TNM clinical stage (HR, 9.573;
95% CI, 4.463–20.534) and combined markers in Cluster A (HR, 5.023;
95% CI, 2.224–11.345) were also confirmed as independent prognostic
factors for low DFS of the HER-2(−) group (Table V; Fig.
4). High TNM clinical stage (HR, 4.852; 95% CI, 1.919–12.271)
and combined markers in Cluster A (HR, 7.384; 95% CI, 2.522–21.714)
were significant independent prognostic factors for OS in the
HER-2(+) group (n=69) (Table VI;
Fig. 5).
| Table V.Univariate and multivariate analyses
of OS and DFS in patients with HER-2(−) expression (n=237). |
Table V.
Univariate and multivariate analyses
of OS and DFS in patients with HER-2(−) expression (n=237).
|
| OS | DFS |
|---|
|
|
|
|
|---|
|
| Univariate | Multivariate | Univariate | Multivariate |
|---|
|
|
|
|
|
|
|---|
| Variable | HR | 95% CI |
P-valuea | HR | 95% CI | P-value | HR | 95% CI | P-value | HR | 95% CI | P-value |
|---|
| Age, years (<50
vs. ≥50) | 0.962 | (0.380–2.438) | 0.962 |
|
|
| 0.782 | (0.375–1.633) | 0.513 |
|
|
|
| Differentiation
(poor/moderate vs. well) | 1.442 | (0.328–6.350) | 0.628 |
|
|
| 3.503 | (1.059–11.593) | 0.040 | 12.985 | (3.325–50.713) | 0.000 |
| AJCC stage (III/IV
vs. I/II) | 3.892 | (1.637–9.249) | 0.002a | 4.852 | (1.919–12.271) | 0.001 | 4.964 | (1.184–20.807) | 0.028 | 9.573 | (4.463–20.534) | 0.000 |
| Adjuvant
chemotherapy (yes vs. no) | 1.537 | (0.444–5.316) | 0.497 |
|
|
| 1.333 | (0.466–3.811) | 0.591 |
|
|
|
| Histological type
(IDC vs. other types) | 0.041 | (0–24.654) | 0.328 |
|
|
| 0.973 | (0.296–3.200) | 0.964 |
|
|
|
| Breast cancer
subtype |
|
| 0.141 |
|
|
|
|
| 0.141 |
|
|
|
| Luminal B vs.
luminal A | 0.819 | (0.307–2.182) | 0.690 |
|
|
| 0.994 | (0.288–3.434) | 0.993 |
|
|
|
| Basal-like/HER-2 +
vs. luminal A | 1.204 | (0.429–3.380) | 0.724 |
|
|
| 2.049 | (0.583–7.197) | 0.263 |
|
|
|
| ER expression
(positive vs. negative) | 0.580 | (0.306–1.098) | 0.094 |
|
|
| 0.548 | (0.268–1.118) | 0.098 |
|
| 0.061 |
| PR expression
(positive vs. negative) | 0.889 | (0.409–1.935) | 0.767 |
|
|
| 0.766 | (0.330–1.779) | 0.535 |
|
|
|
| Ki-67 expression
(positive vs. negative) | 0.451 | (0.138–1.469) | 0.186 |
|
|
| 1.328 | (0.543–3.248) | 0.534 |
|
|
|
| p53 expression
(positive vs. negative) | 2.469 | (1.302–4.681) | 0.006a |
|
| 0.130 | 2.754 | (1.344–5.646) | 0.006 |
|
| 0.081 |
| Cytoplasmic Cav-1
expression (positive vs. negative) | 1.040 | (0.552–1.961) | 0.903 |
|
|
| 1.118 | (0.559–2.271) | 0.758 |
|
|
|
| Stromal Cav-1
expression (positive vs. negative) | 0.330 | (0.146–0.748) | 0.008a |
|
| 0.278 | 0.433 | (0.186–1.005) | 0.050 |
|
| 0.212 |
| EGFR expression
(positive vs. negative) | 2.264 | (1.417–4.470) | 0.019a |
|
| 0.564 | 2.202 | (1.037–4.677) | 0.040 |
|
| 0.192 |
| Combined markers
(Cluster A vs. Cluster B) | 3.075 | (1.638–5.774) | 0.000a | 3.287 | (1.658–6.516) | 0.001 | 2.611 | (1.289–5.287) | 0.008 | 5.023 | (2.224–11.345) | 0.000 |
| Table VI.Univariate and multivariate analyses
of overall survival in patients with HER-2(+) expression
(n=69). |
Table VI.
Univariate and multivariate analyses
of overall survival in patients with HER-2(+) expression
(n=69).
|
| Univariate | Multivariate |
|---|
|
|
|
|
|---|
| Variable | HR | 95% CI |
P-valuea | HR | 95% CI |
P-valuea |
|---|
| Age, years (<50
vs. ≥50) | 0.962 | (0.380–2.438) | 0.962 |
|
|
|
| Differentiation
(poor/moderate vs. well) | 1.442 | (0.328–6.350) | 0.628 |
|
|
|
| AJCC stage (III/IV
vs. I/II) | 3.892 | (1.637–9.249) | 0.002a | 4.852 | (1.919–12.271) | 0.001a |
| Adjuvant
chemotherapy (yes vs. no) | 1.537 | (0.444–5.316) | 0.497 |
|
|
|
| Histological type
(IDC vs. other types) | 0.041 | (0–24.654) | 0.328 |
|
|
|
| Breast cancer
subtype |
|
| 0.141 |
|
|
|
| Basal-like/HER-2+
vs. luminal A vs. luminal B | 0.823 | (0.270–2.502) | 0.731 |
|
|
|
| ER expression
(positive vs. negative) | 0.626 | (0.144–2.729) | 0.533 |
|
|
|
| PR expression
(positive vs negative) | 0.950 | (0.310–2.905) | 0.928 |
|
|
|
| Ki-67 expression
(positive vs. negative) | 1.028 | (0.428–2.469) | 0.951 |
|
|
|
| p53 expression
(positive vs. negative) | 1.192 | (0.458–3.099) | 0.719 |
|
| 0.081 |
| Cytoplasmic Cav-1
expression (positive vs. negative) | 1.023 | (0.377–2.775) | 0.964 |
|
|
|
| Stromal Cav-1
expression (positive vs. negative) | 0.237 | (0.068–0.830) | 0.024a |
|
| 0.619 |
| EGFR expression
(positive vs. negative) | 1.712 | (0.610–4.804) | 0.307 |
|
|
|
| Combined markers
(Cluster A vs. Cluster B) | 4.627 | (1.726–12.404) | 0.002a | 7.384 | (2.522–21.714) | 0.000a |
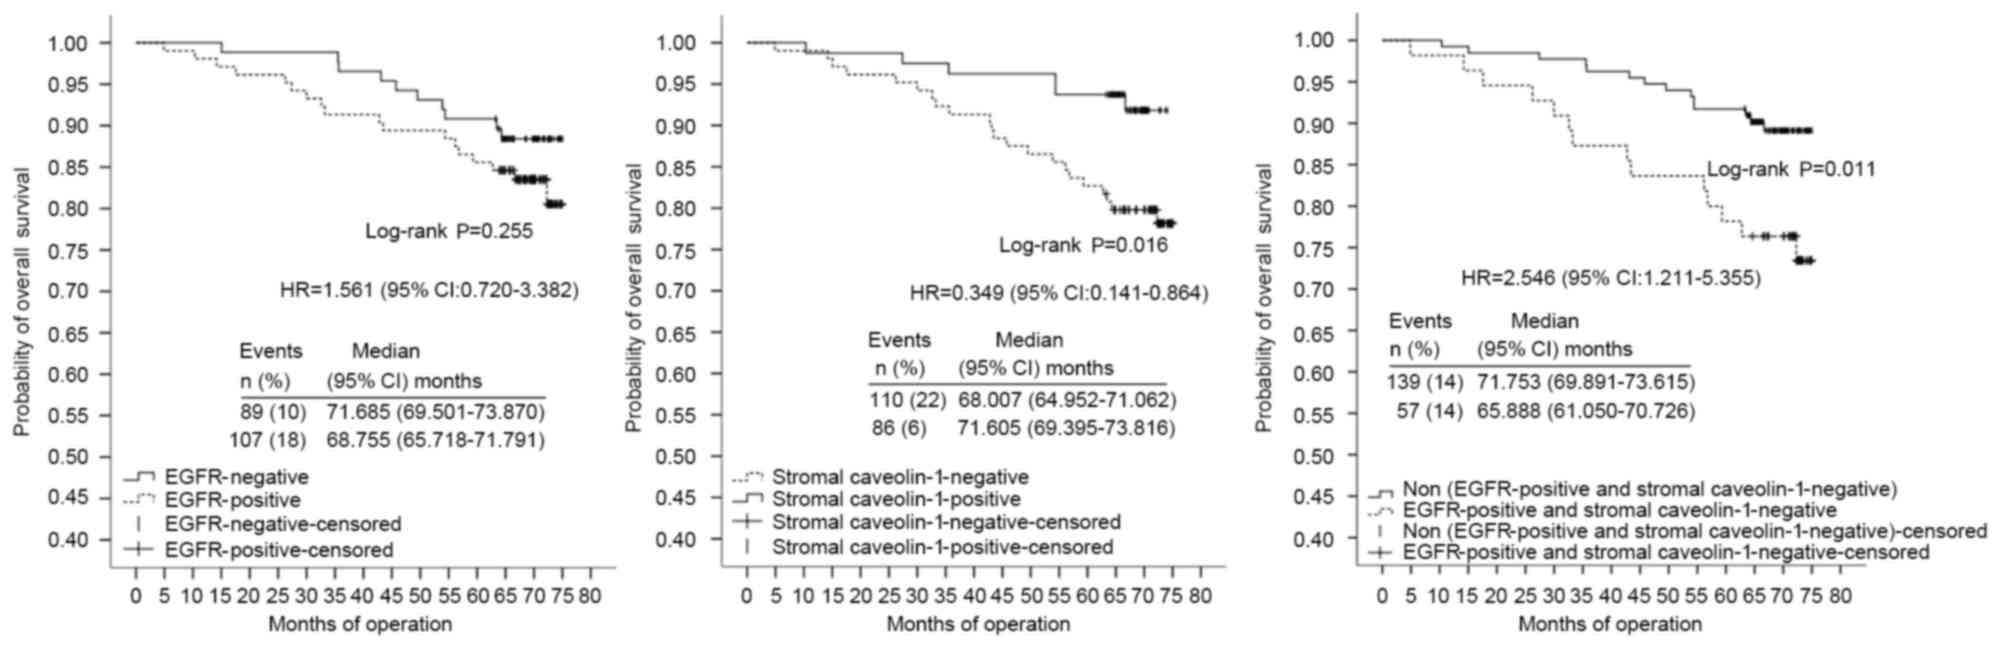
OS of the ER(+) group (n=196) was significantly
decreased in patients of younger age (<50 vs. ≥50 years; HR,
2.712; 95% CI, 1.225–6.004) and in tumor tissues of poor/moderate
differentiation (HR, 13.309; 95% CI, 4.125–42.937), high TNM
clinical stage (HR, 4.241; 95% CI, 2.225–8.087) and stromal
Cav-1(−) expression (HR, 0.205; 95% CI, 0.077–0.547) (Table VII; Fig.
6). TNM clinical stage and combined markers were significant
independent prognostic factors of OS of the ER(−) group (n=110)
with HRs of 3.631 (95% CI, 1.768–7.456) and 5.020 (95% CI,
2.250–11.200), respectively (Table
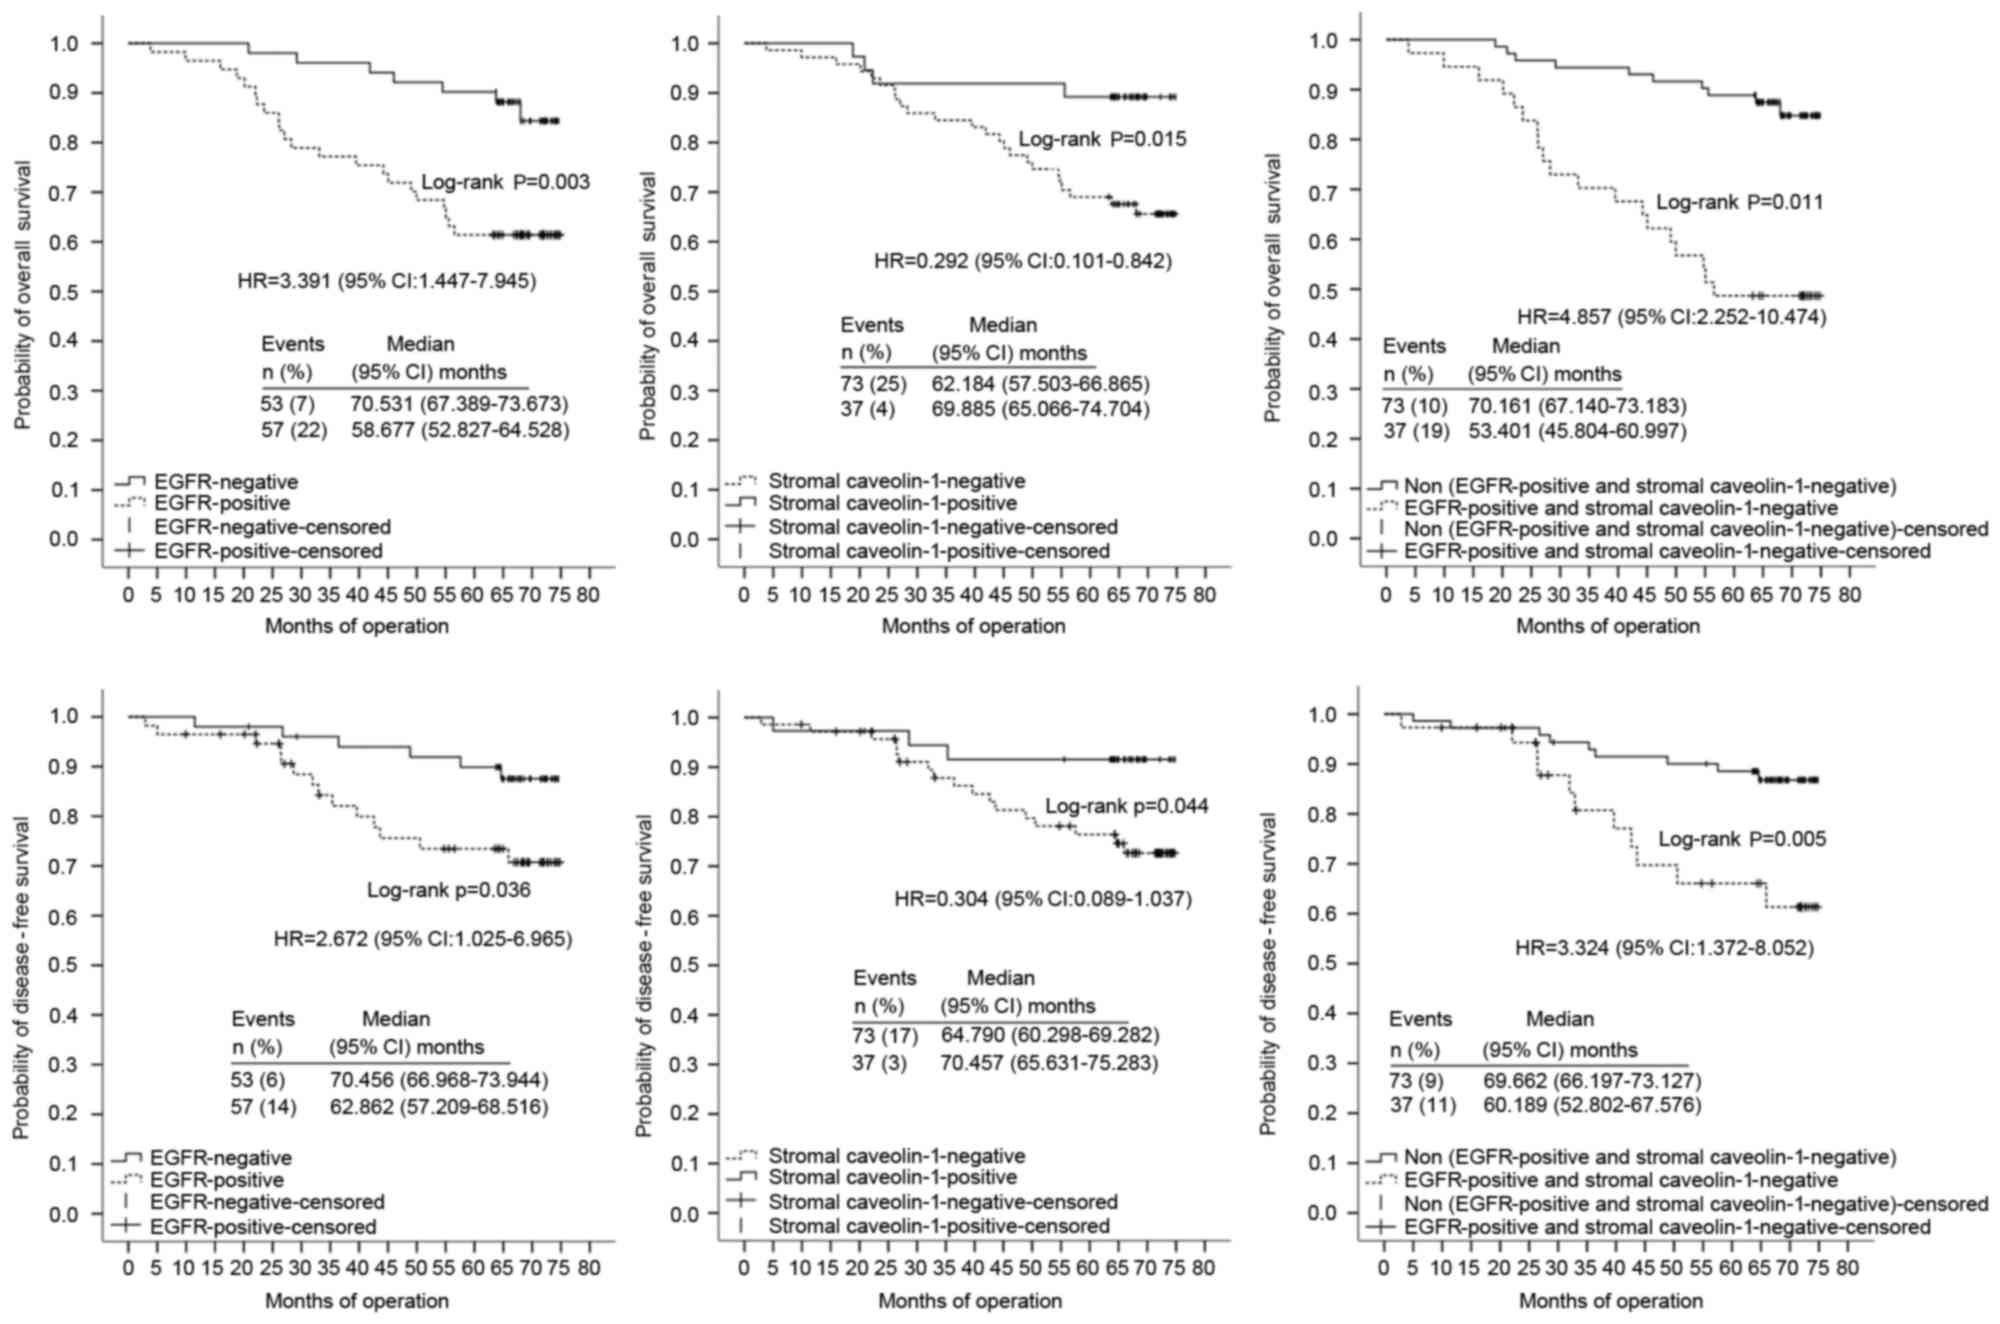
VIII; Fig. 7). No significant
correlation between EGFR, stromal Cav-1 and combined markers with
DFS of ER(+) (n=188) or HER-2(+) (n=62) groups were identified in
the multivariate analysis. However, the rates for DFS of the ER(−)
group were significantly lower in tumor tissues of more advanced
TNM clinical stage (HR, 6.971; 95% CI, 2.855–17.023) and those
under combined markers in Cluster A (HR, 3.475; 95% CI,
1.398–8.635) (Table VIII; Fig. 7).
| Table VII.Univariate and multivariate analyses
of overall survival in patients with estrogen receptor(+)
expression (n=196). |
Table VII.
Univariate and multivariate analyses
of overall survival in patients with estrogen receptor(+)
expression (n=196).
|
| Univariate | Multivariate |
|---|
|
|
|
|
|---|
| Variable | HR | 95% CI |
P-valuea | HR | 95% CI |
P-valuea |
|---|
| Age, years (<50
vs. ≥50) | 1.929 | (0.912–4.077) | 0.085 | 2.721 | (1.225–6.004) | 0.014a |
| Differentiation
(poor/moderate vs. well) | 7.728 | (2.657–22.473) | 0.000a | 13.309 | (4.125–42.937) | 0.000a |
| AJCC stage (III/IV
vs. I/II) | 9.656 | (1.312–71.069) | 0.026a | 4.241 | (2.225–8.087) | 0.000 |
| Adjuvant
chemotherapy (yes vs. no) | 0.643 | (0.273–1.513) | 0.312 |
|
|
|
| Histological type
(IDC vs. other types) | 0.298 | (0.040–2.192) | 0.234 |
|
|
|
| Breast cancer
subtype |
|
|
|
|
|
|
|
Basal-like/HER-2/luminal B vs. Luminal
A | 0.630 | (0.295–1.343) | 0.231 |
|
|
|
|
Basal-like/HER-2(0) | – | – | – | – | – | – |
| PR expression
(positive vs. negative) | 0.770 | (0.232–2.552) | 0.669 |
|
|
|
| Ki-67 expression
(positive vs. negative) | 0.794 | (0.238–2.648) | 0.708 |
|
|
|
| HER-2 expression
(positive vs. negative) | 1.402 | (0.533–3.689) | 0.494 |
|
|
|
| p53 expression
(positive vs. negative) | 3.000 | (1.426–6.311) | 0.004a |
|
| 0.176 |
| Cytoplasmic Cav-1
expression (positive vs. negative) | 0.910 | (0.429–1.934) | 0.807 |
|
|
|
| Stromal Cav-1
expression (positive vs. negative) | 0.349 | (0.141–0.864) | 0.023a | 0.205 | (0.077–0.547) | 0.002a |
| EGFR expression
(positive vs. negative) | 1.561 | (0.720–3.382) | 0.259 |
|
|
|
| Combined markers
(Cluster A vs. Cluster B) | 2.546 | (1.211–5.355) | 0.014a |
|
| 0.543 |
| Table VIII.Univariate and multivariate analyses
of OS and DFS in patients with estrogen receptor(−) expression
(n=110). |
Table VIII.
Univariate and multivariate analyses
of OS and DFS in patients with estrogen receptor(−) expression
(n=110).
|
| OS | DFS |
|---|
|
|
|
|
|---|
|
| Univariate | Multivariate | Univariate | Multivariate |
|---|
|
|
|
|
|
|
|---|
| Variable | HR (95% CI) | P-value | HR (95% CI) |
P-valuea | HR (95% CI) | P-value | HR (95% CI) | P-value |
|---|
| Age, years (<50
vs. ≥50) | 1.086
(0.522–2.258) | 0.825 |
|
| 1.073
(0.445–2.590) | 0.875 |
|
|
| Differentiation
(poor/moderate vs. well) | 1.396
(0.420–4.638) | 0.586 |
|
| 1.281
(0.297–5.526) | 0.740 |
|
|
| AJCC stage (III/IIV
vs. I/II) | 3.939
(2.027–7.654) | 0.000 | 3.631
(1.768–7.456) | 0.000a | 49.255
(11.309–214.522) | 0.000 | 6.971
(2.855–17.023) | 0.000a |
| Adjuvant
chemotherapy (yes vs. no) | 0.991
(0.378–2.597) | 0.985 |
|
| 1.189
(0.348–4.057) | 0.782 |
|
|
| Histological type
(IDC vs. other types) | 0.390
(0.053–2.869) | 0.355 |
|
| 0.379
(0.046–3.144) | 0.369 |
|
|
| Breast cancer
subtype |
| 0.3 |
|
|
| 0.300 |
|
|
| Luminal B vs.
luminal A | 1.133
(0.422–3.042) | 0.805 |
|
| 2.390
(0.782–7.310) | 0.127 |
|
|
| Basal-like/HER-2 +
vs. luminal A | 1.884
(0.804–4.415) | 0.145 |
|
| 1.883
(0.597–5.944) | 0.280 |
|
|
| PR expression
(positive vs. negative) | 1.472
(0.670–3.234) | 0.336 |
|
| 2.040
(0.741–5.619) | 0.168 |
|
|
| Ki-67 expression
(positive vs. negative) | 0.330
(0.078–1.392) | 0.131 |
|
| 0.802
(0.233–2.759) | 0.727 |
|
|
| HER-2 expression
(positive vs. negative) | 1.791
(0.861–3.725) | 0.119 |
|
| 1.150
(0.459–2.886) | 0.765 |
|
|
| p53 expression
(positive vs. negative) | 1.200
(0.562–2.563) | 0.638 |
|
| 1.323
(0.538–3.256) | 0.542 |
|
|
| Cytoplasmic Cav-1
expression (positive vs. negative) | 1.298
(0.609–2.765) | 0.5 |
|
| 1.388
(0.564–3.417) | 0.476 |
|
|
| Stromal Cav-1
expression (positive vs. negative) | 0.292
(0.101–0.842) | 0.023 |
| 0.645 | 0.304
(0.089–1.037) | 0.057 |
| 0.233 |
| EGFR expression
(positive vs. negative) | 3.391
(1.447–7.945) | 0.005 |
| 0.685 | 2.672
(1.025–6.965) | 0.044 |
| 0.547 |
| Combined markers
(Cluster A vs. Cluster B) | 4.485
(2.252–10.474) | 0.000 | 5.020
(2.250–11.200) | 0.000 | 3.324
(1.372–8.052) | 0.008 | 3.475
(1.398–8.635) | 0.007 |
Discussion
Cav-1 is a primary scaffolding protein of the cell
membrane whose abnormal stromal expression is associated with the
occurrence, progression and prognosis of breast cancer (5,13), and
Cav-1 negatively regulates EGFRs (17,31),
further confirmed by data from the present study. In addition, it
was revealed that Cav-1 is more effective as a breast cancer
prognostic marker when its expression is combined with that of
EGFR.
Multiple factors analysis of a series of variables
revealed that, for patients in the ER(+) group, the expression of
stromal Cav-1 alone is a significant prognostic marker of breast
cancer. However, in the chemotherapy, HER-2(−), HER-2(+) and ER(−)
groups, use of combined markers was more effective. Specifically,
stromal Cav-1 expression combined with that of EGFR tends to have
greater prognostic capacity than that of Cav-1 alone. Indeed, the
data identified a consistent correlation among stromal Cav-1 and
EGFR expression with clinical pathological features. This finding
may be useful during the first step of prognostic screening as
Cav-1 is readily detected in numerous breast cancer tumors.
Cav-1 is able to bind the signal transduction factor
EGFR to regulate its tyrosine kinase activity and one of the
notable findings is the ability of Cav-1 to regulate certain
tyrosine kinase receptors (29).
Inactivated EGFRs are clustered within caveolae and leave this
lipid raft structure upon activation and raft internalization is
regulated by Cav-1 scaffolds that indirectly regulate EGFR
(28). In addition, oligomeric Cav-1
domains bind to inactive EGFR and prevent its activation (17). It was revealed that Cav-1 in the
parenchyma is negatively associated with stromal Cav-1 expression
and positively correlated with EGFR expression. It has been
demonstrated that Cav-1 is a tumor suppressor in breast cancer
(32). The combined results of these
previous studies and our those of the present study suggest that
Cav-1 has marked biological and clinical significance for EGFR(+)
breast cancer, and the combination of stromal Cav-1 and EGFR
expression in breast cancer is an improved prognostic indicator
compared with either individually in tumors with a number of
different receptor and pathological features.
Acknowledgements
The present study was supported by the Natural
Science Foundation (grant no. 81372785) and the Natural Science
Foundation of Heilongjiang (grant no. ZD201316). The authors thank
the Department of Pathology of Harbin Medical University, The Third
Affiliated Hospital of Harbin Medical University and the Department
of Medical Genetics of Harbin Medical University.
References
|
1
|
Liedtke C, Kersting C, Bürger H, Kiesel L
and Wülfing P: Caveolin-1 expression in benign and malignant
lesions of the breast. World J Surg Oncol. 5:1102007. View Article : Google Scholar : PubMed/NCBI
|
|
2
|
Parkin DM, Bray F, Ferlay J and Pisani P:
Global cancer statistics, 2002. CA Cancer J Clin. 55:74–108. 2005.
View Article : Google Scholar : PubMed/NCBI
|
|
3
|
Engelman JA, Zhang XL, Galbiati F and
Lisanti MP: Chromosomal localization, genomic organization, and
developmental expression of the murine caveolin gene family (Cav-1,
−2 and −3). Cav-1 and Cav-2 genes map to a known tumor suppressor
locus (6-A2/7q31). FEBS Lett. 429:330–336. 1998. View Article : Google Scholar : PubMed/NCBI
|
|
4
|
Engelman JA, Zhang XL and Lisanti MP:
Genes encoding human caveolin-1 and −2 are co-localized to the
D7S522 locus (7q31.1), a known fragile site (FRA7G) that is
frequently deleted in human cancers. FEBS Lett. 436:403–410. 1998.
View Article : Google Scholar : PubMed/NCBI
|
|
5
|
Okamoto T, Schlegel A, Scherer PE and
Lisanti MP: Caveolins, a family of scaffolding proteins for
organizing ‘preassembled signaling complexes’ at the plasma
membrane. J Biol Chem. 273:5419–5422. 1998. View Article : Google Scholar : PubMed/NCBI
|
|
6
|
Hnasko R and Lisanti MP: The biology of
caveolae: Lessons from caveolin knockout mice and implications for
human disease. Mol Interv. 3:445–464. 2003. View Article : Google Scholar : PubMed/NCBI
|
|
7
|
Engelman JA, Zhang X, Galbiati F, Volonte
D, Sotgia F, Pestell RG, Minetti C, Scherer PE, Okamoto T and
Lisanti MP: Molecular genetics of the caveolin gene family:
Implications for human cancers, diabetes, Alzheimer disease, and
muscular dystrophy. Am J Hum Genet. 63:1578–1587. 1998. View Article : Google Scholar : PubMed/NCBI
|
|
8
|
Zhang W, Razani B, Altschuler Y, Bouzahzah
B, Mostov KE, Pestell RG and Lisanti MP: Caveolin-1 inhibits
epidermal growth factor-stimulated lamellipod extension and cell
migration in metastatic mammary adenocarcinoma cells (MTLn3).
Transformation suppressor effects of adenovirus-mediated gene
delivery of caveolin-1. J Biol Chem. 275:20717–20725. 2000.
View Article : Google Scholar : PubMed/NCBI
|
|
9
|
Smart EJ, Graf GA, McNiven MA, Sessa WC,
Engelman JA, Scherer PE, Okamoto T and Lisanti MP: Caveolins,
liquid-ordered domains, and signal transduction. Mol Cell Biol.
19:7289–7304. 1999. View Article : Google Scholar : PubMed/NCBI
|
|
10
|
Koleske AJ, Baltimore D and Lisanti MP:
Reduction of caveolin and caveolae in oncogenically transformed
cells. Proc Natl Acad Sci USA. 92:1381–1385. 1995. View Article : Google Scholar : PubMed/NCBI
|
|
11
|
Quest AF, Gutierrez-Pajares JL and Torres
VA: Caveolin-1: An ambiguous partner in cell signalling and cancer.
J Cell Mol Med. 12:1130–1150. 2008. View Article : Google Scholar : PubMed/NCBI
|
|
12
|
Sloan EK, Ciocca DR, Pouliot N, Natoli A,
Restall C, Henderson MA, Fanelli MA, Cuello-Carrión FD, Gago FE and
Anderson RL: Stromal cell expression of caveolin-1 predicts outcome
in breast cancer. Am J Pathol. 174:2035–2043. 2009. View Article : Google Scholar : PubMed/NCBI
|
|
13
|
El-Gendi SM, Mostafa MF and El-Gendi AM:
Stromal caveolin-1 expression in breast carcinoma. Correlation with
early tumor recurrence and clinical outcome. Pathol Oncol Res.
18:459–469. 2012. View Article : Google Scholar : PubMed/NCBI
|
|
14
|
Witkiewicz AK, Dasgupta A, Sotgia F,
Mercier I, Pestell RG, Sabel M, Kleer CG, Brody JR and Lisanti MP:
An absence of stromal caveolin-1 expression predicts early tumor
recurrence and poor clinical outcome in human breast cancers. Am J
Pathol. 174:2023–2034. 2009. View Article : Google Scholar : PubMed/NCBI
|
|
15
|
Couet J, Sargiacomo M and Lisanti MP:
Interaction of a receptor tyrosine kinase, EGF-R, with caveolins.
Caveolin binding negatively regulates tyrosine and serine/threonine
kinase activities. J Biol Chem. 272:30429–30438. 1997. View Article : Google Scholar : PubMed/NCBI
|
|
16
|
Lajoie P, Partridge EA, Guay G, Goetz JG,
Pawling J, Lagana A, Joshi B, Dennis JW and Nabi IR: Plasma
membrane domain organization regulates EGFR signaling in tumor
cells. J Cell Biol. 179:341–356. 2007. View Article : Google Scholar : PubMed/NCBI
|
|
17
|
Park WY, Park JS, Cho KA, Kim DI, Ko YG,
Seo JS and Park SC: Up-regulation of caveolin attenuates epidermal
growth factor signaling in senescent cells. J Biol Chem.
275:20847–20852. 2000. View Article : Google Scholar : PubMed/NCBI
|
|
18
|
Savage K, Lambros MB, Robertson D, Jones
RL, Jones C, Mackay A, James M, Hornick JL, Pereira EM, Milanezi F,
et al: Caveolin 1 is overexpressed and amplified in a subset of
basal-like and metaplastic breast carcinomas: A morphologic,
ultrastructural, immunohistochemical, and in situ hybridization
analysis. Clin Cancer Res. 13:90–101. 2007. View Article : Google Scholar : PubMed/NCBI
|
|
19
|
Agelaki S, Spiliotaki M, Markomanolaki H,
Kallergi G, Mavroudis D, Georgoulias V and Stournaras C: Caveolin-1
regulates EGFR signaling in MCF-7 breast cancer cells and enhances
gefitinib-induced tumor cell inhibition. Cancer Biol Ther.
8:1470–1477. 2009. View Article : Google Scholar : PubMed/NCBI
|
|
20
|
Ferrero JM, Ramaioli A, Largillier R,
Formento JL, Francoual M, Ettore F, Namer M and Milano G: Epidermal
growth factor receptor expression in 780 breast cancer patients: A
reappraisal of the prognostic value based on an eight-year median
follow-up. Ann Oncol. 12:841–846. 2001. View Article : Google Scholar : PubMed/NCBI
|
|
21
|
Jorge SE, Kobayashi SS and Costa DB:
Epidermal growth factor receptor (EGFR) mutations in lung cancer:
Preclinical and clinical data. Braz J Med Biol Res. 47:929–939.
2014. View Article : Google Scholar : PubMed/NCBI
|
|
22
|
Sordella R, Bell DW, Haber DA and
Settleman J: Gefitinib-sensitizing EGFR mutations in lung cancer
activate anti-apoptotic pathways. Science. 305:1163–1167. 2004.
View Article : Google Scholar : PubMed/NCBI
|
|
23
|
Salomon DS, Brandt R, Ciardiello F and
Normanno N: Epidermal growth factor-related peptides and their
receptors in human malignancies. Crit Rev Oncol Hematol.
19:183–232. 1995. View Article : Google Scholar : PubMed/NCBI
|
|
24
|
Lynch TJ, Bell DW, Sordella R,
Gurubhagavatula S, Okimoto RA, Brannigan BW, Harris PL, Haserlat
SM, Supko JG, Haluska FG, et al: Activating mutations in the
epidermal growth factor receptor underlying responsiveness of
non-small-cell lung cancer to gefitinib. N Engl J Med.
350:2129–2139. 2004. View Article : Google Scholar : PubMed/NCBI
|
|
25
|
Lee JC, Vivanco I, Beroukhim R, Huang JH,
Feng WL, DeBiasi RM, Yoshimoto K, King JC, Nghiemphu P, Yuza Y, et
al: Epidermal growth factor receptor activation in glioblastoma
through novel missense mutations in the extracellular domain. PLoS
Med. 3:e4852006. View Article : Google Scholar : PubMed/NCBI
|
|
26
|
Lafky JM, Wilken JA, Baron AT and Maihle
NJ: Clinical implications of the ErbB/epidermal growth factor (EGF)
receptor family and its ligands in ovarian cancer. Biochim Biophys
Acta. 1785:232–265. 2008.PubMed/NCBI
|
|
27
|
Koenders PG, Beex LV, Kienhuis CB,
Kloppenborg PW and Benraad TJ: Epidermal growth factor receptor and
prognosis in human breast cancer: A prospective study. Breast
Cancer Res Treat. 25:21–27. 1993. View Article : Google Scholar : PubMed/NCBI
|
|
28
|
Mineo C, Gill GN and Anderson RG:
Regulated migration of epidermal growth factor receptor from
caveolae. J Biol Chem. 274:30636–30643. 1999. View Article : Google Scholar : PubMed/NCBI
|
|
29
|
Hoop CL, Sivanandam VN, Kodali R, Srnec MN
and van der Wel PC: Structural characterization of the caveolin
scaffolding domain in association with cholesterol-rich membranes.
Biochemistry. 51:90–99. 2012. View Article : Google Scholar : PubMed/NCBI
|
|
30
|
Edge SB and Compton CC: The American Joint
Committee on Cancer: The 7th edition of the AJCC cancer staging
manual and the future of TNM. Ann Surg Oncol. 17:1471–1474. 2010.
View Article : Google Scholar : PubMed/NCBI
|
|
31
|
Cohen AW, Razani B, Wang XB, Combs TP,
Williams TM, Scherer PE and Lisanti MP: Caveolin-1-deficient mice
show insulin resistance and defective insulin receptor protein
expression in adipose tissue. Am J Physiol Cell Physiol.
285:C222–C235. 2003. View Article : Google Scholar : PubMed/NCBI
|
|
32
|
Lee SW, Reimer CL, Oh P, Campbell DB and
Schnitzer JE: Tumor cell growth inhibition by caveolin
re-expression in human breast cancer cells. Oncogene. 16:1391–1397.
1998. View Article : Google Scholar : PubMed/NCBI
|