Introduction
In most cases, pancreatic carcinoma (PC) and
mass-forming chronic pancreatitis (MFCP) are found in the
pancreatichead, which is the largest part of the pancreas. Although
these pathologies require entirely different treatment and
management and have different prognoses, the overlap in their
clinical and imaging features renders their early preoperative and
differential diagnosis challenging (1–7).
Sometimes, surgical exploratory biopsy is unable to differentiate
these two pathologies. Radical surgical resection is the standard
treatment for PC and the only effective means of cure. Misdiagnosis
of MFCP as focal pancreatic malignancy results in unnecessary
surgical treatment and misdiagnosis of PC as focal pancreatitis
delays necessary surgical intervention (1–3,8,9).
Therefore, non-invasive imaging plays a crucial role in early
differential diagnosis, personalized treatment, and evaluation of
therapeutic effects in both pathologies (3,5,7,10–20). 18F-FDG-PET/CT is an
advanced diagnostic imaging modality that combines high-resolution
anatomical images from computerized tomography (CT) and functional
images from positron emission tomography (PET). It is
cost-effective and is used for early diagnosis, efficacy
evaluation, tumor staging and prognostic evaluation and clinical
treatment guidance in PC; it is particularly informative during the
initial and metastasis stages of PC (3,5,10). However, the specificity and
sensitivity of these imaging modalities in distinguishing MFCP from
PC is not known. Therefore, we retrospectively analyzed
multi-modality imaging data of 30 PC and 24 MFCP patients to
clinically distinguish PC from MFCP.
Materials and methods
Clinical data of MFCP and PC
patients
The present study was approved by the Ethics
Committee of the Affiliated Hospital of Guizhou Medical University
(Guizhou, China) and was performed according to the Declaration of
Helsinki guidelines. Written informed consent was obtained from all
participants for inclusion in the study and for publishing their
images in this manuscript. We enrolled 24 MFCP and 30 PC patients
between January 2012 and May 2017 that were all confirmed by
pathology [aspiration biopsy (n=15) and surgical pathology (n=9) in
MFCP cases (n=24) and surgical pathology in PC cases (n=30)]. All
PCs were localized. The inclusion criteria were: i) all
participants had been confirmed by pathology for MFCP or PC before
enrollment; ii) CT (unenhanced and dynamic enhanced CT), magnetic
resonance imaging (MRI) (DWI and contrast enhanced scan) and PET/CT
scans were performed within a month in all patients; and iii)
general clinical data was similar for both groups. The exclusion
criteria were: i) cases without pathological results; ii)
incomplete data of multi-modality imaging (unenhanced and dynamic
enhanced CT, MRI and PET/CT) or examination interval of all
multi-modality imaging was more than a month; iii) diffused or
multifocal forms of pancreatitis or diffuse nature of PC; iv)
patient information did not meet the statistical requirements.
General and clinical information of the patients is
shown in Table I. The 24 MFCP
patients included 22 males and 2 females with a mean age of
51.92±6.7 years. The 30 PC patients included 19 males and 11
females with a mean age of 59.5±8.95 years. Clinical symptoms
included varying degrees of chronic intermittent or persistent pain
in both MFCP and PC patients; jaundice in 18 MFCP and 25 PC cases;
weight loss of >5 kg in 14 MFCP and 23 PC cases within 6 months;
the first symptom was abdominal pain in 20 MFCP and 21 PC cases,
whereas jaundice was the first symptom in 12 MFCP and 19 PC
cases.
 | Table I.General information of the enrolled
MFCP and PC patients. |
Table I.
General information of the enrolled
MFCP and PC patients.
| Parameter | MFCP (n=24) | PC (n=30) | χ2 or
t-value | P-value |
|---|
| Males [n (%)] | 22 (91.67) | 19 (63.33) | 5.856 | 0.016 |
| Age, years (mean ±
SD) | 51.92±6.7 | 59.5±8.95 |
−1.632t | 0.109 |
| History of
long-term drinking [n (%)] | 16 (66.67) | 13 (43.33) | 2.920 | 0.088 |
| History of biliary
tract disease [n (%)] | 20 (83.33) | 5 (16.67) | 23.834 | <0.001 |
| History of
pancreatitis [n (%)] | 18
(75%)a | 3 (10) | 23.704 | <0.001 |
Radiological examination
methodology
CT scan (unenhanced and dynamic enhanced CT), MRI
(DWI, MRCP, and contrast enhanced scan), and PET/CT scans were
performed respectively within a month in all of patients. Besides,
ERCP examination was performed in 15 cases with MFCP and 22 cases
of PC.
CT scan was obtained with a Toshiba 128-slice CT
scan system. Patients were supine, and scanned from the top of the
diaphragm to the lower edge of the pubic symphysis. CT scan
parameters were as follows: voltage, 120 kV; current, 200 mA; scan
thickness 5 mm, interlayer spacing 5 mm, pitch 0.5, and collimator
16 slice × 0.625 mm. The original data was scanned to obtain
coronal, sagittal and other orientations required for multiple
planar reconstruction (MPR). The CT enhancement scan used a
high-pressure injector to inject 60–100 ml of the non-ionic iodine
contrast agent iohexol (iodine 300 mg/ml) into the cubital vein at
a rate of 3 ml/sec. The scan included arterial phase (delay 30
sec), venous phase (delay 60 sec) and a delay period (delay 120
sec). For CT non-enhanced scan, the scan was from the top of the
diaphragm to the lower edge of the pubic symphysis. Patients were
asked to hold their breath during scanning and breathe quietly
during the scanning interval.
MRI examination was performed with a Philips Achieva
3.0-T whole-body MRI system (Philips Healthcare, Amsterdam, The
Netherlands) and abdominal phased array surface coil (a 16-channel
phased array coil). The patients fasted 4–8 h before the scan. MRI
sequences are summarized in Table
II. Baseline MRI included a T1-weighted turbo field-echo
in-phase and opposed-phase sequence, a breath-hold multishot
T2-weighted sequence, and a respiratory-triggered single-shot
heavily T2-weighted sequence. All T2-weighted images were performed
under fat saturation conditions. Dynamic images were obtained with
a T1-weighted 3D turbo field-echo sequence (THRIVE). This included
unenhanced phase, arterial phase (20–35 sec), portal phase (60 sec)
and delayed phase (3 sec). The time for the arterial phase imaging
was determined using the MR fluoroscopic bolus detection technique.
The patients were intravenously administered the contrast agent
(0.1 mmol/kg body weight gadolinium-diethylenetriaminepentaacetic
acid, Gd-DTPA; Bayer Schering Pharma, Berlin, Germany) at a rate of
2 ml/s through a power injector (Mark V). Two methods of magnetic
resonance cholangiopancreatography (MRCP) were used to evaluate
pancreatic and bile duct anatomy. Sequence parameters of MRCP
including breath-hold single-section 2D single-shot turbo spin-echo
MRCP and navigator-triggered 3D turbo spin-echo MRCP were according
to vendor instructions (Table II).
The diffusion-weighted imaging (DWI) sequence included respiratory
triggering spin echo planar imaging sequence (SE-EPI). The apparent
diffusion coefficient (ADC) value was calculated with b-values of 0
and 800 s/mm2. Scan data was analyzed at the Philips
Achieva 3.0-T whole-body MRI system release 2.6 workstation
(Philips Healthcare).
| Table II.Magnetic resonance imaging sequences
and parameters. |
Table II.
Magnetic resonance imaging sequences
and parameters.
| MRI sequence | TR/TE (msec) | Flip angle (°) | Slice thickness
(mm) | Slice gap (mm) | Matrix size | Band width
(Hz/pixel) | FOV (cm) | Acquisition time
(sec) | No. of
excitations |
|---|
| T1W 2D dual
GRE | 5/1.14–2.3 | 15 | 6 | 1 | 252×159 | 434 | 37.5 | 14.4 | 1 |
| BH-MS-T2WI | 1,410/80 | 90 | 7 | 1 | 320×224 | 641.5 | 37.5 | 46.2 | 1 |
| RT-SS-T2WI | 1,277/70 | 90 | 7 | 1 | 236×166 | 549.3 | 37.5 | – | 2 |
| RT-SS-HT2WI | 2,580/740 | 90 | 5 | 1 | 256×153 | 591.9 | 37.5 | – | 1 |
| RT-3D-GRE T1WI | 3.0/1.39 | 10 | 2 | 1 | 252×197 | 723.4 | 37.5 | 15 | 2 |
| BH-2D-MRCP | 4,800/894 | 90 | 40 | 1 | 256×192 | 408 | 30 | 9 | 1 |
| NT-3D-MRCP | 1,673/740 | 90 | 1 | 1 | 256×153 | 591.9 | 36 | 250 | 1 |
| DWI | 1,600/70 | 90 | 7 | 1 | 124×100 |
43.9 | 36 | 174 | 4 |
PET/CT examination was performed in a Philips GEMINI
TF 64 PET/CT machine (Philips Healthcare) with
18F-deoxyglucose (FDG; purity >95%). Patients fasted
for 6 h before the scan, and the fingertip fasting blood glucose
level was <11 mmol/l (normal range: 3.9–6.1 mmol/l). We injected
18F-FDG (3.7 MBq/kg body weight) into the cubital vein
and the examination was performed after supine rest for ~1 h after
the injection in a quiet dark room. CT scan parameters were as
follows: voltage 120 kV, current 120 mA, CT reconstruction
thickness 5 mm and an interval of 5.0 mm. The PET images were
attenuated and corrected with CT data and ordered subset iterative
expectation maximization (OSEM) for PET image reconstruction was
performed with a thickness of 5 mm and interval distance of 5 mm.
Reconstruction images of CT and PET were transferred to a Philips
dedicated workstation to obtain cross-sectional PET, sagittal PET,
coronal PET, CT and PET/CT fusion images. Abnormal lesions were
outlined as the region of interest (ROI) using a semi-quantitative
method to measure the maximum standardized uptake value (SUVmax) of
radioactivity.
Analysis of multi-modality imaging
data
The images were reviewed independently by two expert
radiologists and a consensus diagnosis was arrived at. The
following key indicators were recorded at the Philips workstation:
i) pancreatic tumor size, shape, density or characteristic signals
such as multi-phase enhanced characteristics and the boundary; ii
presence or absence of cystic lesions of tumor and surrounding
area; iii) style and degree of dilation of the main pancreatic duct
and common bile duct; more attention was paid to common bile duct
lesions with or without interruption and stenosis, with or without
mural nodules, and with or without duct penetration (mass segment
with pancreatic duct stenosis without wall irregularities, or mass
without stenosis) and ‘double’ or bile duct ‘disjoint’ signs
(segments of the common bile duct and the pancreatic duct are cut
off due to pancreatic cancer invasion; the common bile duct and the
pancreatic duct expand, but do not extend into the tumor); iv)
whether peripancreatic vascular tissue was violated (the fat
disappears between the mass and adjacent vessels, and the mass
wraps around the adjacent vessel at >180°) and the presence or
absence of blocked blood vessels and presence of stenosis; and v)
adjacent tissue and organ changes, including the presence or
absence of abdominal and retroperitoneal lymph node metastasis,
liver and spleen metastasis, or renal fascia thickening. We also
collected and recorded clinical data, including symptoms,
laboratory tests and pathology reports after surgery. The image
analysis and diagnosis of each patient were compared with the
pathology results.
Statistical analysis
SPSS 19.0 statistical software (IBM Corp., Armonk,
NY, USA) was used to analyze the data. For data with normal
distribution with homogeneity of variance test, data were presented
as the means ± standard deviation (mean ±SD). We used the
independent-samples t-test and χ2 comparison test or
Fisher's exact test. In ROC analysis, the appropriate cutoff value
of lesion size, net-increased value in arterial and portal phases
as well as early and delayed SUV values corresponding to the
maximal Youden index was determined. We also determined the
sensitivity and specificity values of significant imaging findings.
The significance level was set at P<0.05 (two-tailed).
Results
Distinguishing multi-modality imaging
features in PC and MFCP
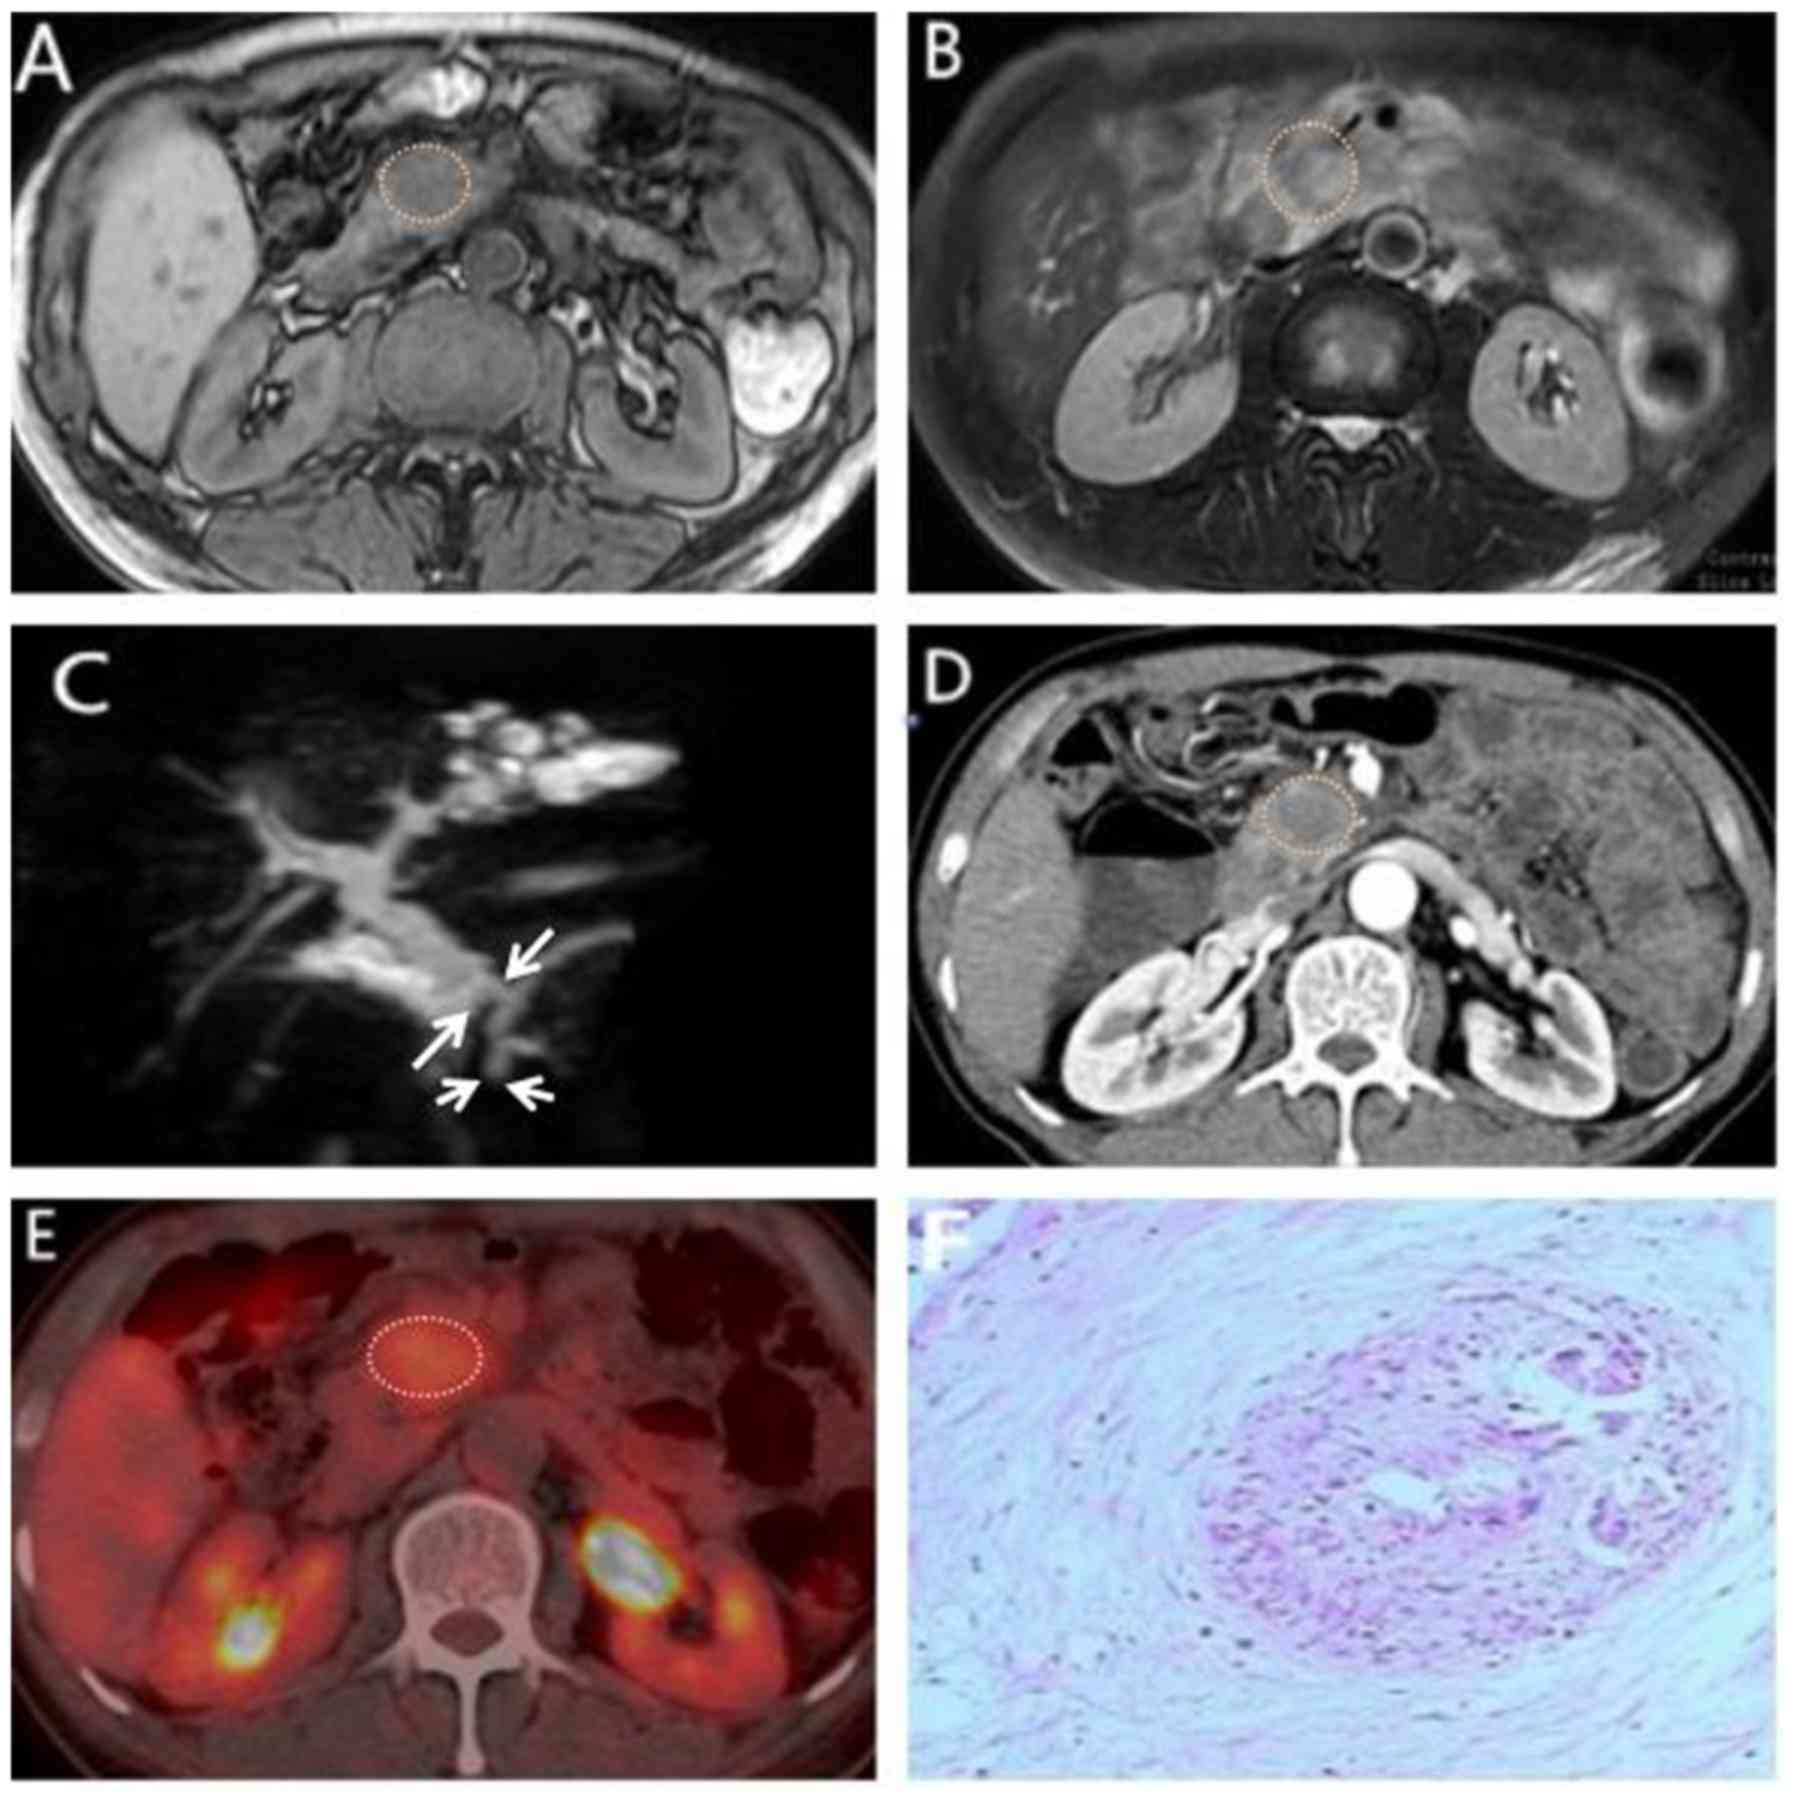
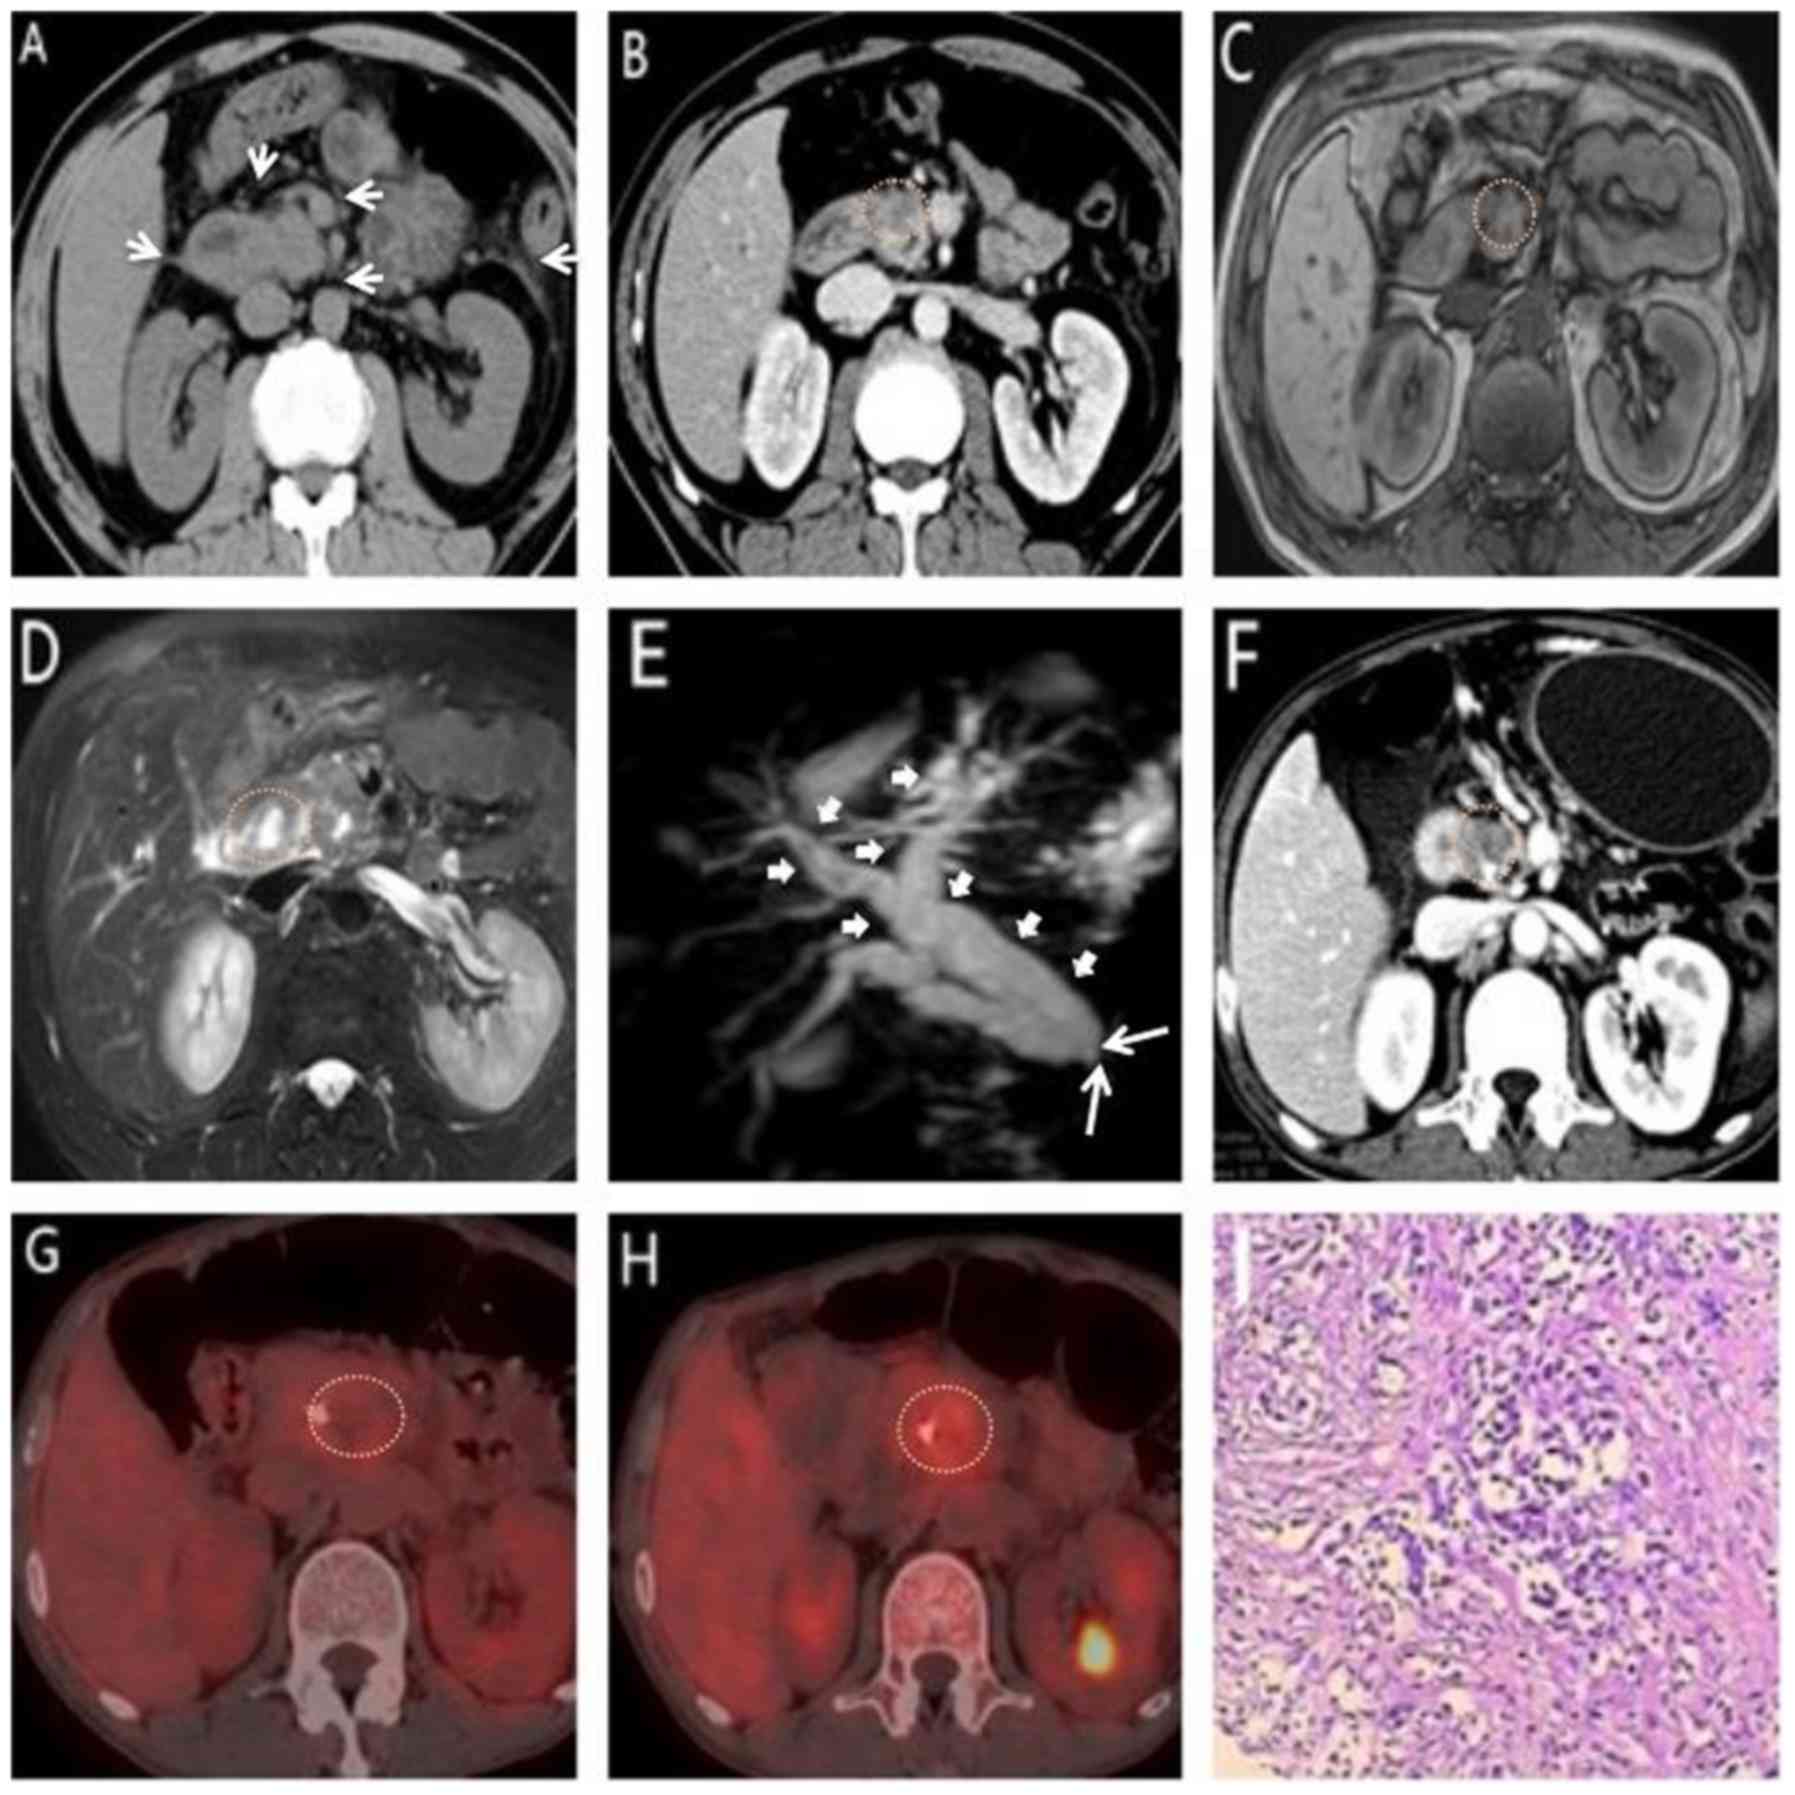
The lesion volume was higher in the MFCP group than
in pancreatic cancer (5.44±1.27 cm vs. 3.34±1.23 cm; P<0.001;
Figs. 1–4; Table
III). The right perirenal fascia thickening was observed in
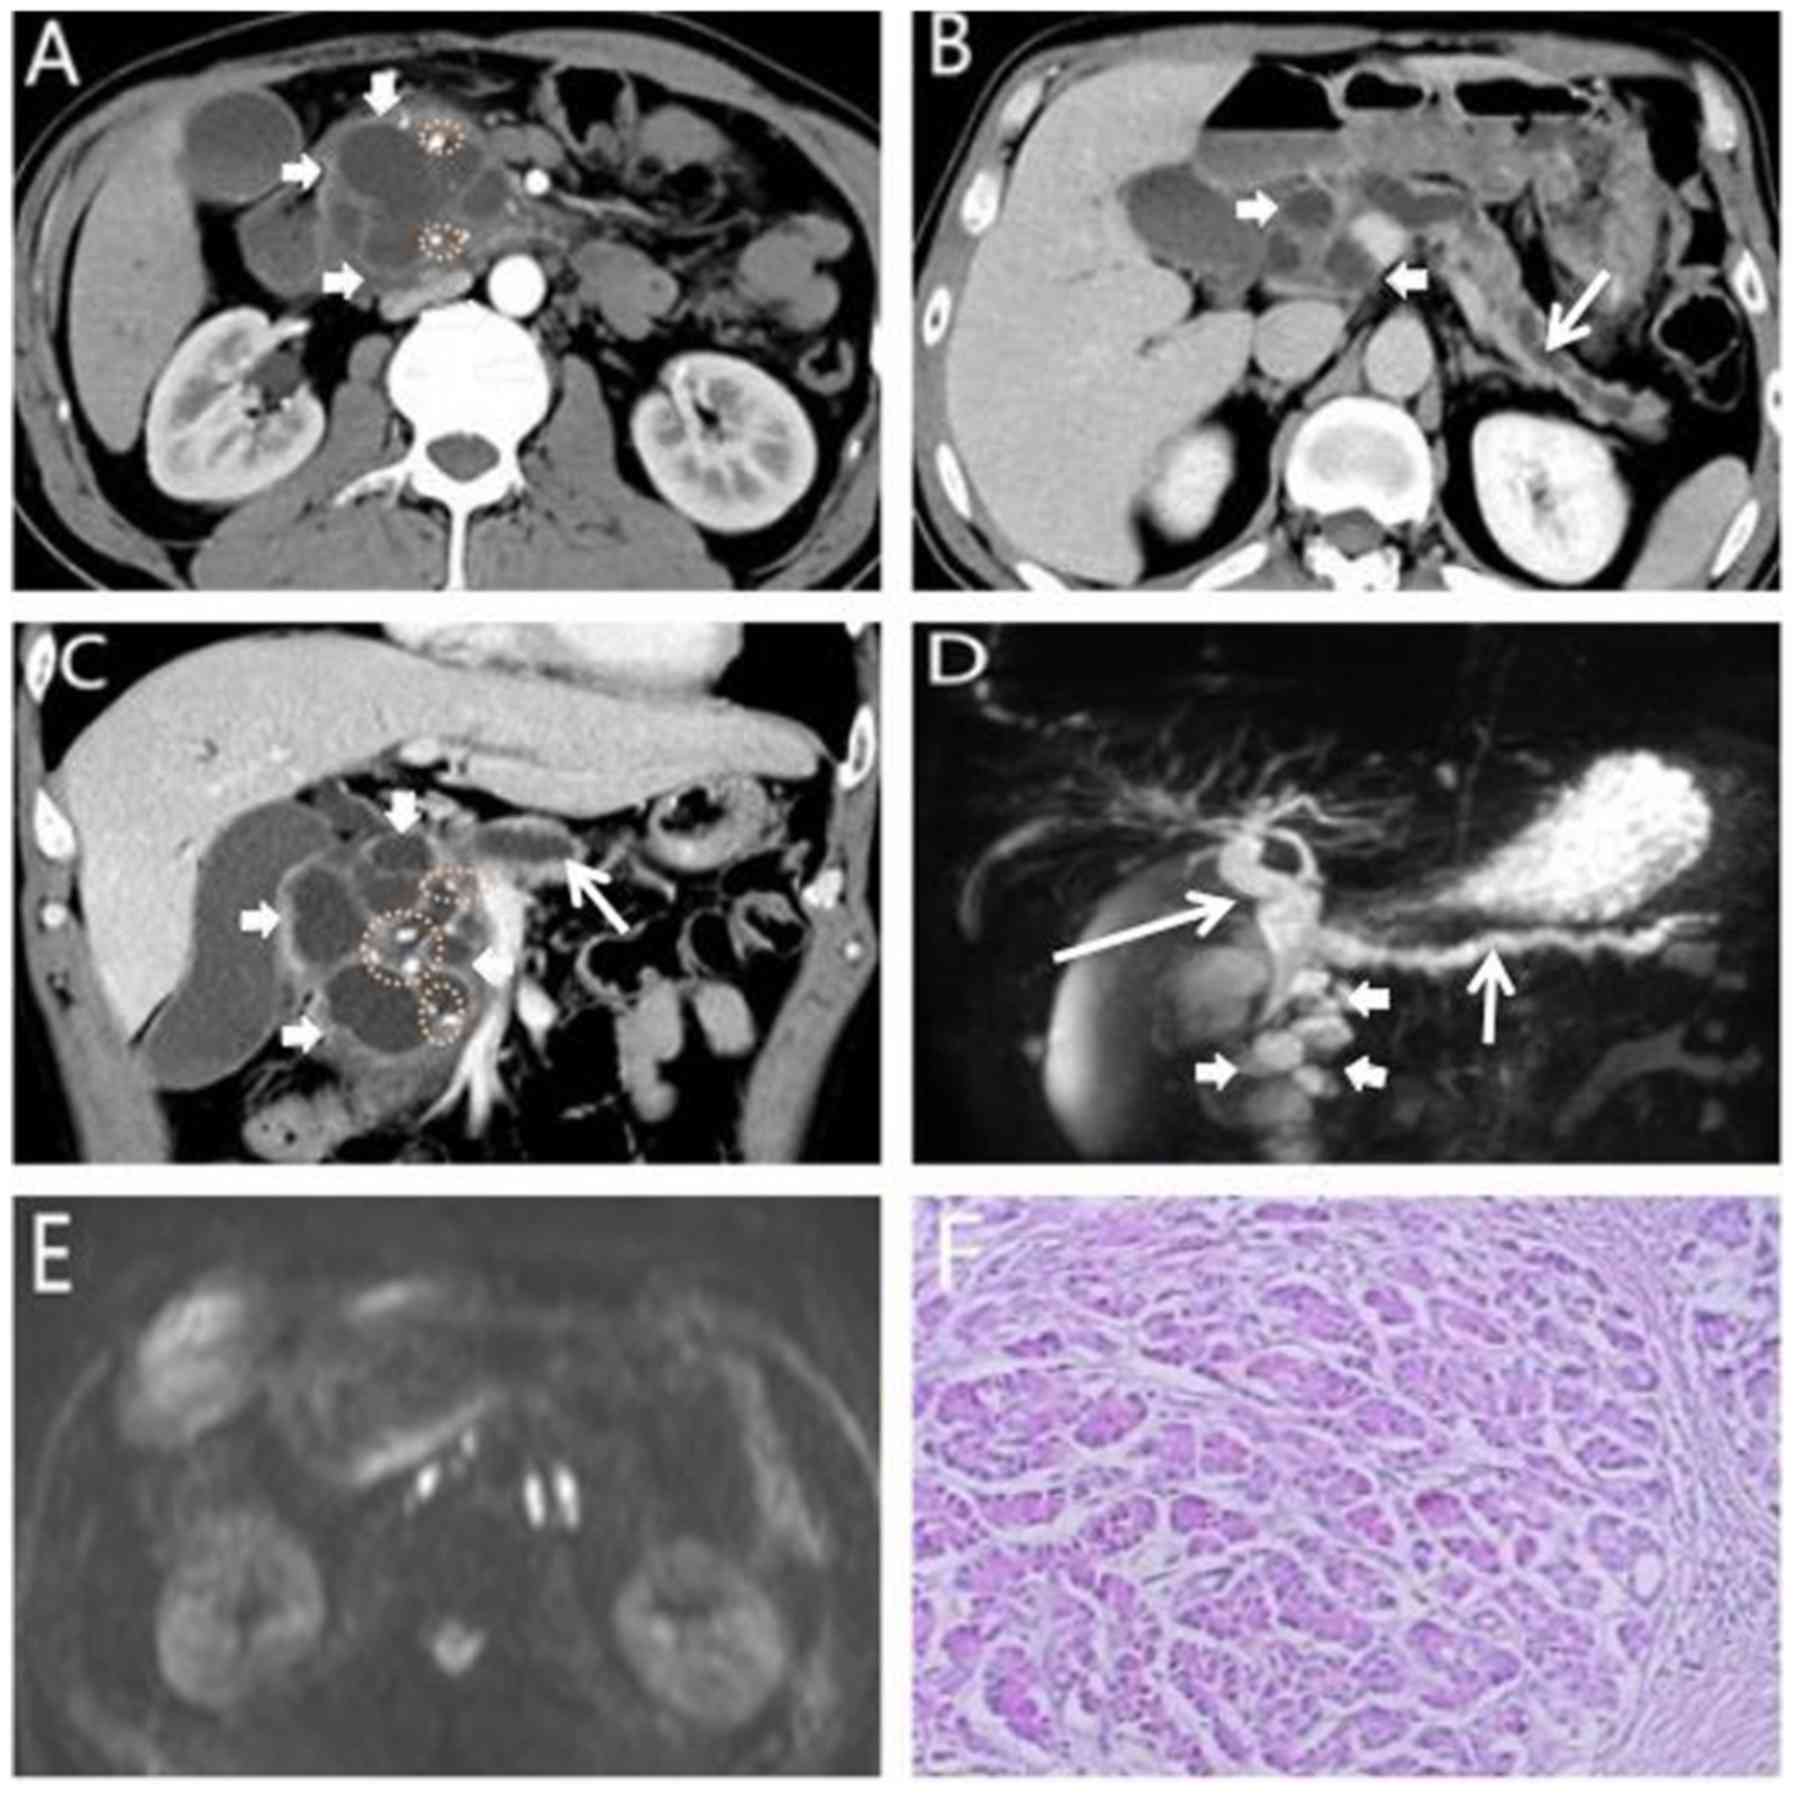
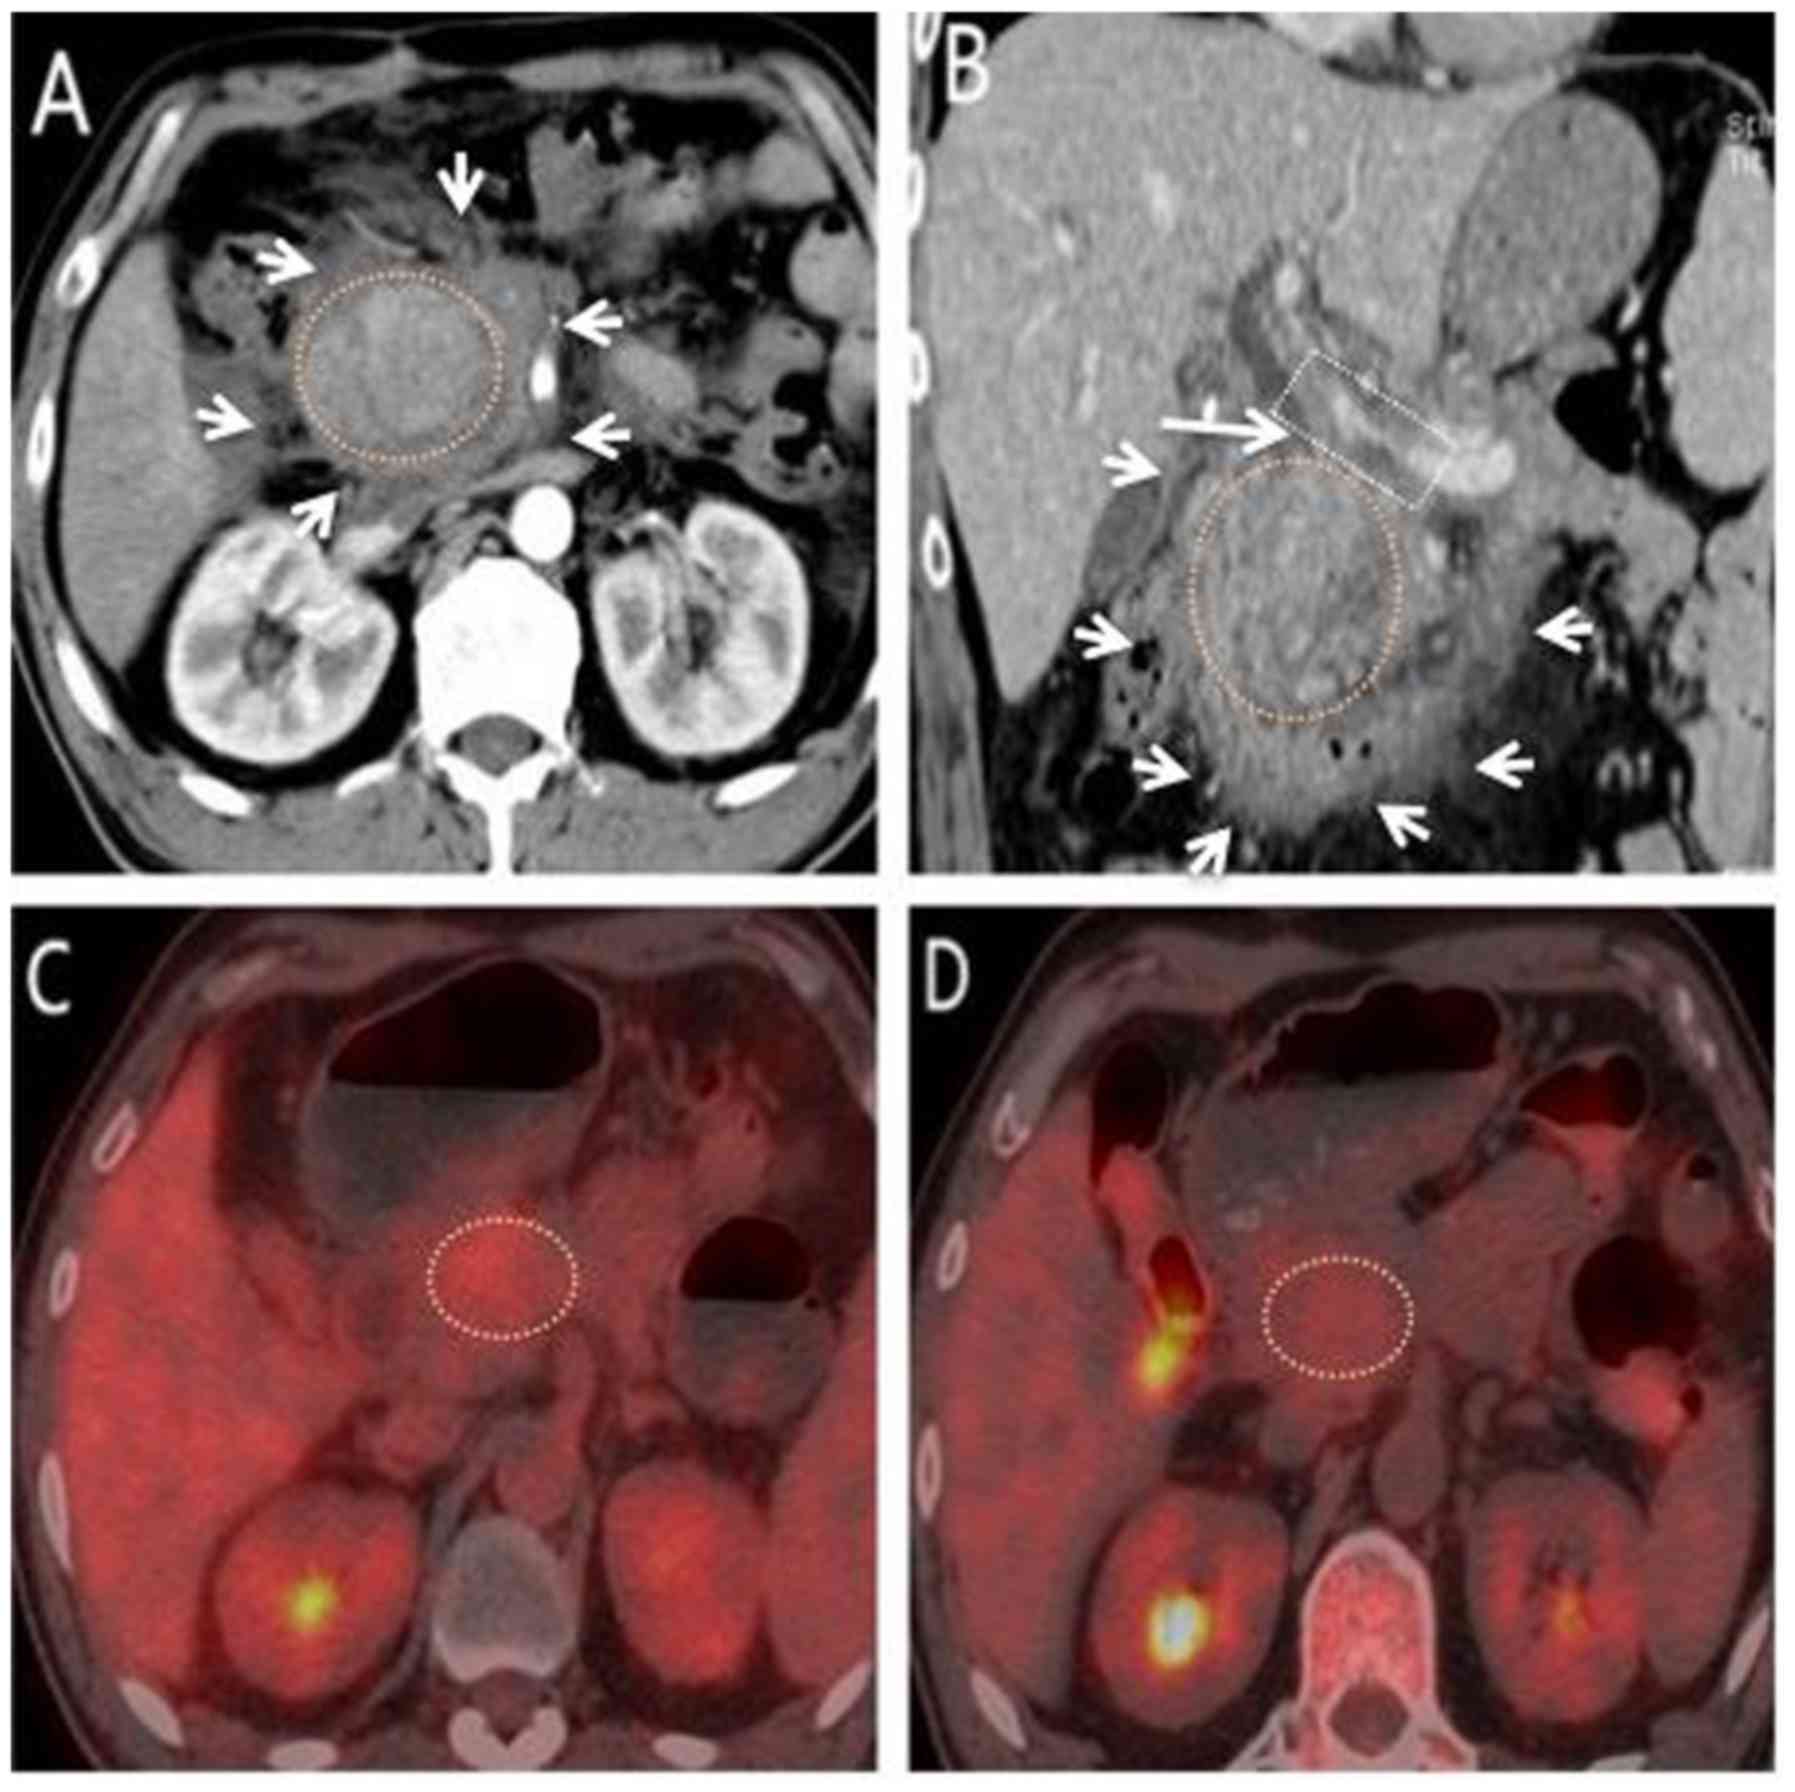
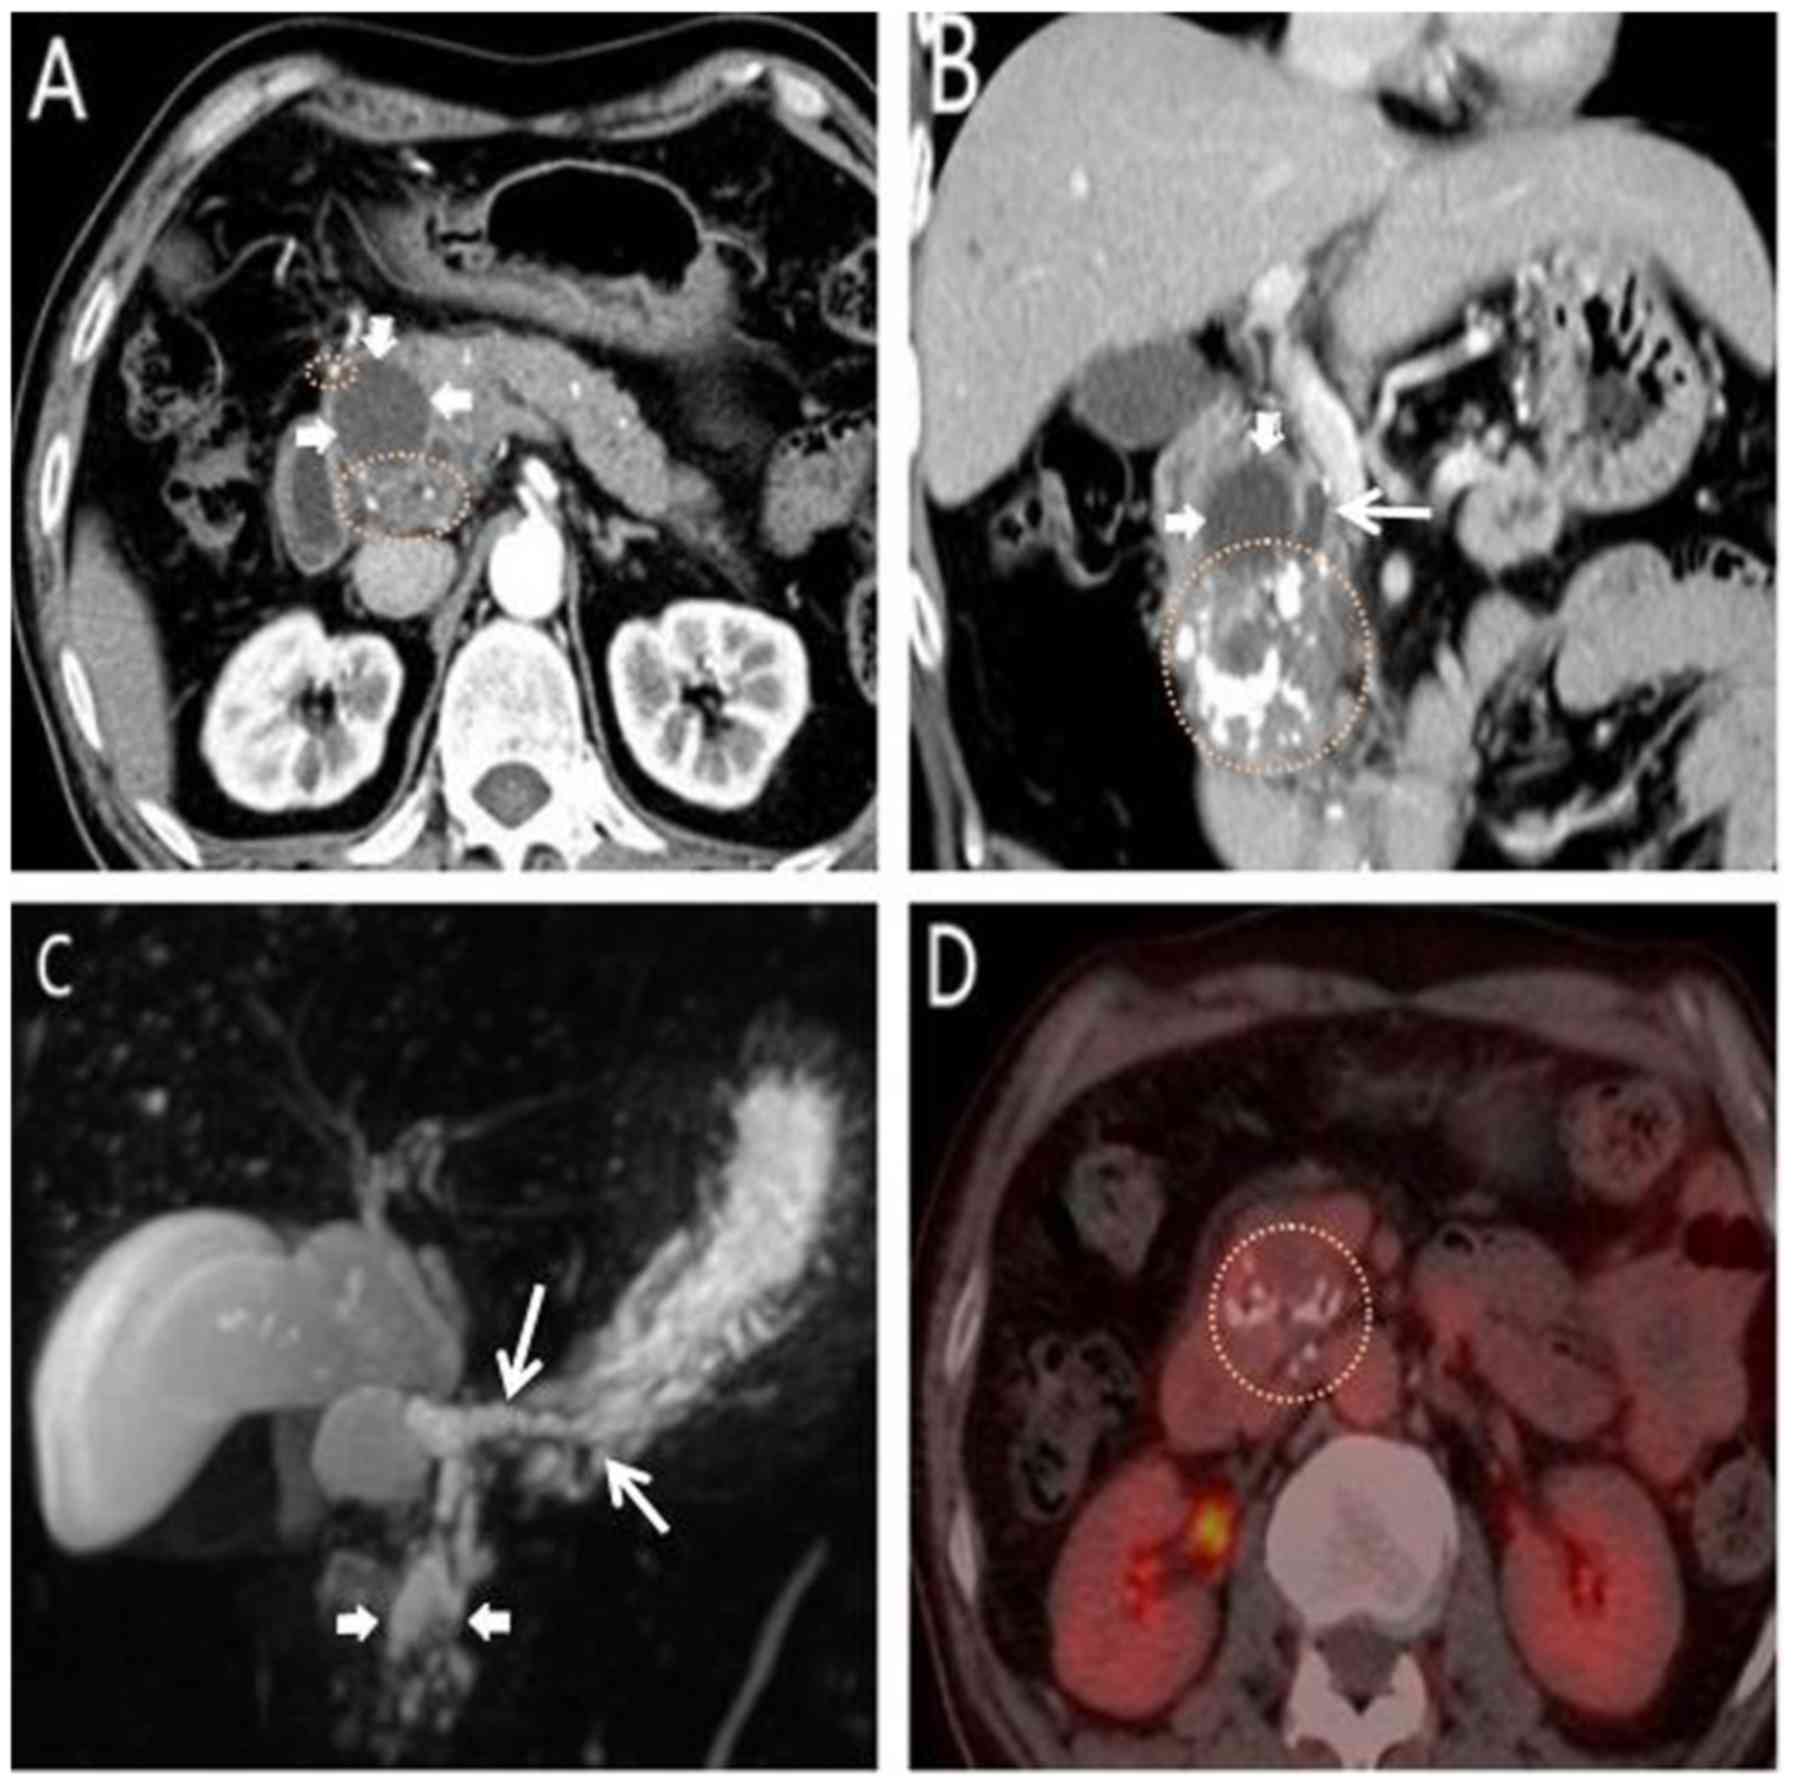
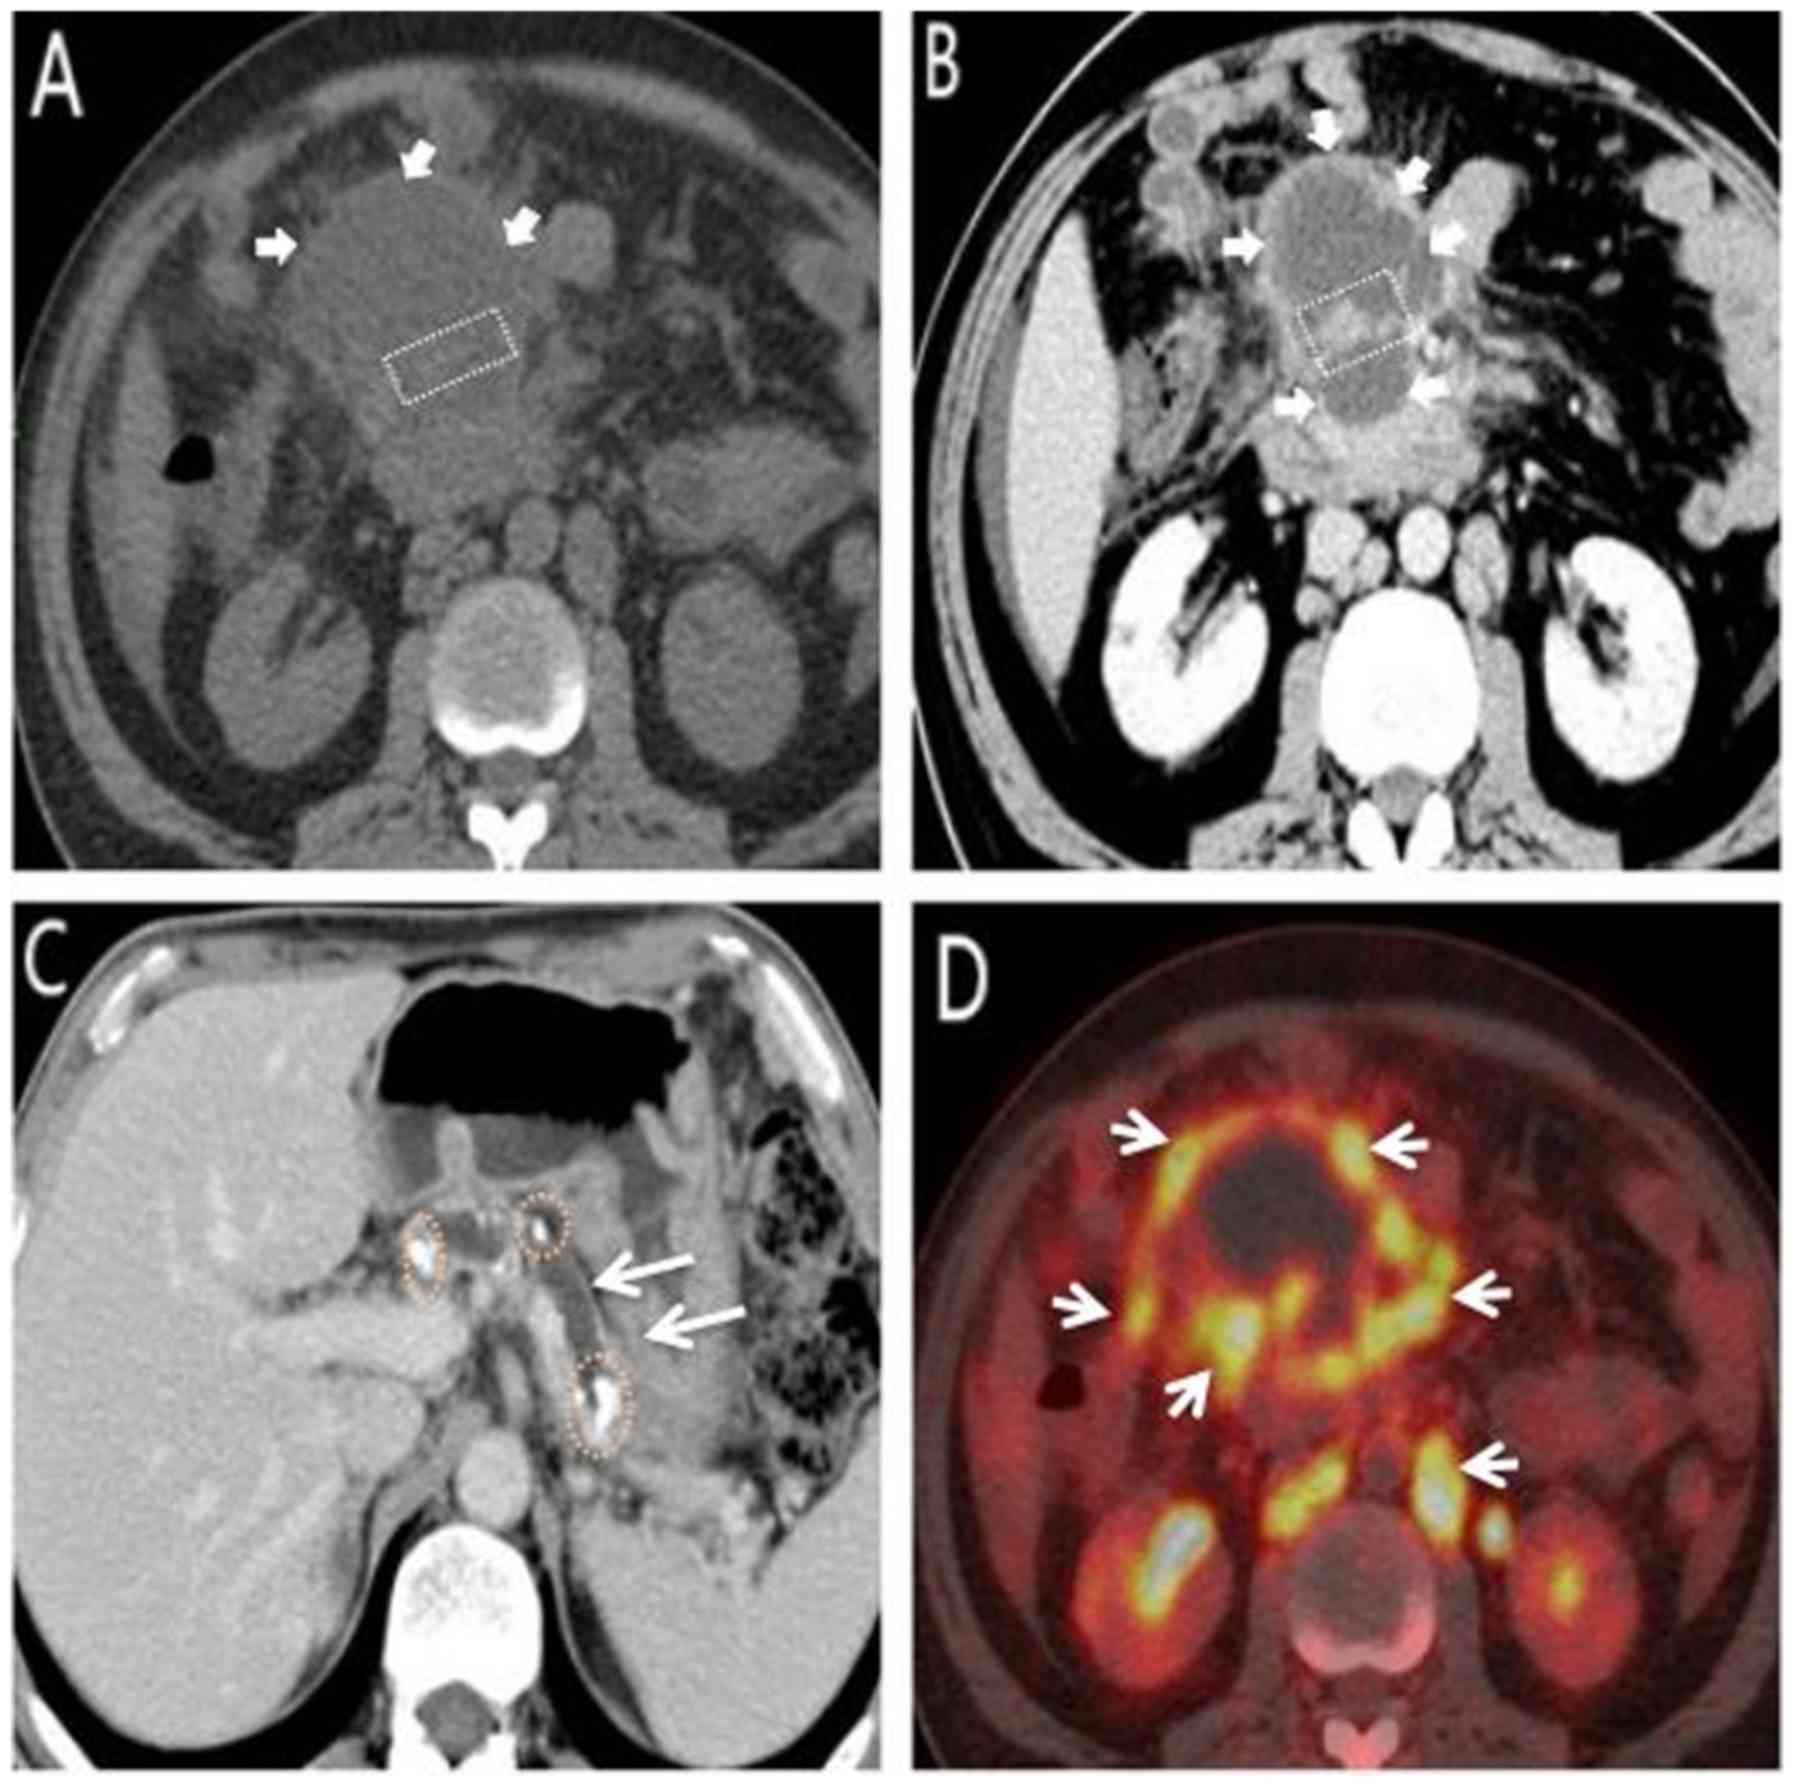
83.33% of MFCP and 13.33% PC patients (P<0.001; Figs. 1A and B, 2A
and B, 3A-C, 4A and B, 5A, B and
D and 6A-D). Lobulation was
observed in 83.33% of PC and 12.5% of MFCP patients (P<0.001;
Table III; Figs. 1A–6A).
| Table III.Comparison of multi-modality imaging
features between MFCP and PC cases of the pancreatic head. |
Table III.
Comparison of multi-modality imaging
features between MFCP and PC cases of the pancreatic head.
| Parameter | MFCP (n=24) | PC (n=30) | χ2 or
t-value | P-value |
|---|
| Lesion size (cm;
mean ± SD) | 5.44±1.27 | 3.34±1.23 |
6.140t | <0.001 |
| Lobulation [n
(%)] | 3 (12.5) | 25 (83.33) | 26.796 | <0.001 |
| Calcification [n
(%)] | 14 (58.33) | 3 (10) | 14.440 | <0.001 |
|
Patchy | 4 (28.57) | 0 (0) | – | – |
|
Dot | 2 (14.29) | 2 (66.67) | – | – |
|
Hybrid | 8 (57.14) | 1 (33.33) |
8.640 | 0.007 |
| Cystic necrosis [n
(%)] | 7 (29.17) | 18 (60) |
5.098 | 0.024 |
| Net-increased value
of CT enhancement (Hu, mean ± SD) Arterial phase | 24.42±9.81 | 13.92±5.50 |
4.974 | <0.001 |
|
Pancreatic parenchymal phase
(portal phase) | 45.41±14.56 | 35.83±10.19 |
2.840 | 0.008 |
| High signal on DWI
[n (%)] | 2 (28.57) | 17 (89.47) | 13.658 | <0.001 |
| ADC value (mean ±
SD)a | 1.36±0.13 | 1.01±0.11 | 10.703 | <0.001 |
| Early SUV value
(mean ± SD) | 2.51±0.42 | 7.13±3.04 |
−7.375 | <0.001 |
| Delayed SUV value
(mean ± SD) | 2.10±0.31 | 9.20±3.56 |
−9.723 | <0.001 |
| Atrophy of the
pancreatic body and tail [n (%)] | 10 (41.67) | 11 (36.67) |
−0.140 | 0.708 |
| Pseudocyst [n
(%)] | 14 (58.33) | 3 (10) | 14.440 | <0.001 |
| Pancreatic duct
expansion [n (%)] | 16 (66.67) | 20 (66.67) |
0.000 | 0.995 |
|
Uniformity of expansion | 2 (12.5) | 18 (90) | 15.263 | <0.001 |
| Beaded
expansion | 14 (87.5) | 2 (10) | 17.070 | <0.001 |
|
Pancreatolithiasis | 13 (54.17) | 5 (16.67) |
8.438 | 0.004 |
| Bile duct
penetration sign [n (%)] | 19 (79.17) | 5 (16.67) | 21.094 | <0.001 |
| Cholangiectasis [n
(%)] | 17 (70.83) | 16 (53.33) |
1.720 | 0.190 |
| Double duct sign [n
(%)] | 7 (29.17) | 14 (46.67) |
1.713 | 0.200 |
| Disjoint sign of
the bile duct and pancreatic duct [n (%)] | 2 (8.33) | 21 (70) | 20.737 | <0.001 |
| Right anterior
renal fascia thickening [n (%)] | 20 (83.33) | 4 (13.33) | 26.460 | <0.001 |
| Peripancreatic
vascular invasion [n (%)]b | 17 (70.83) | 19 (63.33) |
0.337 | 0.561 |
| Retroperitoneal
lymph nodes enlargement [n (%)]c | 11 (45.83) | 21 (70) |
3.225 | 0.073 |
Cystic necrosis was observed in 60% PC and 29.17%
MFCP patients (P<0.05; Table
III). Calcification was observed in 58.33% MFCP and 10% PC
patients (P<0.001; Table III).
Predominantly, calcification in MFCP patients was mixed type (8/14;
57.14%), characterized by diffuse pattern and marginal distribution
of the lesions (Figs. 1A and 2B). Furthermore, visible remnants of normal
pancreatic tissue were observed in the MFCP lesions (Figs. 1A, 2B
and 3B).
Pseudocyst formation was observed in 58.33% MFCP and
10% PC patients (P<0.001; Table
III). Honeycomb-like cystic lesions were found only in the MFCP
group (Figs. 1C and D, 2B and 3B).
Atrophy of the pancreatic body and tail was observed in 41.67% MFCP
and 36.67% PC patients (P=0.708; Figs.
1B, 2A and 3C). Dilated bile ducts passed through the
lesion areas in 79.17% MFCP and 16.67% PC cases (P<0.001;
Table III; Figs. 1D, 2C
and 4B). Dilated pancreatic ducts
interrupted the lesion areas in 8.33% MFCP and 70% PC cases
(P<0.001; Table III; Fig. 5C). However, the double duct sign,
which indicates the expansion of both the pancreatic duct and the
bile duct, was similar in both groups (P=0.20; Table III). The net increase in arterial
and portal venous phase enhancements was higher in the MFCP group
than in the PC group (P<0.001 and P=0.008, respectively;
Table III). Peripancreatic vascular
invasion was similar in both groups (Table III). However, we observed 7 cases of
cancer embolus and 5 cases of hepatic metastases in PC, thereby
showing increased vascular invasion in PC. Meanwhile, 2 MFCP
patients showed portal vein thrombosis (Fig. 4B), suggesting initiation of
peripancreatic vascular invasion in MFCP by regular
morphogenesis.
We observed that there were no significant
differences in pancreatic and retroperitoneal lymph nodes of both
MFCP and PC groups. In MFCP, the multiple lymph nodes were slightly
larger than normal (average diameter: 11 mm vs. <5 mm) with mild
homogeneous enhancement, whereas, the PC group showed a significant
increase (average diameter: 15 mm) with partially visible fusion
and uniform annular enhancement.
High signal on DWI was observed in 28.57% MFCP and
89.47% PC cases (P<0.001; Table
III; Fig. 1E). Moreover, ADC
values were higher in the MFCP than in the PC group (P<0.001;
Table III). The MFCP group showed
lower maximal mean SUV than in the PC group for the early
(2.51±0.42 vs. 7.13±3.04; P<0.001; Table III) and delayed (2.10±0.31 vs.
9.20±3.56; P<0.001; Table III)
phases. The delayed phase SUV increased in the PC group (Figs. 5E and 6G and
H), but changed minimally or decreased in the MFCP group
(Figs. 2D and 4C and D).
As shown in Table IV
and Figs. 7 and 8, the optimal cutoff values for
distinguishing MFCP from PC patients was 4.40 cm for lesion size
(sensitivity, 75%; specificity, 90%; area under the curve (AUC):
0.894; 95% confidence interval (CI): 0.810–0.978), 21.85 Hu for
net-increased value in arterial phase (sensitivity, 58%;
specificity, 97%; AUC, 0.799; 95% CI, 0.670–0.928), 37.70 Hu for
net-increased value in portal phase (sensitivity, 83%; specificity,
70%; AUC, 0.798; 95% CI, 0.919–0.677), 4.85 for early SUV value
(sensitivity, 90%; specificity, 92%; AUC, 0.934; 95% CI,
0.850–1.018) and 4.90 for delayed SUV value (sensitivity, 97%;
specificity, 96%; AUC, 0.958; 95% CI, 0.878–1.038).
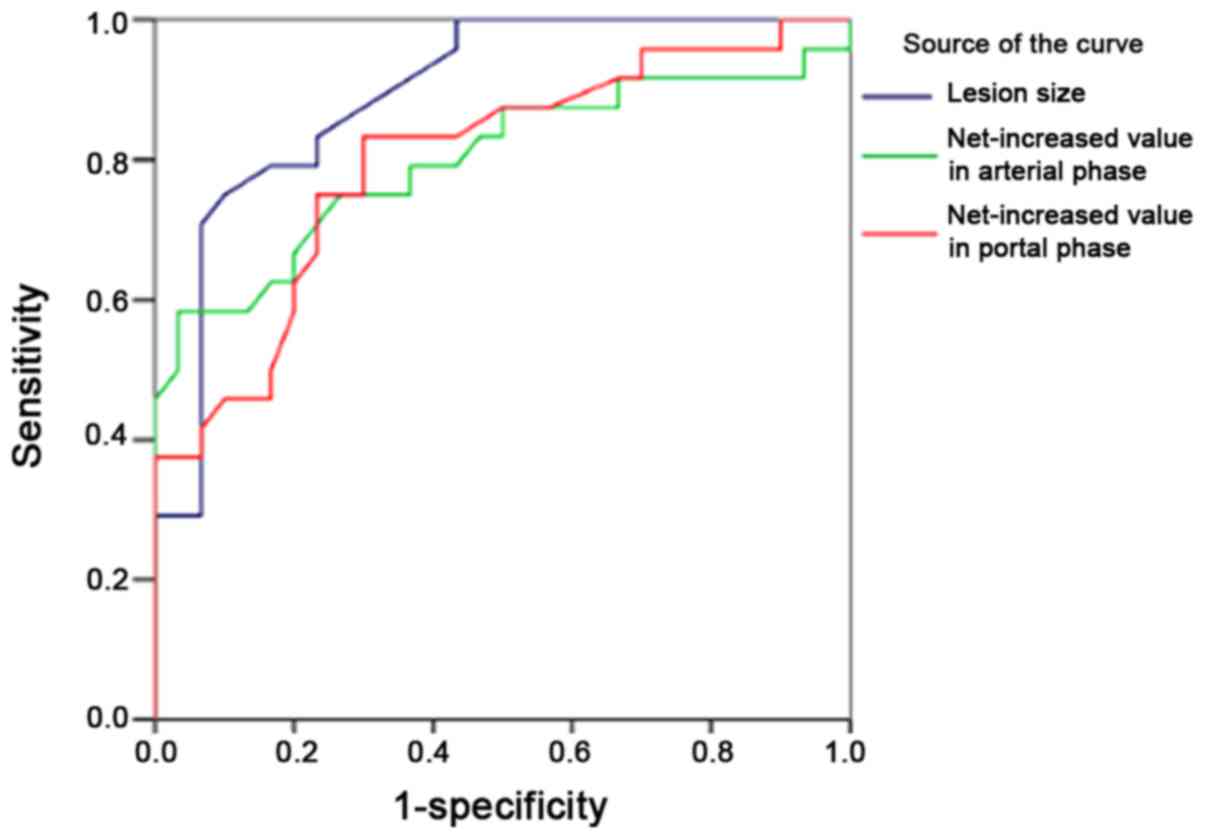 | Figure 7.Receiver operating characteristic
curves for lesion size and net-increased standardized uptake values
in arterial and portal phases to distinguish MFCP and PC. The
cutoff value was 4.40 (sensitivity, 75%; specificity, 90%; AUC,
0.894; 95% CI, 0.810–0.978) for lesion size; 21.85 (sensitivity,
58%; specificity, 97%; AUC, 0.799; 95% CI, 0.670–0.928) for
arterial phase and 37.70 (sensitivity, 83%; specificity, 70%; AUC,
0.798; 95% CI, 0.919–0.677) for portal phase. CI, confidence
interval; AUC, area under the curve. |
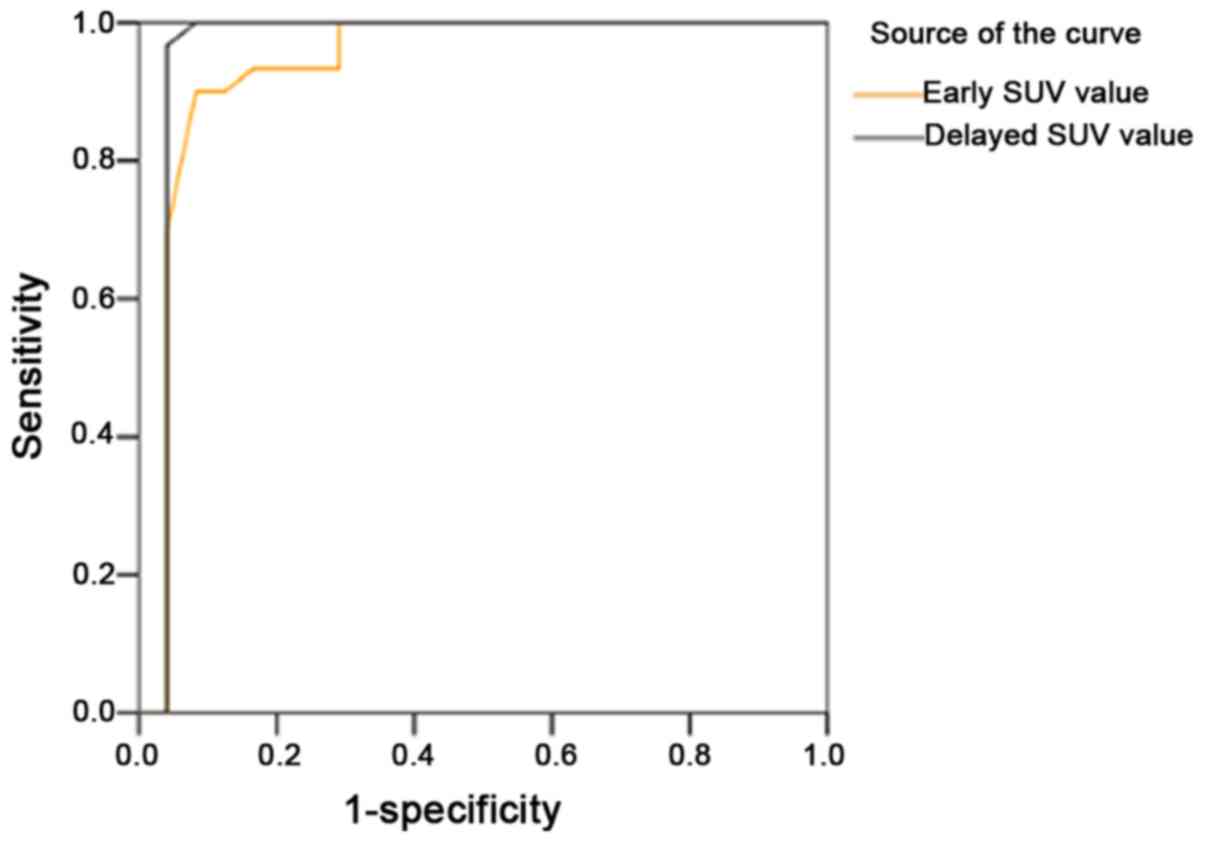 | Figure 8.Receiver operating characteristic
curve for early and delayed SUV to distinguish MFCP and PC. The
cutoff value is 4.85 (sensitivity, 90%; specificity, 92%; AUC,
0.934; 95% CI, 0.850–1.018) for early SUV values and 4.90
(sensitivity, 97%; specificity, 96%; AUC, 0.958; 95% CI,
0.878–1.038) for delayed SUV. CI, confidence interval; AUC, area
under the curve; SUV, standardized uptake values. |
| Table IV.Diagnostic performance of significant
imaging features in distinguishing MFCP from PC. |
Table IV.
Diagnostic performance of significant
imaging features in distinguishing MFCP from PC.
| Parameter | AUC | 95% CI | P-value | Cut off point | Sensitivity | Specificity |
|---|
| Lesion size
(cm) | 0.894 | 0.810–0.978 | <0.001 | 4.40 cm | 0.75 | 0.90 |
| Net-increased value
in arterial phase (Hu) | 0.799 | 0.670–0.928 | <0.001 | 21.85 Hu | 0.58 | 0.97 |
| Net-increased value
in portal phase (Hu) | 0.798 | 0.919–0.677 | <0.001 | 37.70 Hu | 0.83 | 0.70 |
| Early SUV | 0.934 | 0.850–1.018 | <0.001 | 4.85 | 0.90 | 0.92 |
| Delayed SUV | 0.958 | 0.878–1.038 | <0.001 | 4.90 | 0.97 | 0.96 |
Discussion
Pancreatic cancer is a common and aggressive
abdominal malignant tumor with a 5-year survival rate of less than
5% in patients that undergo surgical resection; 50–70% of cases
occur in the head of the pancreas (3,8). MFCP
accounts for 15–30% of chronic pancreatitis, wherein protracted
pancreatic inflammation results in the fibrotic replacement of the
destroyed pancreatic parenchyma and formation of a local mass due
to chronic inflammatory cell infiltration (3,4,21,22). MFCP
and PC are similar in various clinical and biological aspects, and
chronic pancreatitis is one of the risk factors for pancreatic
cancer (2,4,7). In our
study, MFCP patients were younger than PC patients, though
statistically insignificant. The MFCP patients, unlike PC patients,
had a history of biliary tract disease, long-term alcohol
consumption and chronic pancreatitis. This suggests that chronic
damage because of biliary disease, long-term alcohol drinking and a
history of pancreatitis are independent risk factors for MFCP
(22). In our study, we distinguished
MFCP and PC by analyzing multiple Multi-modality imaging
features.
The size of the lesions was larger in MFCP patients
than in PC patients and an optimal cutoff value of 4.40
distinguished MFCP from PC lesions. The boundaries of the lesions
were more unclear in MFCP than in pancreatic cancer, and the
exudation around the lesion was more obvious in the MFCP group. The
right perirenal fascia thickening was more obvious in MFCP than in
PC, probably due to chronic inflammation. Moreover, the lack of a
complete pancreatic capsule resulted in inflammatory exudate,
connective tissue proliferation and necrosis, which easily spread
into the adjacent peripancreatic and renal interstitial spaces.
Anterior renal fascia or renal peritoneal thickening was strong
evidence of chronic pancreatic inflammation. Moreover, lobulation
was closely related to lesion size, with predominantly larger
lesions observed in PC cases than in MFCP (83.33% vs. 12.5%). These
parameters highlighted the distinct biological and
pathophysiological properties of PC and MFCP.
Cystic necrosis was more common in PC than in the
MFCP group. In PC, the wall of cystic necrosis was uneven, whereas
the inner margin of the MFCP cystic necrosis area was smoother.
Calcification was more common in MFCP than in PC. The main
calcification type was mixed with diffused distribution. The edge
of the lesion was associated with multiple pancreatic duct stones
because of recurrent and progressive inflammatory fibrosis that
damaged the internal and external secretory functions to varying
degrees and resulted in calcium deposition. These, subsequently
lead to pancreatic duct calcification and stones. In PC,
calcification was located in the central necrotic area. These
common changes occurred in both diseases. However, we observed
visible remnants of normal pancreatic tissue within MFCP lesions
that could be used to distinguish MFCP from PC. Large scale studies
are necessary to confirm these differences.
Cystic lesions or pancreatic pseudocysts are
fluid-filled cavities wrapped by the wall of fibrotic pancreatic
tissue. The incidence of cystic lesions was observed in 58.33% of
MFCP patients and 10% of PC patients. In MFCP, cystic lesions were
mainly located within or around the pancreatic head mass and
characterized by honeycomb-like cysts as well as calcified and
discontinuous wall. These features were not observed in the PC
cases.
In MFCP, secondary chronic pancreatitis causes
atrophy of the pancreatic body and tail. Atrophy and pancreatic
duct obstruction of the body and tail of the pancreas have been
linked to PC (3). In our study, the
incidence of atrophy was similar between MFCP and PC cases (41.67%
vs. 36.67%). A previous report indicated differences in atrophy at
an early stage of PC (3), which needs
to be confirmed by large scale studies in the future.
In most PC cases, the pancreatic duct was obstructed
by infiltrative growth of the cancer resulting in distal pancreatic
duct dilation, which was smooth and continuous. However, few PC
cases showed no expansion of the distal pancreatic duct as
compensation to obstruction. Therefore, mild expansion of the
pancreatic duct is an early indicator of PC. Furthermore,
obstruction of the common bile duct was observed in most PC cases.
The dilation of the pancreatic duct in MFCP showed beaded
appearance and was secondary to the chronic pancreatitis. It showed
pancreatic duct stones and calcification and compressed the distal
common bile duct. Infiltration of the bile wall by inflammatory
cells and fibrosis resulted in incomplete biliary obstruction. A
previous study showed that bile duct dilation was similar in both
MFCP and PC, but the degree of dilatation was more obvious in PC,
probably related to the pathological stages of the samples and
other molecular mechanisms (23–26).
Furthermore, the common bile duct wall showed a reinforced ring at
the delayed phase in MFCP samples. Further analysis is necessary to
confirm if this is a distinguishing feature that can be used to
distinguish MFCP from PC. The dilated pancreatic ducts passed
through the lesion area in 79.17% MFCP and 16.67% PC cases,
whereas, they obstructed the lesion area in 8.33% MFCP and 70% PC
cases. These data were consistent with previous literature
(3), and are characteristic of
PC.
CT multi-phase scan was the best imaging method for
the early diagnosis of PC. It identified hemodynamic changes in PC,
and the degree of early enhancement was proportional to the
vascular density and diffusion of the contrast agent into the
extravascular space. Lack of blood supply in the PC tissue,
especially in the arterial phase of the enhancement scan was
characteristic of lesions in PC. Moreover, necrosis of a large
number of normal pancreatic cells resulted in delayed clearance of
the contrast agent. Thus, the performance of the dynamic
enhancement (lower enhancement in artery phase and delayed
enhancement in delayed phase) was slow lift platform type. The
strengthening degree was higher in the arterial and portal venous
phases of MFCP than in the PC group. The optimal cutoff value for
differentiating MFCP from PC was 21.85 Hu for arterial phase, and
37.70 Hu for portal phase. Previous study also showed that the
decrease of blood flow and blood volume was more pronounced in PC
than in MFCP (11), which resulted in
delayed peak extension in PC than in MFCP (3).
We also investigated if the peripancreatic vessels
were involved in MFCP and PC. We observed narrowing fat gap between
the lesions and the peripancreatic vessels, which were wrapped by
the abnormal mass, especially in the PC group, and displaced with a
shape-rule margin in MFCP. Furthermore, in most MFCP cases, we
observed expansion of the superior mesenteric vein, probably
because of blood flow changes as a result of pancreatitis.
In both MFCP and PC, most lymph nodes were enlarged
around the pancreatic head, especially in PC patients. The
PC-related lymph nodes were significantly enlarged and showed
greater enhancement with fusion, heterogeneous enhancement and
uneven thickness of the ring wall. However, these parameters were
not statistically significant when compared with MFCP. In MFCP
patients, the pancreatic nodes showed slight enlargement with edge
blur and mild homogeneous enhancement. Moreover, these findings
were difficult to distinguish from lymph node tuberculosis and
needed to be combined with other clinical features for
diagnosis.
Despite some similarities, DWI is critical in the
early and differential diagnosis of MFCP and PC because it
quantitatively evaluates the free movement of water molecules
within the pancreatic tissue (12,16,18,27).
Most PC cases showed a high signal and lower ADC value on DWI than
in MFCP because of low cell density in the extracellular space.
Moreover, MFCP showed differences in the diffusion of water
molecules in the lesion area because of differences in exudation
and varying degrees of hyperplasia due to prolonged chronic
inflammation. Our study shows that restricted diffusion of water
molecules was more common and that the signal was significantly
uneven in the PC group than in MFCP. These data are consistent with
previous reports (12,16,27).
However, there is a considerable overlap in the DWI signals for
both PC and MFCP. Hence, differential diagnosis requires
comprehensive analysis of multi-modality imaging data. We selected
a high b value of 800 s/mm2 because studies have
indicated that high b values result in acquiring the true ADC value
of the tissue and increase the specificity of the diagnosis
(12,16,18).
Most PCs show high uptake of 18F-FDG by
localized lesions in the early and delayed phases (5,19). Our
study showed that SUV values were lower for the MFCP than the PC
group in both the early (2.51±0.42 vs. 7.13±3.04) and delayed
(2.10±0.31 vs. 9.20±3.56) phases. The optimal cutoff SUV values
were 4.85 (sensitivity of 90%, and specificity of 92%), and 4.90
(sensitivity of 97% and specificity of 96%) for early and delayed
phases to differentiate MFCP and PC, respectively. The SUV values
of PC group increased with the delay time, whereas there was
minimal change or a decrease in the MFCP group, consistent with
previous reports (5,13,19).
However, macrophages, neutrophils and other inflammatory cells,
which express the glucose transporter and glycolytic enzymes
highly, also lead to accumulation of 18F-FDG locally.
This makes it difficult to distinguish PC from pancreatitis,
tuberculosis and autoimmune diseases (5,13). A case
of MFCP, which was secondary to autoimmune pancreatitis, was
confirmed by surgery and pathology in our study. The high-uptake of
18F-FDG by the multi-site uneven lesions, combined with
other data from conventional CT scan and enhanced imaging showed
clear signs of pancreatitis. Thus, comprehensive analysis of
multiple multi-modality imaging data is necessary in most cases for
accurate diagnosis. Previous studies showed high 18F-FDG
uptake in autoimmune pancreatitis (100%). In most pancreatitis
lesions or benign tumors, the high uptake of 18F-FDG was
not smooth, non-nodular, and unevenly distributed, whereas, in most
malignant lesions the uptake was smooth, localized, nodular and
uniformly distributed (5,13). Size of the pancreatic lesions also
influenced the accuracy of 18F-FDG PET diagnosis because
lesions with few tumor cells or low expression of the glucose
transporter combined with limited spatial resolution and density
contrast were easily missed in a PET/CT scan (5). In contrast, smaller malignant tumors
with high glucose metabolism, and mucus or serous
cystadenocarcinoma exhibited low 18F-FDG uptake
(5,13). In our study, many PC cases showed the
above-described negative findings, but had characteristic imaging
findings on dynamic contrast-enhanced CT and delayed PET/CT scans.
Early or malignant PC lesions that are smaller show negative
PET/CT. Therefore, delayed imaging combined with enhanced CT or MRI
is essential for accurate and differential diagnosis. Accuracy of
PC diagnosis with 18F-FDGPET/CT, MDCT and MRI was 89, 76
and 70%, respectively (3,5). PC was more accurately diagnosed by
PET/CT, which also showed higher sensitivity for distant metastasis
than MDCT and MRI. Moreover, SUV levels were influenced by factors
such as weight of the individual, fat, blood glucose level, and
selection of image reconstruction method (13).
This study is mainly discussing the multimodal
imaging features and its differential diagnosis efficiency on
distinguishing PC from MFCP of the pancreatic head. The comparison
analysis of diagnostic efficacy among different single method of
imaging examination will be presented in next research. It is also
well know that any single imaging examination has some overlapping
and limitations. Therefore, tumor marker results were not included
in the analysis which will be taken into account in the next study,
but our results indicate that the CA19-9 value were increased in 21
cases with PC (average 340.34±140.65 U/dl) and in 13 cases with
MFCP (average 109.05±37.87 U/dl).
In conclusion, we demonstrate that integration of
dynamic contrast-enhanced CT scan MRI and 18F-FDG-PET/CT
imaging methods is necessary for differential diagnosis of MFCP
from PC. This study was a retrospective study with a limited sample
size and therefore needs to be confirmed by large scale study. In
addition, the clinical stage (TNM staging) of PC was not analyzed
which will be covered in the future study along with possible
molecular mechanism (28–30).
Acknowledgements
Not applicable.
Funding
The present study was funded by The Department of
Science and Technology in Guiyang (grant no. GY2015-32).
Availability of data and materials
The datasets used and/or analyzed during the current
study are available from the corresponding author on reasonable
request.
Authors' contributions
RZ designed the research and wrote the manuscript.
MD performed the statistical analysis. RZ, JJ, QJ, LJ, CJ, LQ and
WC collected, analyzed and interpreted all of the data and results.
All authors read and approved the final manuscript.
Ethics approval and consent to participate
and publication
The present study was approved by the Ethics
Committee of the Affiliated Hospital of Guizhou Medical University
(Guizhou, China) and was performed according to the Declaration of
Helsinki guidelines. Written informed consent was obtained from all
participants for inclusion in the study.
Consent for publication
Written informed consent was obtained from all
participants for publishing their images in this manuscript.
Competing interests
The authors declare that they have no competing
interests.
References
|
1
|
Dutta AK and Chacko A: Head mass in
chronic pancreatitis: Inflammatory or malignant. World J
Gastrointest Endosc. 7:258–264. 2015. View Article : Google Scholar : PubMed/NCBI
|
|
2
|
Merdrignac A, Sulpice L, Rayar M, Rohou T,
Quehen E, Zamreek A, Boudjema K and Meunier B: Pancreatic head
cancer in patients with chronic pancreatitis. Hepatobiliary
Pancreat Dis Int. 13:192–197. 2014. View Article : Google Scholar : PubMed/NCBI
|
|
3
|
Yao L, Jian Z and Jing ZC: Differential
diagnosis of imaging between the mass-forming chronic pancreatitis
and pancreatic carcinoma. Chin J Pancreatol. 15:59–63. 2015.
|
|
4
|
Braganza JM, Lee SH, Mccloy RF and Mcmahon
M J: Chronic pancreatitis. Lancet. 377:1184–1197. 2011. View Article : Google Scholar : PubMed/NCBI
|
|
5
|
Kato K, Nihashi T, Ikeda M, Abe S, Iwano
S, Itoh S, Shimamoto K and Naganawa S: Limited efficacy of
(18)F-FDG PET/CT for differentiation between metastasis-free
pancreatic cancer and mass-forming pancreatitis. Clin Nucl Med.
38:417–421. 2013. View Article : Google Scholar : PubMed/NCBI
|
|
6
|
Perumal S, Palaniappan R, Pillai SA,
Velayutham V and Sathyanesan J: Predictors of malignancy in chronic
calcific pancreatitis with head mass. World J Gastrointest Surg.
5:97–103. 2013. View Article : Google Scholar : PubMed/NCBI
|
|
7
|
Raimondi S, Lowenfels AB, Morselli-Labate
AM, Maisonneuve P and Pezzilli R: Pancreatic cancer in chronic
pancreatitis; aetiology, incidence, and early detection. Best Pract
Res Clin Gastroenterol. 24:349–358. 2010. View Article : Google Scholar : PubMed/NCBI
|
|
8
|
Min HS, Qiang LZ, Xiao Y, Chan Y, Wei ZH,
Wen WD and Jun S: Clinical efficacy of pancreaticoduodenectomy and
duodenum-preserving pancreatic head resection for the treatment of
chronic pancreatitis with mass in the head of the pancreas. Chin J
Dig Surg. 14:653–658. 2015.
|
|
9
|
Xue SA and Gong ZC: Progress in diagnosis
and surgical treatment for pancreatic head mass due to chronic
pancreatitis. Chin J Gen Surg. 25:434–438. 2016.
|
|
10
|
Yi L, Ming LY, Na L, Na LX and Lin DB:
Application of 18F FDG PET/CT in the diagnosis and differential
diagnosis of benign and malignant pancreatic lesions. J China Med
Univ. 43:547–552. 2014.
|
|
11
|
Lu N, Feng XY, Hao SJ, Liang ZH, Jin C,
Qiang JW and Guo QY: 64-slice CT perfusion imaging of pancreatic
adenocarcinoma and mass-forming chronic pancreatitis. Acad Radiol.
18:81–88. 2011. View Article : Google Scholar : PubMed/NCBI
|
|
12
|
Dale BM, Braithwaite AC, Boll DT and
Merkle EM: Field strength and diffusion encoding technique affect
the apparent diffusion coefficient measurements in
diffusion-weighted imaging of the abdomen. Invest Radiol.
45:104–108. 2010. View Article : Google Scholar : PubMed/NCBI
|
|
13
|
Diederichs CG, Staib L, Vogel J,
Glasbrenner B, Glatting G, Brambs HJ, Beger HG and Reske SN: Values
and limitations of 18F-fluorodeoxyglucose-positron-emission
tomography with preoperative evaluation of patients with pancreatic
masses. Pancreas. 20:109–116. 2000. View Article : Google Scholar : PubMed/NCBI
|
|
14
|
Ye S, Wang WL and Zhao K: F-18 FDG
hypermetabolism in mass-forming focal pancreatitis and old hepatic
schistosomiasis with granulomatous inflammation misdiagnosed by
PET/CT imaging. Int J Clin Exp Pathol. 7:6339–6344. 2014.PubMed/NCBI
|
|
15
|
Ying JS, Yun LX and Ju KH: Analysis of
misdiagnosis of pancreatic cancer with ultrasound and its strategy.
J Hepatopancreatobiliary Surg. 25:427–429. 2013.
|
|
16
|
Ke NX, Yu YH, Quan XY, Feng S, Chuan ZL,
Xuan WW and Feng YH: Evaluation of diffusion-weighted imaging in
distinguishing pancreatic carcinoma from mass-forming chronic
pancreatitis: A meta analysis. J Clin Radiol. 34:70–74. 2015.
|
|
17
|
Li H and Yi XT: Progress in the value of
CT, MRI and PET-CT in the diagnosis and staging of pancreatic
cancer. J Med Postgra. 27:777–780. 2014.
|
|
18
|
Choi SY, Kim SH, Kang TW, Song KD, Park HJ
and Choi YH: Differentiating mass-forming autoimmune pancreatitis
from pancreatic ductal adenocarcinoma on the basis of
contrast-enhanced MRI and DWI findings. AJR Am J Roentgenol.
206:291–300. 2016. View Article : Google Scholar : PubMed/NCBI
|
|
19
|
Gu X and Liu R: Application of 18F-FDG
PET/CT combined with carbohydrate antigen 19-9 for differentiating
pancreatic carcinoma from chronic mass-forming pancreatitis in
Chinese elderly. Clin Interv Aging. 11:1365–1370. 2016. View Article : Google Scholar : PubMed/NCBI
|
|
20
|
Kim M, Jang KM, Kim JH, Jeong WK, Kim SH,
Kang TW, Kim YK, Cha DI and Kim K: Differentiation of mass-forming
focal pancreatitis from pancreatic ductal adenocarcinoma: Value of
characterizing dynamic enhancement patterns on contrast-enhanced MR
images by adding signal intensity color mapping. Eur Radiol.
27:1722–1732. 2017. View Article : Google Scholar : PubMed/NCBI
|
|
21
|
Falconi M, Bassi C, Casetti L, Mantovani
W, Mascetta G, Sartiru N, Frulloni L and Pederzoli P: Long-term
results of Frey's procedure for chronic pancreatitis: A
longitudinal prospective study on 40 patients. J Gastrointest Surg.
10:504–510. 2006. View Article : Google Scholar : PubMed/NCBI
|
|
22
|
Neff CC, Simeone JF, Wittenberg J, Mueller
PR and Ferrucci JT Jr: Inflammatory pancreatic masses. Problems in
differentiating focal pancreatitis from carcinoma. Radiology.
150:35–38. 1984. View Article : Google Scholar : PubMed/NCBI
|
|
23
|
Dian ZE, Wu ZD and De LS: Clinical
analysis of 39 cases of chronic pancreatitis with mass. Chin J Dig.
29:161–163. 2009.
|
|
24
|
Martinez E, Silvy F, Lombardo D and Mas E:
Single nucleotide polymorphisms and risk factors predictive of
pancreatic adenocarcinoma. Can Cell Microenviron. 3:e12312016.
|
|
25
|
Westphale CB, Renz BW, Reiche M, Rustg AK
and Wan TC: Cellular plasticity and heterogeneity in pancreatic
regeneration and malignancy. Can Cell Microenviron.
3:e14722016.
|
|
26
|
Pu N, Zhao G, Lv Y and Wu W: The
advancement of tumor microenvironment in pancreatic carcinoma. Can
Cell Microenviron. 3:e12482016.
|
|
27
|
Frulloni L, Amodio A, Katsotourchi AM and
Vantini I: A practical approach to the diagnosis of autoimmune
pancreatitis. World J Gastroenterol. 17:2076–2079. 2011. View Article : Google Scholar : PubMed/NCBI
|
|
28
|
Krueger J, Jules F, Reider S and Rudd C:
CD28 family of receptors inter-connect in the regulation of
T-cells. Recept Clin Invest. 4:e15812017.
|
|
29
|
Adriani G, Bai J, Wong SC, Kamm RD and
THIERY JP: M2a macrophages induce contact-dependent dispersion of
carcinoma cell aggregates. Macrophage. 3:e12222016.
|
|
30
|
Runa F, Adamian Y and Kelber JA: Ascending
the PEAK1 toward targeting TGFβ during cancer progression: Recent
advances and future perspectives. Can Cell Microenviron.
3:e11622016.
|