Introduction
Somatic aberrations, including copy number variants
(CNV) and loss of heterozygosity (LOH) have an important role in
tumor progression (1–3). Previous experimental studies of somatic
aberrations in tumor samples were performed primarily by using
microarray comparative genomic hybridization (array-CGH) techniques
(4,5)
or single nucleotide polymorphism (SNP) arrays (6,7). More
recently next-generation sequencing (NGS) was developed, which
allows for massively parallel sequencing of DNA (7–9). The NGS
technology platform is able to efficiently sequence a sample in a
few days, which is much shorter compared with previous methods
(10). Whole-exome sequencing (WES)
employs NGS technology and only sequences the exonic regions, and
dismisses the intragenic regions.
Compared with whole-genome sequencing (WGS), WES has
the advantages of more straightforward interpretation, lower cost
and significantly greater coverage, which contributes to
improvements in quality of data (11–13).
Despite the promising potential of WES for detecting
CNV from tumor samples, several critical issues are required to be
addressed. When using WES data issues, including batch effect
(14) among samples and the sparse
nature of exonic regions, make algorithms that use split-read or
read-pair signals unsuitable for CNV detection (15). To address these issues, several
computational methods have been proposed to identify CNV from exome
sequencing samples, including ExomeCNV (16), Copy Number Inference From Exome Reads
(CoNIFER) (17), XHMM (18), CANOES (19) and EXCAVATOR (20). CoNIFER uses singular value
decomposition to correct data, while XHMM employs principal
component analysis to eliminate noise included in raw read depth
signal and builds a hidden Markov model to discover CNVs in each
exonic region (17–18). XHMM calculates the breakpoint quality
score, which contributes to further downstream analysis. Although
CoNIFER and XHMM have been reported to have good performance, many
samples need to be provided at once, which limit their application
to situations where there is a limited availability of sequencing
samples. CANOES overcomes this limitation and uses a
regression-based approach to estimate parameters in a negative
binomial model (19). However, all of
these methods have been specially developed to detect rare CNVs,
while common CNVs also carry substantial risk for disease (20). Furthermore, these methods classify
each exonic region into one of three state classifications:
Deletion, normal or amplification, which cannot provide the exact
copy number of each exon (19,20).
EXCAVATOR has been introduced to classify genomic regions into 5
copy number states using a hidden Markov model. However, this
method cannot infer tumor impurity in tumor samples and identify
LOH, which is common in cancer genome (21).
To overcome the limitations of existing CNV
detection methods using WES data, a novel method, PECNV, is
presented in the current study to identify CNVs and LOH from tumor
and matched normal samples using WES data. Comprehensive processing
procedures, including elimination of sequencing/mapping bias, batch
effect and exon size diversity, were used in PECNV to normalize
read counts derived from tumor WGS data. PECNV combined log ratio
of read counts (Log Ratio) and B allele frequency (BAF) with two
Gaussian models, which take tumor impurity and Log Ratio baseline
shift into account. Expectation maximization algorithm was applied
to estimate parameters included in the models. Copy number and LOH
in each exonic region were estimated using the optimal parameters.
A comprehensive assessment of PECNV was performed by analyzing
simulated samples contaminated with different proportions of normal
cells and eight real primary triple-negative breast cancer WES
sequencing datasets. PECNV showed superior results compared with
ExomeCNV and EXCAVATOR in genomic aberrations detection using tumor
WES data.
Materials and methods
Data biases and correction
To study genomic CNVs from exome sequencing data,
read counts (RC) aligned to each exon and BAF signals were obtained
from the tumor sequencing file using SAMtools, as previously
described (22). RC for each exonic
region displays the number of reads aligned to each region, which
can reflect copy numbers in exonic regions. As previously reported,
there are primarily four sources of bias that affect RC signals,
including the size of exonic regions, batch effect, local GC
content percentage and genomic mappability (14,23). To
eliminate the effect of different exon sizes among regions and make
the data among samples comparable, reads counts per thousand bases
per million reads sequenced (RPKM) were calculated as introduced by
Mortazavi et al (24):
RPKM=109·RCTRC·S
where TRC refers to total read counts mapped
to exonic regions, and s is the size of the captured exonic
region. Next, normalization methods as described in Yoon et
al (23) were employed to remove
GC content and mappability bias. Following the procedure,
GC-content and mappability were scaled to integer values. Then, the
normalized RPKM was calculated using the following formula:
NRPKM=RPKMxmmx
where NRPKM is the corrected RPKM, m
is the median of RPKM of all exonic regions, and mx
refers to the median RPKM of the regions, which share the
same GC-content and mappability as the current exonic region.
Following GC and mappability correction, the logarithmic ratio of
RPKM (Log Ratio) between tumor samples and matched normal samples
in each corresponding region was calculated to eliminate batch
effect.
Statistical distributions of the
signals
Previous studies (16,21) have
shown that both Log Ratio and BAF approximately follow a normal
distribution. Accordingly, let ri be Log Ratio
and ci be copy number states, as defined in
(21) of the i-th exon in the
genomic sequence. A total of four global parameters were employed
in the PECNV model: Tumor impurity (w), Log Ratio baseline
shift (o), and standard deviation of Log Ratio
(σx) and BAF signals (σb).
Then, the conditional probability density function follows a normal
distribution:
r|w,o,σr,c~N(log(yc2)+o,σr2)
where yc refers to the average
copy number in state c, which is defined as:
yc=w·ns+(1-w)·nc
where ns denotes the normal copy
number (ns=2), and nc is the
tumor copy number in state c.
Similarly, BAF can be modeled by a normal
distribution as reported in (21).
Let bi be the BAF signal in i-th exonic
region, and its conditional probability density function can be
formulated as:
b|w,σb,c~N(Bw,c,σb2)
where Bw,c denotes theoretical BAF
in mixed tumor cells and can be calculated as:
Bw,c=w+(1-w)·bc2·w+(1-w)·nc
where bc refers to theoretical BAF
in the state in pure tumor samples.
EM algorithm and CBS segmentation
The EM algorithm was used to estimate the global
parameters. EM is a general method, which identifies the optimal
parameters that maximize the logarithm likelihood function when an
incomplete data set is given (25).
Parameters that hold same value in all exons in one given sample
may be termed global parameter. Specifically, given signals (Log
Ratio or BAF) X =
{x1,x2…,xN},
copy number states C =
{c1,c2…,cN}
and global parameter set Θ = {σr,
σb,o,w}, the likelihood can be formulated
as:
P(X,C|Θ)=∏i=1Np(xi,ci|,Θ)=∏i=1Np(xi|ci,Θ)p(ci|Θ)
where p(ci ǀΘ) can be
treated as constant, because it is assumed that copy number states
follow a uniform distribution, and copy number states are
independent of the set parameter. Given the observation sequence
and conditional probability density function, the authors of the
present study aimed to estimate parameters that maximize the
likelihood so that it best matches the observations in order to
elucidate the corresponding state sequence. In PECNV, the EM
algorithm was implemented to identify the optimal parameters. As
the first step, the EM algorithm calculated the expected value of
the log-likelihood log(P(X, CǀΘ) given the signal X
and the current estimated parameters (E step), in which the
expectation of log likelihood can be formed as:
Q(Θ,Θ(i-1))=E[logp(X,C|Θ)|X,Θ(i-1)])=∑i=1N∑ci=1Mlogp(xi,ci|Θ)·f(ci|X,Θ(i-1))
where M is the total number of copy number states,
Θ(i-1) refers to the parameter estimated in
(i-1)-th iteration, and Θ is the next iteration.
f(ciǀX,Θ(i-1)) is the
posterior probability given both signal X and current estimated
parameter Θ(i-1). Note that in this equation, X
Θ(i-1) and are constants, and Θ is a normal variable
that we wish to adjust. Then, the Log Ratio and BAF expectation can
be denoted as Qr(Θ, Θ(i-1)) and
Qb(Θ, Θ(i-1)), respectively.
As both CNV and LOH can span multiple exons, the
PECNV method was used to call CNV/LOH on larger segments, in which
exons are contiguous in the human genome. Both Log Ratio and BAF
were segmented by the CBS algorithm in order to identify the
somatic mutation boundaries as described previously (26). Following segmentation, all exons
within the same segment share the same CNV state. Following
segmentation, posterior probability
f(ciǀX,Θ(i-1)) was
calculated in each exon. As the probability depends on the signals
that are in the same segment,
f(ciǀX,Θ(i-1)) can be
formulated as:
f(ci|X,Θ(i-1))=p(ci|xj1,xj2…xjm,Θ(i-1))=∏k=1mp(ci|xjk,Θ(i-1))=∏k=1mp(xjk|ci,Θ(i-1))·p(ci|Θ(i-1))/p(xjk|Θi-1)
where
xj1,xj2,…xjm
are signals in the j-th segment that the i-th exonic
region belongs to, and m is the number of exons in that
segment. p(xjkǀΘ(i-1)) can be
calculated as:
p(xjk|Θ(i-1))=∑c=1Mp(xjk,c|Θ(i-1))=∑c=1Mp(c|Θ(i-1))×p(xjk|c,Θ(i-1))
The M-step of the EM algorithm is to find Θ to
maximize the expectation that was computed in the E step:
Θ(i)=argmaxΘ(Qr(Θ,Θ(i-1))+Qb(Θ,Θ(i-1)))
where Θ(i) is adopted for next
iteration in the E-step. It is difficult to obtain in closed-form
expression by directly solving the equation (10). Instead in the M step, the Newton
algorithm (27) was used to identify
optimal parameters. Steps E and M were repeated until the algorithm
converged, and then parameters in the last iteration were returned
as the optimal estimators. Using optimal parameters, CNV states
that the product of posterior probability of Log Ratio, and BAF was
chosen as the final state in that exonic region.
Statistical analysis
Average absolute difference is employed to measure
the difference between different methods results and the ground
truth. Supposing there exists two signals
S1={s11, s12,
s13 … s1M} and
S1 = {s21,
s22, s23 …
s2M}, which share the same dimension of M. The
average absolute difference (denoted as AAD) between signals and
can be calculated as:
AAD(S1,S2)=1M*∑i=1M|s1i-s2i|
The smaller the value of average absolute
difference, the closer the two signals are.
Simulated and real WES data of tumor
samples
To evaluate the performance of PECNV in different
tumor impurity samples, 8 tumor samples dataset were simulated with
paired normal at ×100 coverage where normal cell proportion ranged
from 0.1 to 0.8. The simulation method was proposed by CLImAT
(28), which employed tumor-normal
admixture on chromosome 20 of the human reference genome. For
better simulation of real situations, the test genome was
constructed according to the CNV state obtained from a real WES
sample. To generate a simulated dataset, reads were sampled from
both control and test genomes with different tumor impurities and
different coverage to be mapped to the reference genome. For each
simulated sample, a total of 72,389 exons were generated with
29,134 amplified exons and 43,255 deleted exons. With these
simulated samples, a comprehensive evaluation of PECNV for CNV
detection was performed. For real sequencing data, 8 paired primary
triple-negative breast cancer (TNBC) WES samples were randomly
selected from datasets employed by Shah et al (29) and were used in the present study. The
reads were previously sequenced on the Illumina Genome Analyzer IIx
platform and mapped to the reference genome NCBI36/hg18 using
Burrows-Wheeler Aligner (22). The
data were downloaded from the European Genome-Phenome Archive
(https://www.ebi.ac.uk/ega/home;
accession no. EGAS00001000132).
Availability of PECNV
The PECNV software package implemented by Matlab is
freely available from: https://github.com/lxcheng/PECNV. Using a Windows 7
operating system with 2.6 GHz CPU and 4 G RAM, it takes ~10 min to
process a single tumor sample. RC and BAF can be obtained from the
tumor sequencing file using SAMtools (22).
Results
Estimation of tumor impurity of
simulated datasets
The simulated samples were detected by PECNV, and
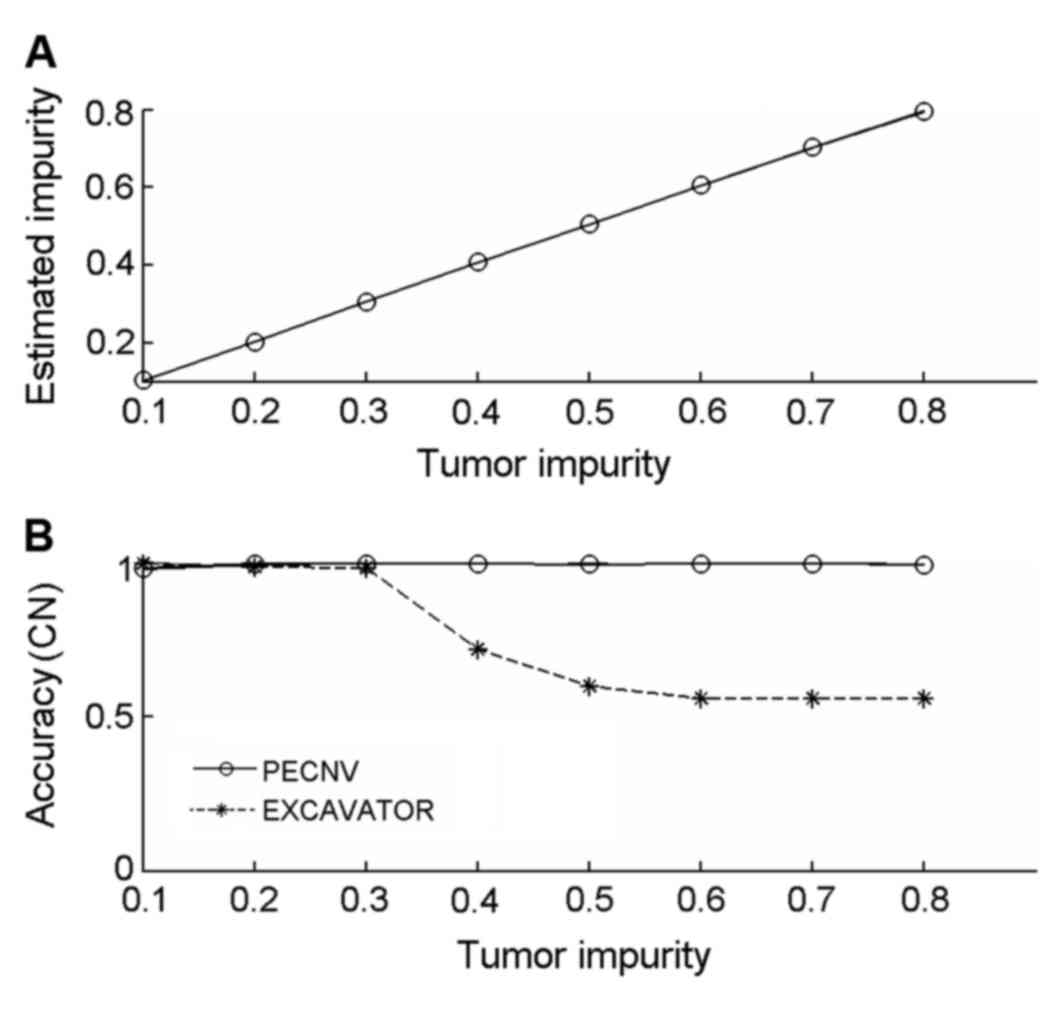
the results are shown in Fig. 1A.
PECNV was able to accurately predict tumor impurity between 0.1–0.8
(sum of square difference to ground truth equals to
1.83×10⁻⁴), indicating PECNV can efficiently estimate
the proportion of tumor cells from samples with different levels of
tumor impurities. The accurate estimation of tumor impurity
indicates a good performance in detecting CNVs.
Next, the latest version of EXCAVATOR (version 2.2)
was compared with PECNV using the simulated datasets Copy number
accuracy of the results was calculated and shown in Fig. 1B. The accuracy of EXCAVATOR decreased
as tumor impurity increased, particularly when tumor impurity was
between 0.3–0.5. When tumor impurity was >0.6, the detection
accuracy was maintained at ~0.6. By contrast, PECNV achieved a high
accuracy (>0.99) in all 8 simulated samples, suggesting that
PECNV is able to accurately predict copy number in samples with
different levels of tumor impurity.
Comparison of CNV detection of
simulated datasets using different methods
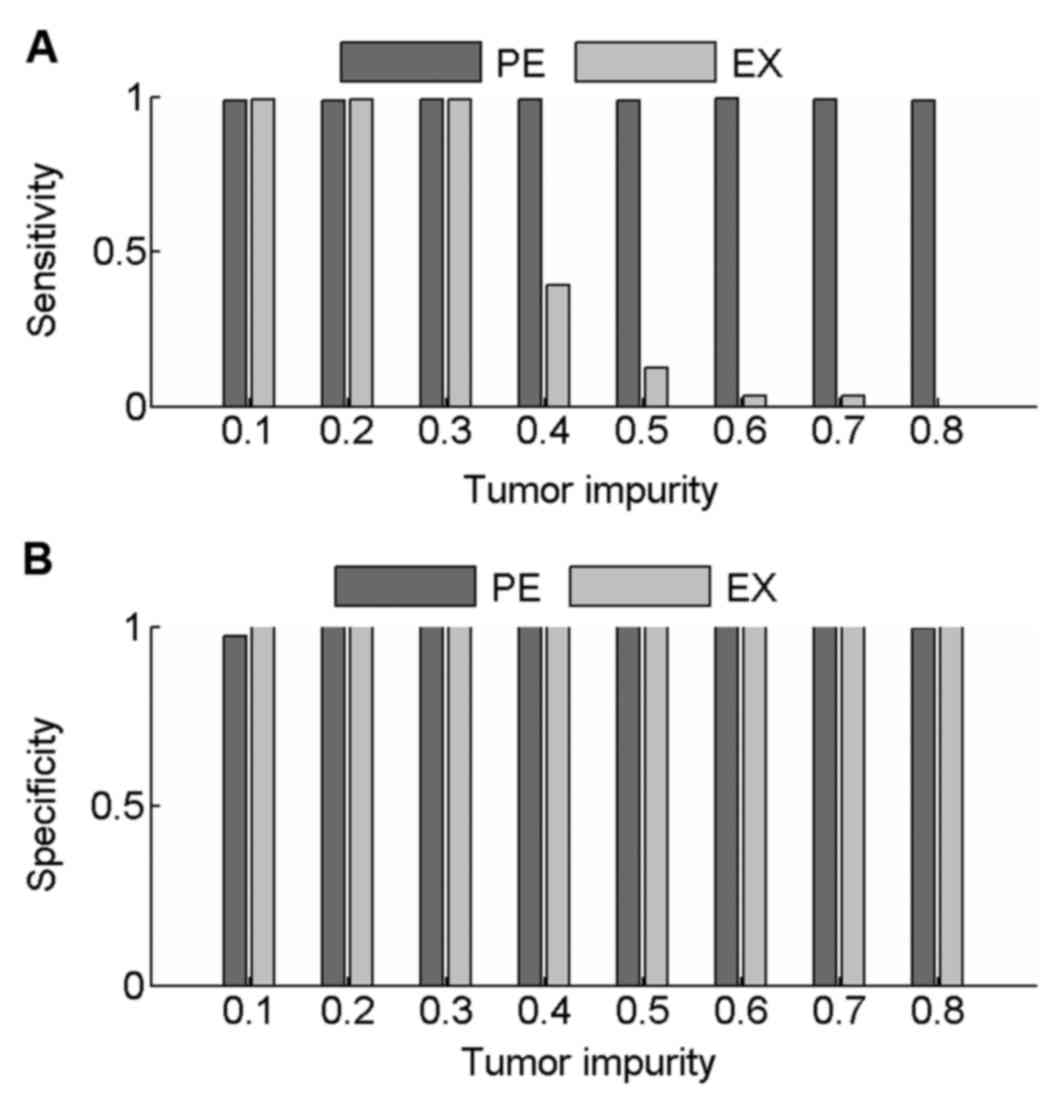
Sensitivity and specificity values were calculated
to compare the performance of PECNV and EXCAVATOR in the detection
of CNVs in simulated samples at 100× coverage. The results are
shown in Fig. 2. When tumor impurity
was <0.3, good results were obtained with PECNV and EXCAVATOR,
with average sensitivity and specificity values >0.98. However,
as the tumor impurity increased >0.40, EXCAVATOR showed a
reduction in power to detect CNV as sensitivity started to
decrease. However, a high specificity was maintained (>0.99),
which indicated that EXCAVATOR is relatively conservative in
identifying CNVs. Compared with EXCAVATOR, PECNV exhibited strong
robustness to tumor impurity and obtained high sensitivity and
specificity across all simulated samples. These results indicated
that PECNV is able to accurately identify CNVs even when tumor
impurity is relatively high.
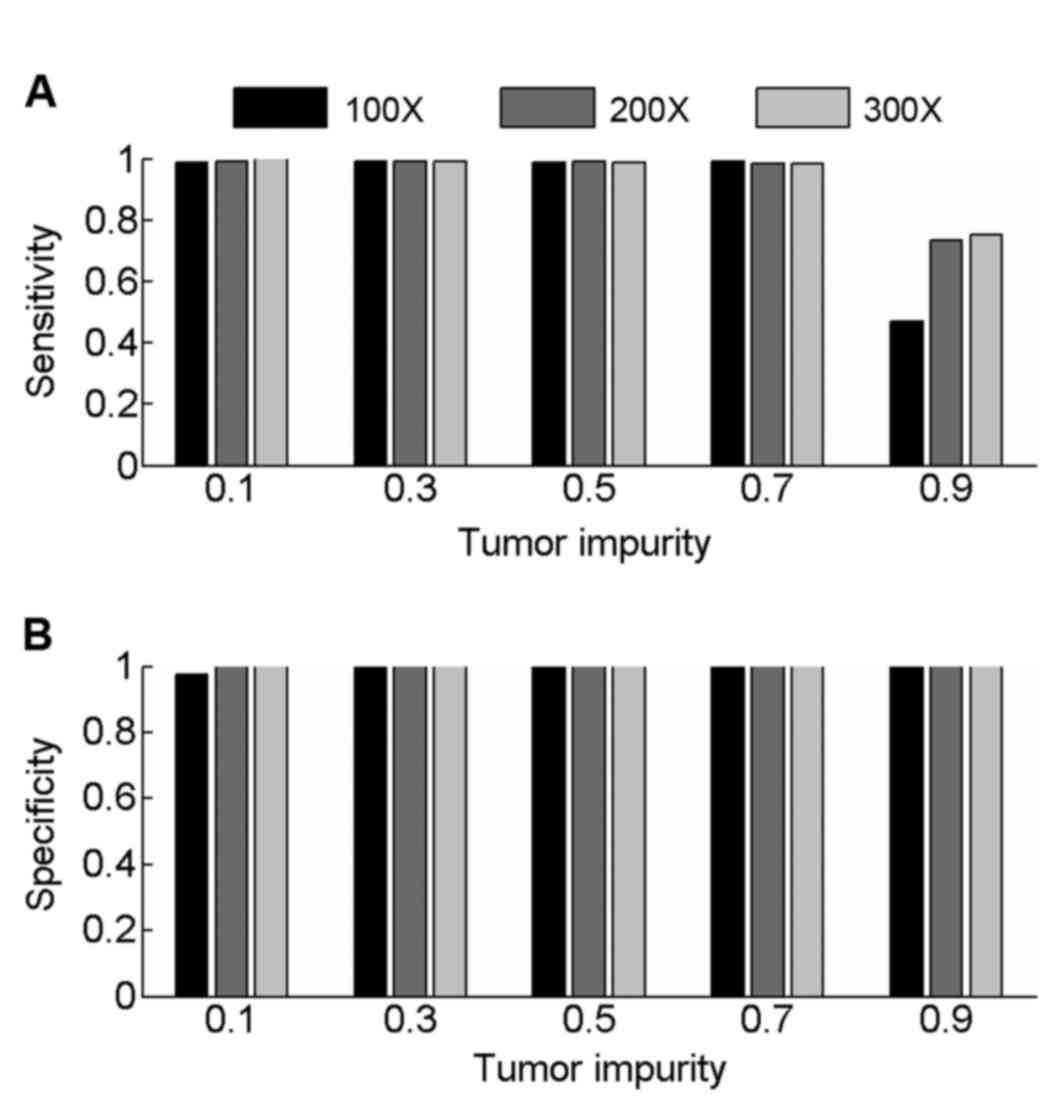
Samples with 200× and 300× coverage were also
simulated to evaluate the performance of PECNV (Fig. 3) in deep sequenced samples. Overall,
PECNV achieved a good performance in terms of sensitivity and
specificity in the simulated tumor samples with tumor impurity at
three different sequencing coverage. As tumor impurity varies in
tumor samples with different coverage, the performance of PECNV
remains excellent, demonstrating the robustness of PECNV to tumor
impurity. Furthermore, there is an improvement in sensitivity at
200× and 300× coverage with PECNV compared with 100×, when tumor
impurity is 0.9. This finding suggested that PECNV has the
potential to identify CNVs in highly contaminated tumor samples,
which have been deep sequenced.
Estimation of tumor impurity of TNBC
datasets
PECNV, EXCAVATOR and ExomeCNV were applied to 8
real paired TNBC WES samples. To assess the performance of PECNV,
the corresponding SNP-arrays assayed by Affymetrix SNP6.0 array
(Affymetrix; Thermo Fisher Scientific, Inc., Waltham, MA, USA) were
detected by Allele-Specific Copy number Analysis of Tumors (ASCAT)
(30), and these results were used as
the ground truth. As the first step, tumor impurity values
estimated by ASCAT and PECNV were assessed (Table I). The tumor impurity values detected
by ASCAT ranged from 0.28 to 0.59. The estimated tumor impurity of
WES data detected by PECNV was consistent with the results attained
by ASCAT (average of absolute difference, 4.8×10⁻²).
 | Table I.ACN and tumor impurity estimated by
ASCAT, PECNV, EXCAVATOR and ExomeCNV in 8 real primary
triple-negative breast cancer datasets. |
Table I.
ACN and tumor impurity estimated by
ASCAT, PECNV, EXCAVATOR and ExomeCNV in 8 real primary
triple-negative breast cancer datasets.
|
| ASCAT | PECNV |
|
|
|---|
|
|
|
|
|
|
|---|
| Sample | ACN | Impurity | EXCAVATOR ACN | ExomeCNV
Impurity | ACN | ACN |
|---|
| S1 | 3.62 | 0.37 | 3.60 | 0.40 | 2.26 | 2.08 |
| S2 | 1.55 | 0.52 | 1.67 | 0.57 | 2.00 | 2.06 |
| S3 | 1.85 | 0.59 | 2.06 | 0.64 | 2.03 | 2.02 |
| S4 | 2.56 | 0.56 | 2.76 | 0.60 | 2.00 | 2.11 |
| S5 | 1.74 | 0.49 | 2.06 | 0.61 | 2.18 | 2.00 |
| S6 | 2.54 | 0.33 | 2.60 | 0.30 | 2.07 | 2.01 |
| S7 | 2.30 | 0.58 | 2.43 | 0.59 | 2.11 | 2.04 |
| S8 | 1.87 | 0.28 | 1.92 | 0.33 | 2.16 | 1.87 |
Next, the average copy number (ACN) of the tumor
samples as detected by the different methods was assessed (Table I). EXCAVATOR provided a good estimate
of ACN in tumor samples where ACN was close to 2 (such as S3 and
S7). ExomeCNV achieved reasonable results in tumor samples with ACN
lower than 2, particularly for tumor sample S8 where the ACN was
1.87. By comparison, the ACNs obtained by PECNV exhibited good
concordance with ASCAT. For example, the estimated ACNs attained by
EXCAVATOR and ExomeCNV were 2.26 and 2.08, respectively, in highly
amplified tumor sample S1 (Table I),
where the ACN was 3.62, predicted by ASCAT. The difference between
EXCAVATOR, ExomeCNV and ASCAT was 1.36 and 1.54, respectively,
whereas PECNV predicted a value of 3.60 for ACN, which was close to
the ground truth. Additionally, the average absolute difference of
ACN between the WES based methods and ASCAT were calculated for the
8 TNBC samples. The average absolute difference of ACN for
EXCAVATOR and ExomeCNV were 0.49 and 0.47, respectively. Compared
with EXCAVATOR and ExomeCNV, PECNV markedly improved the
performance with an average absolute difference of 0.14. These
results suggested that PECNV has the potential for inferring tumor
impurity and ACNs in complicated tumor samples.
Comparisons of CNV detection in TNBC
datasets
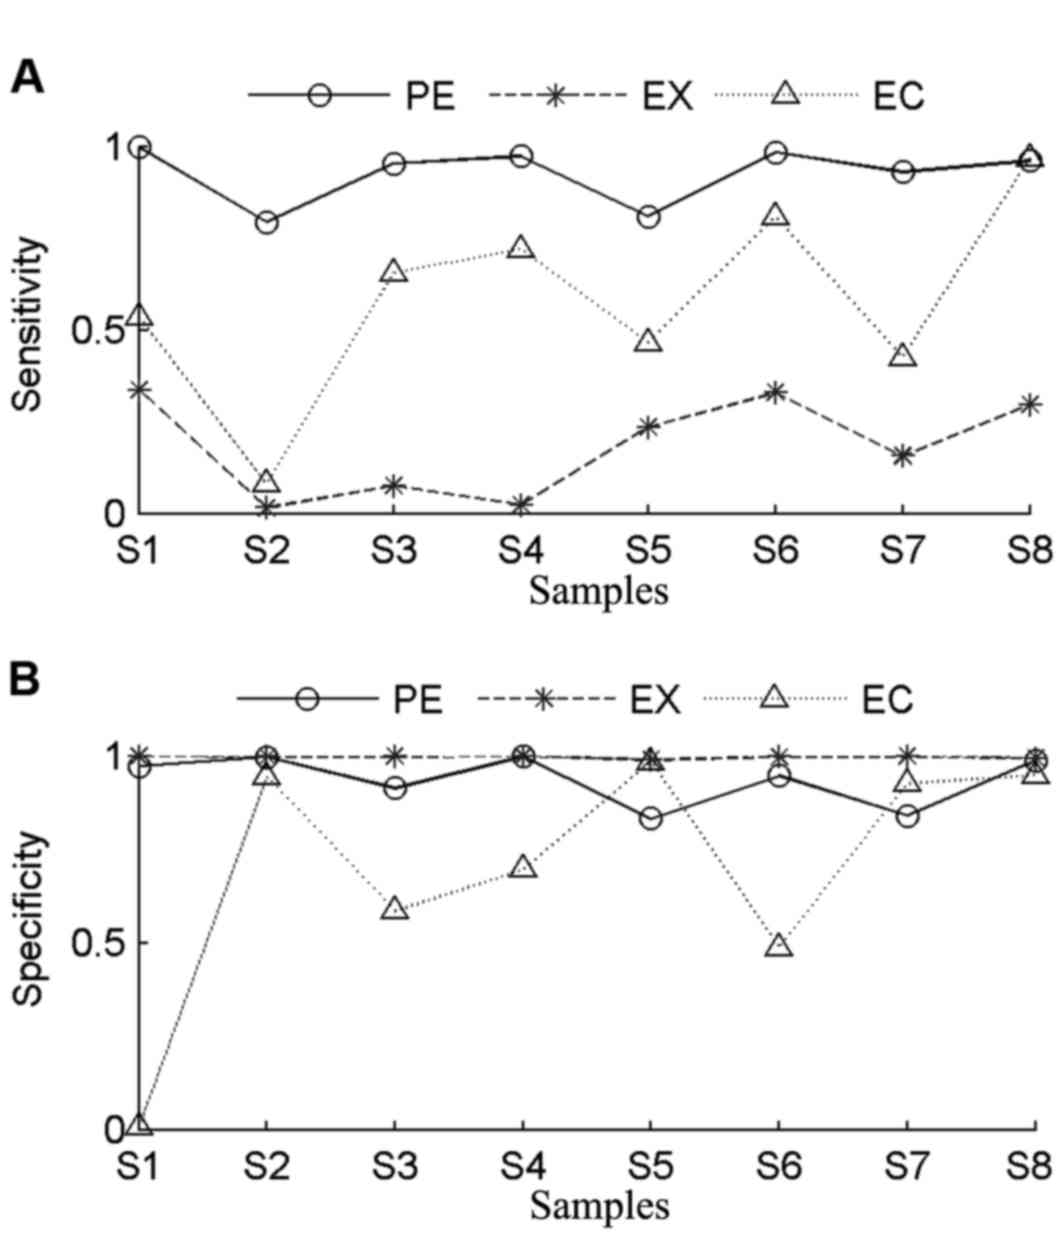
In order to evaluate the accuracy of PECNV,
sensitivity and specificity of the three methods were determined
(Fig. 4). The genomic aberration
profiles of the 8 TNBC samples are summarized in Table II. The samples share the same number
of exons, while the number of copy number gains or losses varied.
Sample S1 contained the highest number of CNVs, while samples S4
had the lowest number of CNVs. In general, EXCAVATOR had the worst
performance in terms of sensitivity, with an average value of 0.18.
Among all tumor samples, the highest sensitivity was obtained in
tumor sample S1. Consistent with the finding in assessment of the
simulated data, it was found that EXCAVATOR tends to be
conservative in identifying CNVs. In comparison with EXCAVATOR,
ExomeCNV achieved higher sensitivity in all samples. In particular,
the highest sensitivity and specificity values were obtained in
tumor sample S8 with ExomeCNV. However, ExomeCNV exhibited lower
specificity in most tumor samples.
| Table II.Total number of copy number gains,
losses and exons in 8 real primary triple-negative breast cancer
datasets. |
Table II.
Total number of copy number gains,
losses and exons in 8 real primary triple-negative breast cancer
datasets.
| Sample | Gains | Losses | Total | Exons |
|---|
| S1 | 125,779 | 2,610 | 128,389 | 164,318 |
| S2 | 2,864 | 70,686 | 73,550 | 164,318 |
| S3 | 39,350 | 44,650 | 84,000 | 164,318 |
| S4 | 64,993 | 776 | 65,769 | 164,318 |
| S5 | 21,278 | 68,809 | 90,087 | 164,318 |
| S6 | 71,267 | 9,884 | 81,151 | 164,318 |
| S7 | 63,587 | 31,385 | 94,972 | 164,318 |
| S8 | 24,397 | 49,899 | 73,996 | 164,318 |
In general, ExomeCNV obtained better sensitivity
and lower specificity compared with EXCAVATOR. By contrast, PECNV
obtained the highest sensitivity across all samples accompanied by
comparable specificity. Notably, PECNV obtained the best
performance in tumor samples S2 and S4 in terms of sensitivity and
specificity. Although for tumor samples S5 and S7, ExomeCNV
exhibited better specificity, PECNV demonstrated better sensitivity
for both samples. Taken together, the results demonstrated that
PECNV exhibited a better overall performance in terms of
sensitivity and specificity compared with EXCAVATOR and ExomeCNV,
suggesting that PECNV has a good efficiency for detection of
CNVs.
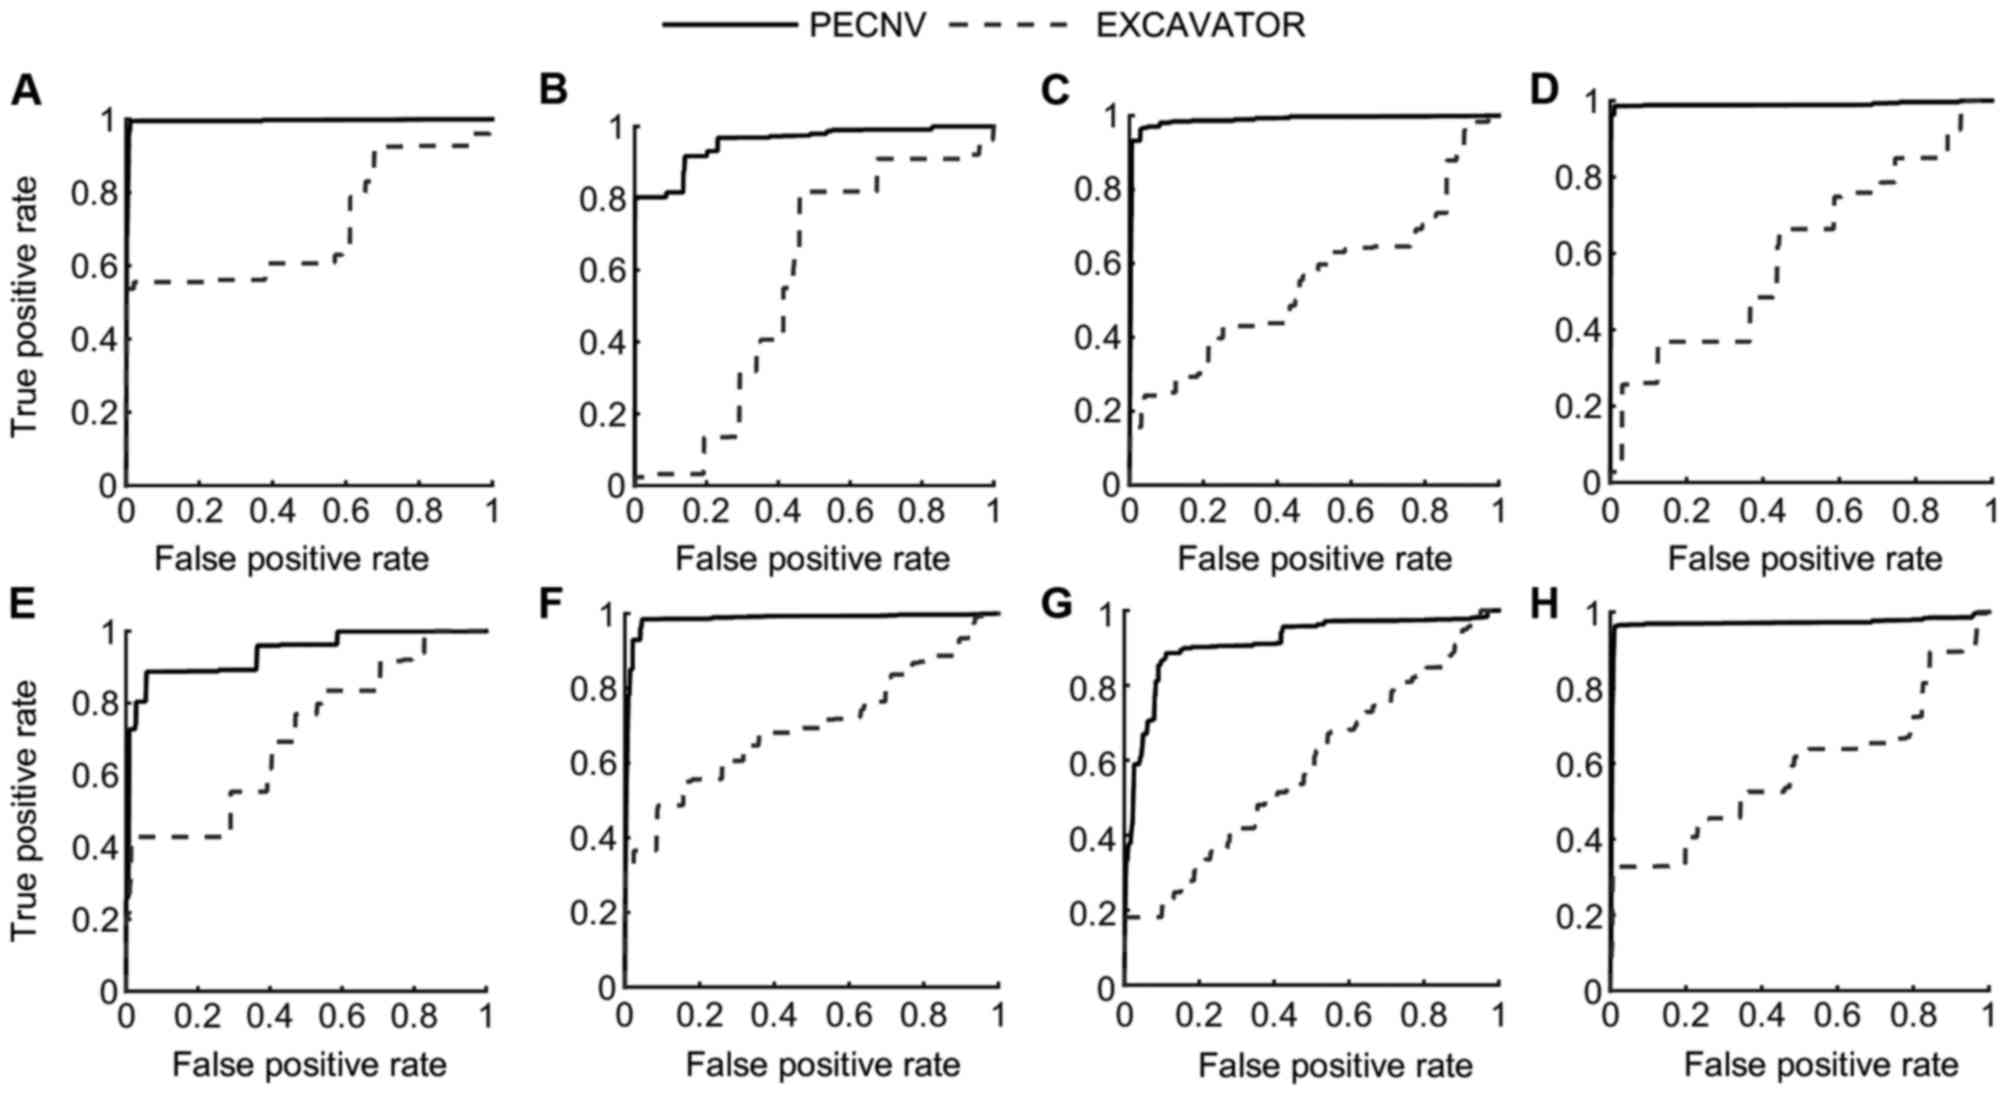
Apart from sensitivity and specificity, receiver
operating characteristic (ROC) curves of the 8 samples (Fig. 5) were used to compare the performance
of the different methods. In the present study, PECNV was compared
to EXCAVATOR using ROC curves in the 8 TNBC samples. However, PECNV
was not compared with ExomeCNV as ExomeCNV does not provide the
possibility of calling CNVs, which are required to generate the ROC
curve. As shown in Fig. 5, the ROC
curves of PECNV were above EXCAVATOR in all 8 samples, which
indicate that PECNV has better performance compared with EXCAVATOR.
Additionally, the area under the curve (AUC) was calculated to
compare the results. The mean AUC of the 8 samples obtained by
PECNV was 0.96, while the value for EXCAVATOR was 0.62, which
suggested that PECNV has a higher detection power.
Comparison of copy number accuracy in
real tumor datasets
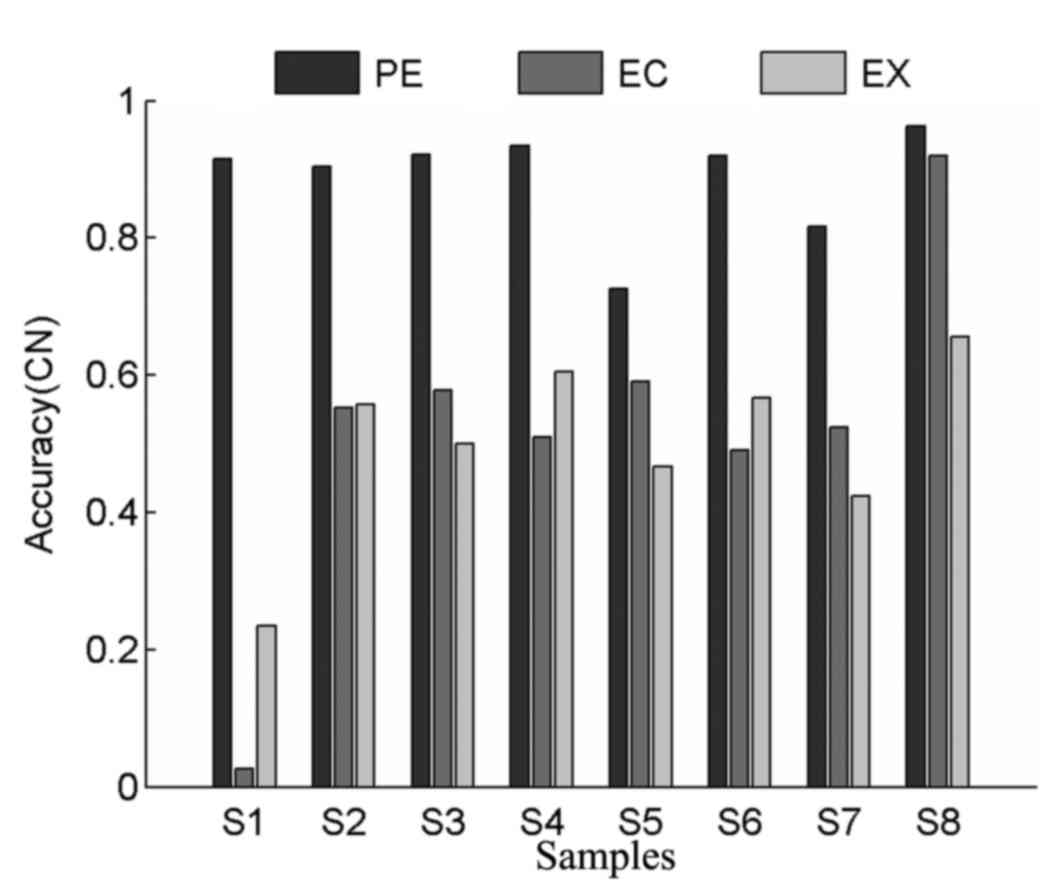
In order to comprehensively evaluate the
performance of different methods, values for copy number accuracy
were also calculated for all tumor samples. As shown in Fig. 6, ExomeCNV exhibited higher accuracy
compared with EXCAVATOR in 4 tumor samples, which indicates its
power in detecting CNVs. PECNV achieved higher levels of accuracy
in all tumor samples compared with ExomeCNV and EXCAVATOR, with
average copy number accuracy values of 0.89, 0.52 and 0.50 for
PECNV, ExomeCNV and EXCAVATOR, respectively. Overall, PECNV
demonstrated better performance in accuracy in the detection of
copy number in real WES datasets.
Comparison of LOH detection in real
tumors
In the present study, the performance of different
methods for LOH detection in exonic regions was also evaluated.
LOHs represent another type of somatic aberrations in the cancer
genome (21). However, since only
ExomeCNV is capable of detecting LOH using WES data (16,30), the
results of both PECNV and ExomeCNV obtained from all tumor samples
were compared. As shown in Table
III, the results of ExomeCNV suggested significant bias in LOH
detection with a low specificity and a high sensitivity. For
example, in tumor sample S1, the accuracy of ExomeCNV was 0.25.
| Table III.Loss of heterozygosity, sensitivity,
specificity and accuracy of PECNV and ExomeCNV. |
Table III.
Loss of heterozygosity, sensitivity,
specificity and accuracy of PECNV and ExomeCNV.
|
| PECNV | ExomeCNV |
|---|
|
|
|
|
|---|
| Sample | SEN | SPE | ACC | SEN | SPE | ACC |
|---|
| S1 | 0.94 | 0.99 | 0.98 | 0.99 | 0.05 | 0.25 |
| S2 | 0.80 | 1.00 | 0.91 | 0.98 | 0.09 | 0.47 |
| S3 | 0.99 | 0.99 | 0.99 | 0.99 | 0.12 | 0.84 |
| S4 | 1.00 | 0.98 | 0.99 | 1.00 | 0.21 | 0.73 |
| S5 | 0.80 | 0.98 | 0.90 | 0.77 | 0.69 | 0.72 |
| S6 | 0.99 | 0.99 | 0.99 | 0.99 | 0.09 | 0.72 |
| S7 | 0.92 | 0.98 | 0.95 | 0.99 | 0.06 | 0.63 |
| S8 | 0.97 | 0.99 | 0.99 | 0.99 | 0.18 | 0.50 |
On the contrary, PECNV achieved balanced
performance with satisfactory levels of sensitivity and
specificity. Notably, the levels of accuracy in all 8 samples were
markedly higher compared with ExomeCNV. In conclusion, PECNV was
able to efficiently detect LOH regions in tumor WES data.
Discussion
In the present study, a novel method, PECNV, for
accurate identification of copy number and LOH in tumor WES
datasets was described. PECNV adopts a comprehensive correction and
normalization procedure for eliminating batch effect and mapping
bias confronted in exome sequencing. Additionally, PECNV is able to
reduce the side effects of batch effect and mapping bias by
automatically estimating and correcting tumor impurity and signal
baseline shift, which enables an improved performance compared over
other existing methods. Compared with EXCAVATOR and ExomeCNV, which
dismisses BAF signals or take separate analysis of Log Ratio and
BAF signals, PECNV simultaneously combines Log Ratio and BAF
signals in modeling and parameters estimation, which results in an
increased ability to detect CNVs and LOH.
However, the PECNV method has several limitations.
Although PECNV is able to accurately infer tumor impurity up to
80%, it may fail as tumor impurity continues to rise. In such case,
both Log Ratio and BAF signals become extremely attenuated and
amplification or deletion regions are hard to be distinguished from
normal regions. As a result, PECNV may have difficulty in detecting
somatic aberrations.
Another limitation is related to tumor
heterogeneity. The underlying assumption adopted in PECNV is that
only one type of aberration is allowed in each exonic region. In
practice, the hypothesis may be rejected in the presence of
heterogeneity. For example, Oesper et al (31) reported in tumor progression that
multiple tumor subclones may appear in somatic cells. Therefore,
detection of CNVs in heterogeneous samples is challenging.
Currently, few methods have been developed to identify CNVs in
heterogeneous tumor samples with WES sequencing. Sophisticated
computational methods and in-depth biological analysis are required
to address this issue (28,32). PECNV and other previous studies may
help towards solving this challenging task.
Acknowledgements
The manuscript was prepared using a limited access
dataset obtained from the British Columbia Cancer Agency Branch
(BCCA) and does not necessarily reflect the views or opinions of
the BCCA. The present study was supported by the National Natural
Science Foundation of China (grant nos. 61571414, 61471331 and
31100955).
Glossary
Abbreviations
Abbreviations:
|
WES
|
whole exome sequence
|
|
BAF
|
B allele frequency
|
|
EM
|
expectation maximization
|
|
CNV
|
copy number variants
|
|
LOH
|
loss of heterozygosity
|
|
array-CGH
|
microarray comparative genomic
hybridization
|
|
SNP
|
single nucleotide polymorphism
|
|
NGS
|
next-generation sequencing
|
|
WGS
|
whole-genome sequencing
|
|
PCA
|
principal component analysis
|
|
HMM
|
hidden Markov model
|
|
TNBC
|
primary triple-negative breast
cancer
|
References
|
1
|
Albertson DG, Collins C, McCormick F and
Gray JW: Chromosome aberrations in solid tumors. Nat Genet.
34:369–376. 2003. View
Article : Google Scholar : PubMed/NCBI
|
|
2
|
Weir BA, Woo MS, Getz G, Perner S, Ding L,
Beroukhim R, Lin WM, Province MA, Kraja A, Johnson LA, et al:
Characterizing the cancer ge-nome in lung adenocarcinoma. Nature.
450:893–898. 2007. View Article : Google Scholar : PubMed/NCBI
|
|
3
|
Carén H, Kryh H, Nethander M, Sjöberg RM,
Träger C, Nilsson S, Abrahamsson J, Kogner P and Martinsson T:
High-risk neuroblastoma tumors with 11q-deletion display a poor
prognostic, chromosome instabil-ity phenotype with later onset.
Proc Natl Acad Sci USA. 107:4323–4328. 2010. View Article : Google Scholar : PubMed/NCBI
|
|
4
|
Solinas-Toldo S, Lampel S, Stilgenbauer S,
Nickolenko J, Benner A, Döhner H, Cremer T and Lichter P:
Matrix-based comparative genomic hybridization: Biochips to screen
for genomic imbalances. Genes Chromosomes Cancer. 20:399–407. 1997.
View Article : Google Scholar : PubMed/NCBI
|
|
5
|
Park PJ: Experimental design and data
analysis for array comparative genomic hybridization. Cancer
Invest. 26:923–928. 2008. View Article : Google Scholar : PubMed/NCBI
|
|
6
|
McCarroll SA, Kuruvilla FG, Korn JM,
Cawley S, Nemesh J, Wysoker A, Shapero MH, de Bakker PI, Maller JB,
Kirby A, et al: Integrated detection and population-genetic
analysis of SNPs and copy number variation. Nat Genet.
40:1166–1174. 2008. View
Article : Google Scholar : PubMed/NCBI
|
|
7
|
Peiffer DA, Le JM, Steemers FJ, Chang W,
Jenniges T, Garcia F, Haden K, Li J, Shaw CA, Belmont J, et al:
High-resolution genomic profiling of chromosomal aberrations using
Infinium whole-genome genotyping. Genome Res. 16:1136–1148. 2006.
View Article : Google Scholar : PubMed/NCBI
|
|
8
|
Metzker ML: Sequencing technologies-the
next generation. Nat Rev Genet. 11:31–46. 2010. View Article : Google Scholar : PubMed/NCBI
|
|
9
|
Morozova O and Marra MA: Applications of
next-generation sequencing technologies in functional genomics.
Genomics. 92:255–264. 2008. View Article : Google Scholar : PubMed/NCBI
|
|
10
|
Wheeler DA, Srinivasan M, Egholm M, Shen
Y, Chen L, McGuire A, He W, Chen YJ, Makhijani V, Roth GT, et al:
The complete genome of an individual by massively parallel DNA
sequencing. Nature. 452:872–876. 2008. View Article : Google Scholar : PubMed/NCBI
|
|
11
|
Teer JK and Mullikin JC: Exome sequencing:
The sweet spot before whole genomes. Hum Mol Genet. 19:R145–R151.
2010. View Article : Google Scholar : PubMed/NCBI
|
|
12
|
Clark MJ, Chen R, Lam HY, Karczewski KJ,
Chen R, Euskirchen G, Butte AJ and Snyder M: Performance comparison
of exome DNA sequencing technologies. Nat Biotechnol. 29:908–914.
2011. View Article : Google Scholar : PubMed/NCBI
|
|
13
|
Ng SB, Turner EH, Robertson PD, Flygare
SD, Bigham AW, Lee C, Shaffer T, Wong M, Bhattacharjee A, Eichler
EE, et al: Targeted capture and massively parallel sequencing of 12
human exomes. Nature. 461:272–276. 2009. View Article : Google Scholar : PubMed/NCBI
|
|
14
|
Reese SE, Archer KJ, Therneau TM, Atkinson
EJ, Vachon CM, de Andrade M, Kocher JP and Eckel-Passow JE: A new
statistic for identifying batch effects in high-throughput genomic
data that uses guided principal component analysis. Bioinformatics.
29:2877–2883. 2013. View Article : Google Scholar : PubMed/NCBI
|
|
15
|
Karakoc E, Alkan C, O'Roak BJ, Dennis MY,
Vives L, Mark K, Rieder MJ, Nickerson DA and Eichler EE: Detection
of structural variants and indels within exome data. Nat Methods.
9:176–178. 2012. View Article : Google Scholar
|
|
16
|
Sathirapongsasuti JF, Lee H, Horst BA,
Brunner G, Cochran AJ, Binder S, Quackenbush J and Nelson SF: Exome
sequencing-based copy-number variation and loss of heterozygosity
detection: ExomeCNV. Bioinformatics. 27:2648–2654. 2011. View Article : Google Scholar : PubMed/NCBI
|
|
17
|
Krumm N, Sudman PH, Ko A, O'Roak BJ, Malig
M, Coe BP; NHLBI Exome Sequencing Project, ; Quinlan AR, Nickerson
DA and Eichler EE: Copy number variation detection and genotyping
from exome sequence data. Genome Res. 22:1525–1532. 2012.
View Article : Google Scholar : PubMed/NCBI
|
|
18
|
Fromer M, Moran JL, Chambert K, Banks E,
Bergen SE, Ruderfer DM, Handsaker RE, McCarroll SA, O'Donovan MC,
Owen MJ, et al: Discovery and statistical genotyping of copy-number
variation from whole-exome sequencing depth. Am J Hum Genet.
91:597–607. 2012. View Article : Google Scholar : PubMed/NCBI
|
|
19
|
Backenroth D, Homsy J, Murillo LR,
Glessner J, Lin E, Brueckner M, Lifton R, Goldmuntz E, Chung WK and
Shen Y: CANOES: Detecting rare copy number variants from whole
exome sequencing data. Nucleic Acids Res. 42:e972014. View Article : Google Scholar : PubMed/NCBI
|
|
20
|
Magi A, Tattini L, Cifola I, D'Aurizio R,
Benelli M, Mangano E, Battaglia C, Bonora E, Kurg A, Seri M, et al:
EXCAVATOR: Detecting copy number variants from whole-exome
sequencing data. Genome Biol. 14:R1202013. View Article : Google Scholar : PubMed/NCBI
|
|
21
|
Li A, Liu Z, Lezon-Geyda K, Sarkar S,
Lannin D, Schulz V, Krop I, Winer E, Harris L and Tuck D: GPHMM: An
integrated hidden Markov model for identification of copy number
alteration and loss of heterozygosity in complex tumor samples
using whole genome SNP arrays. Nucleic Acids Res. 39:4928–4941.
2011. View Article : Google Scholar : PubMed/NCBI
|
|
22
|
Li H, Handsaker B, Wysoker A, Fennell T,
Ruan J, Homer N, Marth G, Abecasis G and Durbin R; 1000 Genome
Project Data Processing Subgroup, : The sequence alignment/map
format and SAMtools. Bioinformatics. 25:2078–2079. 2009. View Article : Google Scholar : PubMed/NCBI
|
|
23
|
Yoon S, Xuan Z, Makarov V, Ye K and Sebat
J: Sensitive and accurate detection of copy number variants using
read depth of coverage. Genome Res. 19:1586–1592. 2009. View Article : Google Scholar : PubMed/NCBI
|
|
24
|
Mortazavi A, Williams BA, McCue K,
Schaeffer L and Wold B: Mapping and quantifying mammalian
transcriptomes by RNA-Seq. Nat Methods. 5:621–628. 2008. View Article : Google Scholar : PubMed/NCBI
|
|
25
|
Bilmes JA: A gentle tutorial of the EM
algorithm and its-application to parameter estimation for Gaussian
mixture and hidden Markov models. Int Comput Sci Inst.
4:1261998.
|
|
26
|
Olshen AB, Venkatraman ES, Lucito R and
Wigler M: Circular binary segmentation for the analysis of
array-based DNA copy number data. Biostatistics. 5:557–572. 2004.
View Article : Google Scholar : PubMed/NCBI
|
|
27
|
Møller MF: A scaled conjugate gradient
algorithm for fast supervised learning. Neural Net. 6:525–533.
1993. View Article : Google Scholar
|
|
28
|
Yu Z, Liu Y, Shen Y, Wang M and Li A:
CLImAT: Accurate detection of copy number alteration and loss of
heterozygosity in impure and aneuploid tumor samples using
whole-genome sequencing data. Bioinformatics. 30:2576–2583. 2014.
View Article : Google Scholar : PubMed/NCBI
|
|
29
|
Shah SP, Roth A, Goya R, Oloumi A, Ha G,
Zhao Y, Turashvili G, Ding J, Tse K, Haffari G, et al: The clonal
and mutational evolution spectrum of primary triple-negative breast
cancers. Nature. 486:395–399. 2012. View Article : Google Scholar : PubMed/NCBI
|
|
30
|
Van Loo P, Nordgard SH, Lingjærde OC,
Russnes HG, Rye IH, Sun W, Weigman VJ, Marynen P, Zetterberg A,
Naume B, et al: Allele-specific copy number analysis of tumors.
Proc Natl Acad Sci USA. 107:16910–16915. 2010. View Article : Google Scholar : PubMed/NCBI
|
|
31
|
Oesper L, Mahmoody A and Raphael BJ:
THetA: Inferring intra-tumor heterogeneity from high-throughput DNA
sequencing data. Genome Biol. 14:R802013. View Article : Google Scholar : PubMed/NCBI
|
|
32
|
Tan R, Wang Y, Kleinstein SE, Liu Y, Zhu
X, Guo H, Jiang Q, Allen AS and Zhu M: An evaluation of copy number
variation detection tools from whole-exome sequencing data. Hum
Mutat. 35:899–907. 2014. View Article : Google Scholar : PubMed/NCBI
|