Introduction
Liver cancer is a hepatic malignant tumor, which
seriously endangers health. As its morbidity is on the increase
annually, liver cancer has become a difficult problem to solve
(1). In recent years, the therapeutic
effect of liver cancer has been greatly improved along with the
improvement in treatment methods and the application of numerous
drugs (2). However, there is still no
effective way to cure liver cancer due to multidrug resistance
thereof.
Multidrug resistance refers to the resistance of
tumor cells to various antitumor drugs (3). The molecular mechanism of tumor cell
multidrug resistance is very complex. Therefore, in-depth research
to solve this problem is imperative (4). P-glycoprotein (P-gp), the expression
product of multidrug resistance gene 1 (MDR1), has
ATP-dependent transmembrane transport activity, which can transport
drugs to cells and induce drug resistance (5). Nuclear factor-κB (NF-κB), participates
in information transmission in defense response, tissue damage and
stress, cell differentiation, apoptosis, and tumor growth
inhibition (6).
In the present study, the molecular mechanism of
drug resistance in liver cancer was explored by establishing HepG-2
and HepG-2/ADM cell lines and applying immunofluorescence, reverse
transcription-polymerase chain reaction (RT-qPCR) and western blot
analysis to study the association between NF-κB expression and
liver cancer resistance, in order to provide experimental evidence
for the prevention and treatment of liver cancer.
Materials and methods
Cell lines
The HepG-2 and drug-resistant HepG2/ADM cell lines
were purchased from the American Type Culture Collection (ATCC),
and Guangzhou Dahui Biotechnology Co., Ltd. (Guangzhou, China).
Main reagents
Dulbecco's modified Eagle's medium (DMEM) (Gibco,
Carlsbad, CA, USA); fetal bovine serum (FBS) (Gibco); trypsin
(Gibco); phosphate-buffered saline (PBS) (HyClone, Logan, UT, USA)
bicinchoninic acid (BCA) protein assay kit (Beyotime Co., Shanghai,
China); TRIzol total RNA extraction kit (Tiangen Biotech Co., Ltd.,
Beijing, China); RT-PCR kit (Tiangen Biotech Co., Ltd.); rabbit
anti-human GAPDH, NF-κB and MDR1 monoclonal antibodies, goat
anti-rabbit secondary HRP and fluorescence secondary polyclonal
antibodies (cat. nos. 2118, 4764, 13342, 7074, 4412, respectively;
Cell Signaling Technology, Inc.; Danvers, MA, USA). The study was
approved by the Ethics Committee of The Sixth People's Hospital of
Qingdao (Qingdao, China).
Cell culture
HepG-2 and HepG2/ADM cells were cultured in DMEM
containing 10% FBS in a constant temperature incubator with 5%
CO2 at 37°C. The culture medium was changed every 2
days. The cells were placed onto a 6-well plate in good condition
for white light images and immunofluorescence staining, and mRNA
and protein were extracted, respectively, for RT-PCR and western
blot analysis.
Immunofluorescence staining
HepG-2 and HepG2/ADM cells were, respectively,
inoculated into a 6-well plate at a density of 1×10⁵/ml
with 1 ml in each well. The cells were then cultured for 24 h, at
37°C and collected. Cell culture fluid was taken, and the cells
were washed by PBS, fixed by 10% formalin, sealed with 5% skim milk
and incubated for 1 h at 37°C, followed by the addition of NF-κB
and MDR1 primary antibodies (1:100) for incubation at 4°C
overnight. The next day, the cells were cleaned with PBS 3 times,
followed by the addition of fluorescent secondary antibody (1:500)
for incubation at 37°C for 1 h. Fluorescence microscopy (Olympus
Corporation; Tokyo, Japan) was used to observe the expression of
protein.
RT-qPCR
HepG-2 and HepG2/ADM cells were, respectively,
inoculated into 6-well plates at a density of 1×10⁵/ml
with 1 ml in each well. After 24 h, the two kinds of cellular RNA
were extracted according to instructions of the RNAiso Plus kit.
The cells were rapidly transferred into 1 ml TRIzol reagent, and
extracted according to the protocol of the RNAiso Plus kit, and
centrifuged for 5 min at 12,000 × g, at 4°C. The supernatant was
carefully removed and added with 100 µl chloroform, mixed evenly,
placed for 5 min at room temperature, and centrifuged at 12,000 × g
and 4°C for 5 min. The supernatant was removed carefully. Then the
supernatant was added with the same volume of isopropanol, placed
at room temperature for 10 min and centrifuged at 12,000 × g, at
4°C for 10 min. The precipitation was washed with 75% ethanol.
Finally, RNase-free water was added to completely dissolve it. The
ratio of OD260/OD280 and the concentration of
RNA were measured. The purity and content of the extracted RNA
samples were calculated. Then the samples were sub-packaged and
stored at −80°C for subsequent experiment. According to the ratio
of the PrimeScript® RT reagent kit with cDNA Eraser kit,
the reverse transcriptase solution was prepared, and the RNA
samples were added for reverse transcription to obtain cDNA. The
level of mRNA was measured according to the SYBR® Premix
Ex Taq™ II (Tli RNase H Plus) kit. The primer sequences of the
corresponding RNA are shown in Table
I. The cycle threshold (Cq) value was analyzed using the
2−ΔΔCq method (7).
 | Table I.Primer sequences of related genes in
RT-qPCR. |
Table I.
Primer sequences of related genes in
RT-qPCR.
| Gene name | Primer sequence |
|---|
| NF-κB | F: 5′-3′
AGCACAGATACCACCAAGACC |
|
| R: 3′-5′
GGGCACGATTGTCAAAGAT |
| MDR1 | F: 5′-3′
CCCATCATTGCAATAGCAGG |
|
| R: 3′-5′
GTTCAAACTTCTGCTCCTGA |
| β-actin | F: 5′-3′
GAGCCGGGAAATCGTGCGT |
|
| R: 3′-5′
GGAAGGAAGGCTGGAAGATG |
Western blot analysis
According to the manual of the total protein
extraction kit, the cells were lysed and centrifuged at 4°C and
12,000 × g for 10 min. The supernatant was collected as the total
protein. The concentration of total protein was measured by BCA
protein assay kit, and the protein was stored at −80°C for later
use. Total protein extraction and 2X loading buffer (100 µl + 4 µl
β-mercaptoethanol) were mixed at a volume ratio of 1:1, treated
with boiling water bath for 5 min, naturally cooled and stored in
refrigerator at 4°C. The appropriate proportion of 15% SDS-PAGE
separation gel was prepared according to the molecular weight of
the target protein and frozen for approximately 1 h. Then 5%
SDS-PAGE concentrate gel was prepared and frozen for approximately
half an hour. After the electrophoretic buffer solution was added,
the denatured protein sample was added into the loading well, and
the total protein content in each well was kept the same according
to a certain protein concentration.
Electrophoresis was performed under a constant
pressure of 220 V until the bromophenol blue reached the bottom of
the gel. According to the molecular weight of target protein, the
gel, a layer of PVDF membrane and six layers of filter paper were
cut according to the size of the gel. PVDF membrane and the filter
paper were immersed into methanol for 10 sec and transferred into
the transfer buffer. Then the positive pole-three layers of filter
paper-PVDF membrane-gel-three layers of filter paper-negative order
were placed on the membrane transfer instrument. Edge alignment
needs attention to prevent blistering. After the membrane transfer
under constant pressure of 110 V for 2 h, the membrane attached
with protein was blocked using 5% milk for 3 h, the closed membrane
was washed with TTBS for 5 min, and incubated with the
corresponding proportion of the primary NF-κB, MDR1 and GAPDH
antibodies (1:500) at 4°C overnight. The PVDF membrane was washed
with TTBS for 5 min, and then incubated with the corresponding
secondary goat anti-rabbit secondary HRP polyclonal antibody
(1:1,000) at room temperature for 3 h. The membrane was washed
again with TTBS (3 times, 10 min each time). Gel imager was warmed
up for 30 min, the A, B reagents of ECL kit were evenly mixed at
the 1:1 ratio volume and were dropwise added to the PVDF membrane,
followed by color development in the dark for 1 min. The excess
liquid was dried with the filter and the membrane was placed into
the gel imager, followed by photography under dynamic integration
model and observation. Lab Works 4.6 professional image analysis
software (Lab-works Architecture; Wellington, New Zealand) was used
to analyze the image.
Statistical analysis
The experimental data were expressed by mean ±
standard deviation (mean ± SD), and the experimental results were
analyzed by Statistical Product and Service Solutions (SPSS) 17.0
statistical software. The means between the two groups were
compared by t-test. One-way ANOVA was used for the comparison of
means among groups and the post hoc test was SNK test. P-test was
used for pairwise comparison. P<0.05 was considered to indicate
a statistically significant difference.
Results
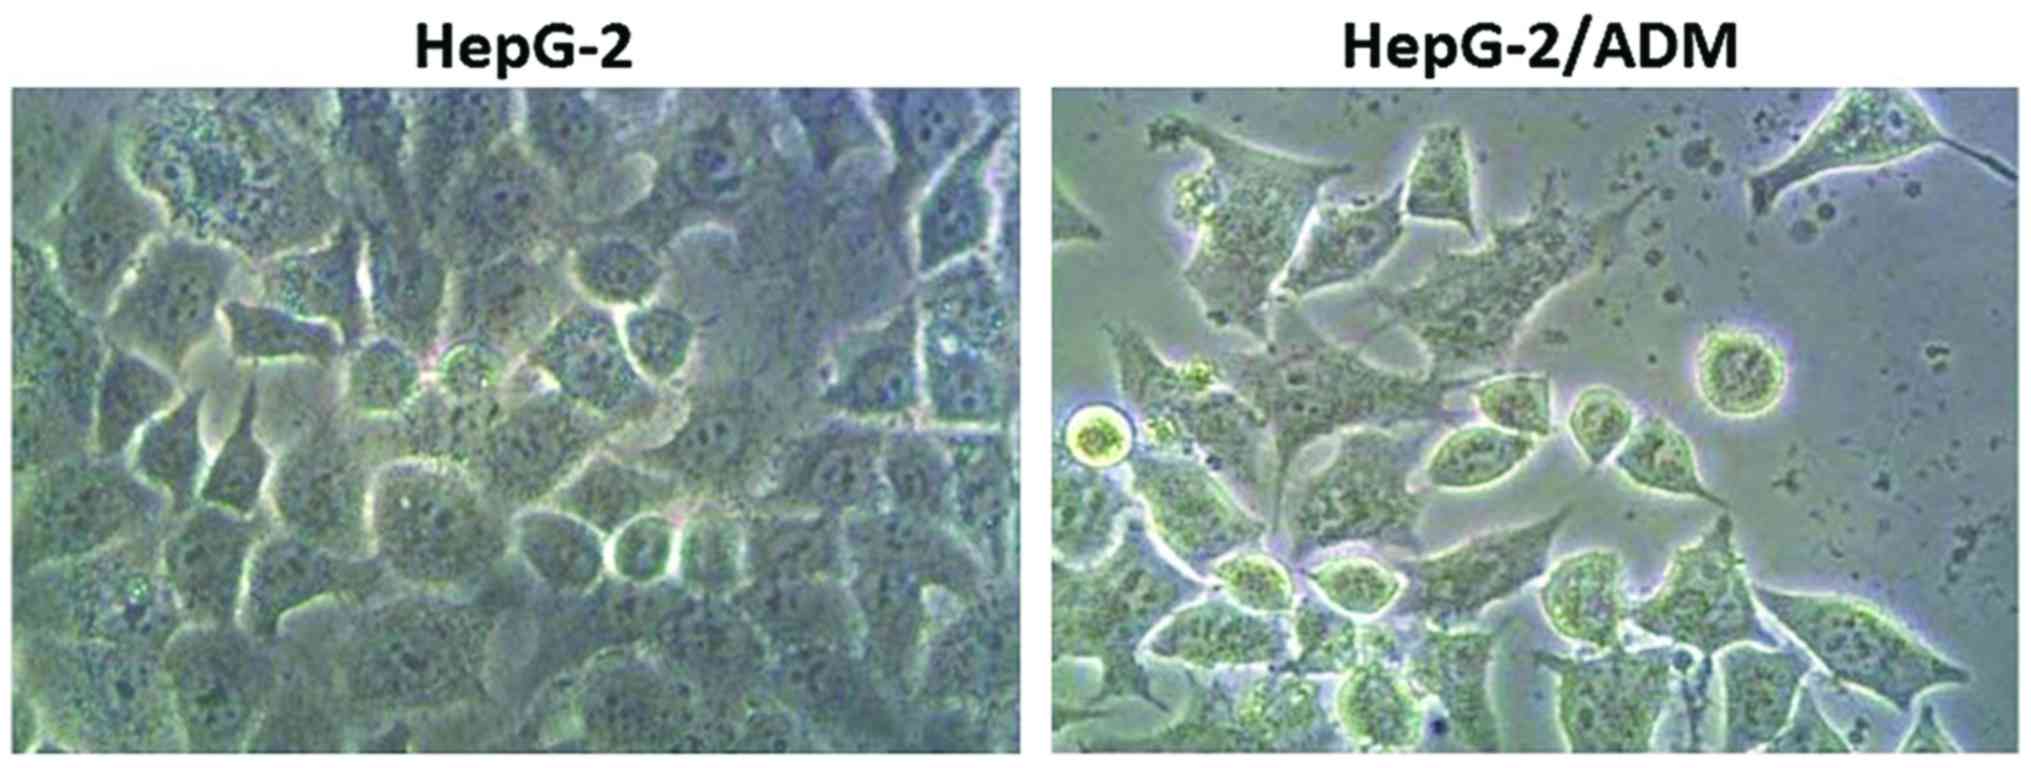
Cell white images
HepG-2 and HepG2/ADM cells were inoculated in 6-well
plates, respectively. When the cells adhered well, cells in the two
groups were observed via white images, and they were normal in
morphology and could be used for the experiment. As shown in
Fig. 1, the structures of HepG-2 and
HepG2/ADM cells were complete and the cell morphology was normal,
and there were no significant differences, and could be used for
comparative study.
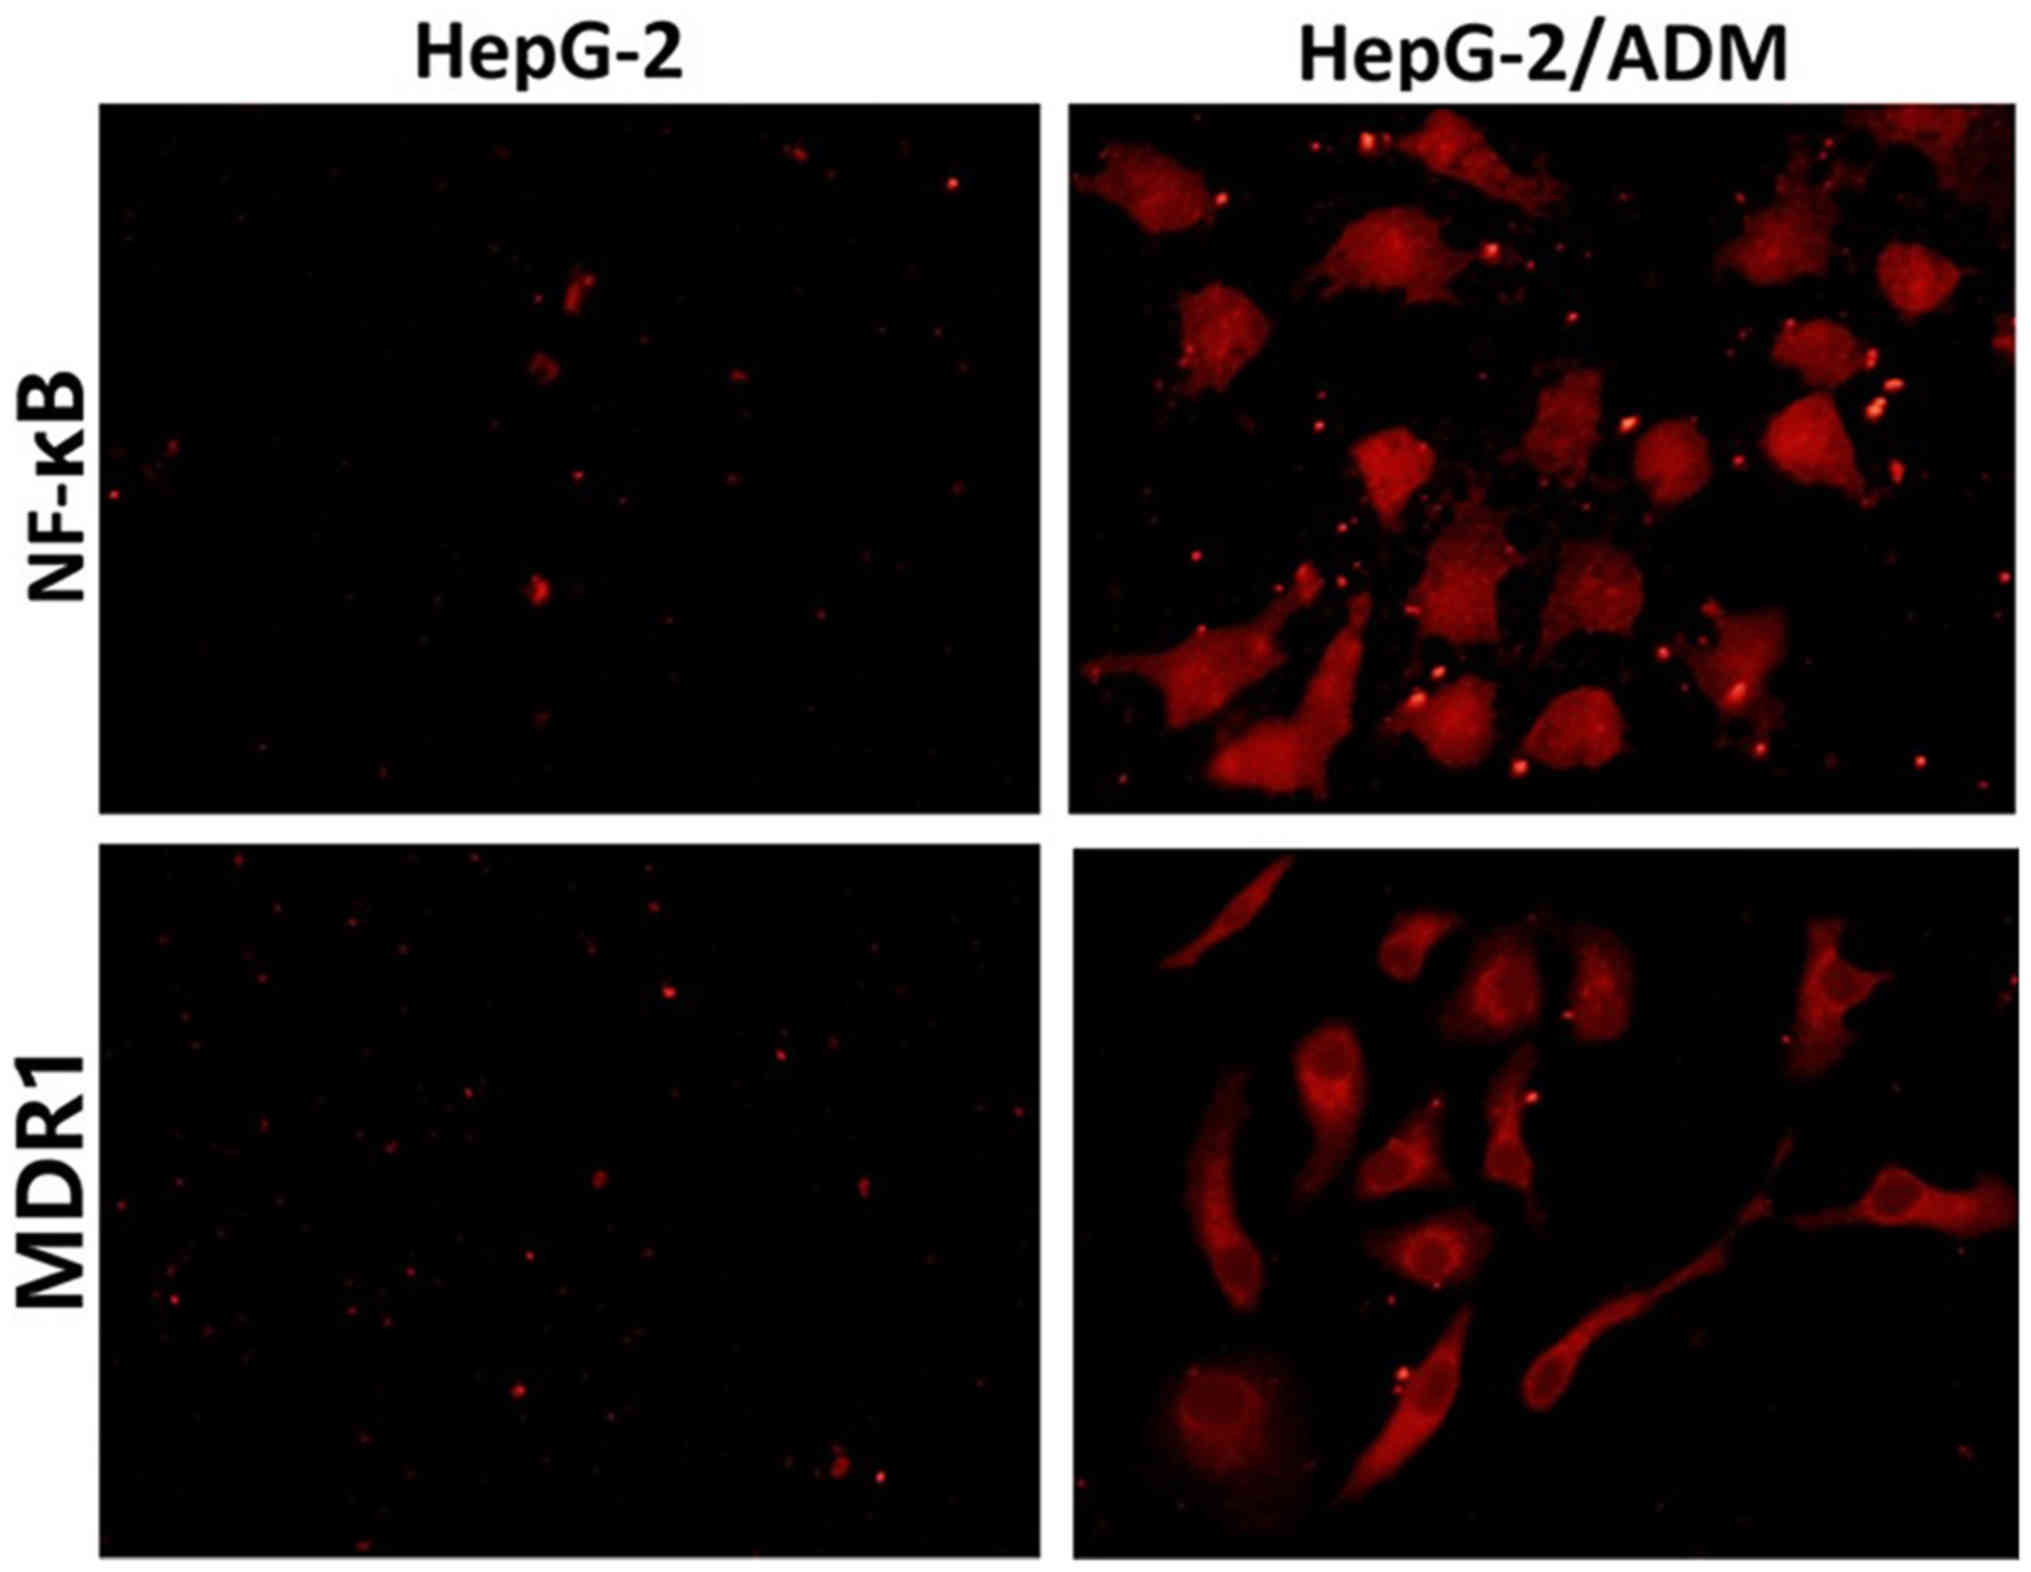
Results of immunofluorescence
staining
NF-κB and MDR1 immunofluorescence staining was
performed for HepG-2 and HepG2/ADM cells, respectively (Fig. 2). Immunofluorescence staining showed
that the expression levels of NF-κB and MDR1 in HepG-2 cells were
very low, but those in HepG2/ADM cells were increased
significantly. Therefore, the expression of NF-κB is closely
related to the MDR1 of liver cancer cells.
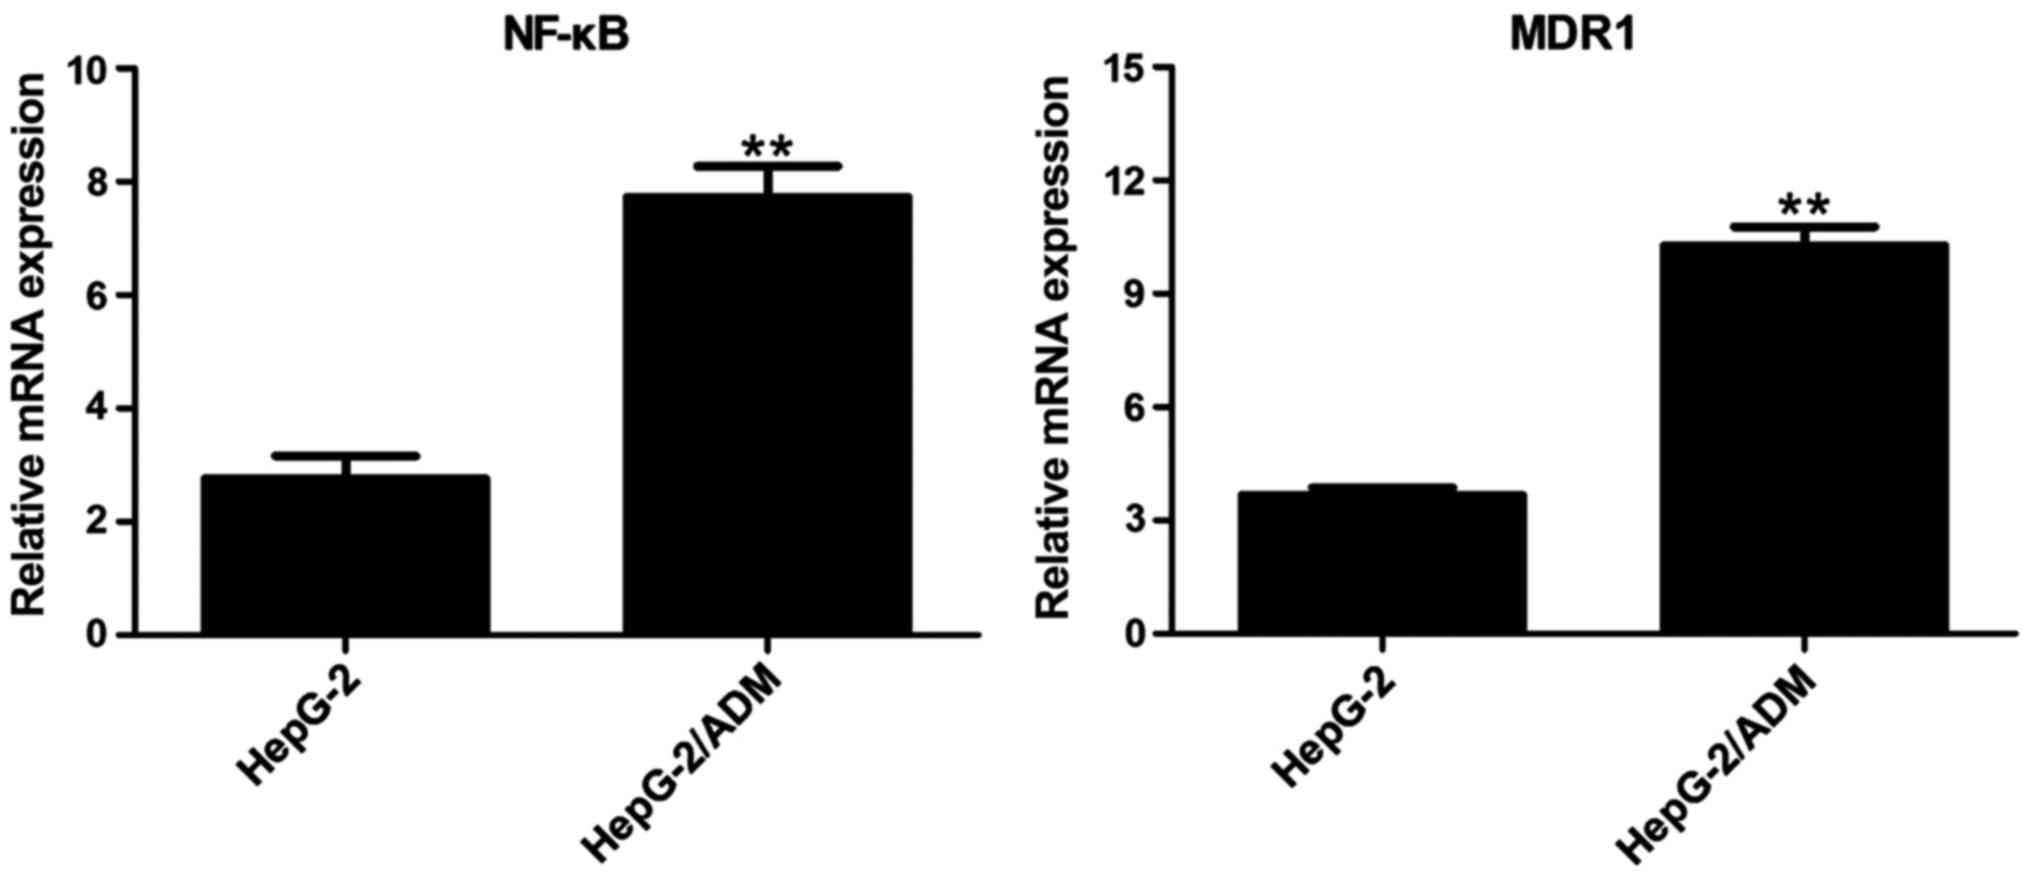
Results of RT-qPCR
The total RNA was extracted from HepG-2 and
HepG2/ADM cells. RT-qPCR showed that the expression levels of NF-κB
and MDR1 mRNA in HepG-2 cells were very low, while those in
HepG-2/ADM cells were increased significantly (Fig. 3).
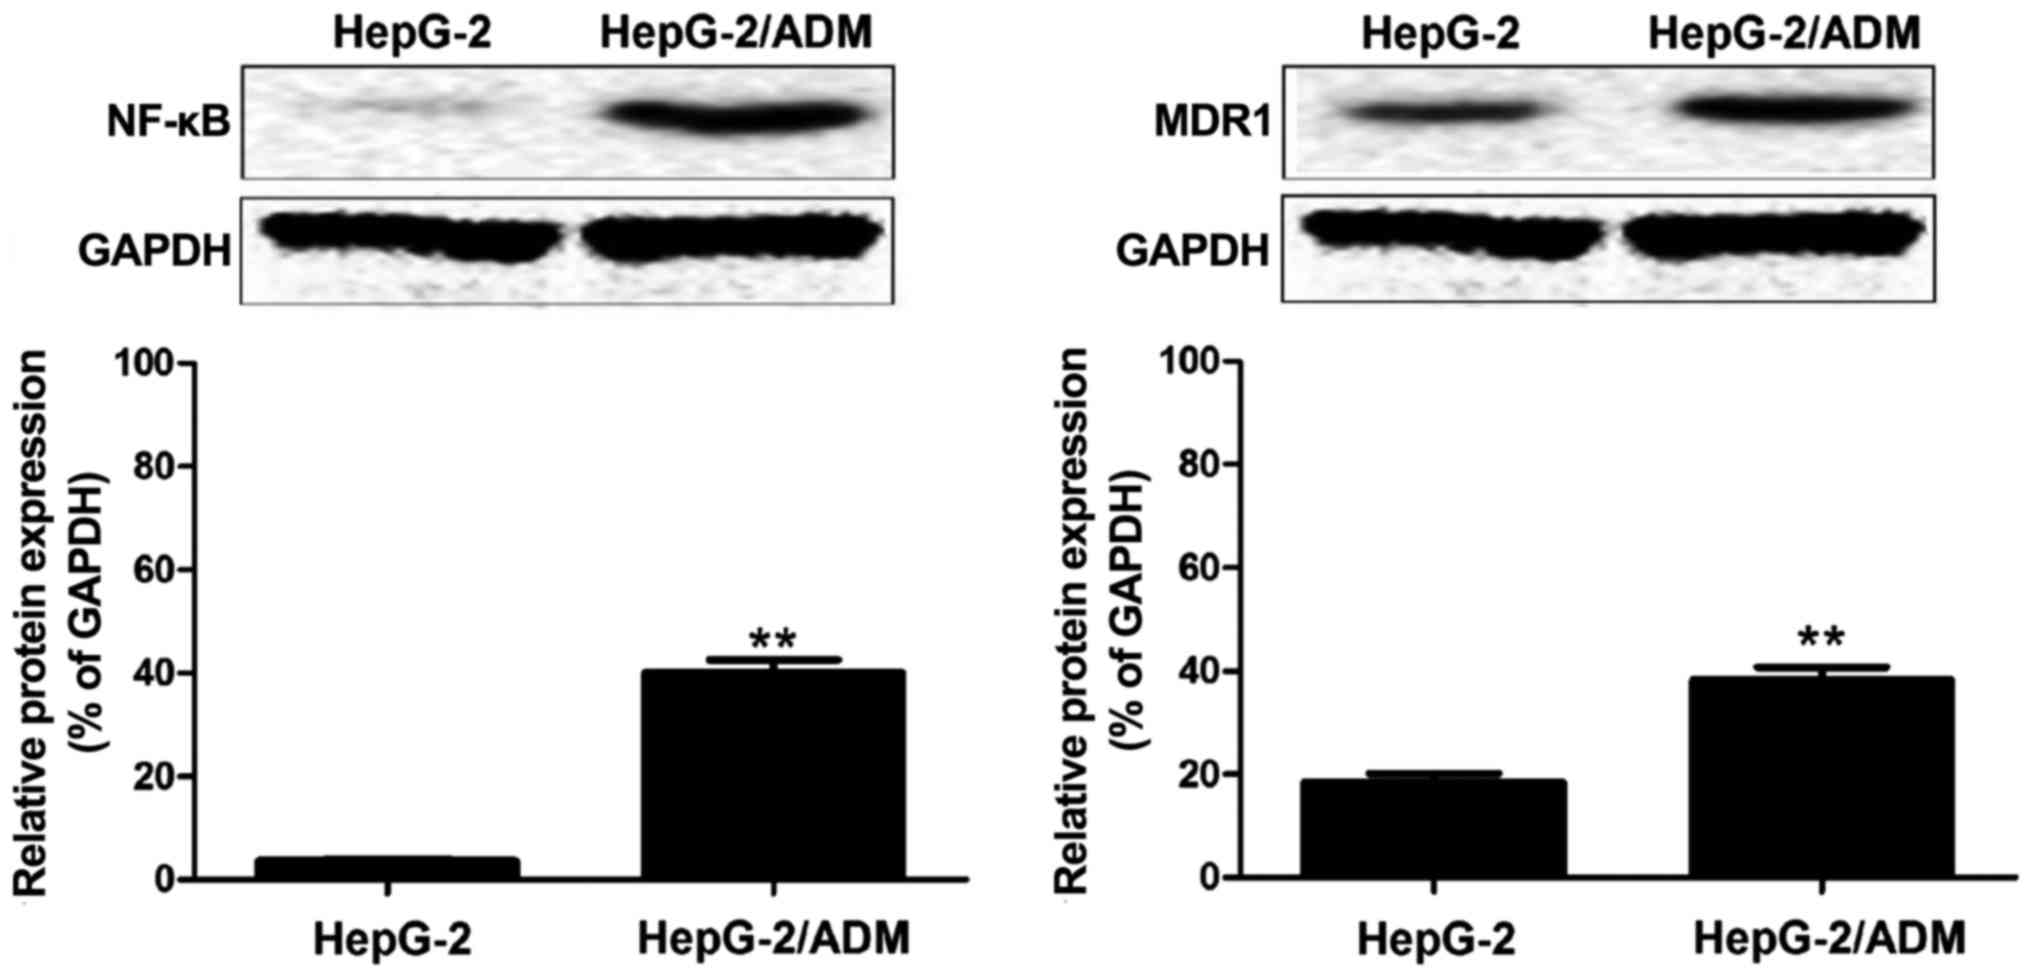
Western blot results
Western blot analysis was performed for the protein
extracted from HepG-2 and HepG2/ADM cell samples. As shown in
Fig. 4, the expression levels of
NF-κB and MDR1 protein in HepG-2 cells were very low, while those
in HepG-2/ADM cells were increased significantly. It is concluded
that the expression of NF-κB is closely related to the drug
resistance of liver cancer, and related to the drug resistance
associated protein MDR1.
Discussion
Liver cancer is the general name of two different
malignant tumors, namely primary liver cancer and metastatic liver
cancer, which seriously threatens people's health. The mortality
rate of liver cancer is high around the world, and the number of
male patients is increasing each year (8–11). In
China, primary liver cancer has developed to be a major tumor
second only to lung cancer (12).
Liver cancer is a serious threat to life. At present, there are
many therapeutic methods for liver cancer; however, no method can
be used as complete cure, which is closely related to the multidrug
resistance of liver cancer (13). In
this study, the mechanism of drug resistance of liver cancer was
studied through using liver cancer HepG-2 cells as the liver cancer
model and the HepG-2/ADM cells as the drug resistance model of
liver cancer.
The phenomenon of selecting cells against single
cytotoxic drugs may develop cross resistance to a variety of drugs
with different structures and cell targets is known as multiple
resistance (14). MDR protein (MDRS)
is a highly conserved ATP binding cassette transporter superfamily
member. MDR is a top transmembrane protein and a component of the
blood-brain barrier function, which transports various drugs as a
drug delivery pump from the brain to blood. The multidrug
resistance gene is known to be ABCB1 on the human chromosome 7
(15). The overexpression of drug
transporter protein MDR1 is the main barrier in cancer
chemotherapy. The role of MDR1 in inducing cell apoptosis has been
demonstrated (16) in several cell
lines. MDR1 is an ATP-dependent pump to pump the negatively charged
drug molecules out of the cell against a concentration gradient,
resulting in the decrease of the intracellular drug concentration,
and leading to the occurrence of drug resistance (17). Moreover, MDR1 can induce tumor drug
resistance through reducing the concentration of drugs when
reaching the target site by changing the pH value of cytoplasm and
organelles, and directly participate in metastasis (18).
NF-κB, as a nuclear transcription factor, regulates
the expression of a large number of genes, which are critical for
the regulation of cell apoptosis, viral replication, tumorigenesis,
inflammation and various autoimmune diseases (19). NF-κB can be activated by various
stimuli, including growth factors, cytokines, lymphokine,
ultraviolet, pharmaceutical activity and stress, which is
considered to be a part of stress response. In its active form,
NF-κB is isolated in the cytoplasm by the restraining of the IκB
family members (20). Various stimuli
are the main causes of the activation of phosphorylated IκB of
NF-κB, followed by its ubiquitination and subsequent degradation,
resulting in the exposure of the nuclear location signal on the
NF-κB subunit and the subsequent transfer of the molecules to the
nucleus (21).
In this study, HepG-2 cells and HepG2/ADM cells were
cultured, respectively, as the model of liver cancer and liver
cancer drug resistance. When the cells grew well in good
conditions, they were placed onto 6-well plates. The morphology and
status of two groups of cells were observed by cell white images.
As a result, the structures of HepG-2 and HepG2/ADM cells were
complete and the cell morphology was normal, and there were no
significant differences. NF-κB and MDR1 immunofluorescence staining
were performed for HepG-2 and HepG2/ADM cells, respectively. The
differences of NF-κB and MDR1 fluorescence expression levels in two
groups of cells were observed. The results of immunofluorescence
staining showed that the expression levels of NF-κB and MDR1 were
very low, while those in HepG2/ADM cells were increased
significantly. The RT-qPCR results showed that the expression
levels of NF-κB and MDR1 mRNA in HepG-2 cells were very low, while
those in HepG-2/ADM cells were significantly increased. At the same
time, western blot results showed that NF-κB and MDR1 protein
expression levels in HepG-2 cells were very low, while those in
HepG-2/ADM cells were increased significantly. Collectively, the
expression of NF-κB in the drug-resistant cells of liver cancer is
closely related to the resistance related gene MDR1. This result
may provide a new solution for the drug resistance of liver
cancer.
Acknowledgements
Not applicable.
Funding
No funding was received.
Availability of data and materials
The datasets used and/or analyzed during the current
study are available from the corresponding author on reasonable
request.
Authors' contributions
TL and RW were responsible for PCR and western blot
analysis. YZ and WC contributed to cell culture and
immunofluorescence staining. HL and TL helped with statistical
analysis. All authors read and approved the final manuscript.
Ethics approval and consent to
participate
The study was approved by the Ethics Committee of
The Sixth People's Hospital of Qingdao (Qingdao, China).
Patient consent for publication
Not applicable.
Competing interests
The authors declare that they have no competing
interests.
References
|
1
|
Gottesman MM and Pastan I: Biochemistry of
multidrug resistance mediated by the multidrug transporter. Annu
Rev Biochem. 62:385–427. 1993. View Article : Google Scholar : PubMed/NCBI
|
|
2
|
Ambudkar SV, Dey S, Hrycyna CA,
Ramachandra M, Pastan I and Gottesman MM: Biochemical, cellular,
and pharmacological aspects of the multidrug transporter. Annu Rev
Pharmacol Toxicol. 39:361–398. 1999. View Article : Google Scholar : PubMed/NCBI
|
|
3
|
Krishna R and Mayer LD: Multidrug
resistance (MDR) in cancer. Mechanisms, reversal using modulators
of MDR and the role of MDR modulators in influencing the
pharmacokinetics of anticancer drugs. Eur J Pharm Sci. 11:265–283.
2000. View Article : Google Scholar : PubMed/NCBI
|
|
4
|
Yusa K and Tsuruo T: Reversal mechanism of
multidrug resistance by verapamil: Direct binding of verapamil to
P-glycoprotein on specific sites and transport of verapamil outward
across the plasma membrane of K562/ADM cells. Cancer Res.
49:5002–5006. 1989.PubMed/NCBI
|
|
5
|
Loo TW and Clarke DM: Defining the
drug-binding site in the human multidrug resistance P-glycoprotein
using a methanethiosulfonate analog of verapamil, MTS-verapamil. J
Biol Chem. 276:14972–14979. 2001. View Article : Google Scholar : PubMed/NCBI
|
|
6
|
Chin KV, Ueda K, Pastan I and Gottesman
MM: Modulation of activity of the promoter of the human MDR1 gene
by Ras and p53. Science. 255:459–462. 1992. View Article : Google Scholar : PubMed/NCBI
|
|
7
|
Livak KJ and Schmittgen TD: Analysis of
relative geneexpression data using real time quantitative PCR and
the 2(-Delta Delta C(T)) Method. Methods. 25:402–408. 2001.
View Article : Google Scholar : PubMed/NCBI
|
|
8
|
Cornwell MM and Smith DE: SP1 activates
the MDR1 promoter through one of two distinct G-rich regions that
modulate promoter activity. J Biol Chem. 268:19505–19511.
1993.PubMed/NCBI
|
|
9
|
Zhou G and Kuo MT: NF-kappaB-mediated
induction of mdr1b expression by insulin in rat hepatoma cells. J
Biol Chem. 272:15174–15183. 1997. View Article : Google Scholar : PubMed/NCBI
|
|
10
|
Fine RL, Chambers TC and Sachs CW:
P-glycoprotein, multidrug resistance and protein kinase C. Stem
Cells. 14:47–55. 1996. View Article : Google Scholar : PubMed/NCBI
|
|
11
|
Tang XY and Zhu YQ:
Epigallocatechin-3-gallate suppressed the over-expression of HSP 70
and MDR1 induced by heat shock in SGC 7901. J Chemother.
20:355–360. 2008. View Article : Google Scholar : PubMed/NCBI
|
|
12
|
Chin KV, Tanaka S, Darlington G, Pastan I
and Gottesman MM: Heat shock and arsenite increase expression of
the multidrug resistance (MDR1) gene in human renal carcinoma
cells. J Biol Chem. 265:221–226. 1990.PubMed/NCBI
|
|
13
|
David GL, Yegnasubramanian S, Kumar A,
Marchi VL, De Marzo AM, Lin X and Nelson WG: MDR1 promoter
hypermethylation in MCF-7 human breast cancer cells: Changes in
chromatin structure induced by treatment with 5-Aza-cytidine.
Cancer Biol Ther. 3:540–548. 2004. View Article : Google Scholar : PubMed/NCBI
|
|
14
|
Yatouji S, El-Khoury V, Trentesaux C,
Trussardi-Regnier A, Benabid R, Bontems F and Dufer J: Differential
modulation of nuclear texture, histone acetylation, and MDR1 gene
expression in human drug-sensitive and -resistant OV1 cell lines.
Int J Oncol. 30:1003–1009. 2007.PubMed/NCBI
|
|
15
|
Tang PM, Chan JY, Zhang DM, Au SW, Fong
WP, Kong SK, Tsui SK, Waye MM, Mak TC and Fung KP: Pheophorbide a,
an active component in Scutellaria barbata, reverses
P-glycoprotein-mediated multidrug resistance on a human hepatoma
cell line R-HepG2. Cancer Biol Ther. 6:504–509. 2007. View Article : Google Scholar : PubMed/NCBI
|
|
16
|
Karin M and Lin A: NF-kappaB at the
crossroads of life and death. Nat Immunol. 3:221–227. 2002.
View Article : Google Scholar : PubMed/NCBI
|
|
17
|
Pahl HL: Activators and target genes of
Rel/NF-kappaB transcription factors. Oncogene. 18:6853–6866. 1999.
View Article : Google Scholar : PubMed/NCBI
|
|
18
|
Ueda K, Pastan I and Gottesman MM:
Isolation and sequence of the promoter region of the human
multidrug-resistance (P-glycoprotein) gene. J Biol Chem.
262:17432–17436. 1987.PubMed/NCBI
|
|
19
|
Israël A: The IKK complex, a central
regulator of NF-kappaB activation. Cold Spring Harb Perspect Biol.
2:a0001582010. View Article : Google Scholar : PubMed/NCBI
|
|
20
|
Aydin C, Sanlioglu AD, Bisgin A, Yoldas B,
Dertsiz L, Karacay B, Griffith TS and Sanlioglu S: NF-κB targeting
by way of IKK inhibition sensitizes lung cancer cells to adenovirus
delivery of TRAIL. BMC Cancer. 10:5842010. View Article : Google Scholar : PubMed/NCBI
|
|
21
|
Nakanishi C and Toi M: Nuclear
factor-kappaB inhibitors as sensitizers to anticancer drugs. Nat
Rev Cancer. 5:297–309. 2005. View
Article : Google Scholar : PubMed/NCBI
|