Introduction
Liver cancer is the third most common malignancy in
China, accounting for an estimated 380,000 deaths annually and
representing ~54% of liver cancer cases worldwide (1). Liver cancer is also the second most
lethal cancer due in part to the resistance to conventional
chemotherapeutic drugs and radiation therapy by a subpopulation of
tumor cells referred to as cancer stem cells (CSCs). CSCs display
distinct immunophenotypes and exhibit the capacity for unlimited
self-renewal and heterogeneous-lineage differentiation into
different cancer-cell types that comprise the tumor (2,3), making
CSCs responsible for tumor initiation, propagation, and tumor
heterogeneity. CSCs are more resistant to chemotherapy, and the
inability to eradicate CSC populations results in tumor relapse and
distant metastasis.
There are currently a significant number of anti-CSC
drugs under investigation. Salinomycin (Sal) is a polyether
ionophore antibiotic produced through fermentation by
Streptomyces albus and that is widely used to treat
coccidiosis (4). Following the report
by Gupta et al (5) that Sal
exhibits the ability to selectively deplete human breast CSCs from
tumorspheres, several other groups have demonstrated that Sal
inhibited cancer growth and induced apoptosis in different CSCs and
cancer types, including liver cancer (6–9). Although
the underlying mechanism associated with Sal acting as a
chemotherapeutic drug for liver cancer remains unclear, a previous
study revealed that Sal reduced the proportion of CD133+
cell subpopulations in the liver cancer cell line HepG2, inhibited
liver cancer cell proliferation, suppressed cell cycle progression,
and induced apoptosis by repressing intracellular Ca2+
and the Wnt/β-catenin-signaling pathway (10). However, similar to breast cancer
(11) and glioblastoma (4), phenotypic heterogeneity within CSC
subpopulations may exist in liver cancer. Identification of the
surface markers CD13, CD24, CD44, CD90, CD133, and epithelial-cell
adhesion molecule (EpCAM) (12–14) in
liver cancer cells indicates that heterogeneous LCSCs may not be
targeted by a single CSC-specific drug. Therefore, it is necessary
to eliminate LCSCs using a combinatorial treatment of Sal and
another CSC-specific drug or a drug that may induce
undifferentiated CSCs toward a more differentiated state in order
to improve the efficacy of liver cancer treatment.
Oncostatin M (OSM), a cytokine of the interleukin-6
family, is a multifunctional cellular regulator produced by
CD45+ hematopoietic cells that induces the
differentiation of hepatoblasts into hepatocytes in a distinct
OSM-receptor-specific manner. Yamashita et al (12) reported the enhanced differentiation of
EpCAM+ liver cancer cells into hepatocytes via
OSM-receptor signaling, where the OSM receptor is mainly expressed
in hepatic stem/progenitor cells and rarely detected in hepatocytes
(12). OSM was also revealed to
induce hepatic differentiation through activation of the signal
transducer and activator of transcription 3 pathway, as evidenced
by decreased levels of α-fetoprotein (AFP) and cytokeratin and
increased albumin (ALB) levels in EpCAM+ liver cancer
cells (12). Furthermore, OSM
stimulated tissue regeneration and reconstruction, prevented
hepatocyte apoptosis, and regulated lipid metabolism, thereby
rendering it potentially useful in preventing or treating liver
injury (15). In fact, OSM alleviated
liver injury in mice by inducing the differentiation of bone marrow
mesenchymal stem cells into liver cells (16,17). Sal
and OSM have each demonstrated anti-CSC effects in different ways;
however, to the best of our knowledge, the synergistic effects of
OSM and Sal have not been previously investigated. To address this
issue, we examined the anticancer effects of OSM combined with Sal
on CD133+ LCSCs. Our results demonstrated the enhanced
anticancer effects of the combined treatment as evidenced by
increased apoptosis, reduced proliferation, and enhanced
differentiation of LCSCs when compared with results observed from
treatment with Sal or OSM alone.
Materials and methods
Cell line and culture
HepG2 human liver cancer cells were purchased from
the Cell Bank of the Chinese Academy of Sciences (Shanghai, China)
and were cultured in high-glucose Dulbecco's modified Eagle medium
(DMEM; Gibco; Thermo Fisher Scientific, Inc., Waltham, MA, USA)
supplemented with 10% fetal bovine serum (FBS; Gibco; Thermo Fisher
Scientific, Inc.) at 37°C and 5% CO2.
Magnetic-activated cell sorting
Briefly, HepG2 cells were harvested and incubated
with the anti-CD133 monoclonal antibody conjugated to biotin
(Miltenyi Biotec, Inc., Auburn, CA, USA) for 10 min at 4°C,
followed by fractionation using a CELLection Biotin Binder kit
(Invitrogen; Thermo Fisher Scientific, Inc.) according to the
manufacturer's instructions. The sorted CD133+ HepG2
cells were cultured in DMEM/F12 (Gibco; Thermo Fisher Scientific,
Inc.) supplemented with 20 ng/ml epidermal growth factor (EGF) and
20 ng/ml basic fibroblast growth factor (bFGF; both from PeproTech,
Inc., Rocky Hill, NJ, USA), and 2% B27 (Gibco; Thermo Fisher
Scientific, Inc.) at 37°C and 5% CO2.
Tumorsphere-formation assay
Briefly, the sorted CD133+ HepG2 cells
were cultured in serum-free DMEM/F12 medium supplemented with 20
ng/ml EGF, 20 ng/ml bFGF, and 2% B27. Cells were then seeded on
uncoated 6-well culture plates (Corning, Inc., Corning, NY, USA) at
a density of 1×10⁴ cells/well, with fresh medium added
every 3 days (18). Tumorsphere
formation was observed and images were captured using an inverted
light microscope (Olympus Corporation, Tokyo, Japan).
Analysis of serum-induced
differentiation
Cells were resuspended and incubated in DMEM/F12
supplemented with 10% FBS at 37°C and 5% CO2. Images of
the cells were acquired using an inverted light microscope (Olympus
Corporation).
Soft-agar colony formation assay
The 0.5% liquid soft agar was prepared by mixing 5%
agar in phosphate-buffered saline (PBS) with culture medium (37°C),
followed by transfer to a 6-well plate (1.5 ml/well) for
solidification at room temperature. Subsequently, the cells mixed
with 0.3% liquid agar were seeded in the solidified agar-based
6-well plate at 100 cells/well and cultured for 21 days at 37°C and
5% CO2. Images were acquired every 3 days using an
optical light microscope (Olympus Corporation).
Flow cytometric detection of
cell-surface markers
HepG2 cells and LCSCs were dissociated into single
cells, and LCSCs were prepared at a concentration of
2.0×10⁵ cells in 0.1 ml of PBS. The fluorescein
isothiocyanate (FITC)-conjugated anti-CD133 antibody (1: 20; cat.
no. 11-1339-42; Invitrogen; Thermo Fisher Scientific, Inc.) was
added to the cell suspension, which was subsequently incubated in
the dark for 30 min at 4°C. After two washes in PBS, the cells were
acquired and analyzed by a flow cytometer (Beckman Coulter, Brea,
CA, USA) in order to quantify the number of CD133+
cells.
Cell Counting Kit-8 (CCK-8) assay
First, LSCSs (1×10⁵/well) were seeded in
each well of a 96-well plate, with 100 µl of medium in each well.
Following incubation for 24 h, OSM was added at different
concentrations (0, 1, 10 and 100 ng/ml). Triplicate samples were
developed for each concentration. Cell viability was assessed at
48, 96 and 144 h using a CCK-8 kit (Beyotime Institute of
Technology, Haimen, China) according to the manufacturer's
instructions. LSCSs (1×10⁵ cells/well) were also seeded
in 96-well plates for 24 h and treated with a series of
concentrations of Sal (0, 1, 2, 5, 10, 15, 20 and 25 µM) in
triplicate per concentration. After incubation for 24, 48 and 72 h,
cell viability was detected using a CCK-8 kit.
Subsequently, the cytotoxicity of OSM, Sal, and OSM
+ Sal was measured via CCK-8 assay. Briefly, LCSCs
(1×10⁵ cells/well) were seeded in a 96-well plate
containing 100 µl of medium in each well and treated with OSM (10
ng/ml), followed by Sal (1 µM) 3 days later. The total culture time
was 6 days. Cells treated with 1 µg/ml 5-fluorouracil (5-FU) served
as positive controls, and culture medium was used as a negative
control. Cell viability was determined by CCK-8 assay. Samples were
processed in triplicate. Absorbance was measured at 450 nm using a
Multiskan GO microplate reader (Thermo Fisher Scientific, Inc.).
Cell viability was determined and the inhibition ratio was
calculated using the following formula: Inhibition ratio
(%)=(1-optical density of the treatment group/optical density of
the solvent control) ×100.
Detection of apoptosis by Annexin
V-FITC/propidium iodide (PI) staining
Apoptotic cells were detected using an Annexin
V/PI-FITC kit (Nanjing KeyGen Biotech Co., Ltd., Nanjing, China)
according to the manufacturer's instructions. Briefly, cells were
seeded in a 6-well plate (1×10⁶ cells/well) and
incubated with 10 ng/ml OSM, 1 µM Sal, or both (10 ng/ml OSM + 1 µM
Sal) for 6 days at 37°C and 5% CO2, with 1 µg/ml 5-FU
and culture medium used as positive and negative controls,
respectively. After washing with PBS, cells (5×10⁵) were
resuspended in binding buffer (500 µl) and stained with Annexin
V-FITC (5 µl) and PI (5 µl) in the dark at room temperature for 5
min before analysis on a flow cytometer within 1 h. The experiment
was repeated three times.
JC-1 assay
Mitochondrial membrane potential was detected by
JC-1 staining assay using a kit (Nanjing KeyGen Biotech Co., Ltd.).
Briefly, cells were seeded in a 6-well plate (1×10⁶
cells/well) and incubated with 10 ng/ml OSM, 1 µM Sal, or both (10
ng/ml OSM + 1 µM Sal) for 6 days at 37°C and 5% CO2,
with 1 µg/ml 5-FU and culture medium used as positive and negative
controls, respectively. After washing with PBS, the cells were
resuspended in 500 µl binding buffer, and 5×10⁵ cells
were stained with JC-1 (5 µl) and PI (5 µl) and incubated in the
dark at room temperature for 15 min at 37°C and 5% CO2.
The cells were then resuspended in incubation buffer (500 µl) and
analyzed by flow cytometry. The experiment was performed three
times.
Real-time reverse
transcription-quantitative polymerase chain reaction (RT-qPCR)
LCSCs (1×10⁶ cells/well) were plated in a
6-well plate and incubated with 10 ng/ml OSM, 1 µM Sal, or both (10
ng/ml OSM + 1 µM Sal) for 6 days at 37°C and 5% CO2,
with 1 µg/ml 5-FU and culture medium used as positive and negative
controls, respectively. Total RNA was extracted using TRIzol
reagent (Invitrogen; Thermo Fisher Scientific, Inc.), and
first-strand cDNA was synthesized using a PrimeScript RT kit
(Takara Bio, Inc., Otsu, Japan). Primers used for PCR are presented
in Table I. cDNA was then used in
qPCR reactions to analyze NANOG, OCT4, and c-MYC
expression using FastStart SYBR Green master mix (Roche Diagnostics
GmbH, Mannheim, Germany) in a 10-µl reaction volume on a PikoReal
96 Real-Time PCR system (Thermo Fisher Scientific, Inc.). cDNA was
denatured for 10 min at 95°C, and PCR was run for 45 cycles, with
each cycle including steps of 5 sec at 95°C and 20 sec at 60°C.
Polymerization of cDNA was performed for 10 min at 72°C, and 5-FU
(1 µg/ml) and culture medium were used as positive and negative
controls, respectively. Experiments were performed in triplicate.
Average CT values of the target genes were normalized to controls
as ΔΔCq (19). The ratio of each gene
against 28S levels was calculated by standardizing the ratio of
each control to the unit value.
 | Table I.Primer sequences. |
Table I.
Primer sequences.
| Target gene | Sequence
(5′-3′) | Product size,
bp |
|---|
| 28S | F:
TTCACCAAGCGTTGGATTGTT | 146 |
|
| R:
TGTCTGAACCTGCGGTTCCT |
|
| OCT4 | F:
GCAGCTTGGGCTCGAGAAGGAT | 269 |
|
| R:
AGCCCAGAGTGGTGACGGAGAC |
|
| NANOG | F:
CCTGATTCTTCCACCAGTCC | 292 |
|
| R:
TGCTATTCTTCGGCCAGTTG |
|
| c-MYC | F:
CACCAGCAGCGACTCTGAGGAG | 239 |
|
| R:
ACTTGACCCTCTTGGCAGCAGG |
|
Western blotting
The expression of cleaved caspase-3 and total
caspase-3 in LCSCs was evaluated by western blotting. Cells
(1×10⁶/well) were seeded in a 6-well plate and incubated
with 10 ng/ml OSM, 1 µM Sal, or both (10 ng/ml OSM + 1 µM Sal) for
6 days at 37°C and 5% CO2, with 1 µg/ml 5-FU and culture
medium used as positive and negative controls, respectively. Cells
were lysed in 1 ml radioimmunoprecipitation buffer containing 10 µl
phenylmethylsulfonyl fluoride. Protein concentrations were
determined with a bicinchoninic acid assay kit (Beyotime Institute
of Biotechnology). The proteins (50 µg each) were separated by 12%
sodium dodecyl sulfate polyacrylamide gel electrophoresis at 160 V
for 1 h, followed by transfer to a polyvinylidene difluoride
membrane at 100 V for 1 h at room temperature. After blocking in 5%
non-fat milk in Tris-buffered saline for 1 h, the membrane was
incubated overnight at 4°C with anti-cleaved caspase-3 antibody
(1:1,000; cat. no. 9664), anti-total caspase-3 antibody (1:1,000;
cat. no. 9662) (both from Cell Signaling Technology, Inc., Danvers,
MA, USA) and anti-β-actin antibody (1:1,000; cat. no. sc-517582;
Santa Cruz Biotechnology, Inc., Dallas, TX, USA), washed five times
for 5 min each with Tris-buffered saline containing 0.5% Tween-20,
and then incubated for 1 h at room temperature with horseradish
peroxidase-conjugated secondary antibodies anti-rabbit IgG
(1:5,000; cat. no. 7470) and anti-mouse IgG (1:3,000; cat. no.
7076) (both from Cell Signaling Technology, Inc.). The membrane was
washed as previously described, and protein bands were visualized
using X-ray film by enhanced chemiluminescence (GE Healthcare,
Chicago, IL, USA).
Transwell invasion assay
An invasion assay was performed using 6.5-mm
Transwell plates with sterile 8.0-µm pore polycarbonate membrane
inserts (Corning, Inc.) and covered with a thin layer of BD
Matrigel (BD Biosciences, San Diego, CA, USA). Briefly,
1×10⁶ cells/well were seeded in a Transwell plate and
treated with 10 ng/ml OSM, 1 µM Sal, or both (10 ng/ml OSM + 1 µM
Sal), with 1 µg/ml 5-FU and culture medium used as positive and
negative controls, respectively. DMEM/F12 medium supplemented with
10% FBS was loaded into the bottom chamber through the insert as a
chemostatic factor. After incubation for 6 days at 37°C and 5%
CO2, the media in the upper and lower chambers were
removed, and cells were fixed with 4% paraformaldehyde (500 µl) for
20 min, washed twice with PBS (500 µl), and stained with crystal
violet (400 µl) for 20 min. Cells were counted on an inverted light
microscope, and the mean value was determined from counts of five
random fields.
Enzyme linked immunosorbent assay
(ELISA)
Cells were seeded in a 6-well plate at
1×10⁶/well and incubated with 10 ng/ml OSM, 1 µM Sal, or
both (10 ng/ml OSM + 1 µM Sal) for 6 days at 37°C and 5%
CO2, with 1 µg/ml 5-FU and culture medium used as
positive and negative controls, respectively. AFP and ALB in the
supernatant were detected by quantitative ELISA using kits (R&D
Systems, Inc., Minneapolis, MN, USA) according to the
manufacturer's instructions.
Statistical analyses
Data are presented as the means ± standard deviation
and analyzed using SPSS (v.17.0; SPSS, Inc., Chicago, IL, USA).
One-way analysis of variance followed by a Tukey-Kramer multiple
comparisons test were used to compare the corresponding data, and
P<0.05 was considered to indicate a statistically significant
difference.
Results
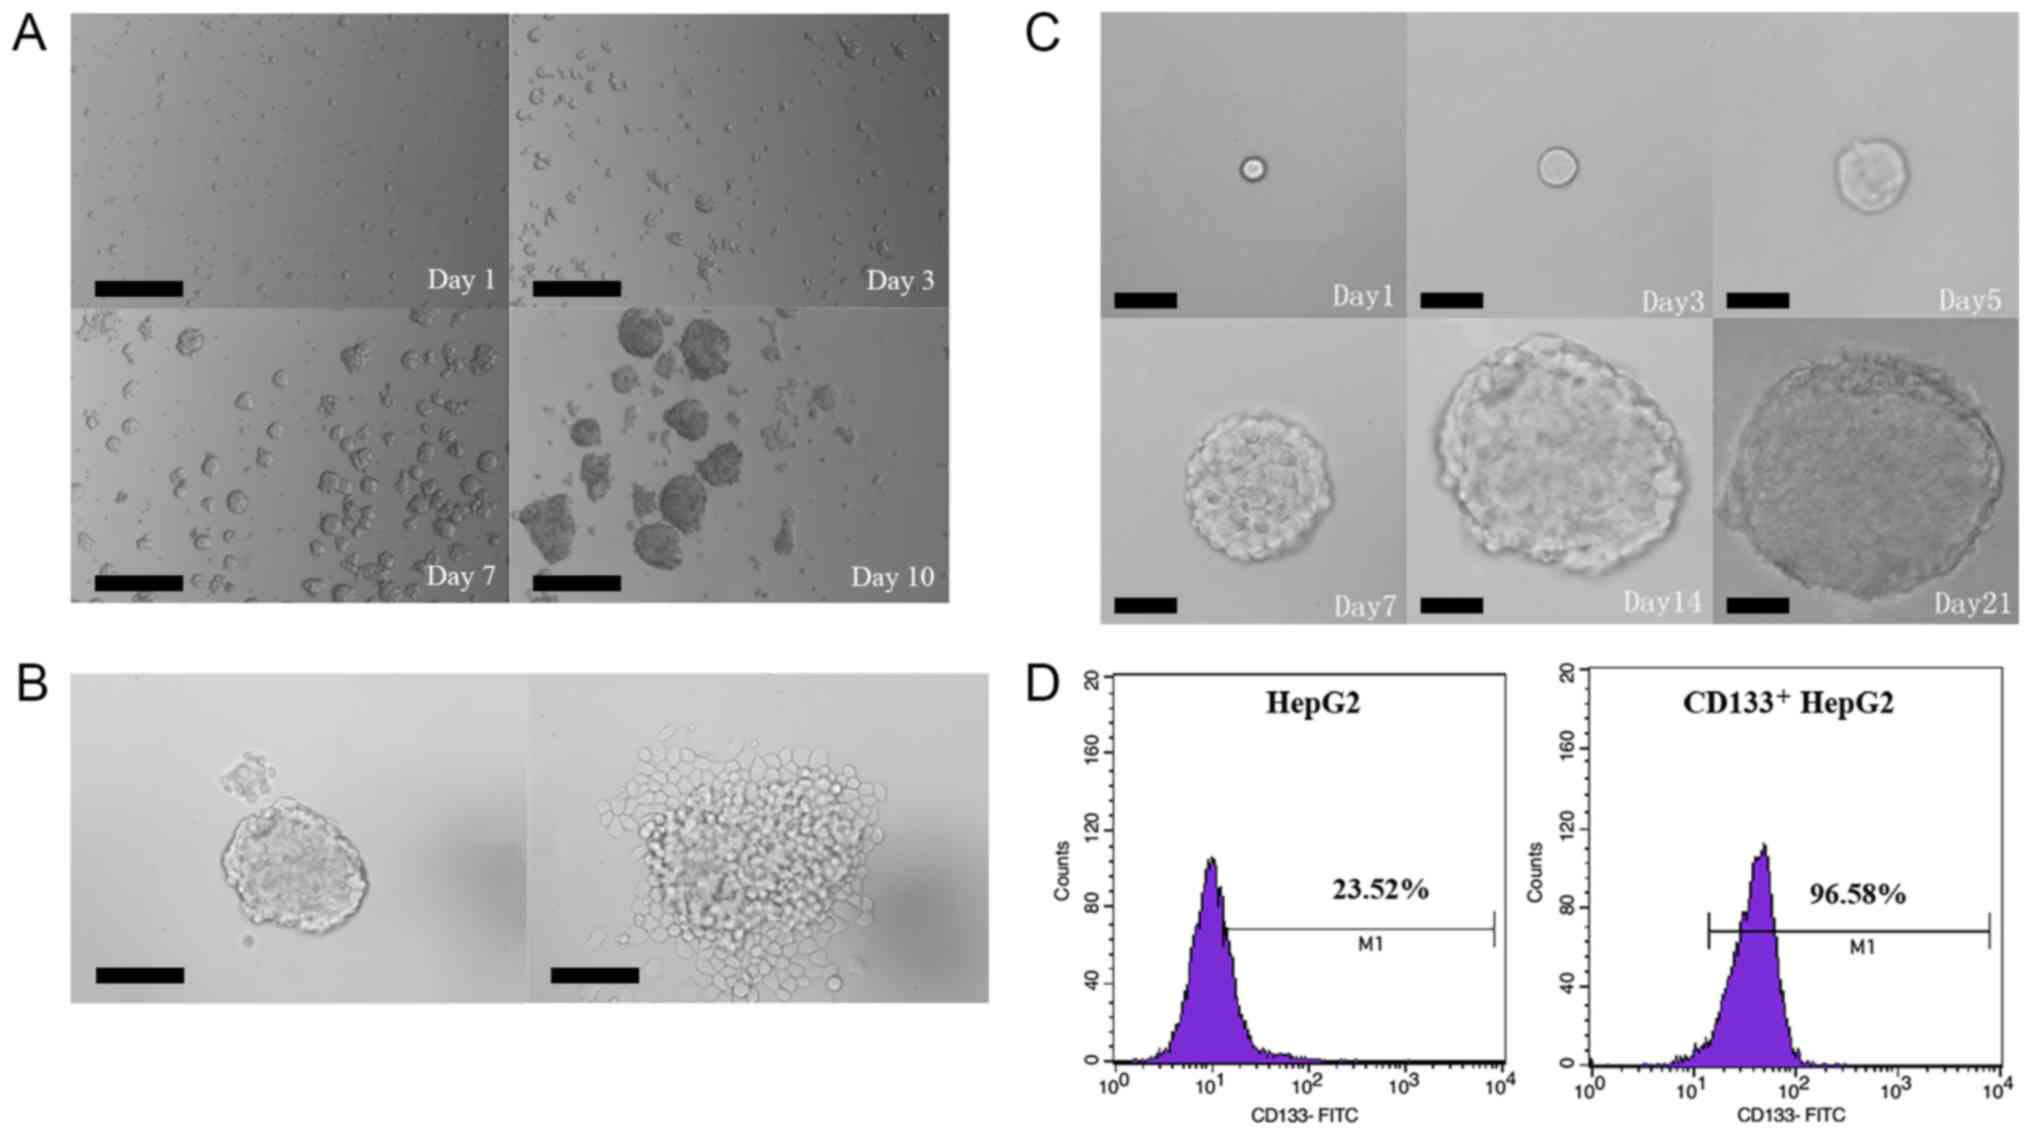
Isolation and characterization of
CD133+ HepG2 cells
Prior to cell sorting, CD133 expression was analyzed
by flow cytometry in order to evaluate the proportion of
CD133+ cells in the liver cancer HepG2 cell line. The
results revealed that CD133+ cells accounted for 2.5% of
unsorted HepG2 cells. To verify the stemness of CD133+
HepG2 cells, tumorsphere formation, colony formation, and
serum-induced differentiation assays were performed in
vitro. In the tumorsphere-formation assay, the sorted
CD133+ HepG2 cells cultured in the serum-free DMEM/F12
medium grew in the form of suspended individual cells on Day 1 and
began to aggregate into clusters on Day 3. As time passed, the
small clusters gradually increased both in size and number and
became visible to the naked eye on Day 10 (Fig. 1A). In the serum-induced
differentiation assay, sorted CD133+ HepG2 cells
cultured for 7 days were resuspended in a basal medium supplemented
with 10% FBS, resulting in a layer of adherent confluent cells on
Day 3 (Fig. 1B). In the colony
formation assay, CD133+ HepG2 cells (100 cells/well)
were inoculated onto soft agar, with small cell aggregates forming
on Day 3 and micro-colonies detected on Day 5. Small colonies were
visible to the naked eye on Day 7, and tumorspheres were observed
after culturing for 21 days (Fig.
1C). Additionally, flow cytometric analyses revealed that
before and after isolation by magnetic-activated cell sorting,
23.52 and 96.58% of cells, respectively, were CD133+
(Fig. 1D).
Sal and OSM treatment inhibits LCSC
proliferation and migration
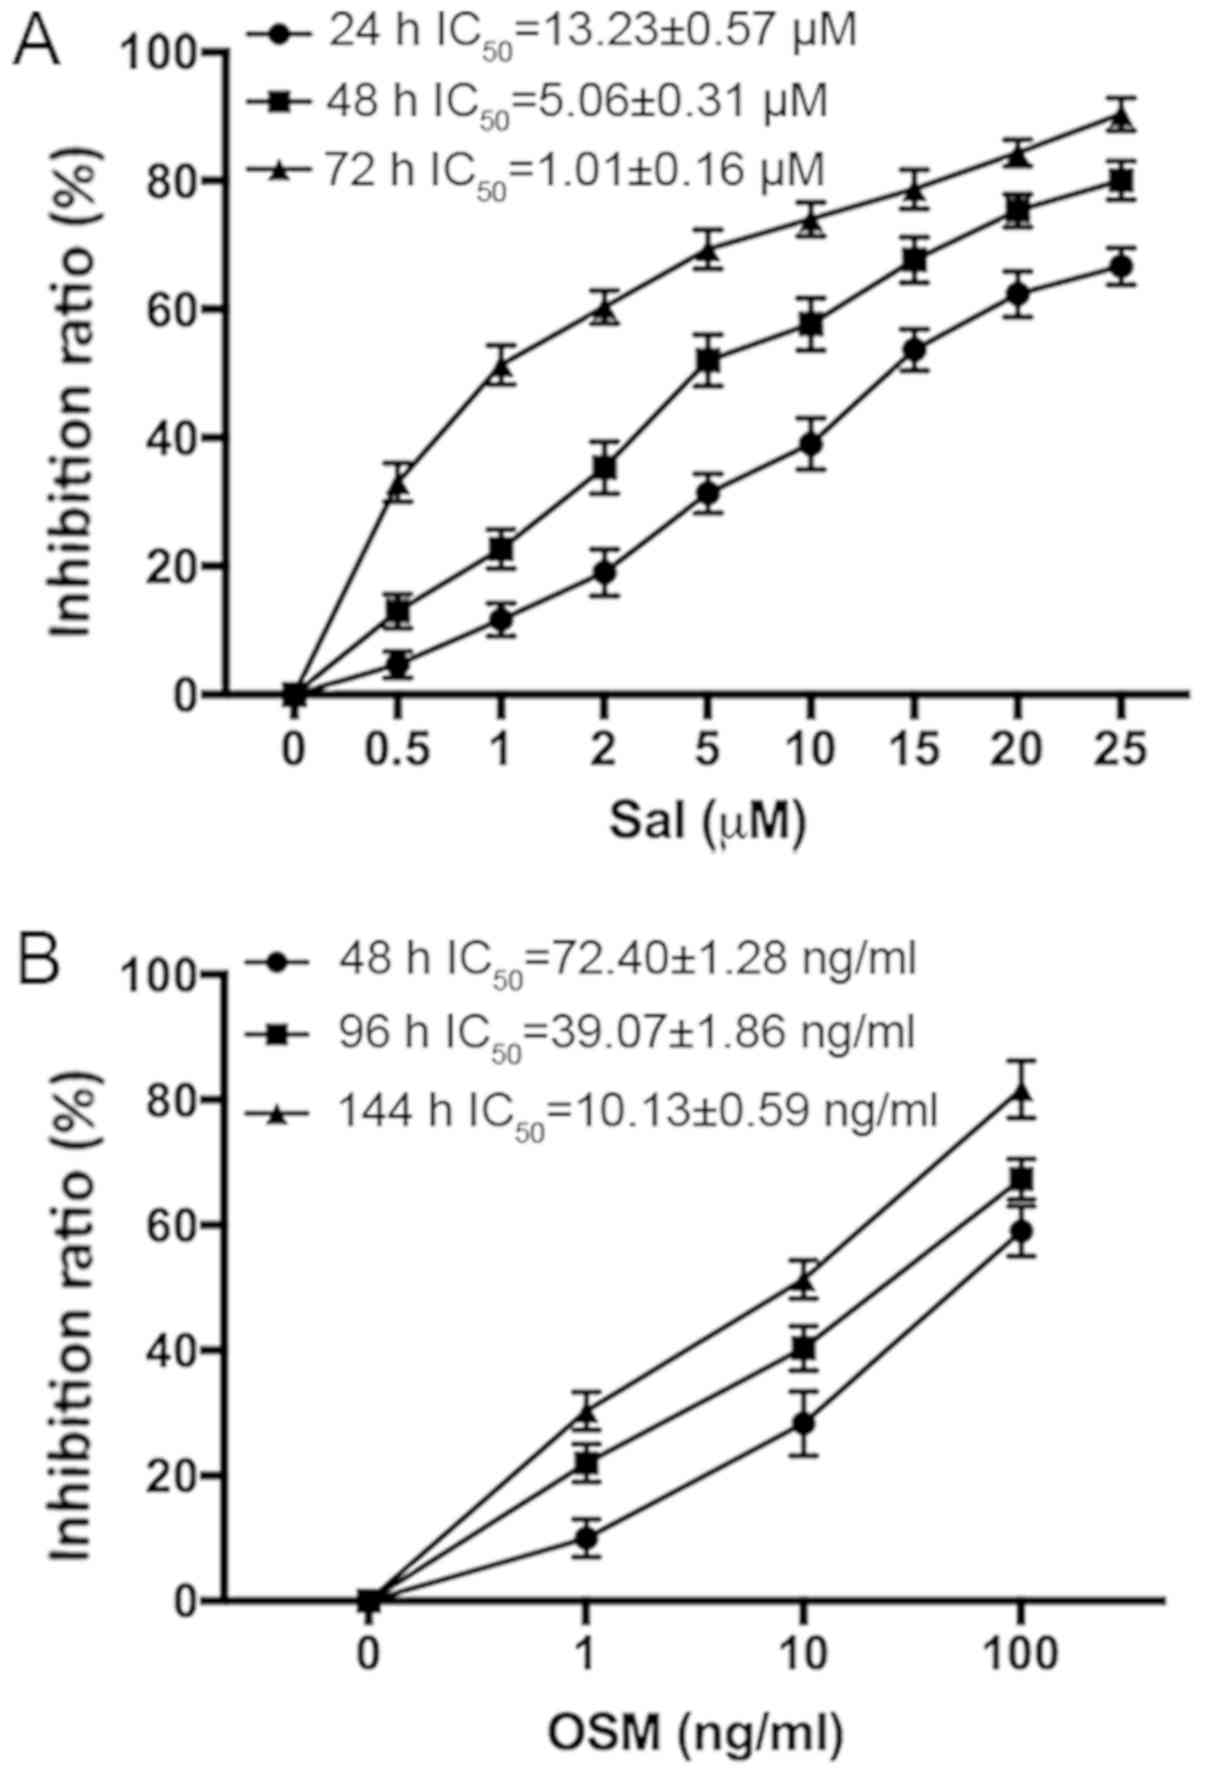
Sal or OSM cytotoxicity was determined by CCK-8
assay. The IC50 values of LCSCs at variable treatment
times are presented in Fig. 2. The
data indicated that Sal and OSM reduced LCSCs in a concentration-
and time-dependent manner. According to the IC50 values,
1 µM Sal and 10 ng/ml OSM or both were used in the following
experiments.
The combined treatment with OSM and Sal inhibited
LCSC migration to a greater extent than Sal or OSM alone
(P<0.05) according to Transwell-migration assay (Fig. 3A and B), indicating that OSM combined
with Sal treatment effectively suppressed the malignant potential
of LCSCs. Furthermore, CCK-8 assay revealed that combination (OSM +
Sal) treatment exhibited a more potent suppressive effect on LCSC
proliferation than either drug alone (P<0.05; Fig. 3C).
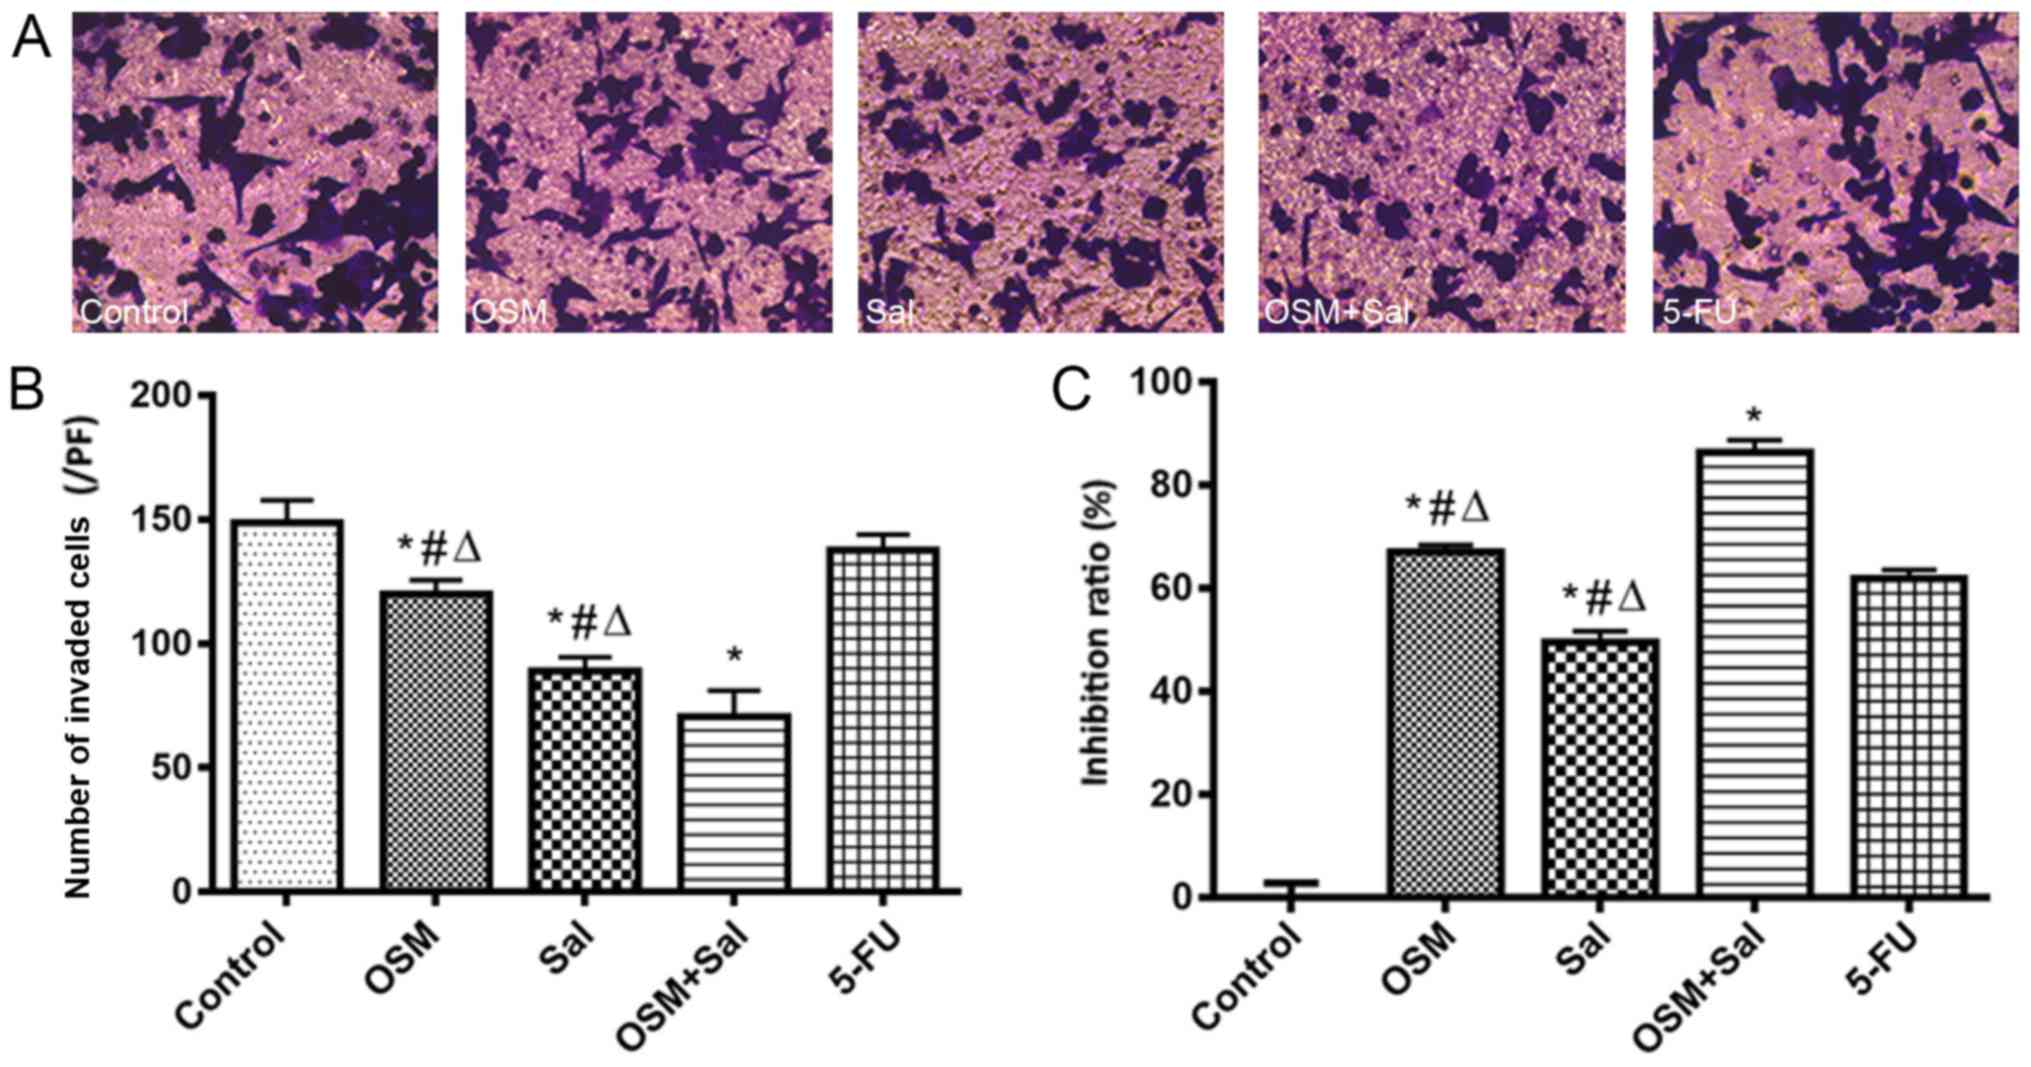 | Figure 3.OSM and Sal inhibit LCSC
proliferation and invasion. (A) Optical micrographs presenting the
inhibition of LCSC invasiveness after treatment with OSM and Sal
individually and in combination according to Transwell-migration
assay. Magnification, ×200. (B and C) Inhibition of LCSC (B)
invasiveness and (C) proliferation following treatment with OSM and
Sal individually and in combination. OSM (10 ng/ml), Sal (1 µM), or
both (10 ng/ml OSM + 1 µM Sal) were used in the experiments. Cells
treated with 1 µg/ml 5-FU served as the positive controls, and
culture medium was used as a negative control. Data represent the
means ± standard deviation. *P<0.05, compared with the control;
#P<0.05, compared with 5-FU;
∆P<0.05, compared with the combination (OSM +
Sal). OSM, oncostatin M; Sal, salinomycin; LCSC, liver cancer stem
cell; 5-FU, 5-fluorouracil. |
Sal and OSM induce LCSC apoptosis
Treatment with Sal, OSM, or both increased the
percentage of Annexin V-positive LCSCs to 24.01, 13.13 and 40.16%
of total cells, respectively, as compared with 12.71% in the 5-FU
positive-control group (P<0.05; Fig.
4A). Additionally, JC-1 staining revealed that 59.26, 72.02 and
82.79% of cells exhibited a loss of mitochondrial membrane
potential upon treatment with OSM, Sal, and OSM + Sal, respectively
(P<0.05; Fig. 4B). Moreover,
cleaved caspase-3 levels were higher and total caspase-3 were lower
in cells treated with OSM + Sal than in those treated with the
individual drugs according to western blot analysis (P<0.05;
Fig. 4C and D). These results
indicated that the combination drug treatment more potently induced
apoptosis in LCSCs than either drug alone, and that this effect was
likely mediated by the mitochondrial apoptosis pathway.
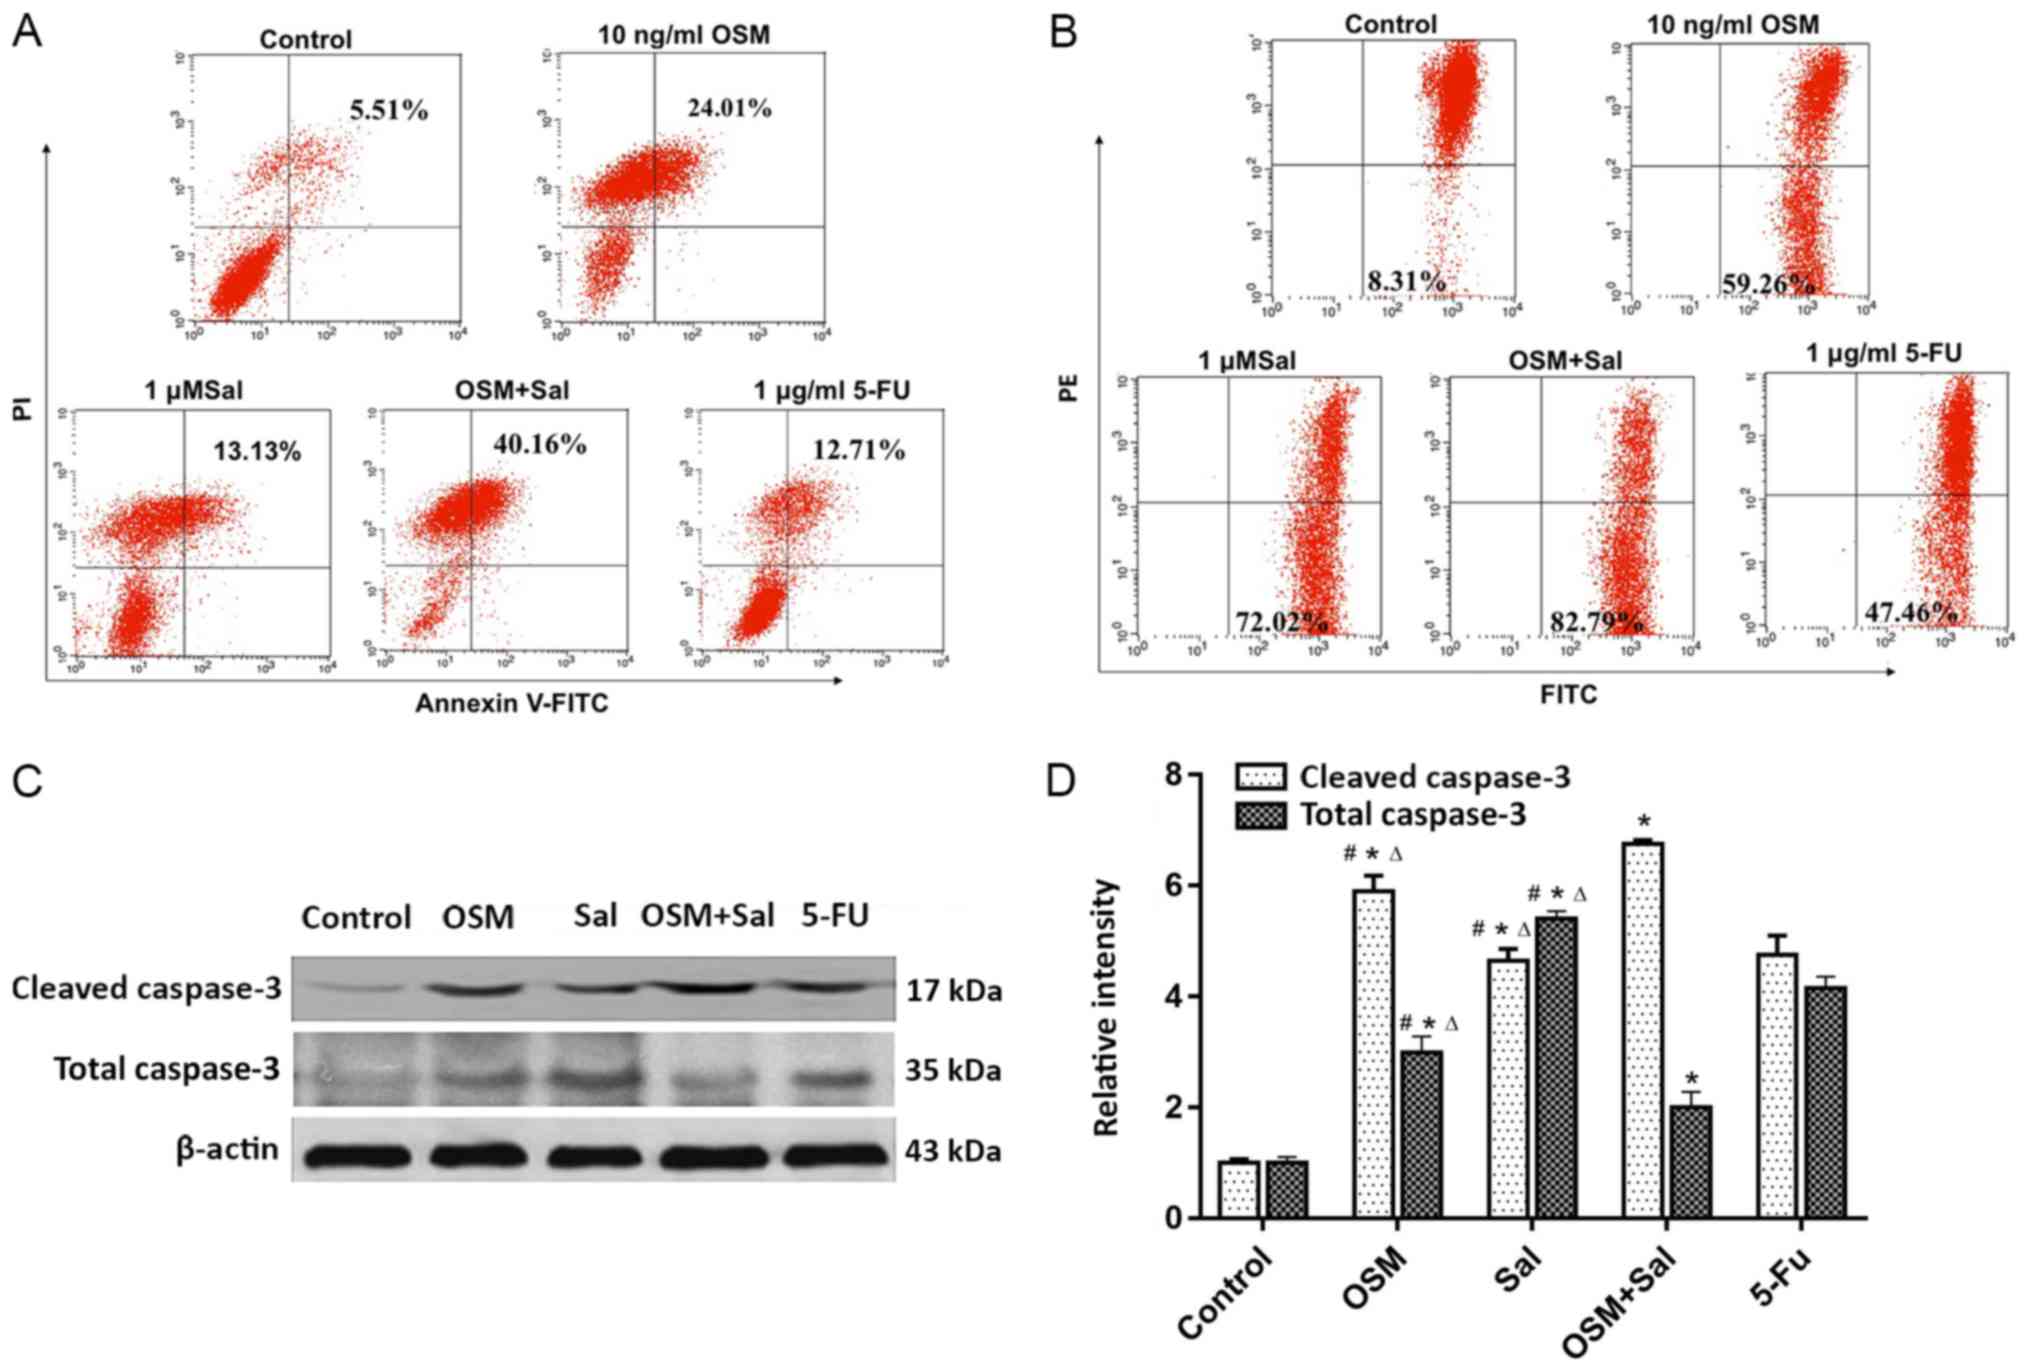 | Figure 4.OSM and Sal induce LCSC apoptosis.
(A) Flow cytometric analysis of Annexin V/PI staining of LCSCs
treated with OSM and Sal individually and in combination. Dot plots
show Annexin V/FITC and PI fluorescence staining. Lower-right and
upper-right quadrants are apoptotic cells. (B) JC-1 staining assay
following treatment of LCSCs with OSM and Sal individually and in
combination. Apoptotic cells are shown in the lower-right quadrant
of the dot plots. (C) Western blot analysis revealed total
caspase-3 and cleaved caspase-3 levels following treatment of LCSCs
with OSM and Sal individually and in combination. (D) Gray analysis
of western blotting on total caspase-3 and cleaved caspase-3. OSM
(10 ng/ml), Sal (1 µM), or both (10 ng/ml OSM + 1 µM Sal) were used
in the experiments. Cells treated with 1 µg/ml 5-FU served as the
positive controls, and culture medium was used as a negative
control. Data represent the means ± standard deviation. *P<0.05,
compared with the control; #P<0.05, compared with
5-FU, ∆P<0.05, compared with the combination
(OSM + Sal). OSM, oncostatin M; Sal, salinomycin; LCSC, liver
cancer stem cell; PI, propidium iodide; FITC, fluorescein
isothiocyanate; 5-FU, 5-fluorouracil. |
Sal and OSM induce the expression of
stem cell differentiation-related markers
The fraction of LCSCs expressing CD133 after
treatment with OSM, Sal, or both was 51.90, 61.31 and 36.48%,
respectively, as compared with 97.20% for the blank control group
and according to flow cytometric analysis. Therefore, combination
treatment reduced the size of the CD133+ population to a
greater extent than individual drug treatments (P<0.05; Fig. 5A). Additionally, real-time qPCR
analysis revealed that NANOG, c-MYC, and OCT4 levels
were lower in cells treated with OSM + Sal than in those treated
with Sal or OSM alone (P<0.05; Fig.
5B). Moreover, the decrease in AFP secretion and the increase
in ALB secretion were greater in cells receiving combination
treatment as compared with the other experimental and 5-FU
positive-control groups (P<0.05; Fig.
5C and D). These results indicated that treatment with OSM
combined with Sal potently suppressed the stemness characteristics
of LCSCs.
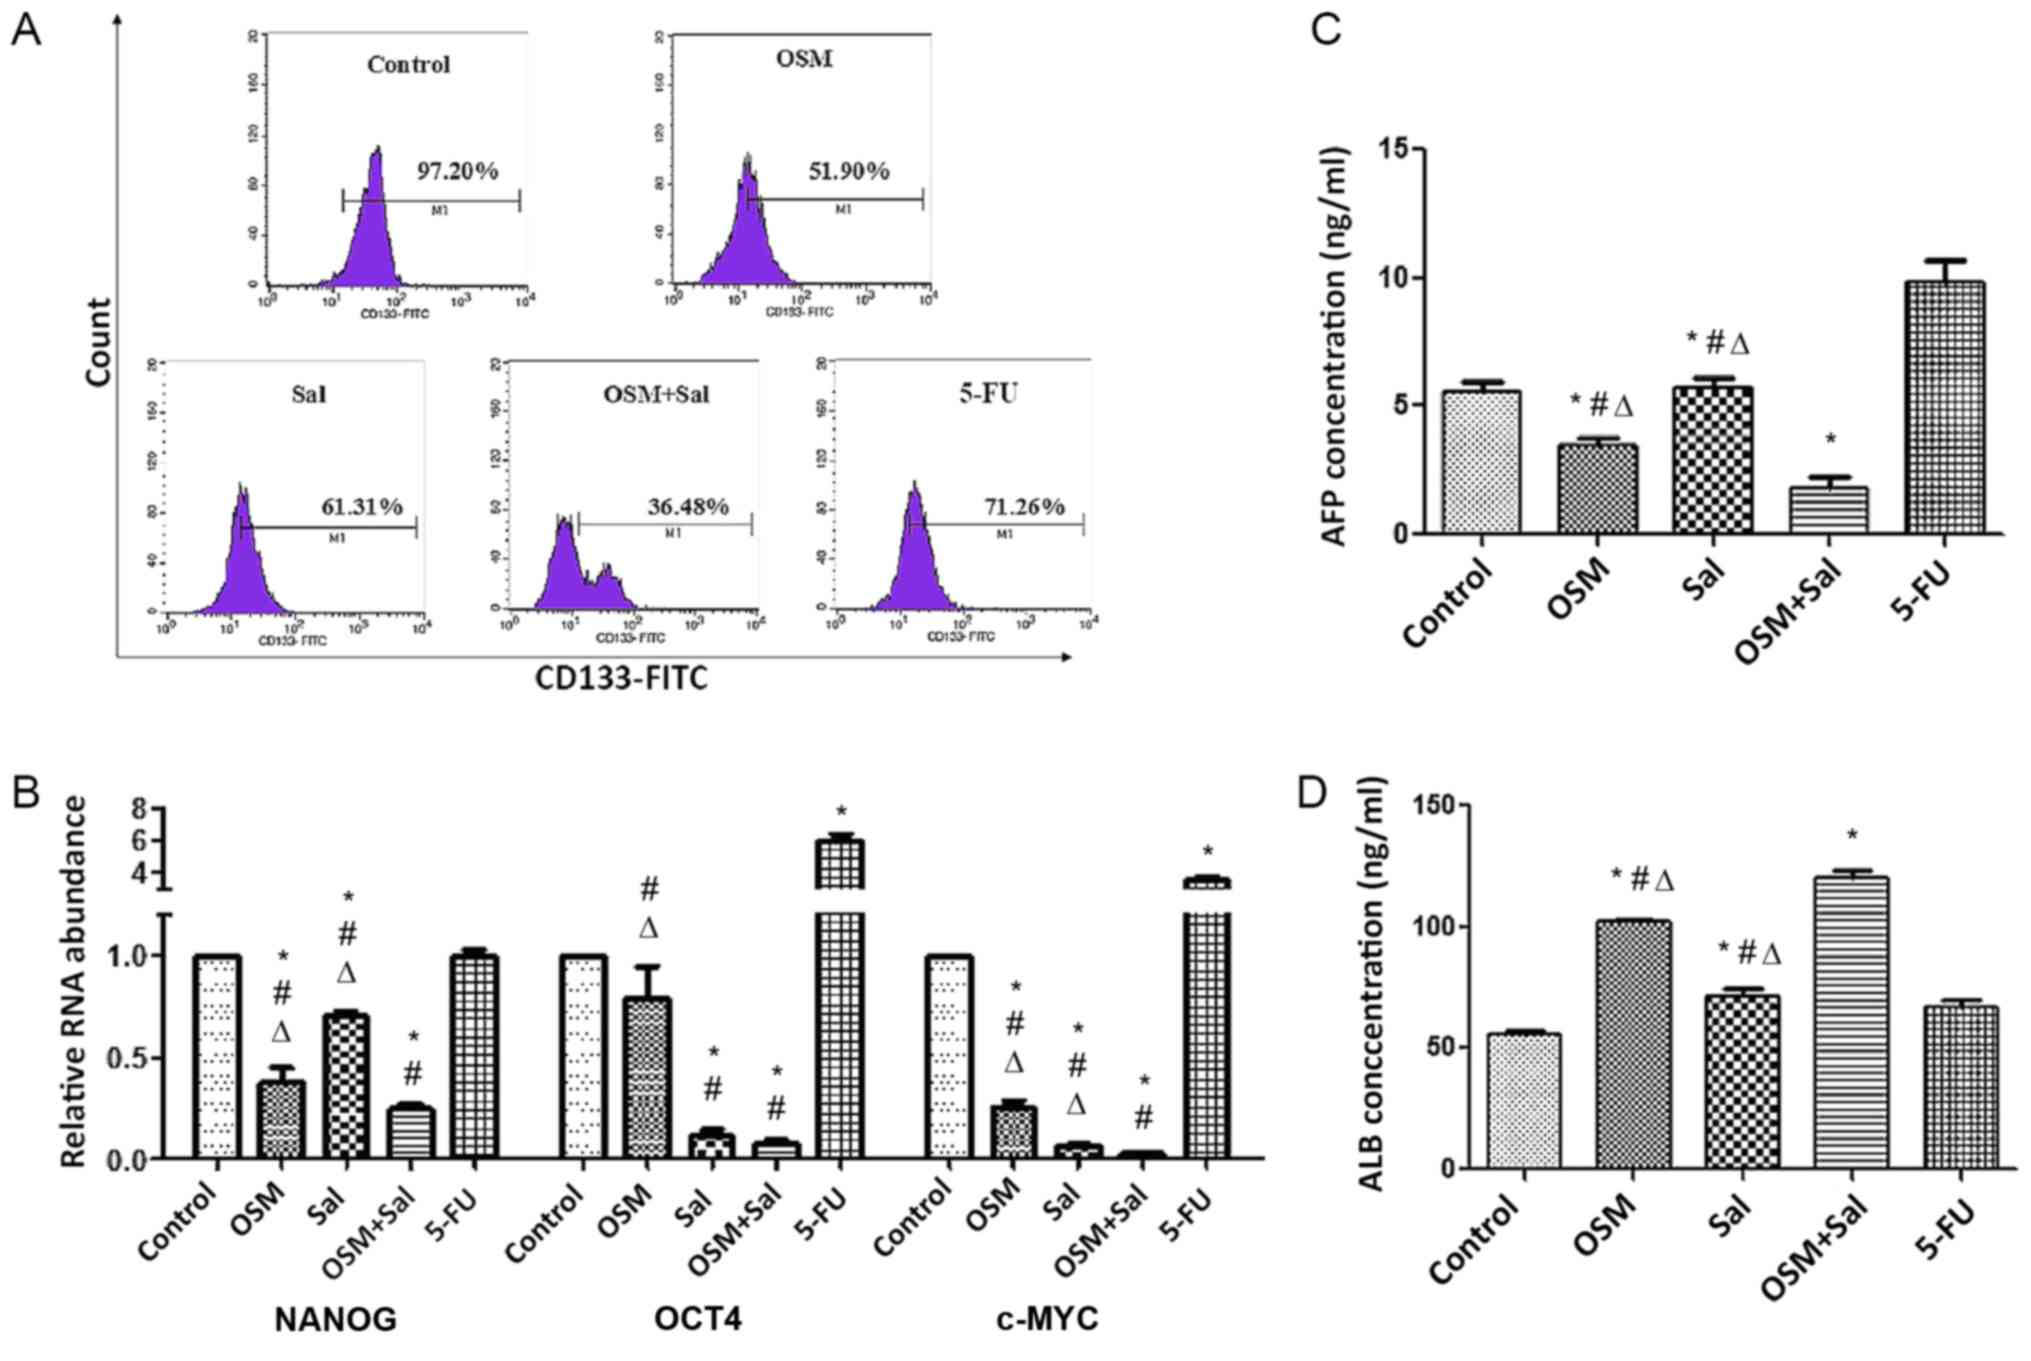 | Figure 5.OSM and Sal induce expression of LCSC
differentiation-related markers. (A) Fraction of LCSCs expressing
CD133 after treatment with OSM, Sal, or both according to flow
cytometric analysis. (B) Real-time quantitative reverse
transcription polymerase chain reaction analysis of NANOG,
OCT4 and c-MYC mRNA expression in LCSCs treated with
OSM, Sal, or both. Detection of (C) AFP and (D) ALB levels in the
culture supernatant of LCSCs treated with OSM, Sal, or both by
enzyme linked immunosorbent assay. OSM (10 ng/ml), Sal (1 µM), or
both (10 ng/ml OSM + 1 µM Sal) were used in the experiments. Cells
treated with 1 µg/ml 5-FU served as the positive controls, and
culture medium was used as a negative control. Data represent the
mean ± standard deviation. *P<0.05, compared with the control;
#P<0.05, compared with 5-FU,
∆P<0.05, compared with the combination (OSM +
Sal). OSM, oncostatin M; Sal, salinomycin; LCSC, liver cancer stem
cell; AFP, α-fetoprotein; ALB, albumin; 5-FU, 5-fluorouracil. |
Discussion
CD133 is a prominent cell-surface marker used to
identify CSCs. CD133 was originally found on hematopoietic
stem/progenitor cells and neural stem cells and was subsequently
reported to be expressed in CSCs from many types of malignancies,
including brain, prostate, pancreatic, lung, and colon cancers
(20). Recently, Ma et al
(21) reported CD133 as a potent CSC
marker in liver cancer cell lines, including HepG2 and xenograft
tumors. The CD133+ subpopulation constitutes one of the
most immature stages of liver cancer cells and is more resistant to
conventional chemotherapeutic agents, such as 5-FU (21,22), due
to the expression of genes important for the self-renewal and
proliferative properties of stem/progenitor cells. These genes
include those encoding β-catenin involved in the Wnt-signaling
pathway, which plays a critical role in cell proliferation,
migration, and differentiation. In the present study, CD133 was
used as a marker for the isolation of subsets enriched with CSCs
from the liver cancer cell line HepG2 by magnetic-activated cell
sorting, and it was revealed that CD133+ HepG2 CSCs
(termed LCSCs) accounted for 2.5% of all HepG2 cells, which was
consistent with the range 1.16 to 4.37% reported previously
(23). Therefore, this finding was in
agreement with the hypothesis that CSCs represent a small
subpopulation of cells within solid or non-solid tumors. Highly
purified LCSCs (>96%) were subsequently obtained and formed
colonies in the second passage after a 3-week culture period, with
the identity of the LCSCs confirmed by their differentiation
potential, soft-agar colony formation, and surface-marker
expression.
Given that an overlap likely exists between
CD133+ and other cell-surface phenotypes of LCSCs,
including EpCAM+ (12),
possibly due to tumor heterogeneity, LCSCs may not be sensitive to
a single CSC-specific drug. Previous studies reported that Sal and
OSM have each demonstrated anti-LCSC effects in vivo and
in vitro via their distinct molecular pathways (10,12,13,24).
In the present study, we assessed and compared the effects of
treatment with Sal and OSM individually and in combination on
LCSCs. The results revealed that LCSC proliferation was inhibited
by Sal, OSM, and their combinatorial treatment, although the latter
had a more potent effect. This was also true for induction of LCSC
apoptosis and differentiation. Apoptosis resistance is a major
factor associated with tumorigenesis and drug resistance (25). Caspase-3 is a downstream executioner
caspase associated with the apoptotic process and that mediates
protein cleavage of procaspases 3, 6, 7 and 9, as well as other
caspase substrates important to the molecular mechanisms of
apoptosis. Previous studies revealed that Sal induced
caspase-mediated cell death in ovarian epithelial carcinoma, lung
cancer cell lines, nasopharyngeal carcinoma, and colorectal CSCs
(26–29). In the present study, enhanced early
apoptosis of LCSCs after combination treatment with OSM and Sal was
observed, according to JC-1 and Annexin V-FITC assays and caspase-3
activity, which suggested induction of apoptosis through the
mitochondrial pathway. However, a more detailed investigation of
the underlying mechanism of apoptosis in this context is
required.
Stem cell-related transcription factors, such as
OCT4, NANOG, and c-MYC, play critical roles in maintaining stemness
and regulating downstream genes involved in self-renewal and
differentiation. Recently, the genes encoding these proteins were
linked with abnormal growth and oncogenic transformation and have
frequently been reported as overexpressed in human cancers
(3). In the present study, we found
significant reductions in the OCT4, NANOG, and c-MYC
mRNA expression in LCSCs treated with the drug combination as
compared with OSM or Sal treatment alone or results from the 5-FU
group, suggesting an enhanced antiproliferative effect elicited by
the drug combination on LCSCs. Moreover, combination treatment
suppressed LCSC migration and invasion according to Transwell
assays, possibly due in part to downregulated signaling associated
with the focal adhesive kinase and extracellular signal-regulated
kinase 1/2 pathways (14). ALB is
produced by hepatocytes and represents a significant marker of
hepatocyte differentiation; however, it is produced at lower levels
in liver cancer cells. Conversely, AFP is expressed in liver cancer
cells and represents a highly effective marker of liver cancer. In
the present study, we observed decreased AFP levels and increased
ALB levels following treatment with OSM or Sal alone and also after
combination treatment, indicating induction of LCSC differentiation
toward hepatocytes, although more pronounced effects were observed
following treatment with OSM alone and both drugs. Similarly, OSM
used along with hepatocyte growth factor induced the
differentiation of human mesenchymal stem cells from various
sources into functional hepatocyte-like cells (16,30).
Although the underlying mechanism remains unclear, one hypothesis
suggests that OSM modulates liver cancer differentiation via the
C-X-C chemokine receptor type 7/extracellular signal-regulated
kinase/hepatocyte nuclear factor 4α cascade (31).
In conclusion, the enhanced capability of the drug
combination of OSM and Sal in suppressing LCSC proliferation and
invasion, as well as its ability to induce early stage apoptosis
and LCSC differentiation, in vitro was revealed. A potential
limitation of this study was the use of a CCK-8 assay to assess
cell viability following treatment with Sal, which is known to
affect mitochondrial function such as mitochondrial ion
translocation and respiration (32–34).
However, previously published studies have also employed this assay
to determine cell viability following Sal treatment (35–38).
Although in vivo studies are required to validate these
findings, and drug toxicity and side effects need to be evaluated,
our findings indicated that combination therapy with OSM and Sal
represents an important first step in the development of
drug-combination therapy for liver cancer treatment.
Acknowledgements
The authors acknowledge Dr Zi Yan from The First
Hospital of Jilin University (Changchun, China) for language
editing.
Funding
This study was supported by the Technology
Development Plan of Jilin Province (no. 20160204036YY) and the
Fundamental Research Funds for the Central Universities.
Availability of data and material
All data generated and/or analyzed during this study
are included in this published article.
Authors' contributions
CF wrote the paper and supervised the experiments.
CF and LW performed the experiments. GT, CZ, and YZ, and HX
performed analysis and interpretation of the data, and MS and YW
conceived and designed the experiments. YW reviewed and revised the
paper. All authors read and approved the final version of the
manuscript.
Ethics approval and consent to
participate
Not applicable.
Patient consent for publication
Not applicable.
Competing interests
The authors declare that they have no competing
interests.
Glossary
Abbreviations
Abbreviations:
|
5-FU
|
5-fluorouracil
|
|
bFGF
|
basic fibroblast growth factor
|
|
CCK-8
|
Cell Counting Kit-8
|
|
CSC
|
cancer stem cell
|
|
DMEM
|
Dulbecco's Modified Eagle's Medium
|
|
DMSO
|
dimethylsulfoxide
|
|
ELISA
|
enzyme-linked immunosorbent assay
|
|
EGF
|
epidermal growth factor
|
|
EpCAM+
|
epithelial cell adhesion
molecule-positive
|
|
FBS
|
fetal bovine serum
|
|
FITC
|
fluorescein isothiocyanate
|
|
LCSC
|
liver cancer stem cell
|
|
OSM
|
oncostatin M
|
|
PBS
|
phosphate-buffered saline
|
|
PI
|
propidium iodide
|
|
RT-qPCR
|
reverse transcription-quantitative
polymerase chain reaction
|
|
Sal
|
salinomycin
|
References
|
1
|
Ferlay J, Soerjomataram I, Dikshit R, Eser
S, Mathers C, Rebelo M, Parkin DM, Forman D and Bray F: Cancer
incidence and mortality worldwide: Sources, methods and major
patterns in GLOBOCAN 2012. Int J Cancer. 136:E359–E386. 2015.
View Article : Google Scholar : PubMed/NCBI
|
|
2
|
Jordan CT, Guzman ML and Noble M: Cancer
stem cells. N Engl J Med. 355:1253–1261. 2006. View Article : Google Scholar : PubMed/NCBI
|
|
3
|
Naujokat C and Steinhart R: Salinomycin as
a drug for targeting human cancer stem cells. J Biomed Biotechnol.
2012:9506582012. View Article : Google Scholar : PubMed/NCBI
|
|
4
|
Bexell D, Gunnarsson S, Siesjö P, Bengzon
J and Darabi A: CD133+ and nestin+ tumor-initiating cells dominate
in N29 and N32 experimental gliomas. Int J Cancer. 125:15–22. 2009.
View Article : Google Scholar : PubMed/NCBI
|
|
5
|
Gupta PB, Onder TT, Jiang G, Tao K,
Kuperwasser C, Weinberg RA and Lander ES: Identification of
selective inhibitors of cancer stem cells by high-throughput
screening. Cell. 138:645–659. 2009. View Article : Google Scholar : PubMed/NCBI
|
|
6
|
Zhi QM, Chen XH, Ji J, Zhang JN, Li JF,
Cai Q, Liu BY, Gu QL, Zhu ZG and Yu YY: Salinomycin can effectively
kill ALDH(high) stem-like cells on gastric cancer. Biomed
Pharmacother. 65:509–515. 2011. View Article : Google Scholar : PubMed/NCBI
|
|
7
|
Dong TT, Zhou HM, Wang LL, Feng B, Lv B
and Zheng MH: Salinomycin selectively targets ‘CD133+’
cell subpopulations and decreases malignant traits in colorectal
cancerlines. Ann Surg Oncol. 18:1797–1804. 2011. View Article : Google Scholar : PubMed/NCBI
|
|
8
|
Kim KY, Yu SN, Lee SY, Chun SS, Choi YL,
Park YM, Song CS, Chatterjee B and Ahn SC: Salinomycin-induced
apoptosis of human prostate cancer cells due to accumulated
reactive oxygen species and mitochondrial membrane depolarization.
Biochem Biophys Res Commun. 413:80–86. 2011. View Article : Google Scholar : PubMed/NCBI
|
|
9
|
He L, Wang F, Dai WQ, Wu D, Lin CL, Wu SM,
Cheng P, Zhang Y, Shen M, Wang CF, et al: Mechanism of action of
salinomycin of growth and migration in pancreatic cancer cell line.
Pancreatology. 13:72–78. 2013. View Article : Google Scholar : PubMed/NCBI
|
|
10
|
Wang F, He L, Dai WQ, Xu YP, Wu D, Lin CL,
Wu SM, Cheng P, Zhang Y, Shen M, et al: Salinomycin inhibits
proliferation and induces apoptosis of human hepatocellular
carcinoma cells in vitro and in vivo. PLoS One. 7:e506382012.
View Article : Google Scholar : PubMed/NCBI
|
|
11
|
Park SY, Gönen M, Kim HJ, Michor F and
Polyak K: Cellular and genetic diversity in the progression of in
situ human breast carcinomas to aninvasive phenotype. J Clin
Invest. 120:636–644. 2010. View
Article : Google Scholar : PubMed/NCBI
|
|
12
|
Yamashita T, Honda M, Nio K, Nakamoto Y,
Yamashita T, Takamura H, Tani T, Zen Y and Kaneko S: Oncostatin m
renders epithelial cell adhesion molecule-positive liver cancer
stem cells sensitive to 5-Fluorouracil by inducing hepatocytic.
Cancer Res. 70:4687–4697. 2010. View Article : Google Scholar : PubMed/NCBI
|
|
13
|
Zheng H, Pomyen Y, Hernandez MO, Li C,
Livak F, Tang W, Dang H, Greten TF, Davis JL, Zhao Y, et al: Single
cell analysis reveals cancer stem cell heterogeneity in
hepatocellular carcinoma. Hepatology. 68:127–140. 2018. View Article : Google Scholar : PubMed/NCBI
|
|
14
|
Sun J, Luo Q, Liu L, Yang X, Zhu S and
Song G: Salinomycin attenuates liver cancer stem cell motility by
enhancing cell stiffness and increasing F-actin formation via the
FAK-ERK1/2 signalling pathway. Toxicology. 384:1–10. 2017.
View Article : Google Scholar : PubMed/NCBI
|
|
15
|
Tanaka M and Miyajima A: Oncostatin M, a
multifunctional cytokine. Rev Physiol Biochem Pharmacol. 149:39–52.
2003. View Article : Google Scholar : PubMed/NCBI
|
|
16
|
Nakamura K, Nonaka H, Saito H, Tanaka M
and Miyajima A: Hepatocyte proliferation and tissue remodeling is
impaired after liver injury in oncostatin M receptor knockout mice.
Hepatology. 39:635–644. 2004. View Article : Google Scholar : PubMed/NCBI
|
|
17
|
Larrea E, Aldabe R, Gonzalez I, Segura V,
Sarobe P, Echeverria I and Prieto J: Oncostatin M enhances the
antiviral effects of type I interferon and activates
immunostimulatory functions in liver epithelial cells. J Virol.
83:3298–3311. 2009. View Article : Google Scholar : PubMed/NCBI
|
|
18
|
Lepiller Q, Abbas W, Kumar A, Tripathy MK
and Herbein G: HCMV activates the IL-6-JAK-STAT3 axis in HepG2
cells and primary human hepatocytes. PLoS One. 8:e595912013.
View Article : Google Scholar : PubMed/NCBI
|
|
19
|
Livak KJ and Schmittgen TD: Analysis of
relative gene expression data using real-time quantitative PCR and
the 2(-Delta Delta C(T)) method. Methods. 25:402–408. 2001.
View Article : Google Scholar : PubMed/NCBI
|
|
20
|
Ajani JA, Song S, Hochster HS and
Steinberg IB: Cancer stem cells: The promise and the potential.
Semin Oncol. 42 Suppl:3–17. 2015. View Article : Google Scholar
|
|
21
|
Ma S, Chan KW, Hu L, Lee TK, Wo JY, Ng IO,
Zheng BJ and Guan XY: Identification and characterization of
tumorigenic liver cancer stem/progenitor cells. Gastroenterology.
132:2542–2556. 2007. View Article : Google Scholar : PubMed/NCBI
|
|
22
|
Ma S, Lee TK, Zheng BJ, Chan KW and Guan
XY: CD133+ HCC cancer stem cells confer chemmoresistance by
preferential expression of the Akt/PKB survival pathway. Oncogen.
27:1749–1758. 2008. View Article : Google Scholar
|
|
23
|
Lan X, Wu YZ, Wang Y, Wu FR, Zang CB, Tang
C, Cao S and Li SL: CD133 silencing inhibits stemness properties
and enhances chemoradiosensitivity in CD133-positive liver cancer
stem cells. Int J Mol Med. 31:315–324. 2013. View Article : Google Scholar : PubMed/NCBI
|
|
24
|
Kong N, Zhang XM, Wang HT, Mu XP, Han HZ
and Yan WQ: Inhibition of growth and induction of differentiation
of SMMC-7221 human hepatocellular carcinoma cells by oncostatin M.
Asian Pac J Cancer Prev. 14:747–752. 2013. View Article : Google Scholar : PubMed/NCBI
|
|
25
|
Lee S and Schmitt CA: Chemotherapy
response and resistance. Curr Opin Genet Dev. 13:90–96. 2003.
View Article : Google Scholar : PubMed/NCBI
|
|
26
|
Kaplan F and Teksen F: Apoptotic effects
of salinomycin on human ovarian cancer cell line (ovcar-3). Tumor
Biol. 37:3897–3903. 2016. View Article : Google Scholar
|
|
27
|
Arafat K, Iratni R, Takahashi T, Parekh K,
Al Dhaheri Y, Adrian TE and Attoub S: Inhibitory effects of
salinomycin on cell survival, colony growth, migration, and
invasion of human non-small cell lung cancer a549 and lnm35:
Involvment of nag-1. PLoS One. 8:e669312013. View Article : Google Scholar : PubMed/NCBI
|
|
28
|
Wu D, Zhang Y, Huang J, Fan Z, Shi F and
Wang S: Salinomycin inhibits proliferation and induces apoptosis of
human nasopharyngeal carcinoma cell and suppresses tumor growth in
vivo. Biochem Biophys Res Commun. 443:712–717. 2014. View Article : Google Scholar : PubMed/NCBI
|
|
29
|
Zhang C, Tian Y, Song F, Fu C, Han B and
Wang Y: Salinomycin inhibits the growth of colorectal carcinoma by
targeting tumor stem cells. Oncol Rep. 34:2469–2476. 2015.
View Article : Google Scholar : PubMed/NCBI
|
|
30
|
Lee KD, Kuo TK, Whang-Peng J, Chung YF,
Lin CT, Chou SH, Chen JR, Chen YP and Lee OK: In vitro hepatic
differentiation of human mesenchymal stem cells. Hepatology.
40:1275–1284. 2004. View Article : Google Scholar : PubMed/NCBI
|
|
31
|
Xue TC, Jia QA, Bu Y, Chen RX, Cui JF,
Tang ZY and Ye SL: CXCR7 correlates with the differentiation of
hepatocellular carcinoma and suppresses HNF4α expression through
the ERK pathway. Oncol Rep. 32:2387–2396. 2014. View Article : Google Scholar : PubMed/NCBI
|
|
32
|
Mitani M, Yamanishi T, Miyazaki Y and
Otake N: Salinomycin effects on mitochondrial ion translocation and
respiration. Antimicrob Agents Chemother. 9:655–660. 1976.
View Article : Google Scholar : PubMed/NCBI
|
|
33
|
Managò A, Leanza L, Carraretto L, Sassi N,
Grancara S, Quintana-Cabrera R, Trimarco V, Toninello A, Scorrano
L, Trentin L, et al: Early effects of the antineoplastic agent
salinomycin on mitochondrial function. Cell Death Dis. 6:e19302015.
View Article : Google Scholar : PubMed/NCBI
|
|
34
|
Klose J, Stankov MV, Kleine M, Ramackers
W, Panayotova-Dimitrova D, Jäger MD, Klempnauer J, Winkler M,
Bektas H, Behrens GM and Vondran FW: Inhibition of autophagic flux
by salinomycin results in anti-cancer effect in hepatocellular
carcinoma cells. PLoS One. 9:e959702014. View Article : Google Scholar : PubMed/NCBI
|
|
35
|
Fu YZ, Yan YY, He M, Xiao QH, Yao WF, Zhao
L, Wu HZ, Yu ZJ, Zhou MY, Lv MT, et al: Salinomycin induces
selective cytotoxicity to MCF-7 mammosphere cells through targeting
the Hedgehog signaling pathway. Oncol Rep. 35:912–922. 2016.
View Article : Google Scholar : PubMed/NCBI
|
|
36
|
Zhu LQ, Zhen YF, Zhang Y, Guo ZX, Dai J
and Wang XD: Salinomycin activates AMP-activated protein
kinase-dependent autophagy in cultured osteoblastoma cells: A
negative regulator against cell apoptosis. PLos One. 8:e841752013.
View Article : Google Scholar : PubMed/NCBI
|
|
37
|
Zhang Y, Zuo Y, Guan Z, Lu W, Xu Z, Zhang
H, Yang Y, Yang M, Zhu H and Chen X: Salinomycin radiosensitizes
human nasopharyngeal carcinoma cell line CNE-2 to radiation. Tumour
Bio. 37:305–311. 2016. View Article : Google Scholar
|
|
38
|
Mao J, Fan S, Ma W, Fan P, Wang B, Zhang
J, Wang H, Tang B, Zhang Q, Yu X, et al: Roles of Wnt/β-catenin
signaling in the gastric cancer stem cells proliferation and
salinomycin treatment. Cell Death Dis. 5:e10392014. View Article : Google Scholar : PubMed/NCBI
|