Introduction
Gastrointestinal stromal tumors (GISTs) are a
distinct type of tumor with the highest incidence among sarcomas of
the gastrointestinal tract in humans (1). GISTs account for 2.2% of the morbidity
associated with malignant tumors of the gastrointestinal tract
(2). Although imatinib mesylate (IM)
has been revolutionary in the treatment of advanced GISTs, clinical
resistance to IM is an issue for patients that require prolonged
treatment (3,4).
Long non-coding RNAs (lncRNAs) have been
demonstrated to mediate a number of pathophysiological processes.
lncRNAs are key regulators of important biological processes
involved in development and differentiation (5,6). Previous
studies have identified that lncRNAs exhibit active roles in
modulating the cancer epigenome and may be important targets for
cancer diagnosis and therapy (7–11). It has
been revealed that lncRNAs may promotes GIST progression and
metastasis (12). The lncRNA HOX
transcript antisense RNA (HOTAIR) is upregulated in GISTs and can
promote GIST cell invasiveness in vitro (13). Using a gene microarray, Lee et
al (13) identified that
protocadherin 10 (PCDH10) is a key target of HOTAIR. HOTAIR could
regulate promoter methylation of PCDH10 and promote GIST cell
invasion and migration. However, to the best of our knowledge,
little is known regarding the role of other lncRNAs in GIST.
Imatinib is the first line of therapy for patients
with metastatic or end-stage GISTs; however, drug resistance limits
the long-term curative effect of imatinib (14,15).
Numerous studies have demonstrated that lncRNAs, including
urothelial carcinoma-associated 1 and HOTAIR, serve a role in
promoting acquired resistance to imatinib in chronic myeloid
leukemia cells (16,17). lncRNAs also serve an important role in
regulating imatinib resistance in GISTs, CCDC26 lncRNA knockdown
can induce imatinib resistance in GIST cells by downregulating
c-KIT expression (18). It has been
identified that the malignant character of GISTs is initiated and
amplified by PCDH10 in a process regulated by HOTAIR lncRNA
(13).
The aim of the current study was to screen
differentially expressed lncRNAs associated with GISTs and IM
secondary resistance. This screening was performed to identify
candidate lncRNAs that may serve as targets for reversing drug
resistance or as biomarkers for predicting and preventing imatinib
secondary resistance.
Materials and methods
Clinical samples
Tumor tissues (≥5 cm) and normal gastric tissues
were obtained from 9 patients (mean, 56; range, 39–70-years), 4
male and 5 female, who underwent surgical resection between
December 2015 and August 2016 at The First Affiliated Hospital of
Wenzhou Medical University (Zhejiang, China). Tissue samples
included three normal gastric tissue samples (N), three primary
GIST samples (Y or YC) and three GIST samples secondarily resistant
to IM (C). The GIST samples included the standard resection of
GISTs performed on these patients, and treatment with a 400-mg
daily dose of imatinib was applied for the postoperative period.
These patients underwent surgery again owing to GIST recurrence,
and the daily dose of imatinib was increased to 800 mg,
postoperatively. A third surgical resection was carried out owing
again to GIST recurrence and these samples were collected. The
current study was approved by the Ethics Committee of The First
Affiliated Hospital of Wenzhou Medical University and informed
written consent was obtained from the patients prior to
surgery.
Immunohistochemistry analysis
All tumor tissues were confirmed to be malignant
GISTs by pathological examination and immunohistochemistry
(CD117+, CD34+, mitotic phase >5/50
high-power field). Paraffin-embedded tissues (thickness, 3.5 µg)
were fixed with 10% formalin at 23–26°C for 12–24 h. Tissues were
subsequently incubated with CD117 rabbit anti-human antibody
(dilution 1:800; cat. no., Kit-0029; Fuzhou Maixin Biotech Co.,
Ltd., Fuzhou, China) and CD34 rat anti-human antibody (dilution
1:600; cat. no., Kit-0004; Fuzhou Maixin Biotech Co., Ltd.)
incubated overnight at 4°C. Sections were subsequently inclubated
with secondary antibody peroxidase-labelled polymer conjugated to
goat antirabbit IgG (dilution, 1:500; cat. no., Kit-0014; Fuzhou
Maixin Biotech Co., Ltd.) sections were incubated for 30 min at
37°C. All samples were stored in liquid nitrogen until further
experiments.
RNA extraction and chip
hybridization
The MirVanaTM RNA Isolation kit (Thermo Fisher
Scientific, Inc., Waltham, MA, USA) was used for RNA extraction
from the 9 tissue samples. The total RNA was quantified using a
NanoDrop ND-2000 (Thermo Fisher Scientific, Inc.) and the integrity
of the RNA was determined using an Agilent 2100 Bioanalyzer system
(Agilent Technologies, Inc., Santa Clara, CA, USA). The microarray
experiments were performed by OeBiotech Corporation (Shanghai,
China). The Human OE lncRNA Microarray Technology (Affymetrix;
Thermo Fisher Scientific, Inc.), which contains 63,542 lncRNAs and
27,134 mRNAs, was used. The sample labeling, microarray
hybridization and washing were performed according to the
manufacturer's protocol. Briefly, the total RNA was transcribed
into double-stranded complementary DNA (cDNA) and then synthesized
into complementary RNAs (cRNA). Subsequently, second-cycle cDNAs
were synthesized from the cRNAs. Following fragmentation and biotin
labeling, the second-cycle cDNAs were hybridized onto the
microarray. Following washing and staining, the arrays were scanned
on the GeneChip Scanner 3000 system (Affymetrix; Thermo Fisher
Scientific, Inc.).
Data analysis
Data extraction and standardization were performed
using GeneSpring GX 13.1 software (Agilent Technologies, Inc.).
Differentially expressed genes and lncRNAs were screened using an
unpaired Student's t-test. The cut-off criteria for selecting
differentially expressed mRNAs and lncRNAs was a fold-change (FC)
in expression of ≥2.0 and P≤0.05. Hierarchical clustering was
performed using GeneSpring GX 11.5.1 software (Agilent
Technologies, Inc.). Subsequently, Gene Ontology (GO) enrichment
and Kyoto Encyclopedia of Genes and Genomes (KEGG) pathway analysis
was performed to determine the putative roles of the differentially
expressed mRNAs and lncRNAs.
Co-expression analysis of lncRNAs and
mRNAs
The co-expression of the differentially expressed
lncRNAs and mRNAs was evaluated by Pearson's correlation
coefficient analysis. P≤0.05 and a correlation coefficient of
>0.7 indicated a statistically significant correlation between
the expression of lncRNA and mRNA. The overlap of the co-expressed
mRNA set and the transcription factor (TF) target gene set was
calculated based on the hypergeometric distribution. The TFs used
for analysis were obtained from database ENCODEPROJECT (https://www.encodeproject.org/), and the method
refers to the TF enrichment analysis in DAVID database (https://david.ncifcrf.gov/). If the co-expressed mRNAs
of the given lncRNAs overlapped with the target genes of the given
TFs, the TFs were considered to be interacting with the lncRNAs.
The lncRNA-TF-mRNA interactions were used to construct networks
using Cytoscape (version 3.11; cytoscape.org). The function of each lncRNA
co-expressed with an mRNA was analyzed using GO enrichment and KEGG
pathway analyses based on hypergeometric distribution.
Quantitative analysis
Reverse transcription-quantitative polymerase chain
reaction (RT-qPCR) was used to validate 6 lncRNAs by random
selection. Total RNA was extracted from cancer tisuss using TRIzol™
Reagent (Invitrogen; Thermo Fisher Scientific, Inc.). First-strand
cDNA was generated using a Reverse Transcription System kit
(Promega Corporation, Madison, WI, USA), according to the
manufacturer's protocols. Quantification was performed with a
two-step reaction process: RT and PCR. Each RT reaction consisted
of two steps. The first step was 0.5 µg RNA, 2 µl of 4X gDNA wiper
Mix and the addition of nuclease-free H2O to 8 µl.
Reactions were performed in a GeneAmp® PCR System 9700
(Applied Biosystems; Thermo Fisher Scientific, Inc.) for 2 min at
42°C. The second step was adding 2 µl of 5X HiScript II Q RT
SuperMix IIa. Reactions were performed in a GeneAmp® PCR
System 9700 (Applied Biosystems; Thermo Fisher Scientific, Inc.)
for 10 min at 25°C; 30 min at 50°C and 5 min at 85°C. The 10 µl RT
reaction mix was subsequently diluted × 10 in nuclease-free water
and held at −20°C for 10 sec. Reactions were incubated in a
384-well optical plate (Roche Diagnostics) at 95°C for 5 min,
followed by 40 cycles of 95°C for 10 sec, 60°C for 30 sec. Each
sample was run in triplicate for analysis. At the end of the PCR
cycles, melting curve analysis was performed to validate the
specific generation of the expected PCR product. The PCR was
performed using the SYBR Green Premix DimerEraser kit (Takara Bio,
Inc., Otsu, Japan) on the Roche LightCycler 480 Instrument II
(Roche Diagnostics) with 10 µl PCR reaction mixture that included 1
µl of cDNA, 5 µl of 2X QuantiFast® SYBR®
Green PCR Master Mix (Qiagen GmbH, Hilden, Germany), 0.2 µl of
forward primer, 0.2 µl of reverse primer and 3.6 µl of
nuclease-free water. The relative gene expression was analyzed
using the 2−ΔΔCq method (19). Primer sequences are presented in
Table I.
 | Table I.Primer sequences used for reverse
transcription-quantitative polymerase chain reaction. |
Table I.
Primer sequences used for reverse
transcription-quantitative polymerase chain reaction.
| lncRNA | Direction | Primer
sequences |
|---|
| lnc-TERT-2 | Forward |
5′-GTGAACTACAAGGTAAGGCG-3′ |
|
| Reverse |
5′-ACTTCAACTGAAACAGGAGAG-3′ |
| lnc-OMD-1 | Forward |
5′-TCTTCCTCCCAAGCTCAC-3′ |
|
| Reverse |
5′-GCTGAATGAGCCTAATAGGATG-3′ |
| lnc-ATP7A-2 | Forward |
5′-CAAAGCTCTCATGGATGAGG-3′ |
|
| Reverse |
5′-CTGCCAGCTTATATGGGTATT-3′ |
| lnc-TCF4-6 | Forward |
5′-TATGGCAAATCTGCCTGTTCA-3′ |
|
| Reverse |
5′-GCCTCATAGACAATGGATACGA-3′ |
| lnc-RERE-4 | Forward |
5′-CATAATTCTAACCTGCCCGC-3′ |
|
| Reverse |
5′-TTCTTCAAAGGTCCAGAGAGT-3′ |
| lnc-SNRPN-2 | Forward |
5′-ACTTTTTGAGTGCATAAGGGT-3′ |
|
| Reverse |
5′-ACTTCAAACACTGTATCCTCAA-3′ |
| lnc-FAM108B1-3 | Forward |
5′-GCTACTTCCCTATTCTGAAAAG-3′ |
|
| Reverse |
5′-TGACCCATGTGTTTCAATTCC-3′ |
| ACTB | Forward |
5′-CCATCATGAAGTGTGACG-3′ |
|
| Reverse |
5′-GCCGATCCACACGGAGTA-3′ |
Statistical analysis
All experimental data were presented as the mean ±
standard deviation and analyzed using GraphPad Prism 5.0 software
(GraphPad Software, Inc., La Jolla, CA, USA). Significance was
analyzed using an unpaired Student's t-test. P<0.05 was
considered to indicate a statistically significant difference.
Results
Differentially expressed mRNAs and
lncRNAs
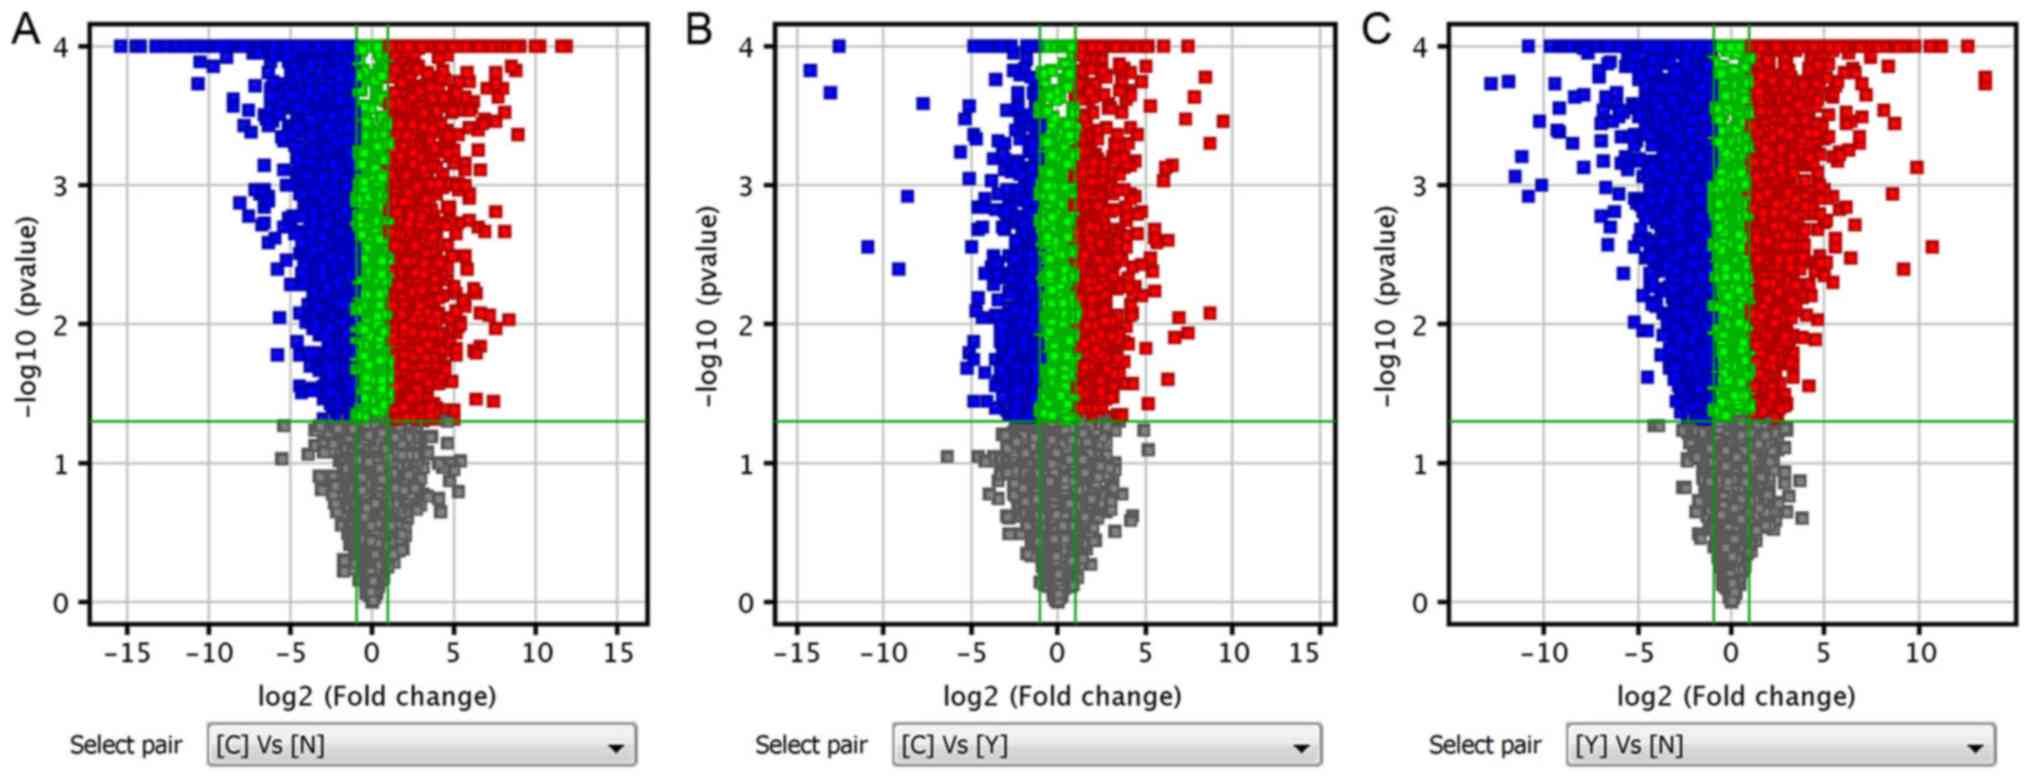
Differentially expressed mRNAs and lncRNAS were
selected according to the following criteria: FC ≥2.0 and P≤0.05
(Tables II and III). Volcano plots, containing
differentially expressed mRNAs and lncRNAs, were generated based on
the P-values and FC values, and were used to demonstrate the
differentially expressed mRNAs and lncRNAs between two groups of
data (Fig. 1).
| Table II.Top ten differentially expressed
mRNAs for each comparison. |
Table II.
Top ten differentially expressed
mRNAs for each comparison.
| Gene symbol | P-value | Fold-change | Regulation |
|---|
| C vs. N |
|
DPP10 |
7.85×10⁻⁶ | 3,029.7207 | Upregulated |
|
CSRP1 |
2.43×10⁻⁵ | 1,280.9022 | Downregulated |
|
TPM1 |
1.21×10⁻⁴ | 465.1485 | Downregulated |
|
PALLD |
9.82×10⁻⁵ | 463.9496 | Downregulated |
|
KIT |
1.04×10⁻⁵ | 454.6385 | Upregulated |
|
PLAT |
5.23×10⁻⁵ | 415.0655 | Upregulated |
|
ANO1 |
9.09×10⁻⁶ | 397.9115 | Upregulated |
|
SLMAP |
1.18×10⁻⁵ | 372.9152 | Downregulated |
|
MYL9 |
6.12×10⁻⁵ | 258.0424 | Downregulated |
|
RGS5 |
3.75×10⁻⁴ | 226.5819 | Downregulated |
| C vs. Y |
|
OGN |
3.51×10⁻⁴ | 731.1902 | Upregulated |
|
CLPTM1L |
3.42×10⁻⁴ | 157.8434 | Upregulated |
|
LDHA |
2.51×10⁻³ | 83.7515 | Upregulated |
|
TM4SF1 |
9.60×10⁻⁴ | 69.0364 | Upregulated |
|
BHLHE40 |
3.76×10⁻⁵ | 67.7466 | Upregulated |
|
MT1X |
2.60×10⁻³ | 52.4122 | Upregulated |
|
MT2A |
2.42×10⁻³ | 49.3582 | Upregulated |
| C7 |
5.81×10⁻³ | 45.7806 | Upregulated |
|
SPP1 |
3.40×10⁻³ | 39.3369 | Upregulated |
|
TMEM45A |
2.78×10⁻⁴ | 38.8151 | Upregulated |
| Y vs. N |
|
DPP10 |
9.41×10⁻⁶ | 2,421.0703 | Upregulated |
|
CNN1 |
3.59×10⁻⁴ | 1,231.3666 | Downregulated |
|
MYH11 |
1.04×10⁻³ | 1,125.5151 | Downregulated |
|
TPM1 |
2.88×10⁻⁴ | 589.9242 | Downregulated |
|
PALLD |
5.93×10⁻⁶ | 583.9103 | Downregulated |
|
PLAT |
7.13×10⁻⁵ | 558.9153 | Upregulated |
|
ANO1 |
2.64×10⁻⁶ | 457.2661 | Upregulated |
|
F2RL2 |
3.66×10⁻⁴ | 436.2676 | Upregulated |
|
KIT |
8.03×10⁻⁶ | 372.8208 | Upregulated |
|
SORBS1 |
5.04×10⁻⁴ | 354.0606 | Downregulated |
| Table III.Top ten differentially expressed
lncRNAs for each comparison. |
Table III.
Top ten differentially expressed
lncRNAs for each comparison.
| Gene symbol | P-value | Fold-change | Regulation |
|---|
| C vs. N |
|
lnc-FADD-2 |
3.54×10⁻⁶ | 374.60214 | Upregulated |
|
lnc-TERT-2 |
1.77×10⁻⁵ | 326.4259 | Upregulated |
|
lnc-LPP-2 |
9.15×10⁻⁶ | 227.83163 | Downregulated |
|
lnc-PHLDA3-3 |
1.38×10⁻⁵ | 213.00255 | Downregulated |
|
lnc-GPR108-2 |
3.20×10⁻⁴ | 99.080215 | Downregulated |
|
lnc-DIRC3-4 |
1.65×10⁻⁵ | 91.854065 | Downregulated |
|
lnc-C3orf80-3 |
5.60×10⁻⁶ | 79.911095 | Upregulated |
|
lnc-C11orf89-3 |
7.06×10⁻⁵ | 77.44088 | Upregulated |
|
lnc-CFH-2 |
2.51×10⁻⁴ | 74.221596 | Upregulated |
|
lnc-CFHR3-1 |
1.31×10⁻⁵ | 71.0337 | Upregulated |
| C vs. Y |
|
lnc-TERT-2 |
5.72×10⁻⁵ | 169.64801 | Upregulated |
|
lnc-OMD-1 |
7.32×10⁻⁴ | 95.35182 | Upregulated |
|
lnc-ATP7A-2 |
7.29×10⁻⁶ | 31.169392 | Upregulated |
|
lnc-TCF4-6 |
2.13×10⁻³ | 23.001923 | Downregulated |
|
lnc-RERE-4 |
6.76×10⁻⁴ | 21.957548 | Upregulated |
|
lnc-TCP1-5 |
3.99×10⁻³ | 20.307957 | Upregulated |
|
lnc-SNRPN-2//RP11-701H24.7//NONHSAG016304 |
2.28×10⁻² | 18.521355 | Downregulated |
|
lnc-FAM108B1-3 |
7.44×10⁻⁴ | 17.824202 | Upregulated |
|
lnc-C15orf54-4//CTD-2033D15.2//NONHSAG016560 | 1.04
×10−2 | 15.087145 | Upregulated |
|
lnc-ATP7A-1 |
2.44×10⁻⁴ | 14.85991 | Upregulated |
| Y vs. N |
|
lnc-SIDT2-1 |
4.30×10⁻⁴ | 610.91364 | Downregulated |
|
lnc-FADD-2 |
2.85×10⁻⁶ | 597.95306 | Upregulated |
|
lnc-RP1-177G6.2.1–2 |
1.50×10⁻⁷ | 522.8559 | Downregulated |
|
lnc-DYNC2LI1-1 |
1.60×10⁻⁶ | 469.5526 | Upregulated |
|
CDR1-AS//lnc-RP1-177G6.2.1–3//NONHSAG055442 |
1.89×10⁻¹¹ | 196.92441 | Downregulated |
|
lnc-LPP-2 |
3.19×10⁻⁵ | 175.79048 | Downregulated |
|
lnc-C11orf89-3 |
2.42×10⁻⁵ | 146.4682 | Upregulated |
|
lnc-RPH3AL-2 |
2.29×10⁻⁴ | 146.42218 | Upregulated |
|
lnc-CFH-2 |
4.91×10⁻⁵ | 116.60803 | Upregulated |
|
lnc-SLC27A6-3 |
2.86×10⁻⁵ | 104.92543 | Upregulated |
As presented in Table
IV, 3,070 differentially expressed mRNAs were identified
between group C and N, including 1,836 upregulated mRNAs and 1,234
downregulated mRNAs. In addition, 2,209 differentially expressed
lncRNAs were revealed between group C and N, including 1,299
upregulated lncRNAs and 910 downregulated lncRNAs. Between group C
and Y, 1,315 differentially expressed mRNAs were identified,
including 933 upregulated mRNAs and 382 downregulated mRNAs. In
addition, 922 lncRNAs were differentially expressed between group C
and Y, including 493 upregulated lncRNAs and 429 downregulated
lncRNAs. Between group Y and N, 2,712 differentially expressed
mRNAs were revealed, including 1,213 upregulated mRNAs and 1,499
downregulated mRNAs. Between group Y and N, 2,250 lncRNAs were
identified to be differentially expressed, including 1,241
upregulated lncRNAs and 1,009 downregulated lncRNAs.
| Table IV.Results of differential
screening. |
Table IV.
Results of differential
screening.
|
| mRNA | lncRNA |
|---|
|
|
|
|
|---|
| Comparison | Total, n | Upregulated, n | Downregulated,
n | Total, n | Upregulated, n | Downregulated,
n |
|---|
| C vs. N | 3,070 | 1,836 | 1,234 | 2,209 | 1,299 | 910 |
| C vs. Y | 1,315 | 933 | 382 | 922 | 493 | 429 |
| Y vs. N | 2,712 | 1,213 | 1,499 | 2,250 | 1,241 | 1,009 |
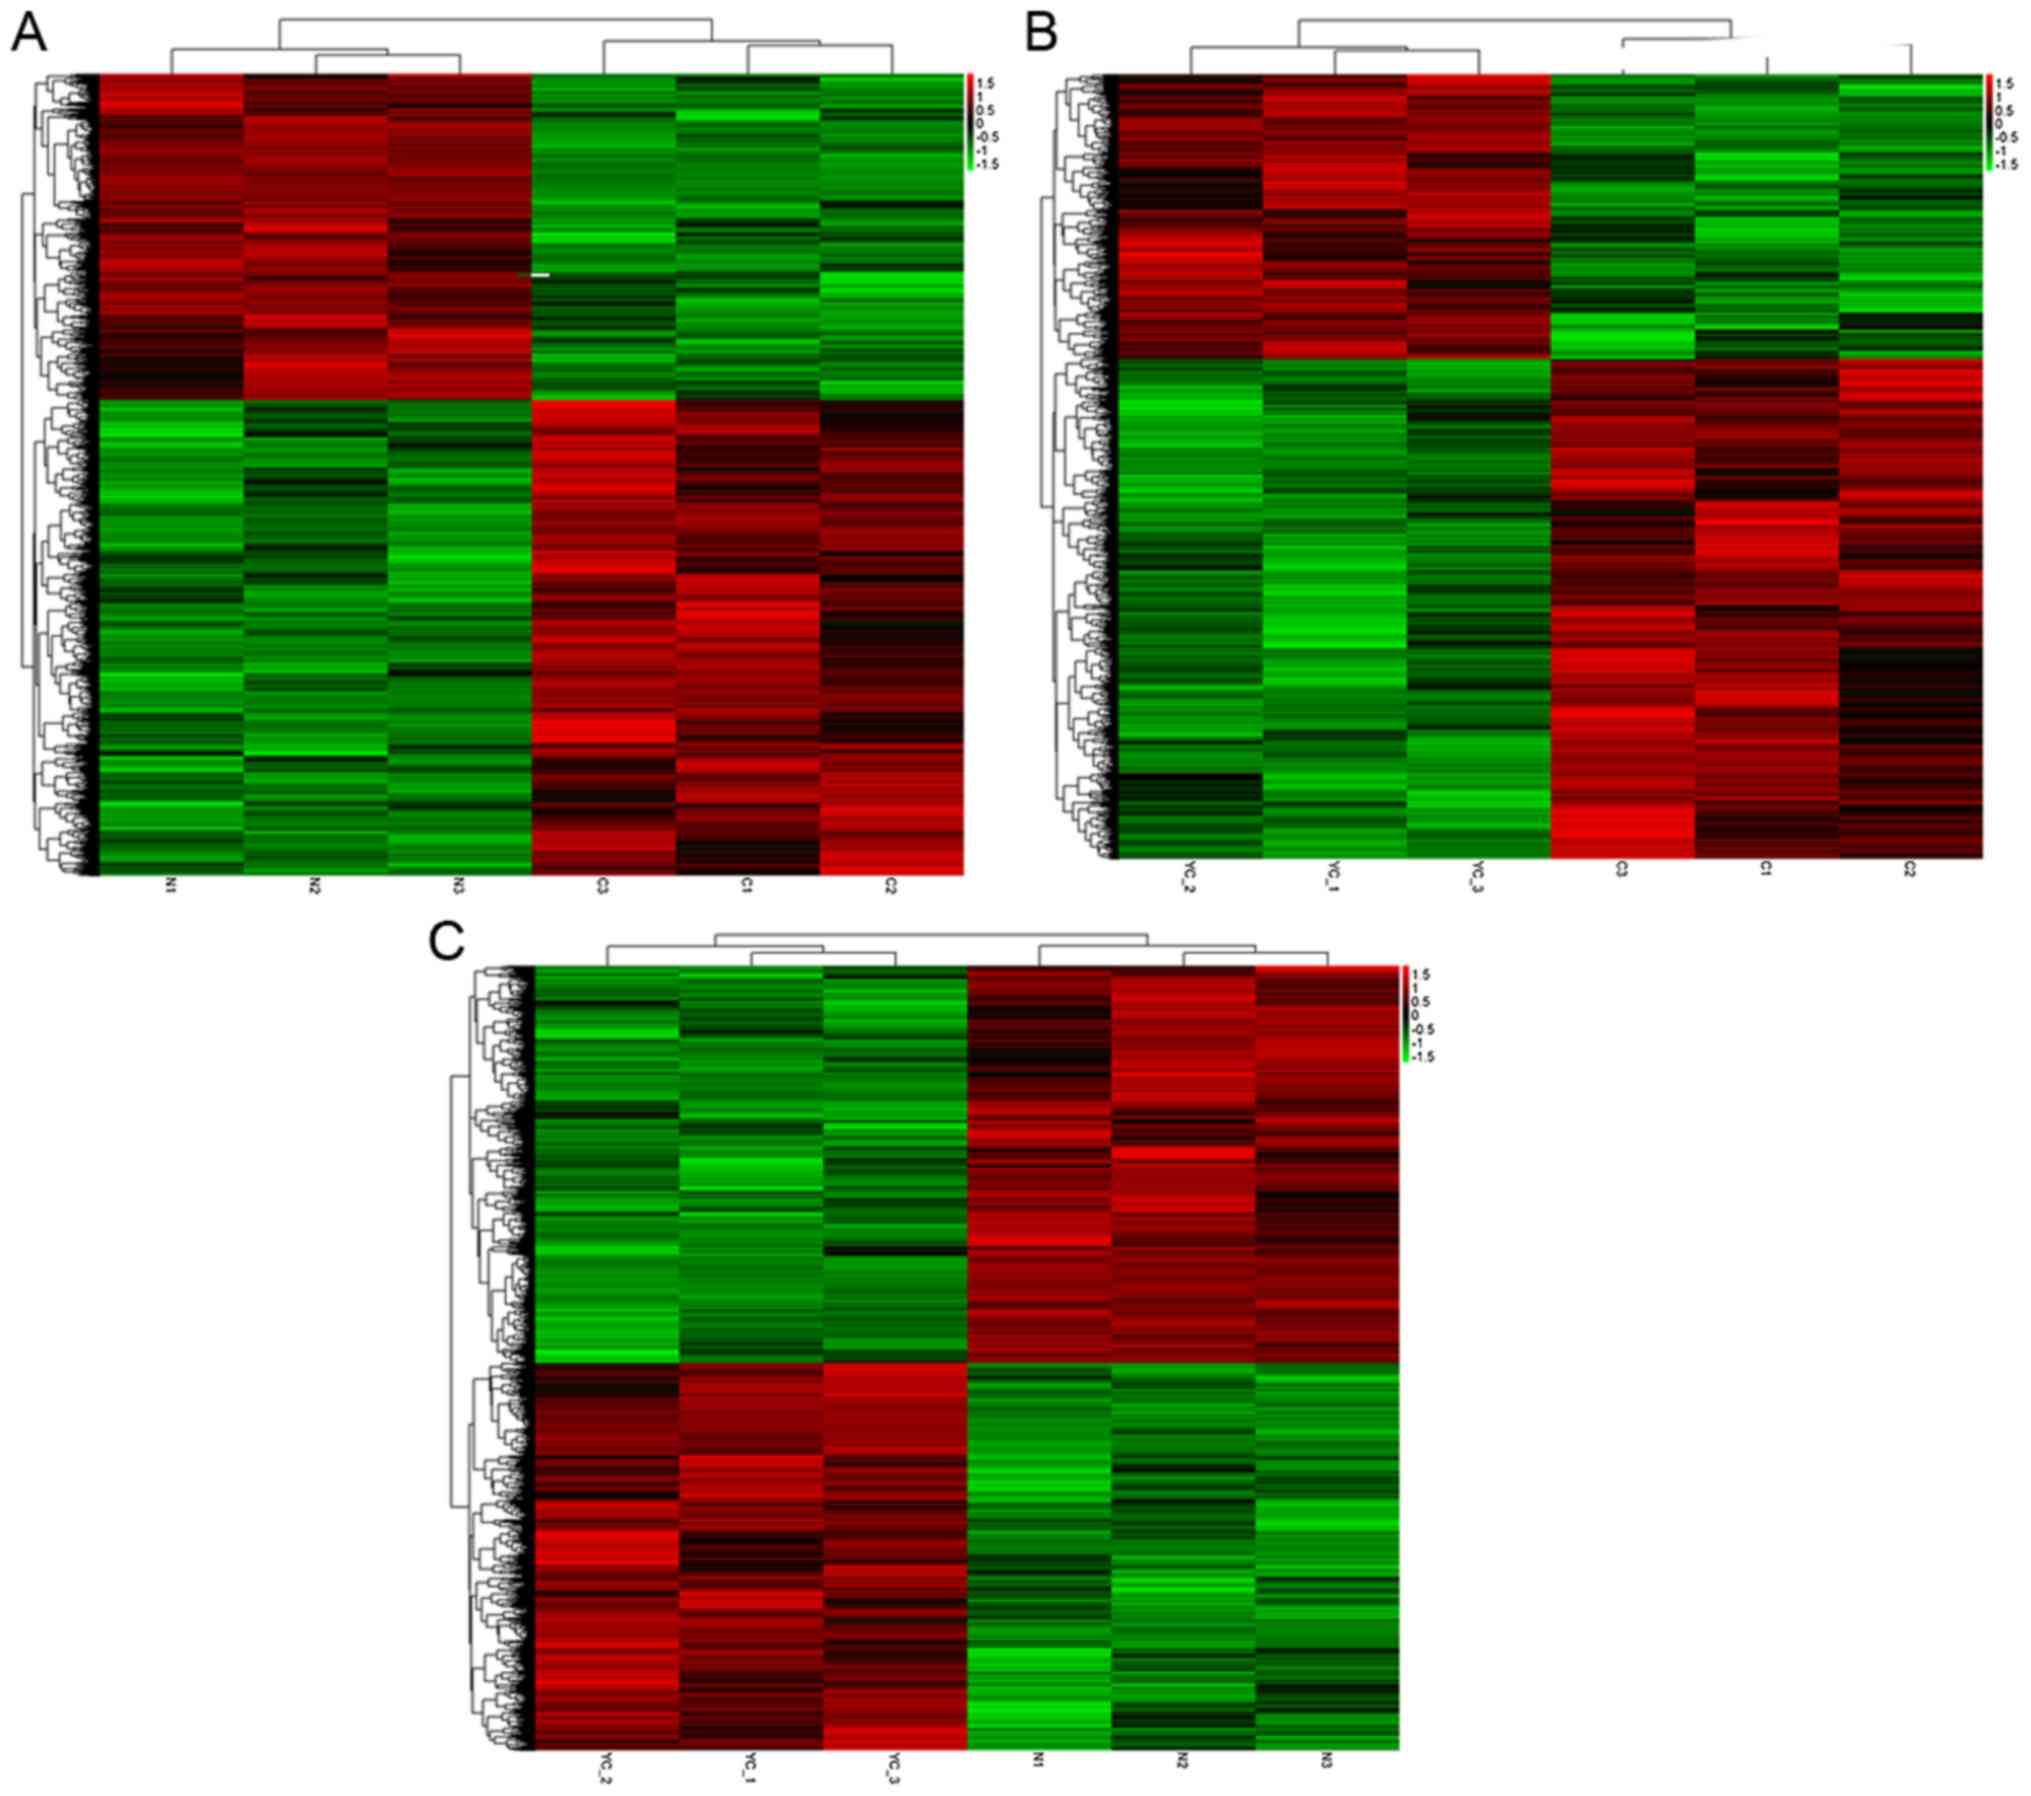
Cluster analysis of differentially
expressed mRNAs and lncRNAs
Hierarchical clustering was performed to reveal the
distinguishable gene expression patterns among samples (Fig. 2). Between the two groups (C vs. N; C
vs. Y and Y vs. N), a common set of downregulated and upregulated
genes were identified. The common differentially expressed genes
may be involved in the mechanisms of oncology and secondary
resistance.
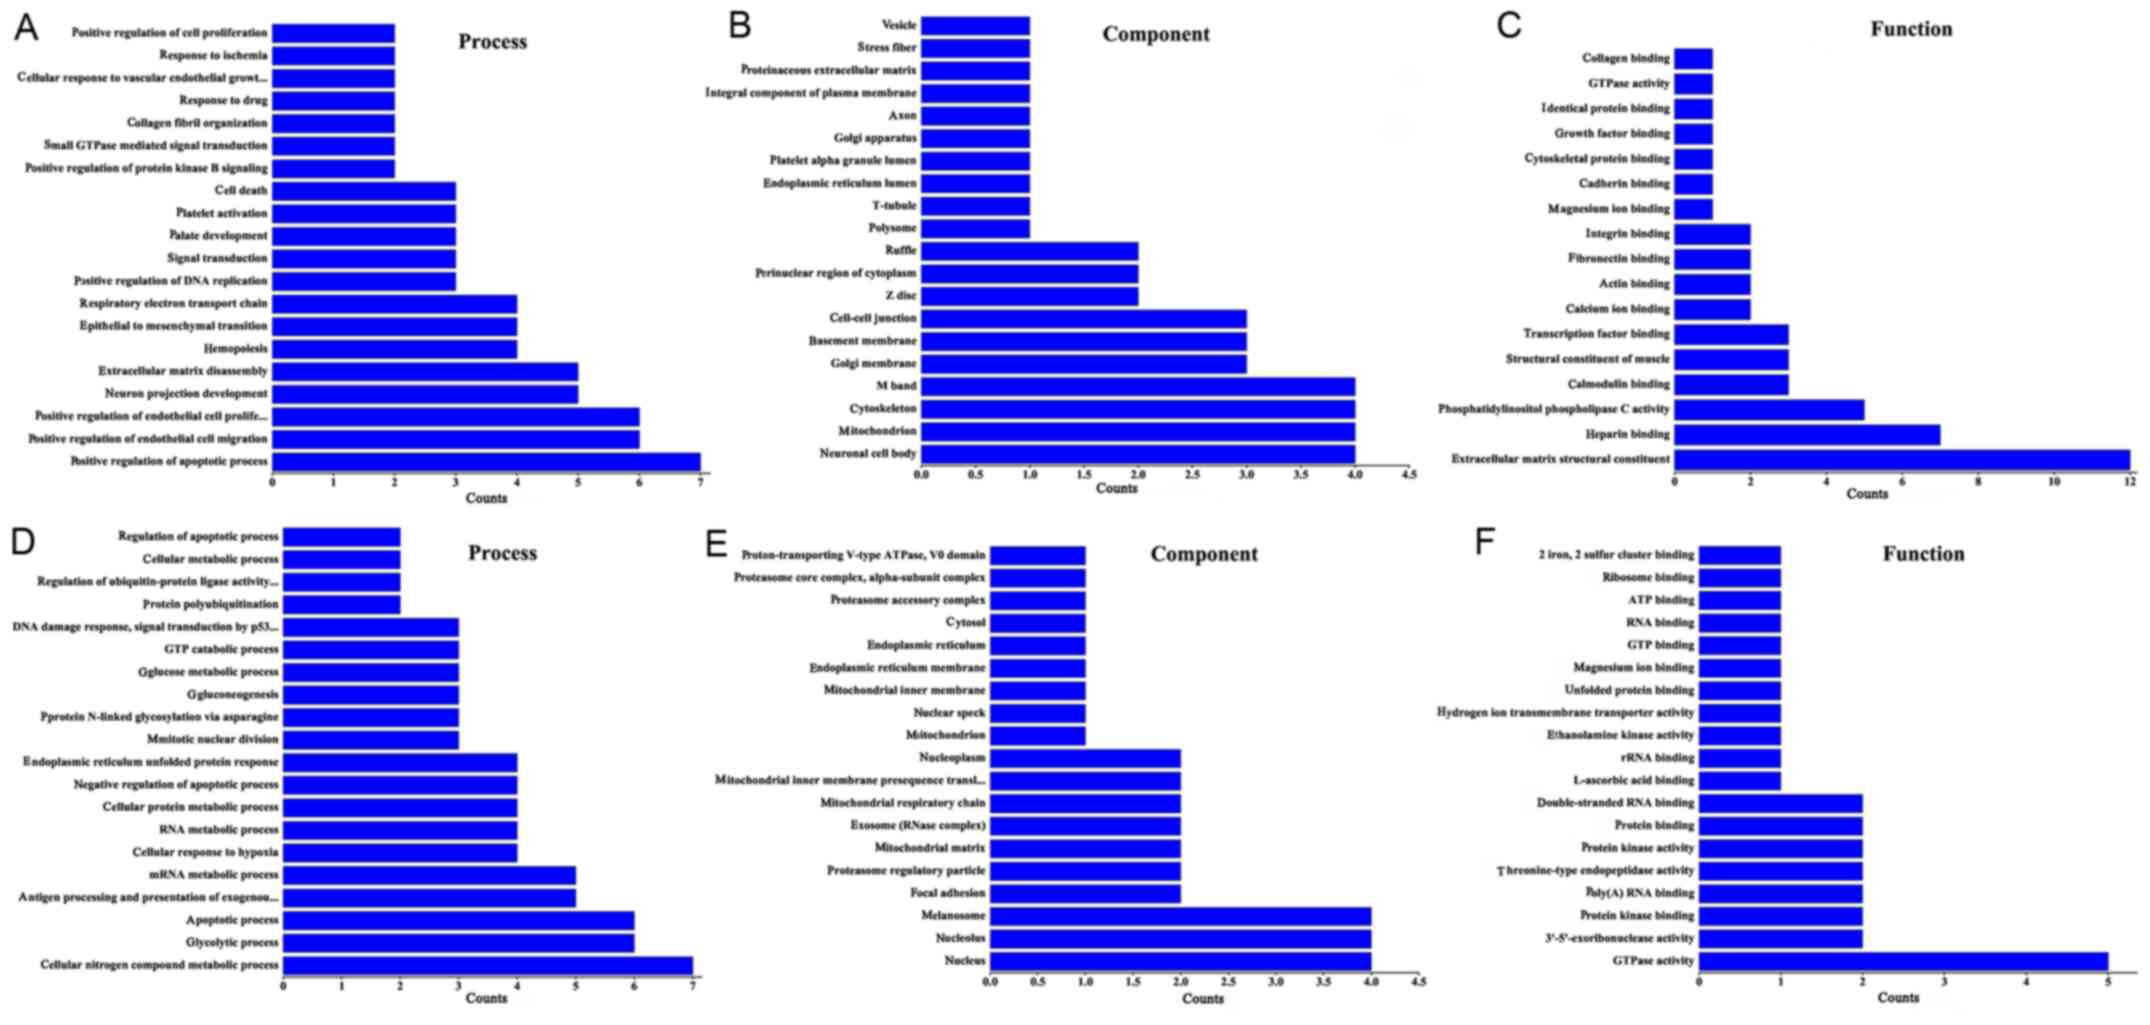
lncRNA function prediction
Using GO enrichment and KEGG pathway analysis the
functions of the differentially expressed lncRNAs were predicted.
In the GO biological processes classification, a number of
differentially expressed lncRNAs in group Y (primary GISTs)
compared with group N (normal tissues) were implicated in ‘positive
regulation of the apoptotic processes’, ‘extracellular matrix
disassembly’, ‘endothelial cell migration’, ‘cellular response to
vascular endothelial growth factor stimulus’, ‘DNA replication’ and
‘endothelial cell proliferation’. Numerous differentially expressed
lncRNAs were associated with the following cellular components: ‘M
band’, ‘cytoskeleton’, ‘neuronal cell body’, ‘mitochondria’ and
‘cell-cell junctions’. In addition, the differentially expressed
lncRNAs were associated with the following molecular function
terms: ‘Extracellular matrix structural constituents’, ‘heparin
binding’, ‘actin binding’, ‘fibronectin binding’ and
‘phosphatidylinositol phospholipase C activity’ (Fig. 3A-C).
GO enrichment analysis was also performed for the
differentially expressed lncRNAs identified between group C
(secondary imatinib mesylate-resistant GISTs) and group Y (primary
GISTs). It was identified that the lncRNAs were enriched in the
following processes: ‘Cellular nitrogen compound metabolism’,
‘apoptosis’, ‘glycolysis and glucose metabolism’, and ‘protein
polyubiquitination’. In addition, the lncRNAs were enriched in the
following cellular components: ‘Nucleus’, ‘endoplasmic reticulum’,
‘membrane’, ‘nucleolus’, ‘melanosome’ and ‘proteasome regulatory
particle’. Furthermore, the lncRNAs were associated with ‘GTPase
activity’, ‘threonine-type endopeptidase activity’, ‘ribosomal
structural constituents’, ‘protein kinase activity’ and ‘two iron,
two sulfur cluster binding’ (Fig.
3D-F).
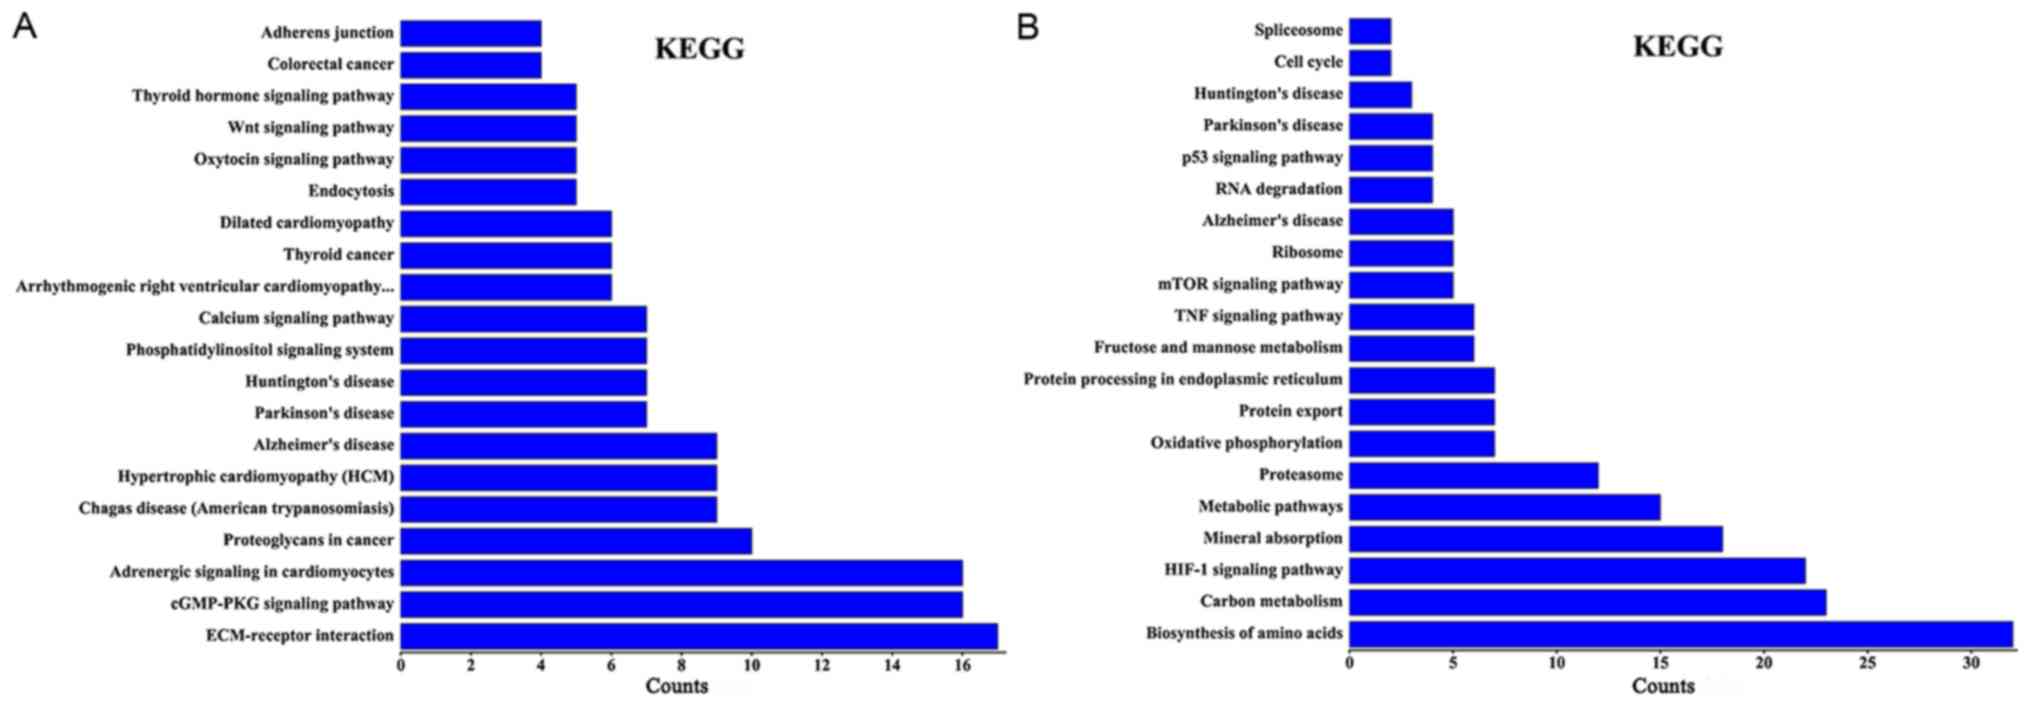
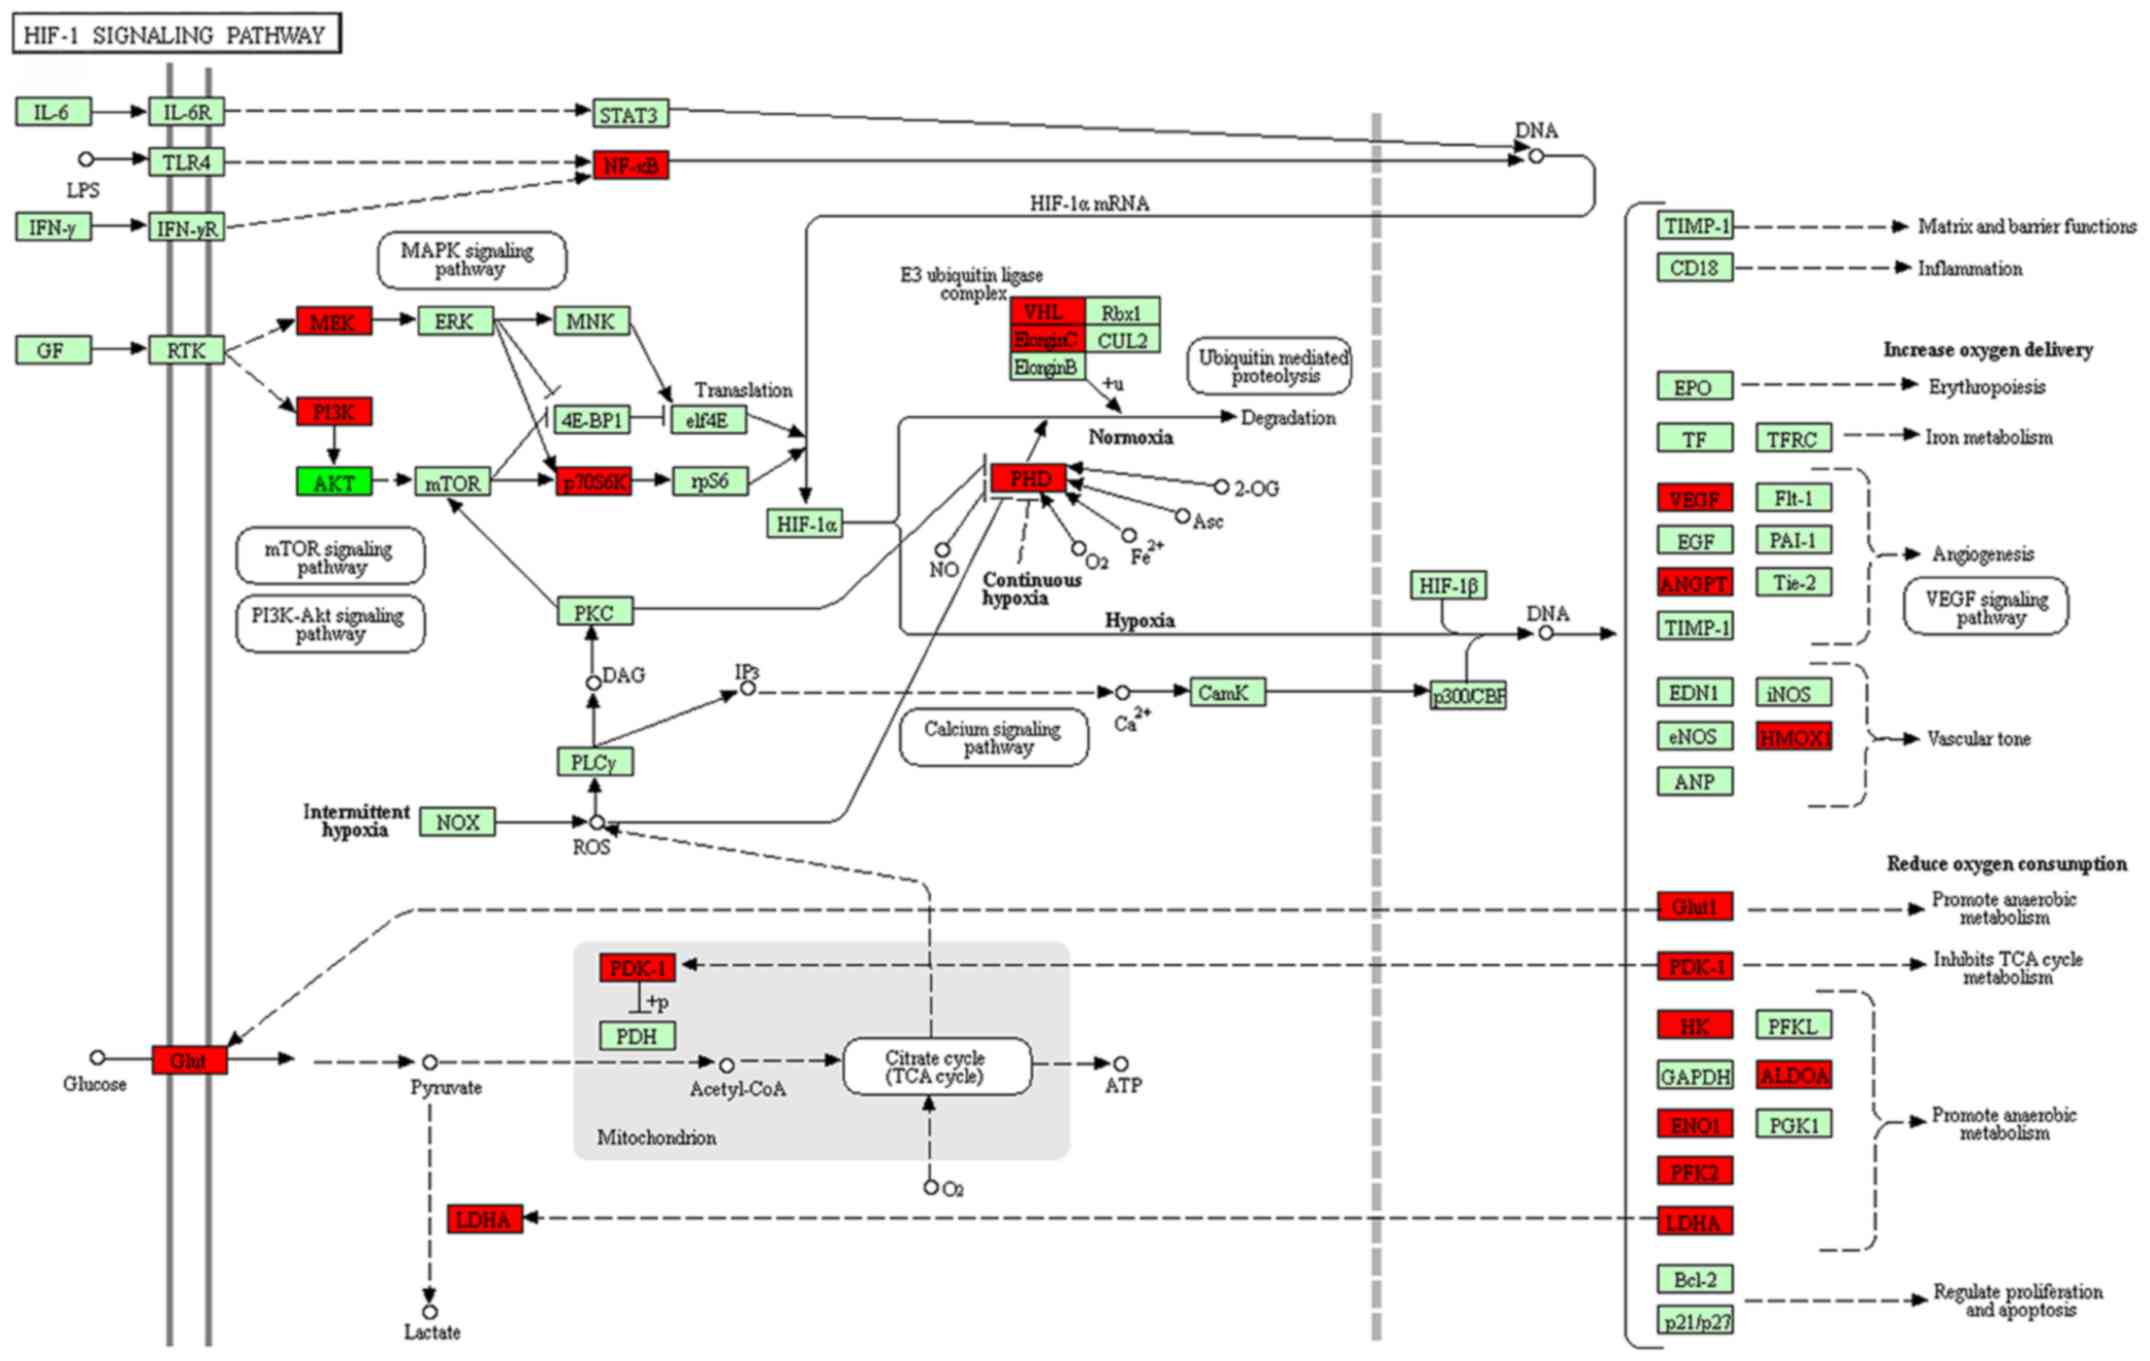
Using KEGG pathway analysis, it was revealed that
the differentially expressed lncRNAs in group Y (primary GISTs
tissues) compared with group N (normal tissues) were enriched in
the ‘cyclic guanosine monophosphate-protein kinase cGMP-dependent 1
(cGMP-PKG) signaling pathways’, ‘extracellular matrix-receptor
interactions’, ‘thyroid hormone signaling pathways’,
‘phosphatidylinositol signaling systems’ and ‘calcium signaling
pathways’. The activation of these signaling pathways through the
differentially expressed lncRNAs may be associated with GIST
occurrence. When group C (imatinib mesylate-resistant GISTs) was
compared with group Y (primary GISTs), the differentially expressed
lncRNAs were enriched in the ‘hypoxia-inducible factor-1 (HIF-1)
signaling pathway’, ‘amino acids biosynthesis’, ‘metabolic
pathways’, the ‘tumor necrosis factor (TNF) signaling pathway’, the
‘mammalian target of rapamycin (mTOR) signaling pathway’ and the
‘p53 signaling pathway’ (Fig. 4).
Certain lncRNAs may serve a role in the activation of these
signaling pathways and may be associated with secondary resistance
to imatinib.
lncRNA-TF-mRNA network analysis
Using the hypergeometric distribution calculation, a
number of lncRNA-TF associations were identified for each
differentially expressed lncRNA. Each lncRNA-TF association was the
result of multiple gene enrichment. A two-association network graph
was constructed of the lncRNA-TF associations for the top 100
differentially expressed lncRNAs. In addition, a three-association
network graph was constructed using the top 10 differentially
expressed lncRNAs.
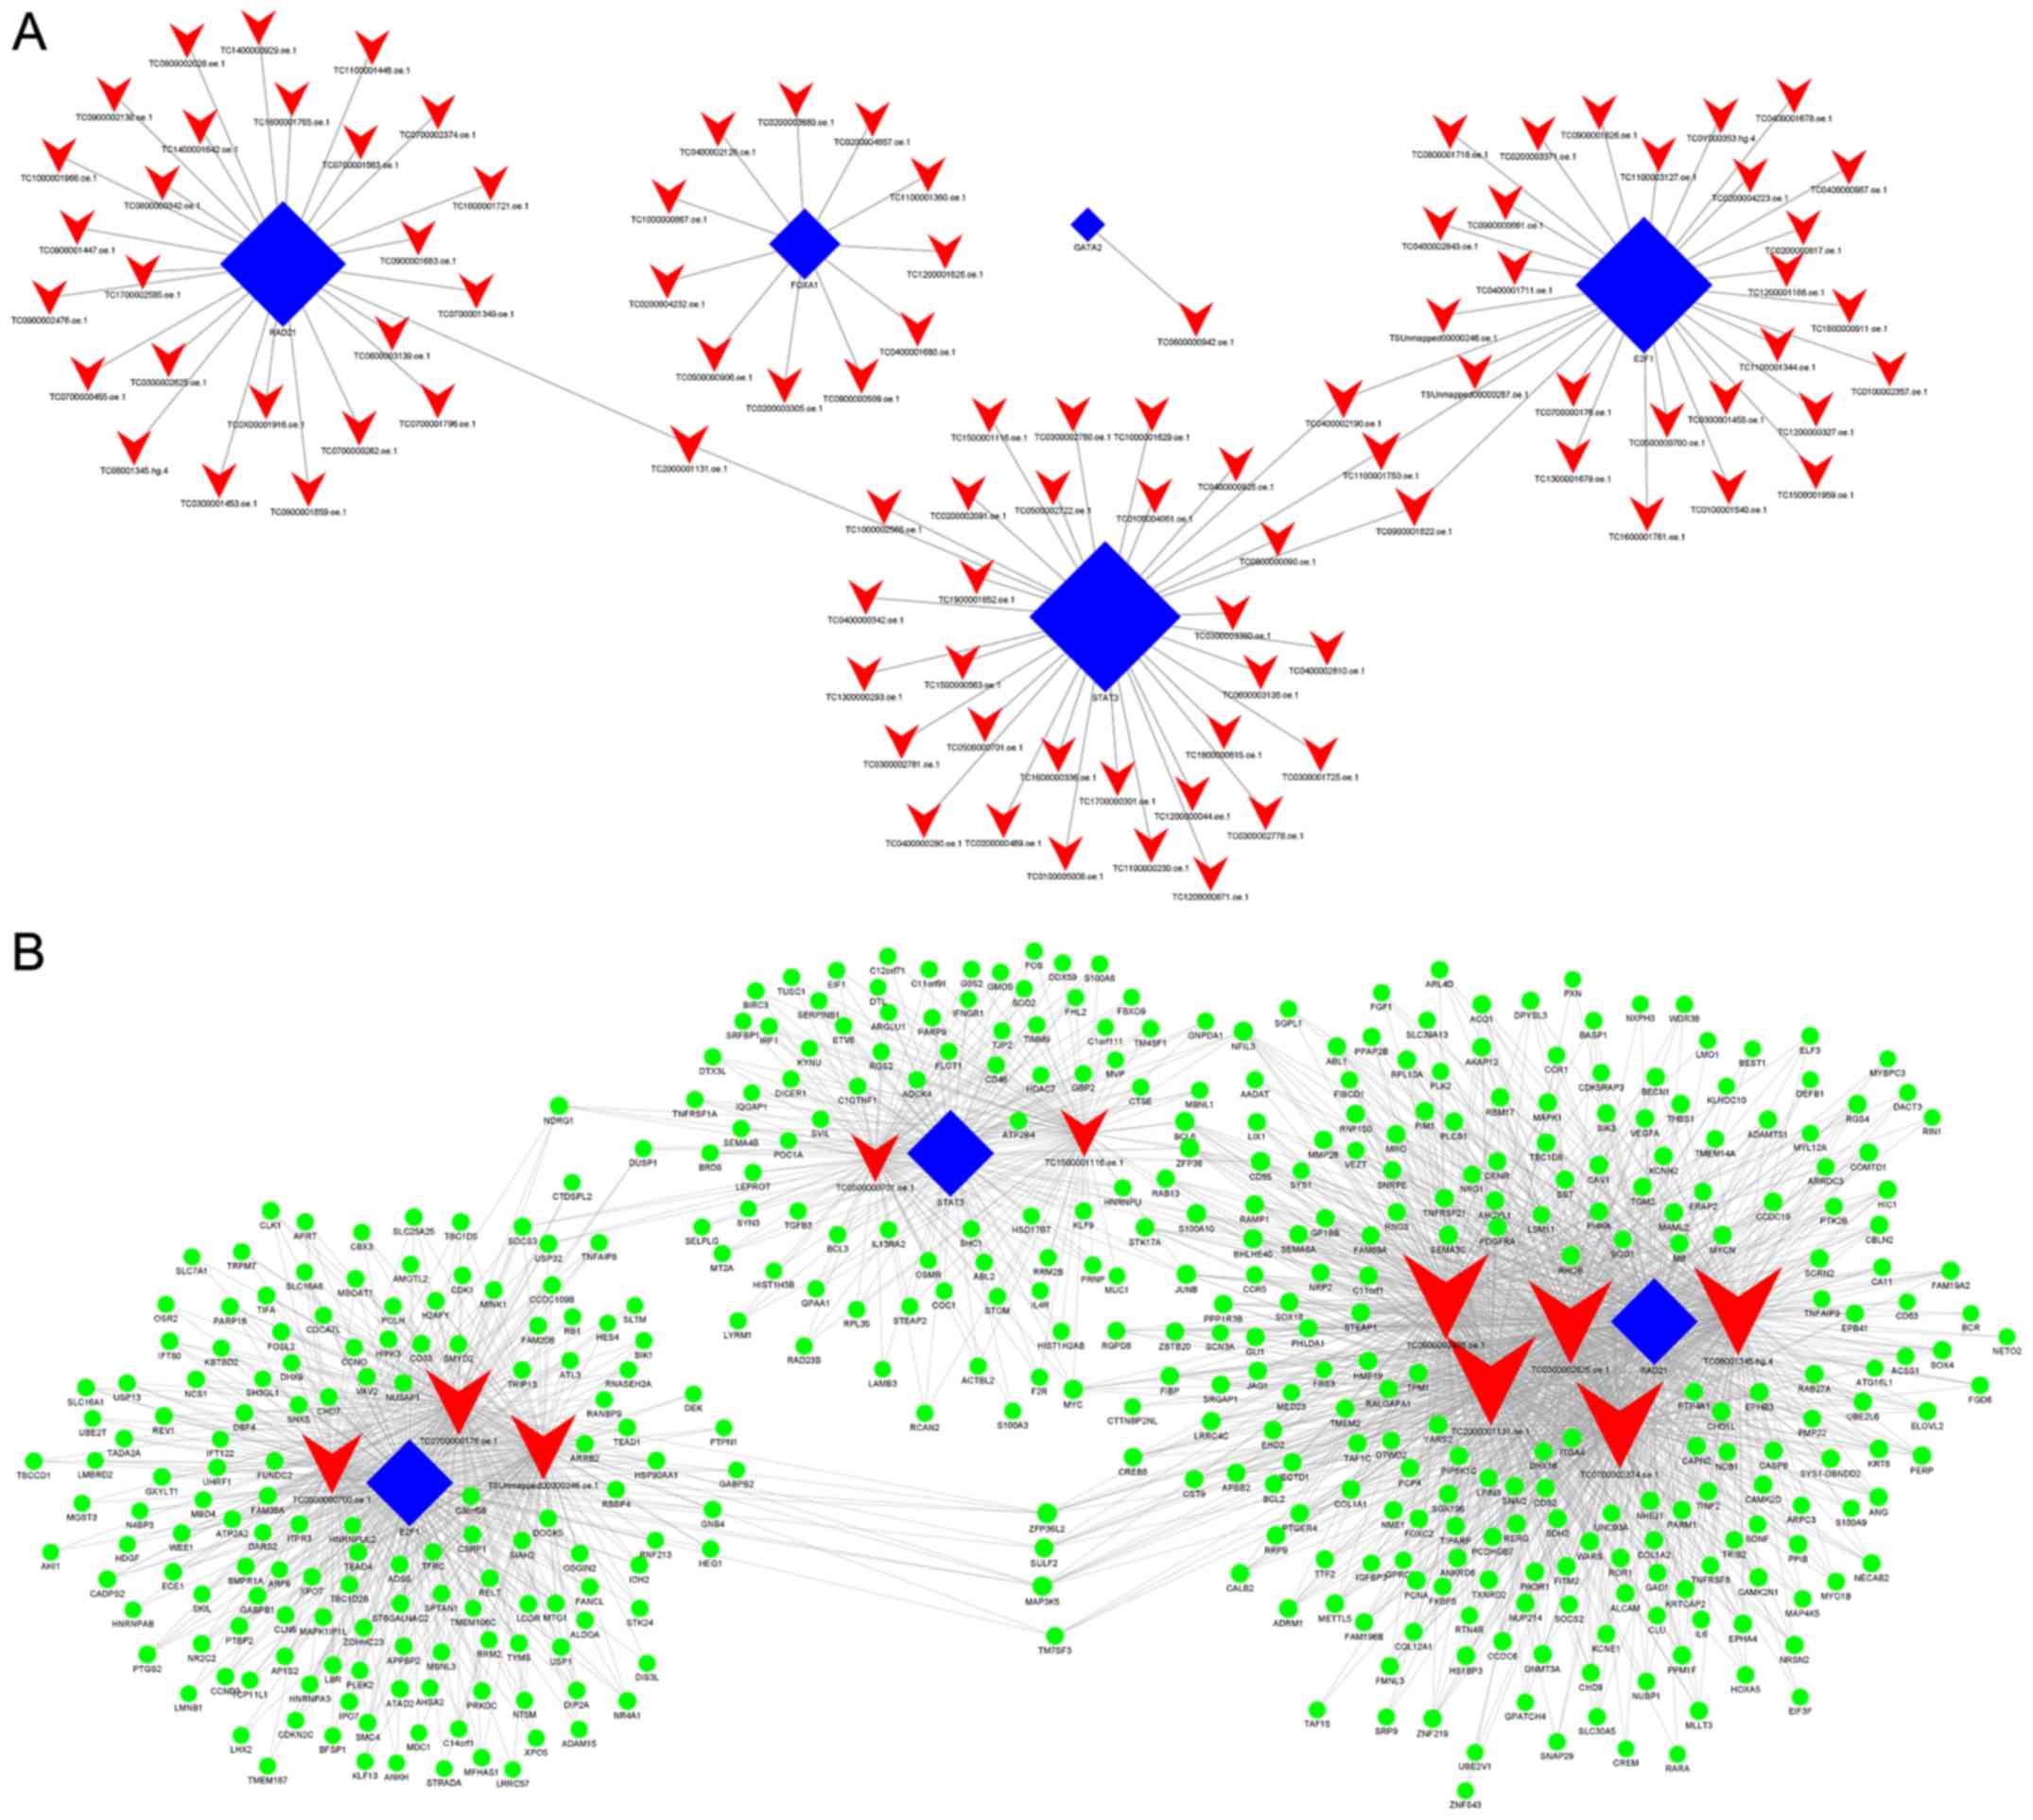
When comparing group Y (primary GISTs) with group N
(normal tissues), it was identified that E2F1, GATA2, STAT3, RAD21
and FOXA1 were the most highly connected TFs, which indicates these
TFs may be associated with the occurrence of GISTs (Fig. 5A; Table
V).
| Table V.Most highly connected TFs in the long
non-coding RNA-TF network when comparing normal gastric tissue
samples and primary gastrointestinal stromal tumor samples. |
Table V.
Most highly connected TFs in the long
non-coding RNA-TF network when comparing normal gastric tissue
samples and primary gastrointestinal stromal tumor samples.
| TF | Node frequency,
n |
|---|
| E2F1 | 29 |
| GATA2 | 1 |
| STAT3 | 33 |
| RAD21 | 26 |
| FOXA1 | 11 |
Furthermore, when comparing group Y (primary GISTs)
with group N (normal tissues), it was revealed that lnc-SLA2-2,
ZFHX4-AS1, lnc-GNAT3-4, lnc-UBAC1-2, lnc-IMPG2-3, lnc-BZW2-2,
lnc-C11orf89-3, lnc-F2R-4, lnc-F2R-3 and lnc-SYNM-5 were the most
highly connected lncRNAs (Fig. 5B;
Table VI). This suggests these
lncRNAs may be associated with the occurrence of GISTs.
| Table VI.Top ten most highly connected lncRNAs
in the lncRNA-transcription factor-mRNA network when comparing
normal gastric tissue samples and primary gastrointestinal stromal
tumor samples. |
Table VI.
Top ten most highly connected lncRNAs
in the lncRNA-transcription factor-mRNA network when comparing
normal gastric tissue samples and primary gastrointestinal stromal
tumor samples.
| Probe set ID | lncRNA | Regulation | Node frequency,
n |
|---|
|
TC2000001131.oe.1 | lnc-SLA2-2 | Downregulated | 184 |
|
TC08001345.hg.4 | ZFHX4-AS1 | Upregulated | 181 |
|
TC0700002374.oe.1 | lnc-GNAT3-4 | Downregulated | 178 |
|
TC0900002476.oe.1 | lnc-UBAC1-2 | Downregulated | 175 |
|
TC0300002625.oe.1 | lnc-IMPG2-3 | Downregulated | 169 |
|
TC0700000176.oe.1 | lnc-BZW2-2 | Upregulated | 124 |
|
TSUnmapped00000246.oe.1 | lnc-C11orf89-3 | Upregulated | 123 |
|
TC0500000700.oe.1 | lnc-F2R-4 | Upregulated | 111 |
|
TC0500000701.oe.1 | lnc-F2R-3 | Upregulated | 80 |
|
TC1500001116.oe.1 | lnc-SYNM-5 | Downregulated | 78 |
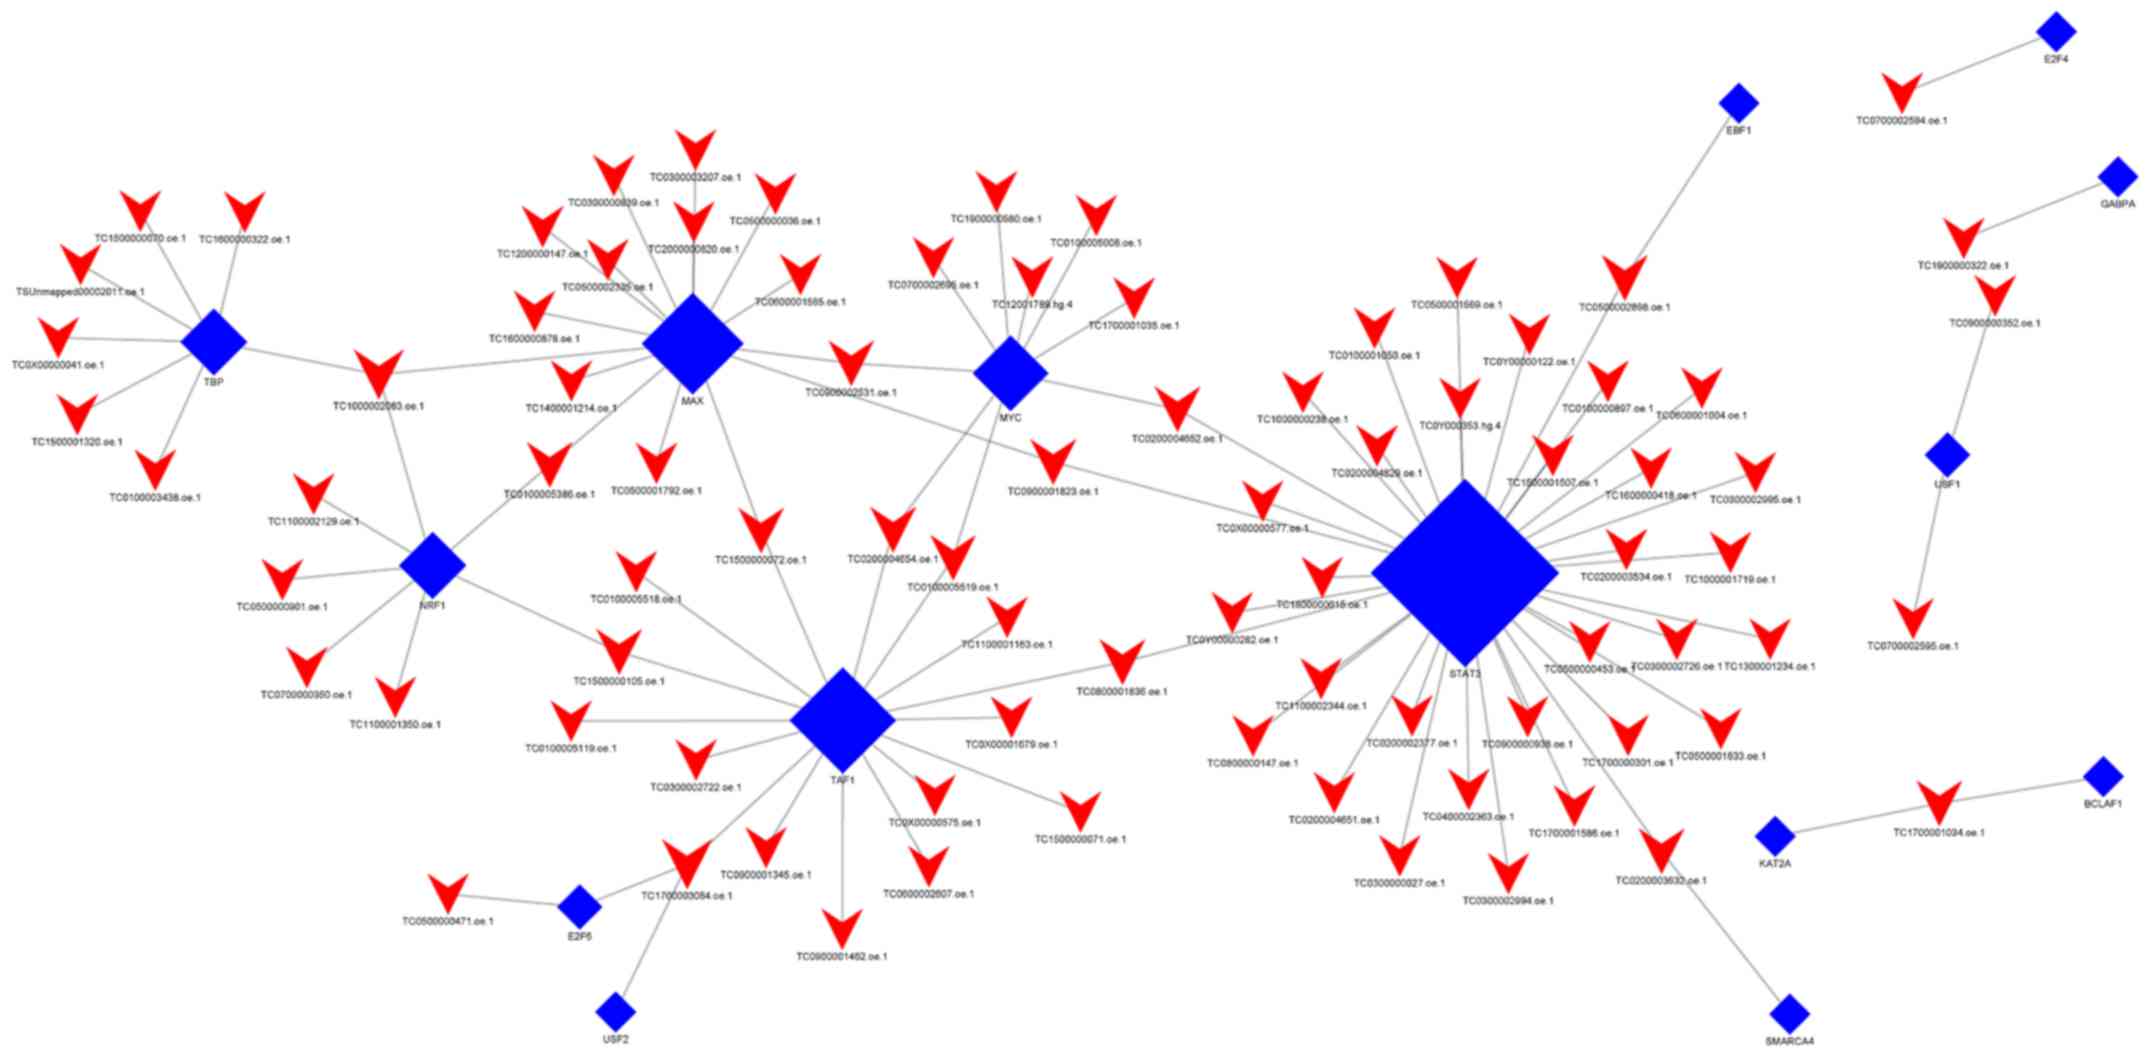
When group C was compared with group Y (primary
GISTs), it was identified that TBP, USF1, TAF1, NRF1, USF2, MAX,
E2F4, EBF1, KAT2A, GABPA, SMARCA4, STAT3, BCLAF1, E2F6, and MYC
were the most highly connected TFs (Fig.
6; Table VII). This indicates
that these TFs may be associated with secondary resistance to
imatinib.
| Table VII.Most highly connected TFs in the long
non-coding RNA-TF network when comparing primary gastrointestinal
stromal tumor samples with imatinib mesylate-resistant
gastrointestinal stromal tumor samples. |
Table VII.
Most highly connected TFs in the long
non-coding RNA-TF network when comparing primary gastrointestinal
stromal tumor samples with imatinib mesylate-resistant
gastrointestinal stromal tumor samples.
| TF | Node frequency,
n |
|---|
| TBP | 7 |
| USF1 | 2 |
| TAF1 | 16 |
| NRF1 | 7 |
| USF2 | 1 |
| MAX | 15 |
| E2F4 | 1 |
| EBF1 | 1 |
| KAT2A | 1 |
| GABPA | 1 |
| SMARCA4 | 1 |
| STAT3 | 35 |
| BCLAF1 | 1 |
| E2F6 | 2 |
| MYC | 9 |
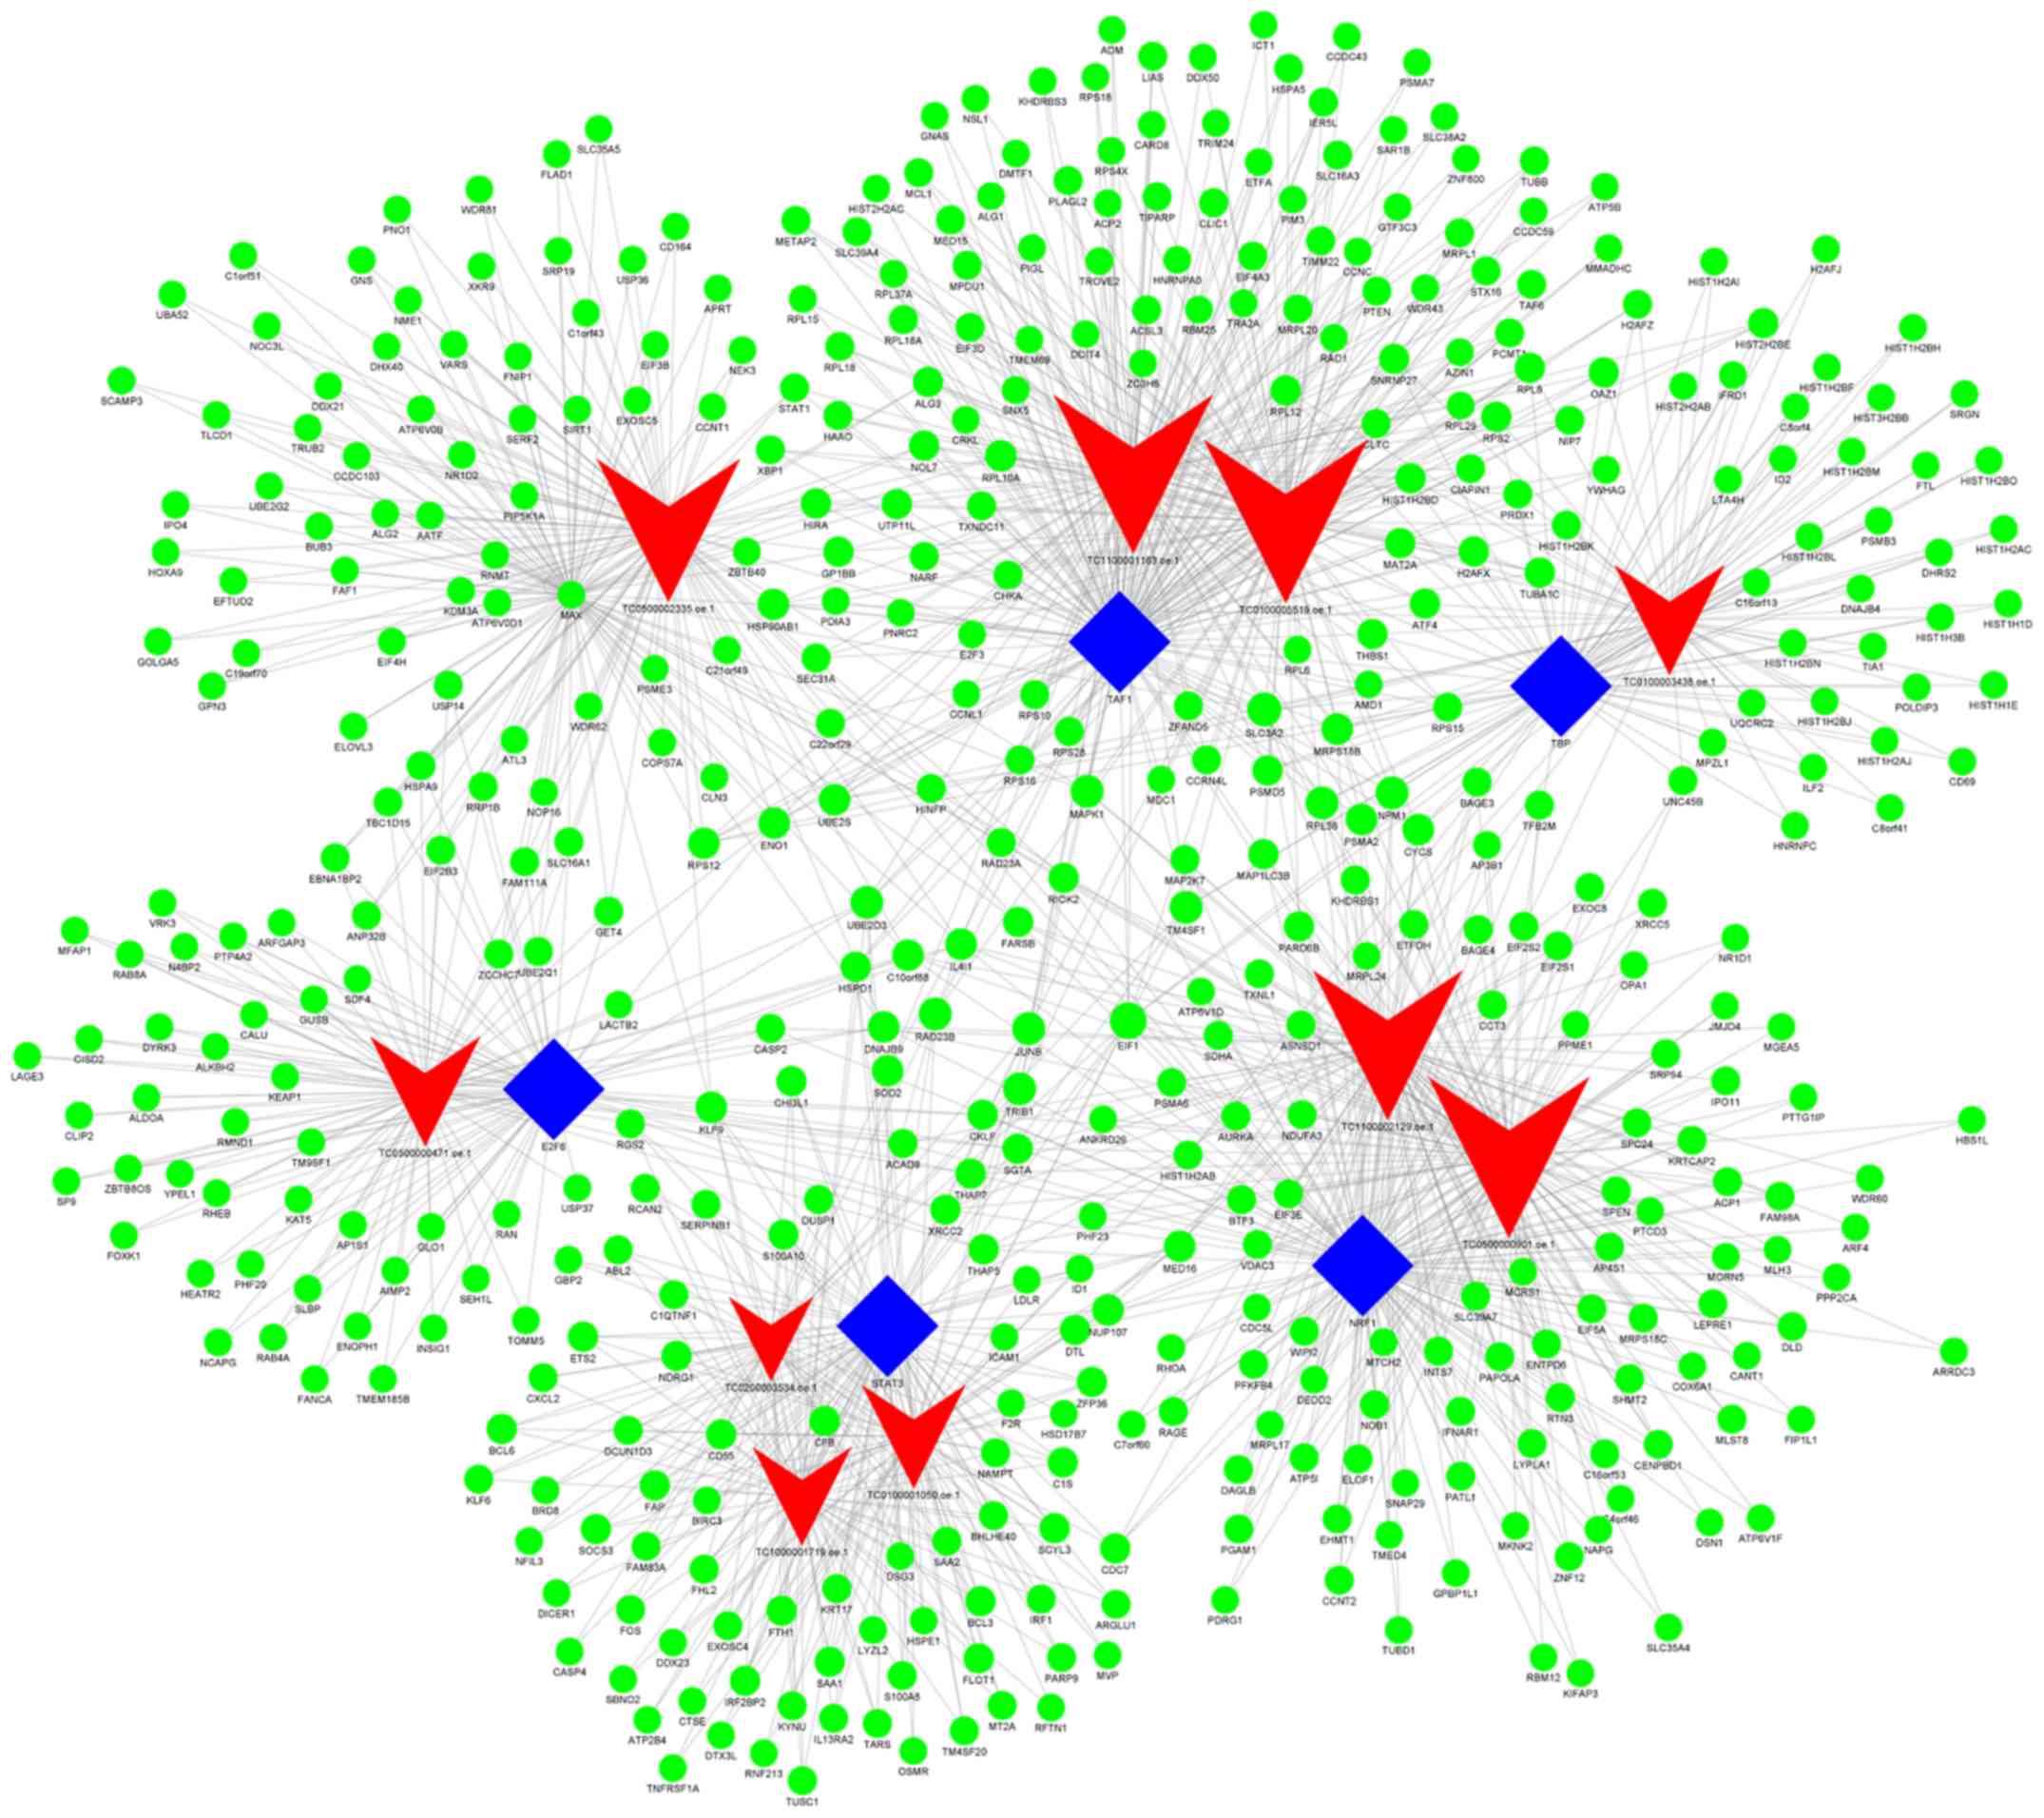
Additionally, when group C (imatinib
mesylate-resistant GISTs) was compared with group Y (primary
GISTs), it was revealed that
NONHSAG008085//lnc-RAG2-5//RP11-159D8.2, lnc-GZMA-2,
lnc-KIAA1462-10, lnc-NAIP-5, lnc-DNAJC6-2, lnc-IMMT-3,
lnc-CEP170-11, lnc-LNPEP-5, lnc-C11orf82-6 and lnc-FNDC5-3 were the
most highly connected lncRNAs. These lncRNAs may be associated with
secondary resistance to imatinib (Fig.
7; Table VIII).
| Table VIII.Top ten most highly connected lncRNAs
differences in the lncRNA-transcription factor-mRNA network when
comparing primary gastrointestinal stromal tumor samples with
imatinib mesylate-resistant gastrointestinal stromal tumor
samples. |
Table VIII.
Top ten most highly connected lncRNAs
differences in the lncRNA-transcription factor-mRNA network when
comparing primary gastrointestinal stromal tumor samples with
imatinib mesylate-resistant gastrointestinal stromal tumor
samples.
| Probe set ID | lncRNA | Regulation | Node frequency,
n |
|---|
|
TC1100002129.oe.1 |
NONHSAG008085//lnc-RAG2-5//RP11-159D8.2 | Upregulated | 96 |
|
TC0500000471.oe.1 | lnc-GZMA-2 | Upregulated | 65 |
|
TC1000001719.oe.1 |
lnc-KIAA1462-10 | Downregulated | 56 |
|
TC0500002335.oe.1 | lnc-NAIP-5 | Downregulated | 91 |
|
TC0100001050.oe.1 | lnc-DNAJC6-2 | Upregulated | 60 |
|
TC0200003534.oe.1 | lnc-IMMT-3 | Downregulated | 45 |
|
TC0100005519.oe.1 | lnc-CEP170-11 | Downregulated | 107 |
|
TC0500000901.oe.1 | lnc-LNPEP-5 | Upregulated | 105 |
|
TC1100001163.oe.1 | lnc-C11orf82-6 | Upregulated | 103 |
|
TC0100003438.oe.1 | lnc-FNDC5-3 | Upregulated | 65 |
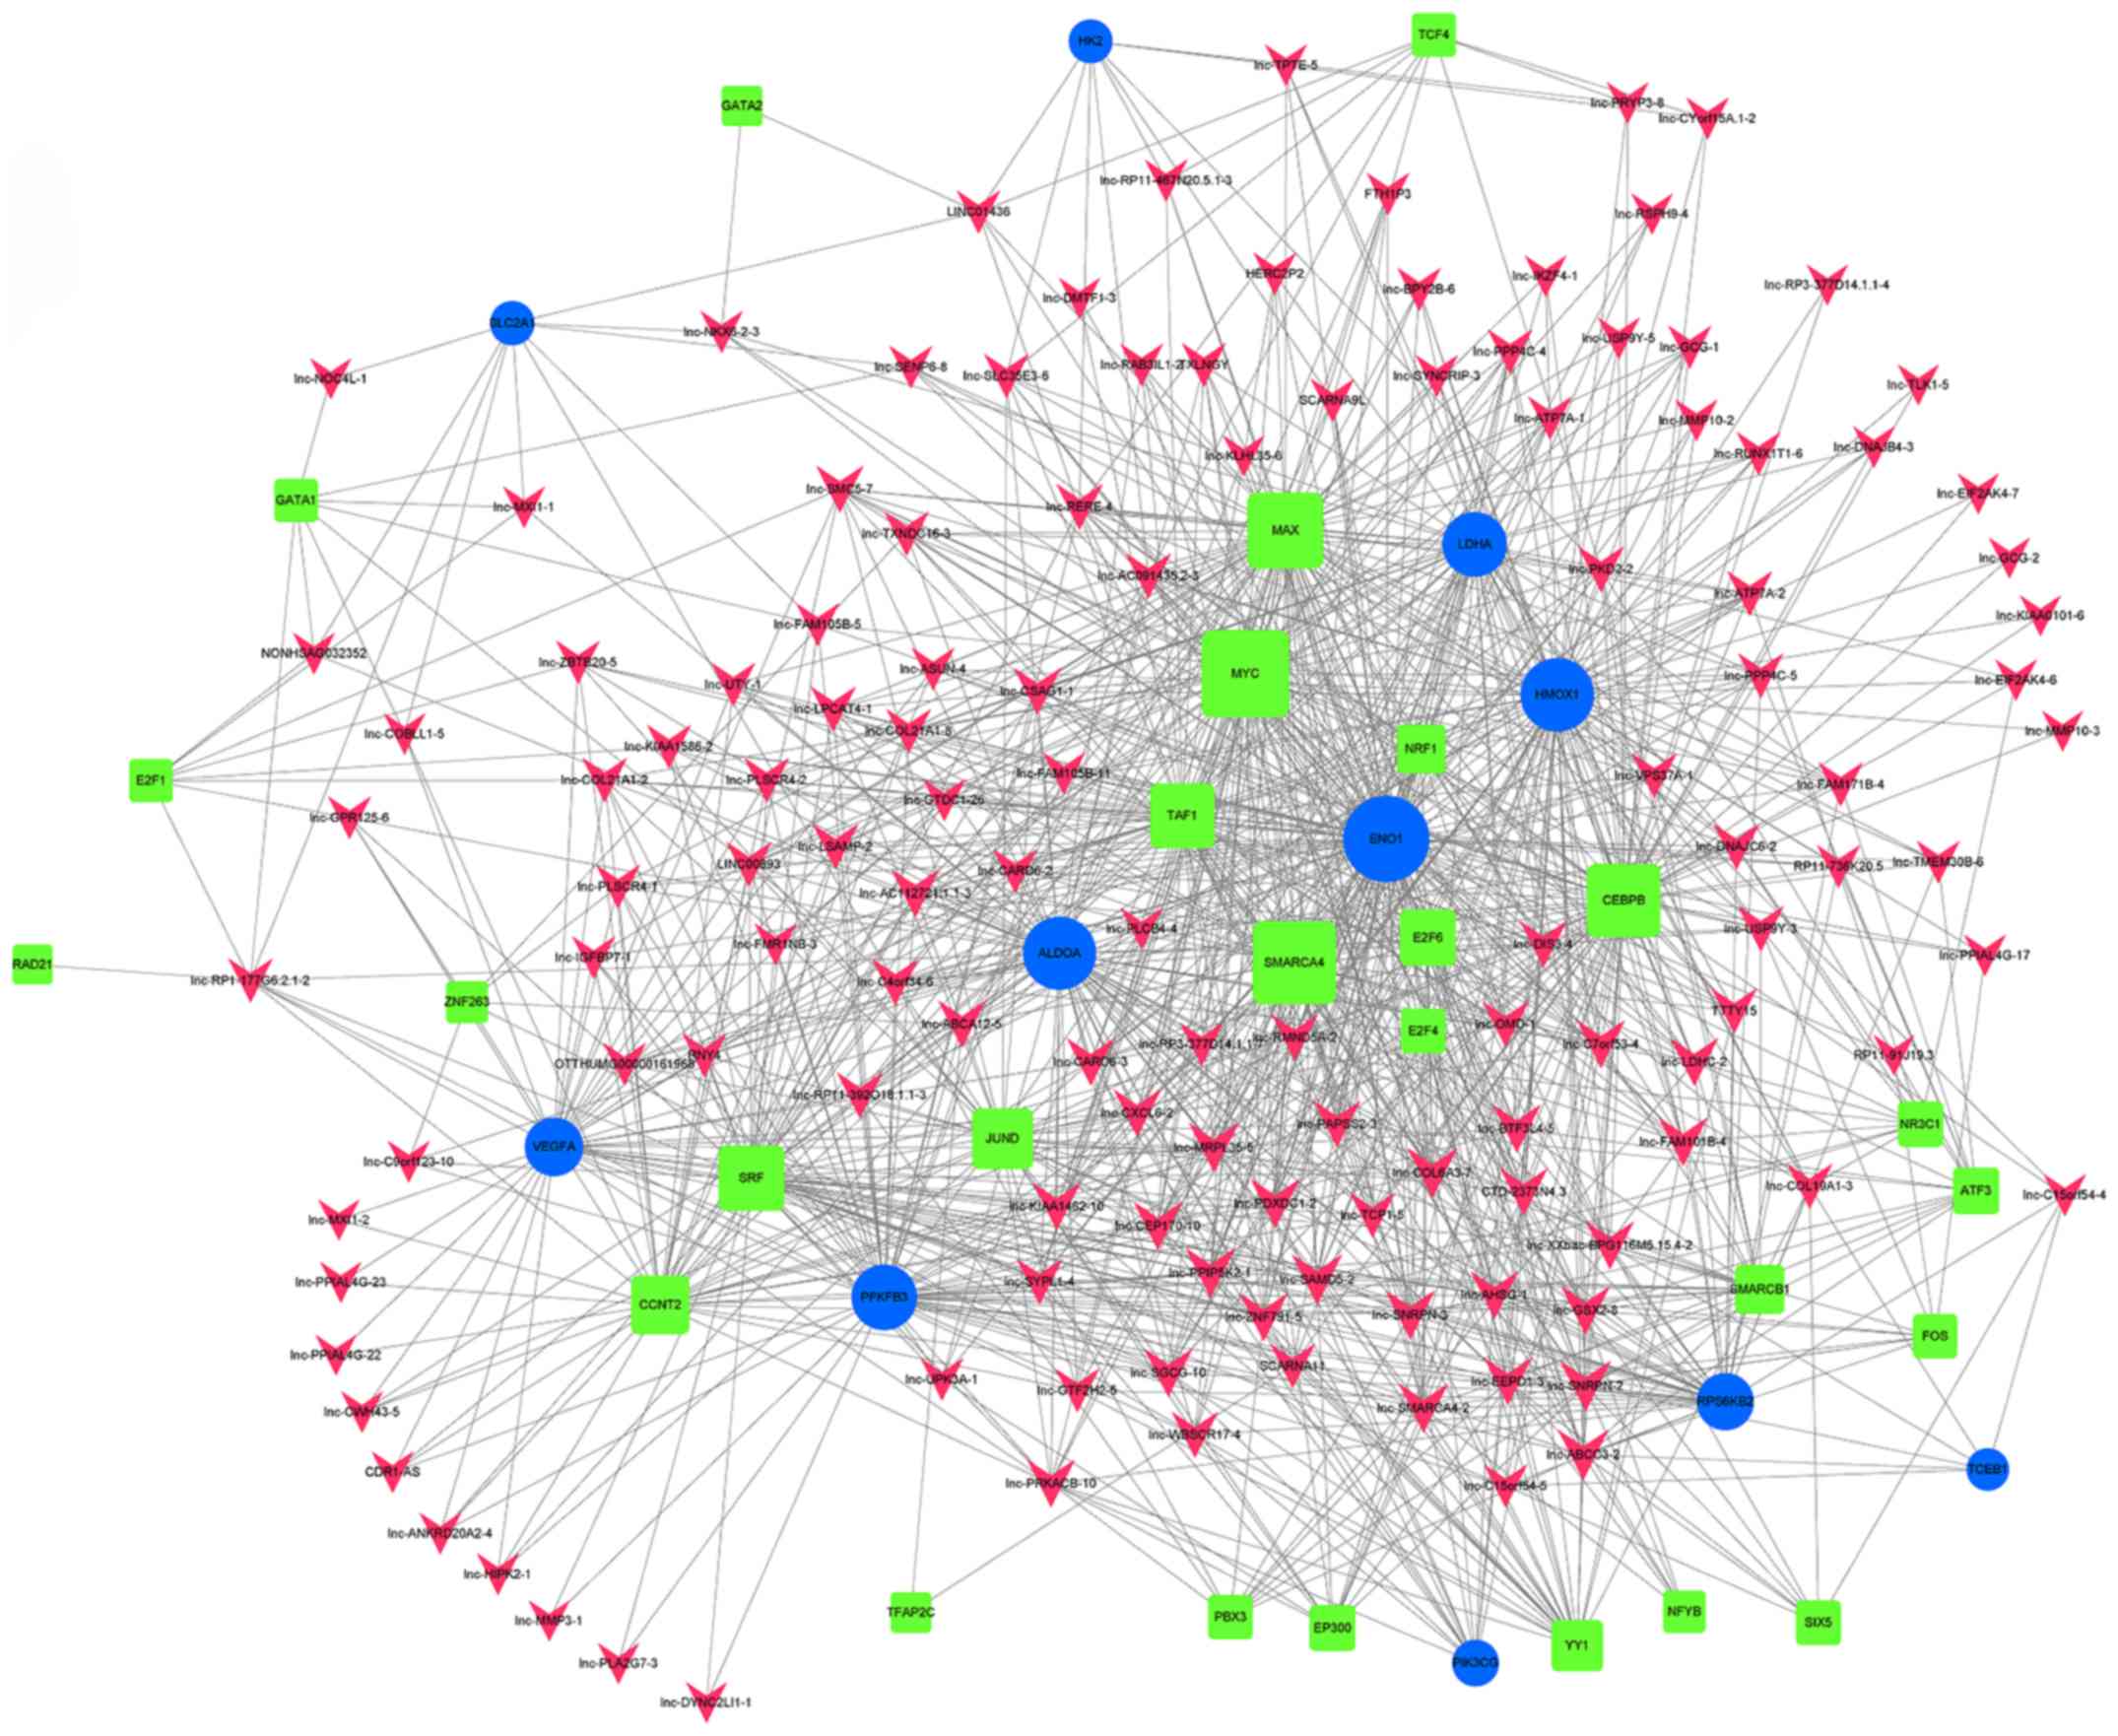
The differentially expressed lncRNAs identified when
comparing group C (imatinib mesylate-resistant GISTs) with group Y
(primary GISTs) were compared with lncRNAs associated with the
HIF-1 pathway and lncRNAs were filtered out with multiple
differences <4. An lncRNA-TF-mRNA network was constructed, which
revealed that lnc-DNAJC6-2 was highly associated with the HIF-1
pathway (Figs. 8 and 9; Table
IX).
| Table IX.Targets of long non-coding-DNAJC6-2
in the hypoxia-inducible factor-1 pathway. |
Table IX.
Targets of long non-coding-DNAJC6-2
in the hypoxia-inducible factor-1 pathway.
| Target | mRNA/TF |
|---|
| ATF3 | TF |
| ENO1 | mRNA |
| RPS6KB2 | mRNA |
| SMARCA4 | TF |
| HMOX1 | mRNA |
| CEBPB | TF |
| NR3C1 | TF |
| MYC | TF |
| LDHA | mRNA |
| MAX | TF |
| MYC | TF |
| SMARCA4 | TF |
| ALDOA | mRNA |
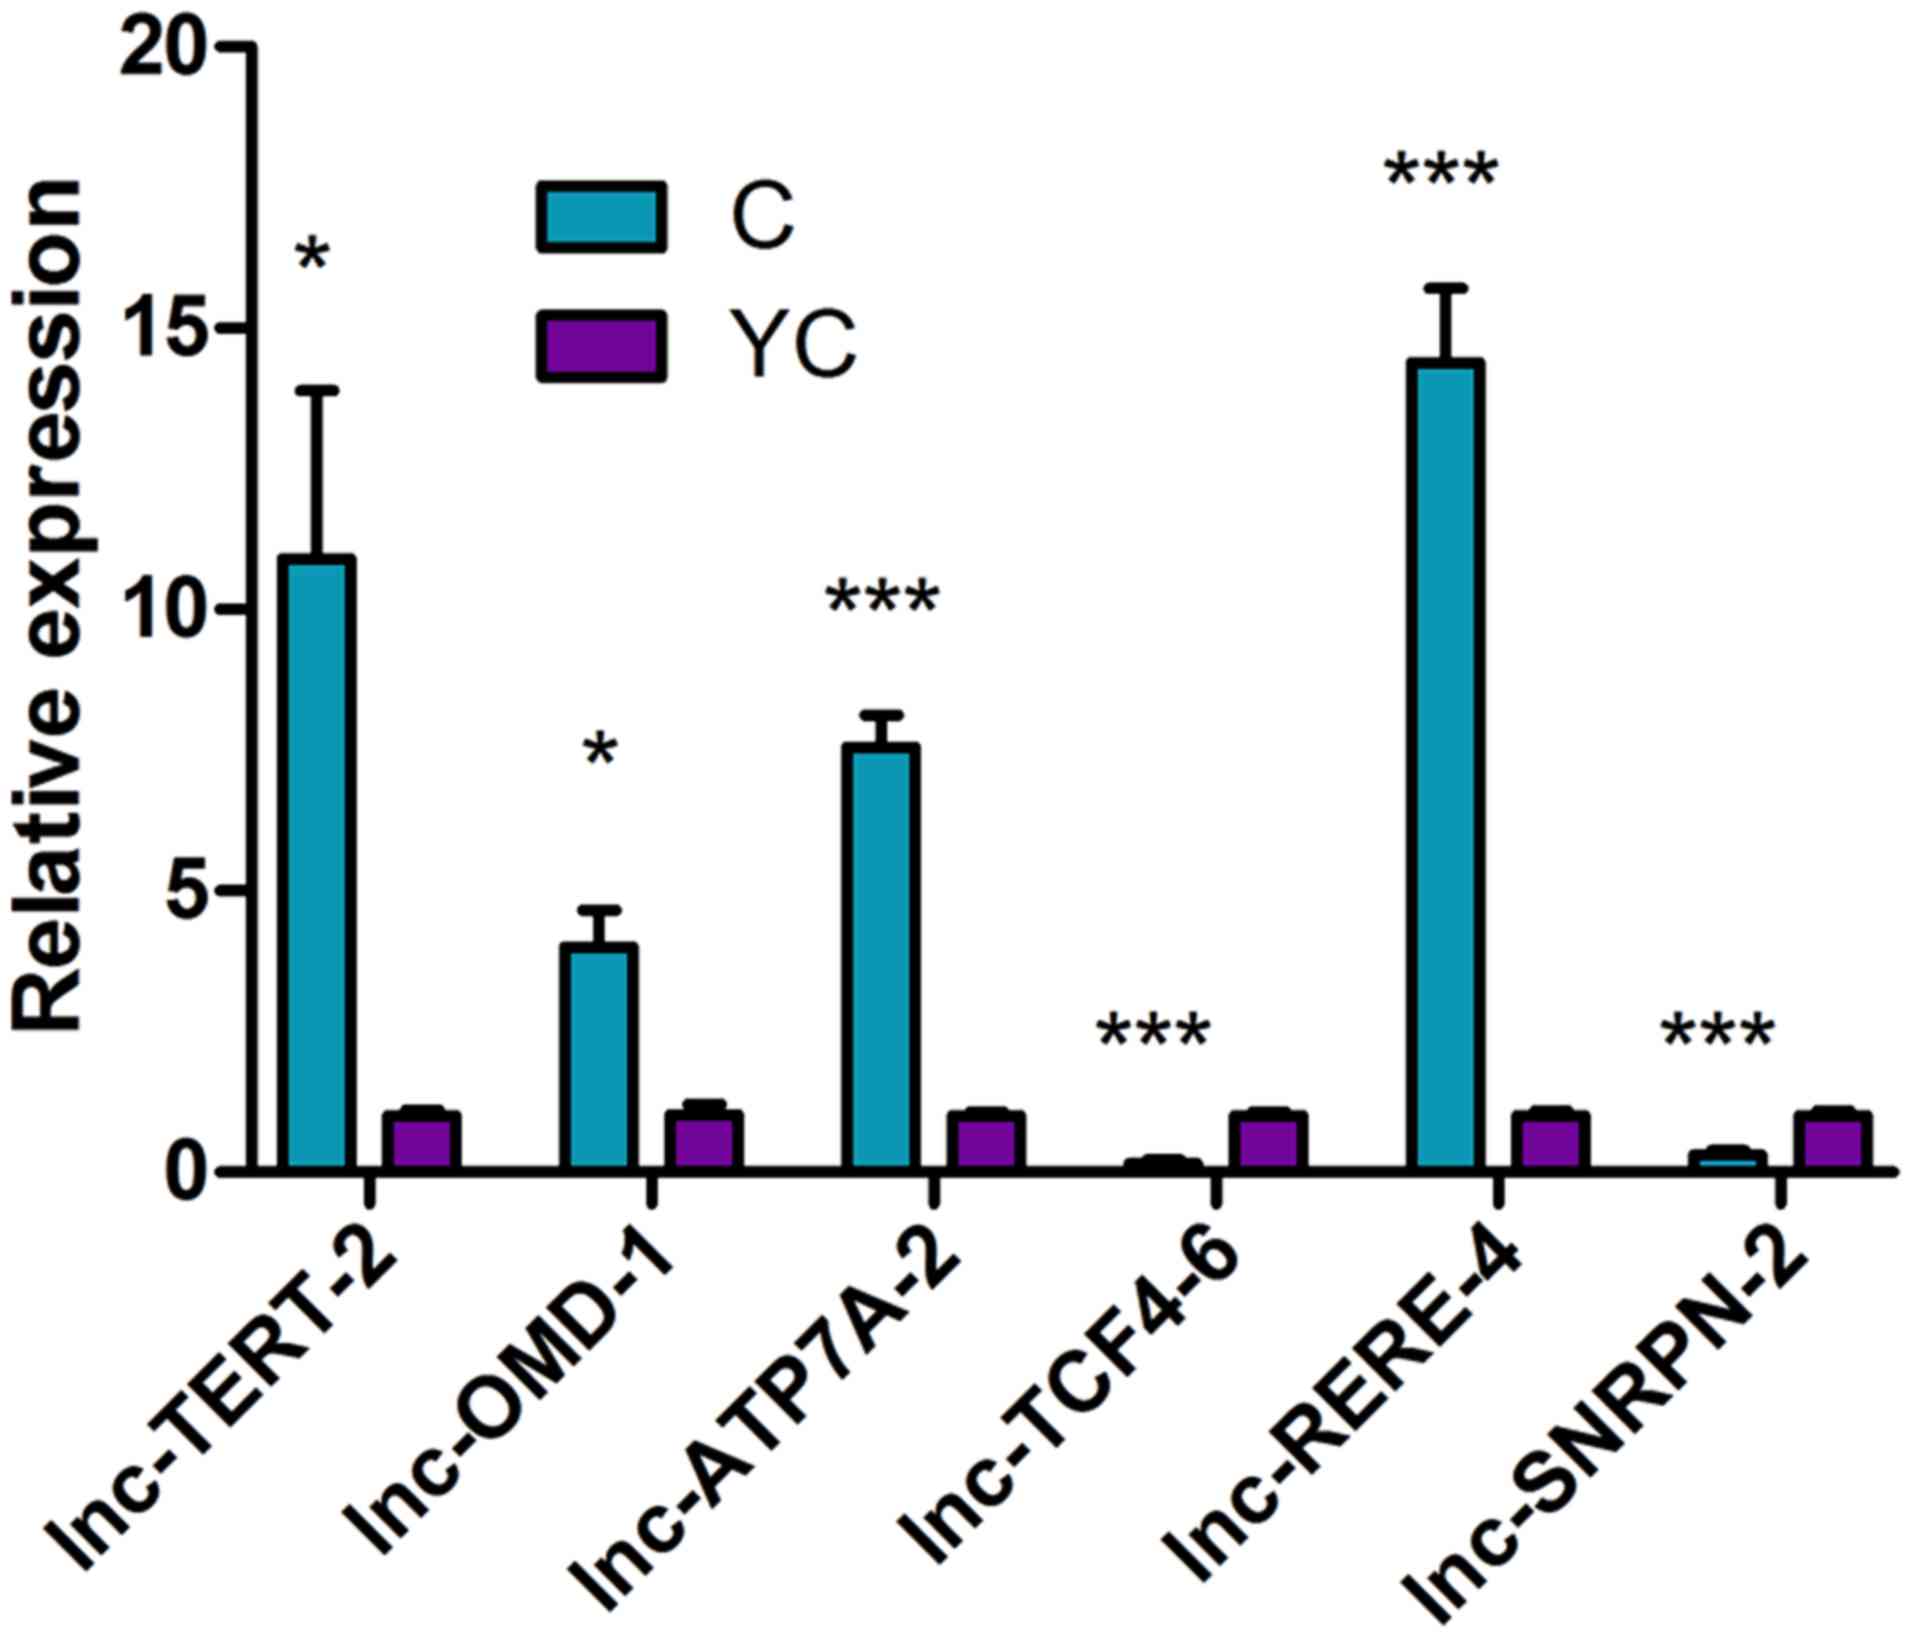
Quantitative analysis
During RT-qPCR, the melting curve for each gene was
a single peak and the specificity of the PCR amplification was
high. The data from three independent experiments were consistent
and all gene validation experiments were successful. The data were
analyzed by the 2−ΔΔCq method and the expression of the
6 differentially expressed lncRNAs by random selection were
consistent with the microarray results (Fig. 10; Table
X). In comparison between Group C and Y, four lncRNAs,
including lnc-TERT-2, lnc-OMD-1, lnc-ATP7A-2 and lnc-RERE-4, were
significantly highly expressed in Group C, while two lncRNAs,
lnc-TCF4-6 and lnc-SNRPN-2, were significantly highly expressed in
Group Y.
| Table X.lncRNA expression levels validated by
reverse transcription-quantitative polymerase chain reaction. |
Table X.
lncRNA expression levels validated by
reverse transcription-quantitative polymerase chain reaction.
| lncRNA | Mean of YC | Mean of C | SD of YC | SD of C | P-value |
|---|
| lnc-TERT-2 | 1.009753629 | 10.90599007 | 0.166744554 | 5.161105469 | 0.0294 |
| lnc-OMD-1 | 1.031618183 | 4.016359625 | 0.311642071 | 1.120932182 | 0.0113 |
| lnc-ATP7A-2 | 1.006134328 | 7.556070844 | 0.132794714 | 0.989899179 | 0.0003 |
| lnc-TCF4-6 | 1.003862861 | 0.157260729 | 0.109907251 | 0.105244389 | 0.0006 |
| lnc-RERE-4 | 1.008350471 | 14.39198375 | 0.154486795 | 2.278985694 | 0.0005 |
| lnc-SNRPN-2 | 1.007281843 | 0.310708716 | 0.152063775 | 0.131714432 | 0.0039 |
Discussion
The current study recruited 9 patients, including 3
patients without cancer (group N), 3 patients with primary GISTs
(group Y) and 3 patients with GISTs that were secondary resistant
to IM (group C). Samples for microarray experiments were obtained.
As expected, differential expression of lncRNAs was observed for
each paired sample. This included 2,250 lncRNAs in group Y vs.
group N, 2,209 lncRNAs in group C vs. group N and 922 lncRNAs in
group C vs. group Y. This suggests that lncRNAs may serve as
biomarkers for GISTs and further studies may lead to the
development of novel therapies.
Following the identification of differentially
expressed lncRNAs, GO enrichment and KEGG pathway analyses were
performed to assess potential functions and mechanisms of these
factors. Based on GO enrichment and KEGG pathway analysis of the
differentially expressed lncRNAs between group Y and group C, the
HIF-1 signaling pathway result is notable. For a number of years it
has been understood that intratumoral hypoxia is often associated
with resistance to therapy and a poor prognosis (20,21). HIF-1
is considered to be a sequence-specific DNA-binding TF; its
stability is regulated by oxygen and it can control the
transcription of target genes under hypoxic conditions by combining
with HIF-1β. The rapid proliferation of tumor cells leads to
insufficient blood supply, resulting in a hypoxic environment.
Therefore, HIF-1 is often overexpressed in tumor tissues. Tumor
hypoxia has been demonstrated to be associated with therapy
resistance in drug-based treatments and radiation therapies
(20,22–28). It
has been identified that HIF-1 can modulate >200 genes that are
associated with cell cycle arrest, proliferation, apoptosis,
survival, metabolism, DNA repair and drug efflux. This results in
drug resistance to chemicals and radiation (29–31).
Investigating lncRNAs that target the HIF-1 pathway may identify a
novel cancer treatment strategy (32). In the current study, lnc-DNAJC6-2 was
identified to be associated with the HIF-1 pathway, this lncRNA may
target the expression of TFs, including ATF3, SMARCA4, CEBPB,
NR3C1, MYC, MAX, MYC and SMARCA4, and affect ENO1, RPS6KB2, HMOX1,
LDHA and ALDOA. An important role of lnc-DNAJC6-2 has been
demonstrated in the progression of hepatocellular carcinoma (HCC)
and lnc-DNAJC6-2 has been implicated as a marker of poor outcome in
HCC (33). The current study only
performed gene sequencing and data analysis. A larger sample size
is required to validate the current results. Additionally, further
elucidation and functional verification is required to investigate
additional mechanisms of imatinib mesylate resistance.
In the lncRNA-TF-mRNA network analysis, lnc-SLA2-2,
ZFHX4-AS1, lnc-GNAT3-4, lnc-UBAC1-2, lnc-IMPG2-3, lnc-BZW2-2,
lnc-C11orf89-3, lnc-F2R-4, lnc-F2R-3 and lnc-SYNM-5 were the most
highly connected lncRNAs. These lncRNAs may modulate the expression
of TFs, including E2F1, STAT3 and RAD21, and this may be associated
with the occurrence of GISTs. Furthermore,
NONHSAG008085//lnc-RAG2-5//RP11-159D8.2, lnc-GZMA-2,
lnc-KIAA1462-10, lnc-NAIP-5, lnc-DNAJC6-2, lnc-IMMT-3,
lnc-CEP170-11, lnc-LNPEP-5, lnc-C11orf82-6 and lnc-FNDC5-3 were the
most highly connected lncRNAs with the expression of TFs, including
TBP, TAF1, NRF1, MAX, STAT3 and E2F6. This may be associated with
secondary resistance to imatinib.
In conclusion, following resistance to IM, few
therapeutic options are available for GISTs. Therefore, there is an
urgent requirement to identify the mechanisms of drug resistance.
The findings of the current study indicate that lncRNAs may serve
active roles in the occurrence of GISTs and secondary resistance to
imatinib. Certain lncRNAs, including lnc-DNAJC6-2 may modulate the
HIF-1 signaling pathway. Therefore, the identified lncRNAs may
prove to be important targets for treating secondary imatinib
mesylate resistance in GISTs.
Acknowledgements
No applicable.
Funding
This study was supported by the Natural Science
Foundation of Zhejiang Province (grant no. LY15H160060) and the
Science and Technology Bureau of Wenzhou of Zhejiang Province
(grant no. Y20140364).
Availability of data and materials
The datasets used during the present study are
available from the corresponding author upon reasonable
request.
Authors' contributions
JY, DC and XC conceived the idea. JY and DC
performed the experiments. XS, QD, TW and ZD analyzed the data. XC
wrote the manuscript. All authors have read and approved the final
version of the manuscript.
Ethics approval and consent to
participate
This study was approved by the Ethics Committee of
The First Affiliated Hospital of Wenzhou Medical University.
Patient consent for publication
The patient consented for the publication of any
associated data and accompanying images.
Competing interests
The authors declare that they have no competing
interests.
Glossary
Abbreviations
Abbreviations:
|
lncRNA
|
long non-coding RNA
|
|
GIST
|
gastrointestinal stromal tumor
|
|
HIF-1
|
hypoxia-inducible factor-1
|
|
IM
|
imatinib mesylate
|
|
N
|
normal gastric tissue
|
|
Y
|
primary gastrointestinal stromal tumor
tissue
|
|
C
|
gastrointestinal stromal tumor tissue
secondarily resistant to imatinib mesylate
|
References
|
1
|
Hirota S, Isozaki K, Moriyama Y, Hashimoto
K, Nishida T, Ishiguro S, Kawano K, Hanada M, Kurata A, Takeda M,
et al: Gain-of-function mutations of c-kit in human
gastrointestinal stromal tumors. Science. 279:577–580. 1998.
View Article : Google Scholar : PubMed/NCBI
|
|
2
|
Nishida T and Hirota S: Biological and
clinical review of stromal tumors in the gastrointestinal tract.
Histol Histopathol. 15:1293–1301. 2000.PubMed/NCBI
|
|
3
|
Verweij J, Casali PG, Zalcberg J, LeCesne
A, Reichardt P, Blay JY, Issels R, van Oosterom A, Hogendoorn PC,
Van Glabbeke M, et al: Progression-free survival in
gastrointestinal stromal tumours with high-dose imatinib:
Randomised trial. Lancet. 364:1127–1134. 2004. View Article : Google Scholar : PubMed/NCBI
|
|
4
|
Heinrich MC, Corless CL, Demetri GD,
Blanke CD, von Mehren M, Joensuu H, McGreevey LS, Chen CJ, Van den
Abbeele AD, Druker BJ, et al: Kinase mutations and imatinib
response in patients with metastatic gastrointestinal stromal
tumor. J Clin Oncol. 21:4342–4349. 2003. View Article : Google Scholar : PubMed/NCBI
|
|
5
|
Kretz M, Siprashvili Z, Chu C, Webster DE,
Zehnder A, Qu K, Lee CS, Flockhart RJ, Groff AF, Chow J, et al:
Control of somatic tissue differentiation by the long non-coding
RNA TINCR. Nature. 493:231–235. 2013. View Article : Google Scholar : PubMed/NCBI
|
|
6
|
Klattenhoff CA, Scheuermann JC, Surface
LE, Bradley RK, Fields PA, Steinhauser ML, Ding H, Butty VL, Torrey
L, Haas S, et al: Braveheart, a long noncoding RNA required for
cardiovascular lineage commitment. Cell. 152:570–583. 2013.
View Article : Google Scholar : PubMed/NCBI
|
|
7
|
Lee NK, Lee JH, Kim WK, Yun S, Youn YH,
Park CH, Choi YY, Kim H and Lee SK: Promoter methylation of PCDH10
by HOTAIR regulates the progression of gastrointestinal stromal
tumors. Oncotarget. 7:75307–75318. 2016. View Article : Google Scholar : PubMed/NCBI
|
|
8
|
Mohammad F, Mondal T, Guseva N, Pandey GK
and Kanduri C: Kcnq1ot1 noncoding RNA mediates transcriptional gene
silencing by interacting with Dnmt1. Development. 137:2493–2499.
2010. View Article : Google Scholar : PubMed/NCBI
|
|
9
|
Sun L, Goff LA, Trapnell C, Alexander R,
Lo KA, Hacisuleyman E, Sauvageau M, Tazon-Vega B, Kelley DR,
Hendrickson DG, et al: Long noncoding RNAs regulate adipogenesis.
Proc Natl Acad Sci USA. 110:3387–3392. 2013. View Article : Google Scholar : PubMed/NCBI
|
|
10
|
Pandey GK, Mitra S, Subhash S, Hertwig F,
Kanduri M, Mishra K, Fransson S, Ganeshram A, Mondal T, Bandaru S,
et al: The risk-associated long noncoding RNA NBAT-1 controls
neuroblastoma progression by regulating cell proliferation and
neuronal differentiation. Cancer Cell. 26:722–737. 2014. View Article : Google Scholar : PubMed/NCBI
|
|
11
|
Gupta RA, Shah N, Wang KC, Kim J, Horlings
HM, Wong DJ, Tsai MC, Hung T, Argani P, Rinn JL, et al: Long
non-coding RNA HOTAIR reprograms chromatin state to promote cancer
metastasis. Nature. 464:1071–1076. 2010. View Article : Google Scholar : PubMed/NCBI
|
|
12
|
Niinuma T, Suzuki H, Nojima M, Nosho K,
Yamamoto H, Takamaru H, Yamamoto E, Maruyama R, Nobuoka T, Miyazaki
Y, et al: Upregulation of miR-196a and HOTAIR drive malignant
character in gastrointestinal stromal tumors. Cancer Res.
72:1126–1136. 2012. View Article : Google Scholar : PubMed/NCBI
|
|
13
|
Lee NK, Lee JH, Kim WK, Yun S, Youn YH,
Park CH, Choi YY, Kim H and Lee SK: Promoter methylation of PCDH10
by HOTAIR regulates the progression of gastrointestinal stromal
tumors. Oncotarget. 7:75307–75318. 2016. View Article : Google Scholar : PubMed/NCBI
|
|
14
|
Lai S, Wang G, Cao X, Luo X, Wang G, Xia
X, Hu J and Wang J: KIT over-expression by p55PIK-PI3K leads to
imatinib-resistance in patients with gastrointestinal stromal
tumors. Oncotarget. 7:1367–1379. 2016. View Article : Google Scholar : PubMed/NCBI
|
|
15
|
Li J, Dang Y, Gao J, Li Y, Zou J and Shen
L: PI3K/AKT/mTOR pathway is activated after imatinib secondary
resistance in gastrointestinal stromal tumors (GISTs). Med Oncol.
32:1112015. View Article : Google Scholar : PubMed/NCBI
|
|
16
|
Xiao Y, Jiao C, Lin Y, Chen M, Zhang J,
Wang J and Zhang Z: lncRNA UCA1 contributes to imatinib resistance
by acting as a ceRNA against miR-16 in chronic myeloid leukemia
cells. DNA Cell Biol. 36:18–25. 2017. View Article : Google Scholar : PubMed/NCBI
|
|
17
|
Wang H, Li Q, Tang S, Li M, Feng A, Qin L,
Liu Z and Wang X: The role of long noncoding RNA HOTAIR in the
acquired multidrug resistance to imatinib in chronic myeloid
leukemia cells. Hematology. 22:208–216. 2017. View Article : Google Scholar : PubMed/NCBI
|
|
18
|
Cao K, Li M, Miao J, Lu X, Kang X, Zhu H,
Du S, Li X, Zhang Q, Guan W, et al: CCDC26 knockdown enhances
resistance of gastrointestinal stromal tumor cells to imatinib by
interacting with c-KIT. Am J Transl Res. 10:274–282.
2018.PubMed/NCBI
|
|
19
|
Livak KJ and Schmittgen TD: Analysis of
relative gene expression data using real-time quantitative PCR and
the 2(-Delta Delta C(T)) method. Methods. 25:402–408. 2001.
View Article : Google Scholar : PubMed/NCBI
|
|
20
|
Semenza GL: Targeting HIF-1 for cancer
therapy. Nat Rev Cancer. 3:721–732. 2003. View Article : Google Scholar : PubMed/NCBI
|
|
21
|
Lin SC, Liao WL, Lee JC and Tsai SJ:
Hypoxia-regulated gene network in drug resistance and cancer
progression. Exp Biol Med (Maywood). 239:779–792. 2014. View Article : Google Scholar : PubMed/NCBI
|
|
22
|
Keith B, Johnson RS and Simon MC: HIF1α
and HIF2α: Sibling rivalry in hypoxic tumour growth and
progression. Nat Rev Cancer. 12:9–22. 2011. View Article : Google Scholar : PubMed/NCBI
|
|
23
|
Rohwer N and Cramer T: Hypoxia-mediated
drug resistance: Novel insights on the functional interaction of
HIFs and cell death pathways. Drug Resist Updat. 14:191–201. 2011.
View Article : Google Scholar : PubMed/NCBI
|
|
24
|
Harris AL: Hypoxia-a key regulatory factor
in tumour growth. Nat Rev Cancer. 2:38–47. 2002. View Article : Google Scholar : PubMed/NCBI
|
|
25
|
Nurwidya F, Takahashi F, Minakata K,
Murakami A and Takahashi K: From tumor hypoxia to cancer
progression: The implications of hypoxia-inducible factor-1
expression in cancers. Anat Cell Biol. 45:73–78. 2012. View Article : Google Scholar : PubMed/NCBI
|
|
26
|
Semenza GL: Defining the role of
hypoxia-inducible factor 1 in cancer biology and therapeutics.
Oncogene. 29:625–634. 2010. View Article : Google Scholar : PubMed/NCBI
|
|
27
|
Bristow RG and Hill RP: Hypoxia and
metabolism. Hypoxia, DNA repair and genetic instability. Nat Rev
Cancer. 8:180–192. 2008. View
Article : Google Scholar : PubMed/NCBI
|
|
28
|
Nurwidya F, Takahashi F, Minakata K,
Murakami A and Takahashi K: From tumor hypoxia to cancer
progression: The implications of hypoxia-inducible factor-1
expression in cancers. Anat Cell Biol. 45:732012. View Article : Google Scholar : PubMed/NCBI
|
|
29
|
Holmquist-Mengelbier L, Fredlund E,
Löfstedt T, Noguera R, Navarro S, Nilsson H, Pietras A,
Vallon-Christersson J, Borg A, Gradin K, et al: Recruitment of
HIF-1alpha and HIF-2alpha to common target genes is differentially
regulated in neuroblastoma: HIF-2alpha promotes an aggressive
phenotype. Cancer Cell. 10:413–423. 2006. View Article : Google Scholar : PubMed/NCBI
|
|
30
|
Kaelin WG Jr: The von Hippel-Lindau tumour
suppressor protein: O2 sensing and cancer. Nat Rev Cancer.
8:865–873. 2008. View
Article : Google Scholar : PubMed/NCBI
|
|
31
|
Bertout JA, Majmundar AJ, Gordan JD, Lam
JC, Ditsworth D, Keith B, Brown EJ, Nathanson KL and Simon MC:
HIF2alpha inhibition promotes p53 pathway activity, tumor cell
death, and radiation responses. Proc Natl Acad Sci USA.
106:14391–14396. 2009. View Article : Google Scholar : PubMed/NCBI
|
|
32
|
Shih JW and Kung HJ: Long non-coding RNA
and tumor hypoxia: New players ushered toward an old arena. J
Biomed Sci. 24:532017. View Article : Google Scholar : PubMed/NCBI
|
|
33
|
Yang T, Li XN, Li XG, Li M and Gao PZ:
DNAJC6 promotes hepatocellular carcinoma progression through
induction of epithelial-mesenchymal transition. Biochem Biophys Res
Commun. 455:298–304. 2014. View Article : Google Scholar : PubMed/NCBI
|