Introduction
Head and neck squamous cell carcinoma (HNSCC) ranked
as the sixth leading incident cancer worldwide in 2012 (1). In contrast with the slightly decreased
incidence rate of general HNSCC, the occurrence of oral HNSCC has
increased over the last few decades, particularly oral tongue
squamous cell carcinoma (OTSCC) (2–5). OTSCC
represents malignancies of the oral cavity, with a significantly
increasing incidence rate reported among younger individuals from
1975 to 2007 in the USA (6). Although
OTSCC cases are considered as oral squamous cell carcinoma (OSCC)
or HNSCC, their distinct histological and epidemiological
characteristics have been verified (7,8). Owing to
the complex lymphatic network and muscular structure of the tongue,
patients with OTSCC present a more aggressive phenotype compared
with those with tumors affecting other parts of the body, with a
higher proportion of lymph node positivity, higher recurrence and
metastasis rates post-therapy, and, therefore, poorer prognosis
(9,10). However, the molecular mechanisms
underlying these variations remain unknown.
Gene detection techniques based on gene expression
and sequence variation, including gene microarrays and sequencing,
facilitate the gathering of genetic information about numerous
cancer types (11–14). A large amount of functional genomic
data produced by these high-throughput techniques are archived in
public repositories, including the Gene Expression Omnibus (GEO)
database (www.ncbi.nlm.nih.gov/geo). Using these data,
integrative analysis or re-analysis can provide valuable clues and
new understanding regarding the underlying mechanism (15–17). To
date, a considerable number of gene expression profiling studies on
OSCC and HNSCC have been completed. However, only a few studies
have focused on the transcriptome of OTSCC. The results from these
independent studies are inconsistent partly due to sample
heterogeneity. In the present study, two OSCC datasets and one
OTSCC dataset were obtained from the GEO database and filtered
prior to integrative analysis. Differentially expressed gene (DEG)
screening, protein-protein interaction (PPI) network construction
and gene functional annotation were performed, in order to
investigate the distinct gene expression profile of patients with
OTSCC.
Materials and methods
Acquisition, preprocessing and DEG
screening of microarray data
The gene expression data and probe annotation files
GSE13601 (18), GSE31056 (19) and GSE78060 (20) were downloaded from the GEO database
for investigation. All of these datasets included microarray data
of OTSCC samples. According to their anatomical definition, tongue
samples were extracted from the three datasets. Raw microarray data
in CEL format were processed with background correction,
log2 transformation and quantile normalization using the
Robust Multi-array Average (RMA) algorithm (21) in the Affy package (version 1.22.1;
www.bioconductor.org/packages/2.4/bioc/html/affy.html)
in R (version 3.4.3; www.r-project.org). Subsequently, the DEGs in OTSCC
tissues compared with in normal tongue tissues were identified
using linear models with the limma package (version 2.18.3;
www.bioconductor.org/packages/2.4/bioc/html/limma.html)
in R (22,23). |log2FC|≥1 (where FC is fold
change) and adjusted P<0.05 were considered as the cut-off
values for statistical significance. Furthermore, the intersection
of the DEGs among the datasets was calculated, and the result was
visualized as a Venn diagram using an online tool
(bioinformatics.psb.ugent.be/webtools/Venn).
For validation, the consistency between identified
DEGs from the GEO datasets and the data from The Cancer Genome
Atlas (TCGA; cancergenome.nih.gov) was assessed and visualized as a
Venn diagram. HNSCC gene expression data were downloaded from TCGA
and a filter was applied so as to retain only the data of patients
with OTSCC. Subsequently, the edgeR package (version 1.2.4;
www.bioconductor.org/packages/2.4/bioc/html/edgeR.html)
was used to screen for DEGs with the cut-off values of
|log2FC|≥1 and adjusted P<0.05 (24).
Functional enrichment analysis
The Database for Annotation, Visualization and
Integrated Discovery (DAVID) online tool (version 6.8; david.ncifcrf.gov) was applied to map candidate DEGs
onto their associated biological annotation (25,26), with
Gene Ontology (GO; www.geneontology.org) (27,28) and
pathway analyses using the Kyoto Encyclopedia of Genes and Genomes
(KEGG; www.genome.jp/kegg) (29,30) and
the Reactome (www.reactome.org) pathway databases
(31,32). Adjusted P<0.05 was considered to
indicate statistical significance. All significantly enriched terms
were visualized in bubble chart using the ggplot2 package (version
3.1.0; docs.ggplot2.org) in R. The richness
factor was calculated as the percentage of the enriched gene number
relative to the background gene number for the same term.
PPI network construction
All candidate DEGs were searched in the Search Tool
for the Retrieval of Interacting Genes/Proteins (STRING) database
(version 10.5; string-db.org) and a combined score
>0.4 was used as the criterion to establish the PPI network
(33). All the isolated nodes were
deleted from the network. The data of the PPI network were exported
from the STRING website and imported into Cytoscape (version 3.5.1)
software for visualization (34).
Each protein in the network served as a node, and the degree and
betweenness centrality were calculated using the CentiScaPe
(version 2.2) plugin (35,36). The hub gene was defined as the node
with a degree >10 within the top 30 betweenness centrality nodes
in the present study.
Sub-network analysis
The MCODE plugin (version 1.4.2) (37) was used to identify highly
interconnected regions, or clusters, in the PPI network. The degree
cut-off was set to 2 and the κ-score was set to 2. The identified
clusters with a score >10 were used to create a sub-network. The
Cytoscape plugin ClueGO + CluePedia (version 2.5.0) (38,39), which
facilitates GO and pathway enrichment analysis in a network, was
applied to perform the enrichment analysis and subsequent
visualization. The information from the GO and KEGG databases was
combined, and the κ-coefficient threshold was set to 0.4. On the
basis of the calculations, similar functional terms were marked
with the same color.
Two-dimensional hierarchical
clustering analysis
According to the anatomical site of samples in
GSE31056, OTSCC samples and normal tongue samples were filtered
into a subset of GSE31056. Following normalization, gene expression
matrices of 206 DEGs from datasets GSE13601, GSE31056 and GSE78060
and the subset of GSE31056 were prepared. Unsupervised clustering
was performed on the four matrices using the pheatmap package
(CRAN.R-project.org/package=pheatmap) in R.
Univariate survival analysis
In order to distinguish prognostic factors for the
outcome of patients with OTSCC, the 206 DEGs were subjected to
overall survival (OS) analysis using the univariate Cox regression
model. Owing to the unavailability of the clinical information of
the samples in datasets GSE13601 and GSE78060, and the limitation
in sample size of GSE31056, OTSCC gene expression data and clinical
information from TCGA database were used in this analysis. Any
causes of mortality were defined as events and survival was defined
as a censored event. The OS analysis was performed with the R
package Survival (version 2.43–3; CRAN.R-project.org/package=survival), and P<0.05
was considered to be statistically significant.
Results
Identification of DEGs in OTSCC
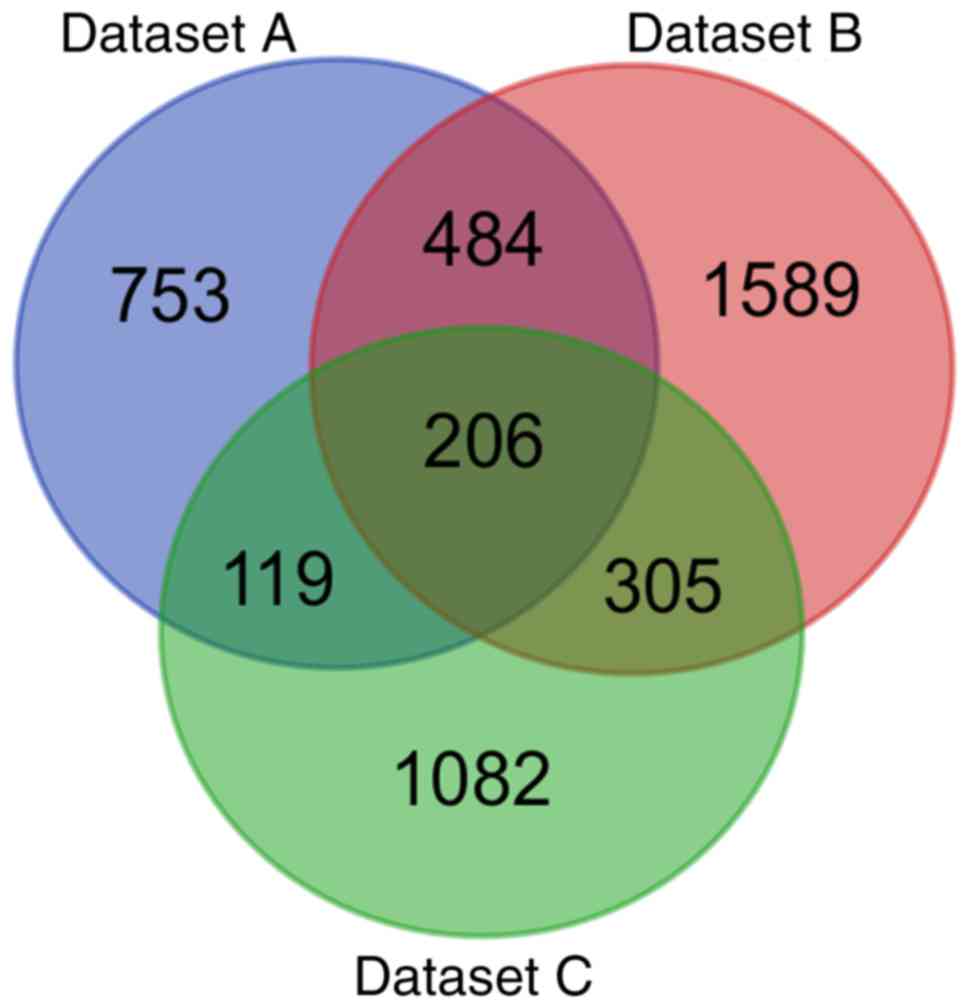
Following data filtering, the data of 31 OTSCC
samples and 26 normal tongue samples from dataset GSE13601 were
termed dataset A, 12 OTSCC samples and 39 normal tongue samples
from GSE31056 were dataset B, and 26 OTSCC samples and 4 normal
tongue samples of GSE78060 were dataset C. Comparing the OTSCC
tissues with the normal tongue tissues, a total of 1,562, 2,584 and
1,712 DEGs were identified in datasets A, B and C, respectively.
Subsequently, when the DEGs were investigated for overlap, a total
of 206 consistently aberrant genes were identified (Fig. 1), comprising 125 upregulated and 81
downregulated genes (Table I).
Subsequently, these DEGs were subjected to survival analysis. The
results revealed that four genes, NCLN, THBS2, SPARCL1 and YKT6,
were associated with the outcome of patients with OTSCC in TCGA
(Table II).
 | Table I.List of 206 consistently aberrant
genes identified from three Gene Expression Omnibus datasets. |
Table I.
List of 206 consistently aberrant
genes identified from three Gene Expression Omnibus datasets.
| Gene
expression | Differentially
expressed genes |
|---|
| Upregulated
(n=125) | IFI27, CDH3, PYGL,
MYO1B, MMP1, SCO2, TYMP, BNC1, COL4A1, MMP3, PTHLH, IRF6, F2RL1,
COL4A2, IFI6, ACTN1, THBS2, RAB31, SLC16A1, ISG15, PRNP, KRT16,
TPBG, MDFI, OSMR, PLAU, SERPINE1, PROCR, PXDN, DUSP7, ITGA6,
COL1A2, SOX15, LAMB3, SHC1, NDRG1, LAMC2, ADORA2B, PDLIM4, COL5A2,
GJA1, LGALS3BP, MMP13, DFNA5, IL1RAP, PDPN, RGS20, FSCN1, TPST1,
STK3, SLC7A5, CTSC, ADAM10, COL7A1, UPP1, PTK7, CA2, ITGA3, GJB3,
APOL1, SCG5, EIF6, PLAUR, SOX11, MMP10, COL3A1, TGFBI, MMP12,
COL17A1, IRF9, ZWINT, STAT1, BPGM, PCDH7, NUP155, GNA15, POSTN,
OAS1, IGFBP3, FAP, COL4A5, TUBB3, DUSP14, FST, TK1, SNAI2, FOXM1,
GINS1, TRIP13, HIST1H2AE, IFIT3, PLOD2, DSG2, TGIF1, MYO10, IFI44,
IFIT1, CXCL11, PRSS23, RBP1, SQLE, YKT6, KRT10, SNAPC1, BST2,
HOMER3, SPP1, ENO1, DLGAP5, KIF23, OASL, COL4A6, RSAD2, CDC20, TNC,
F3, FOLR3, EFNA1, PLSCR1, FN1, HIST1H2BD, GNLY, S100A3, LY6E,
CCNB1 |
| Downregulated
(n=81) | ADH1B, GPRASP1,
MEOX2, MYRIP, CBX7, ATP6V0E2, GPR64, C7, RNASE4, ITM2A, SLC25A20,
CDO1, CLDN10, MAN2A2, GNG7, SATB1, TXNIP, SERPINA5, LPIN1, ABCA3,
SELENBP1, LMO2, GYPC, CXCL12, KAT2B, ZNF529, RTN1, PRELP, ANG, CFD,
SSBP2, CCDC69, ENPP4, BEX4, TSPYL5, MYOC, NCLN, SYNGR1, GDF10,
P2RY14, CLU, PIP5K1B, ALDH1A1, CILP, MFAP4, FRZB, IGF1, TOX3,
ZBTB20, RORC, NR3C2, PTGFR, CPEB3, LGI1, SUSD5, CLGN, GAS2, LCP1,
SORBS2, HLF, DPT, CX3CR1, SERPINI1, ACOX2, ASPA, PCK1, MIA, LMOD1,
NFIB, SLITRK5, CRISP3, DCLK1, ANGPT1, ABCA6, FAM149A, SPARCL1,
NPY1R, PTGDS, AMPD1, FBLN5, STATH |
| Table II.Genes significantly associated with
overall survival in oral tongue squamous cell carcinoma. |
Table II.
Genes significantly associated with
overall survival in oral tongue squamous cell carcinoma.
| Gene | HR | 95% CI | P-value |
|---|
| NCLN | 38.678 | 1.117–6.192 | 0.0047 |
| THBS2 | 2.050 | 0.153–1.283 | 0.0127 |
| SPARCL1 | 3.333 | 0.097–2.310 | 0.0330 |
| YKT6 | 13.765 | 0.179–5.065 | 0.0354 |
Gene enrichment and functional
annotation analysis of DEGs in OTSCC
With adjusted P<0.05 as the cut-off criterion,
the GO analysis was performed. A total of 206 DEGs were enriched
significantly into 27 diverse GO terms, being categorized into
three functional groups: Biological process (BP), cellular
component (CC) and molecular function (MF) (Fig. 2). Among these terms, extracellular
matrix (ECM) organization, extracellular space and ECM structural
constituent were the most significant in the BP, CC and MF groups,
respectively. Furthermore, the candidate genes were enriched in
terms of cell adhesion, response to virus and angiogenesis.
Subsequently, the pathway enrichment analysis was performed to
assess the aberrant gene-associated pathways. A total of 25
significantly enriched pathways were observed (Fig. 3), a number of which are associated
with ECM organization. Overall, the greatest number of genes were
involved in the phosphoinositide 3-kinase (PI3K)/protein kinase B
(Akt) signaling pathway.
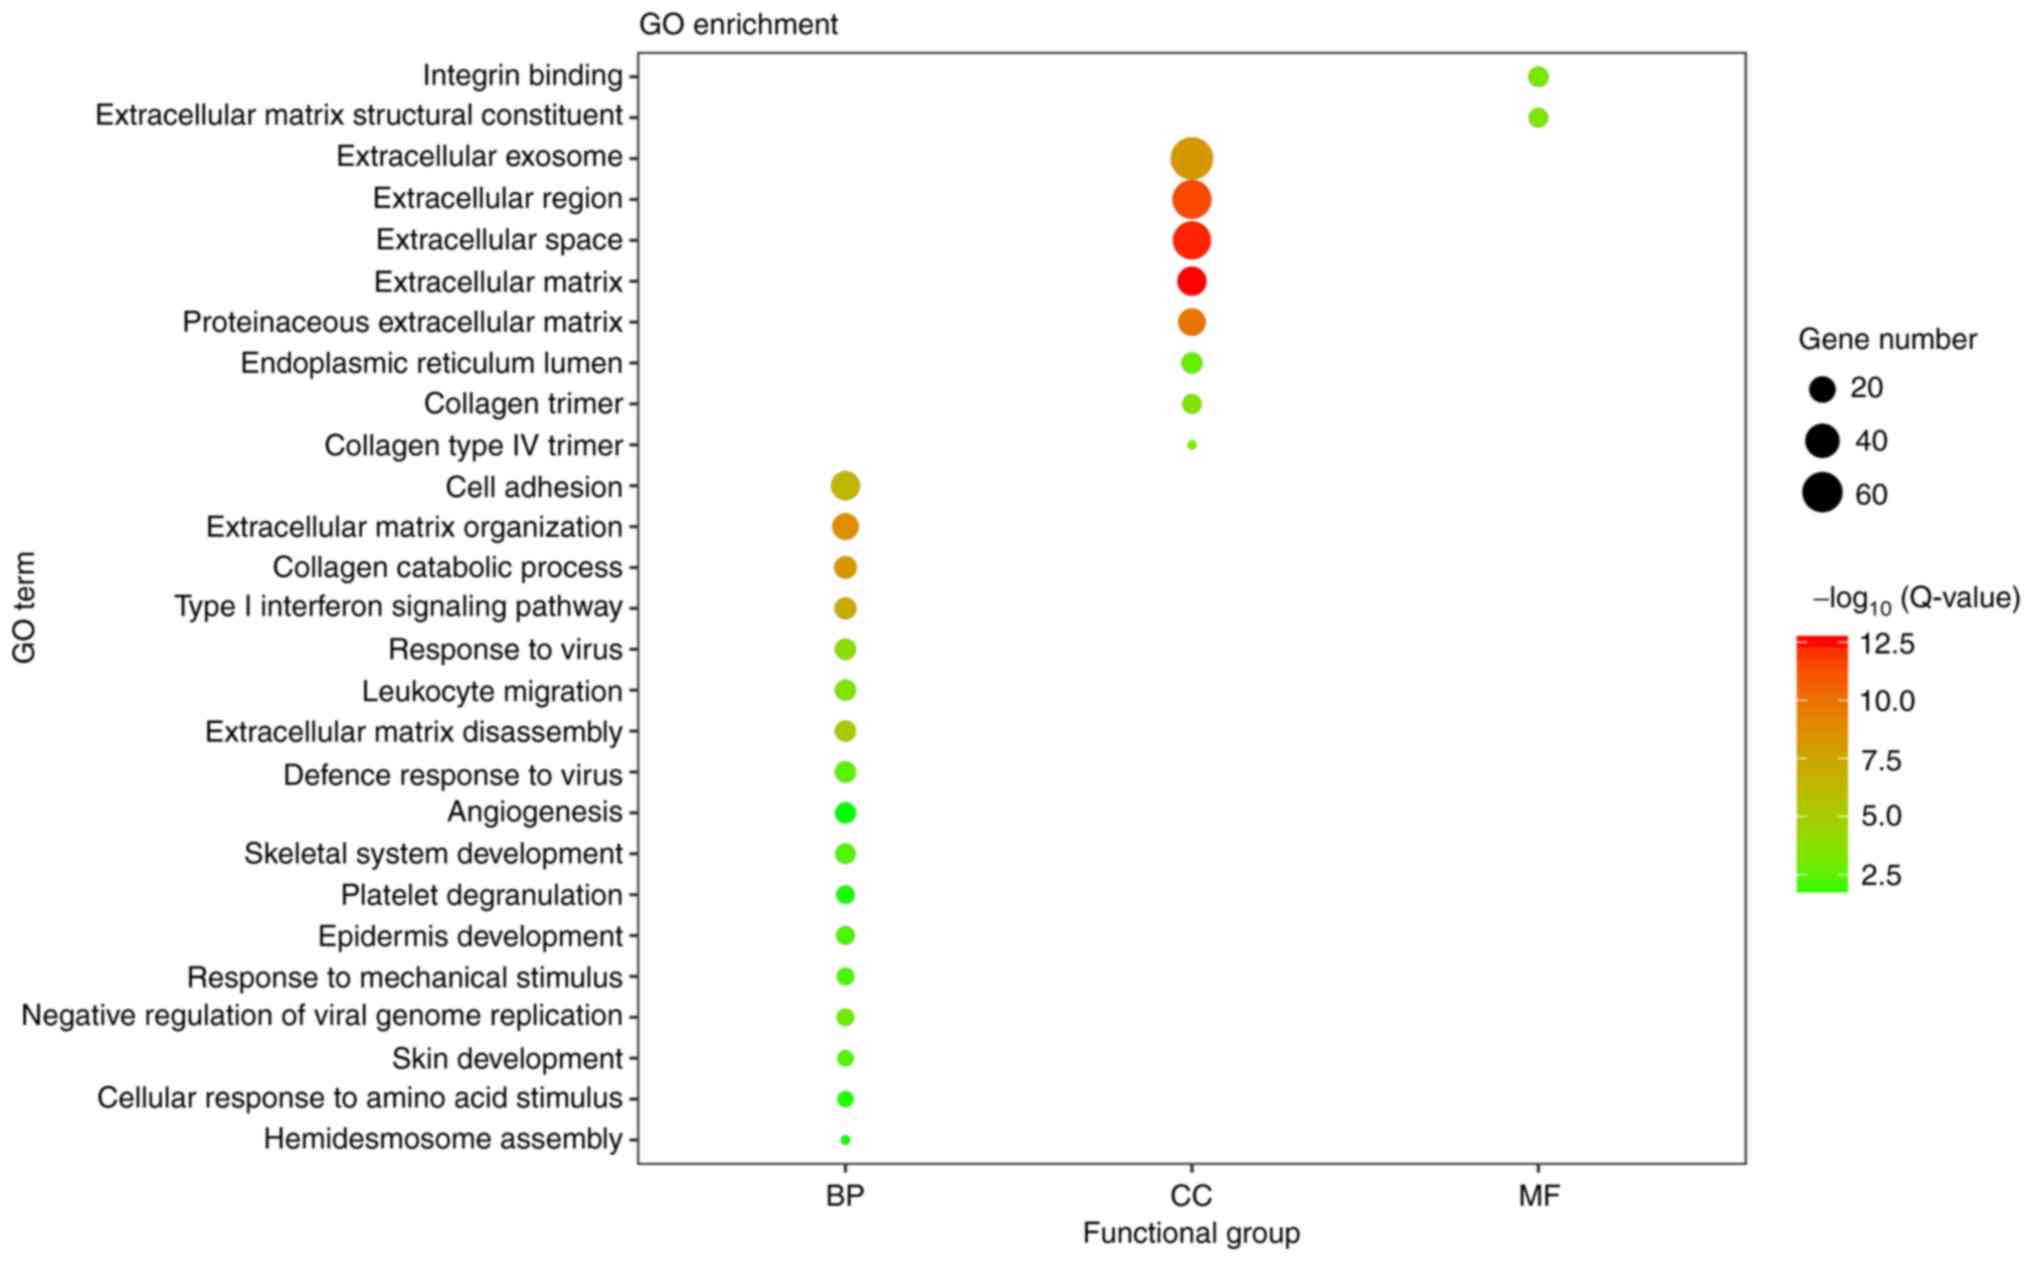 | Figure 2.Visualization of the GO enrichment
analysis for 206 differentially expressed genes in oral tongue
squamous cell carcinoma. The GO enrichment analysis was performed
with the Database for Annotation, Visualization and Integrated
Discovery online tool, and the detailed information is presented as
a bubble chart. The y-axis represents the GO terms, the
x-axis represents the BP, CC and MF functional group
categorization, the size of bubbles represents the number of
assigned genes, and the color of the bubbles indicates the
-log10 (Q-value). The larger the number of genes
associated with the term, the larger the bubble. The more
significant the GO category, the higher on the color bar the bubble
is. GO, Gene Ontology; BP, biological process; CC, cellular
component; MF, molecular function; Q-value, Bonferroni-adjusted
P-value. |
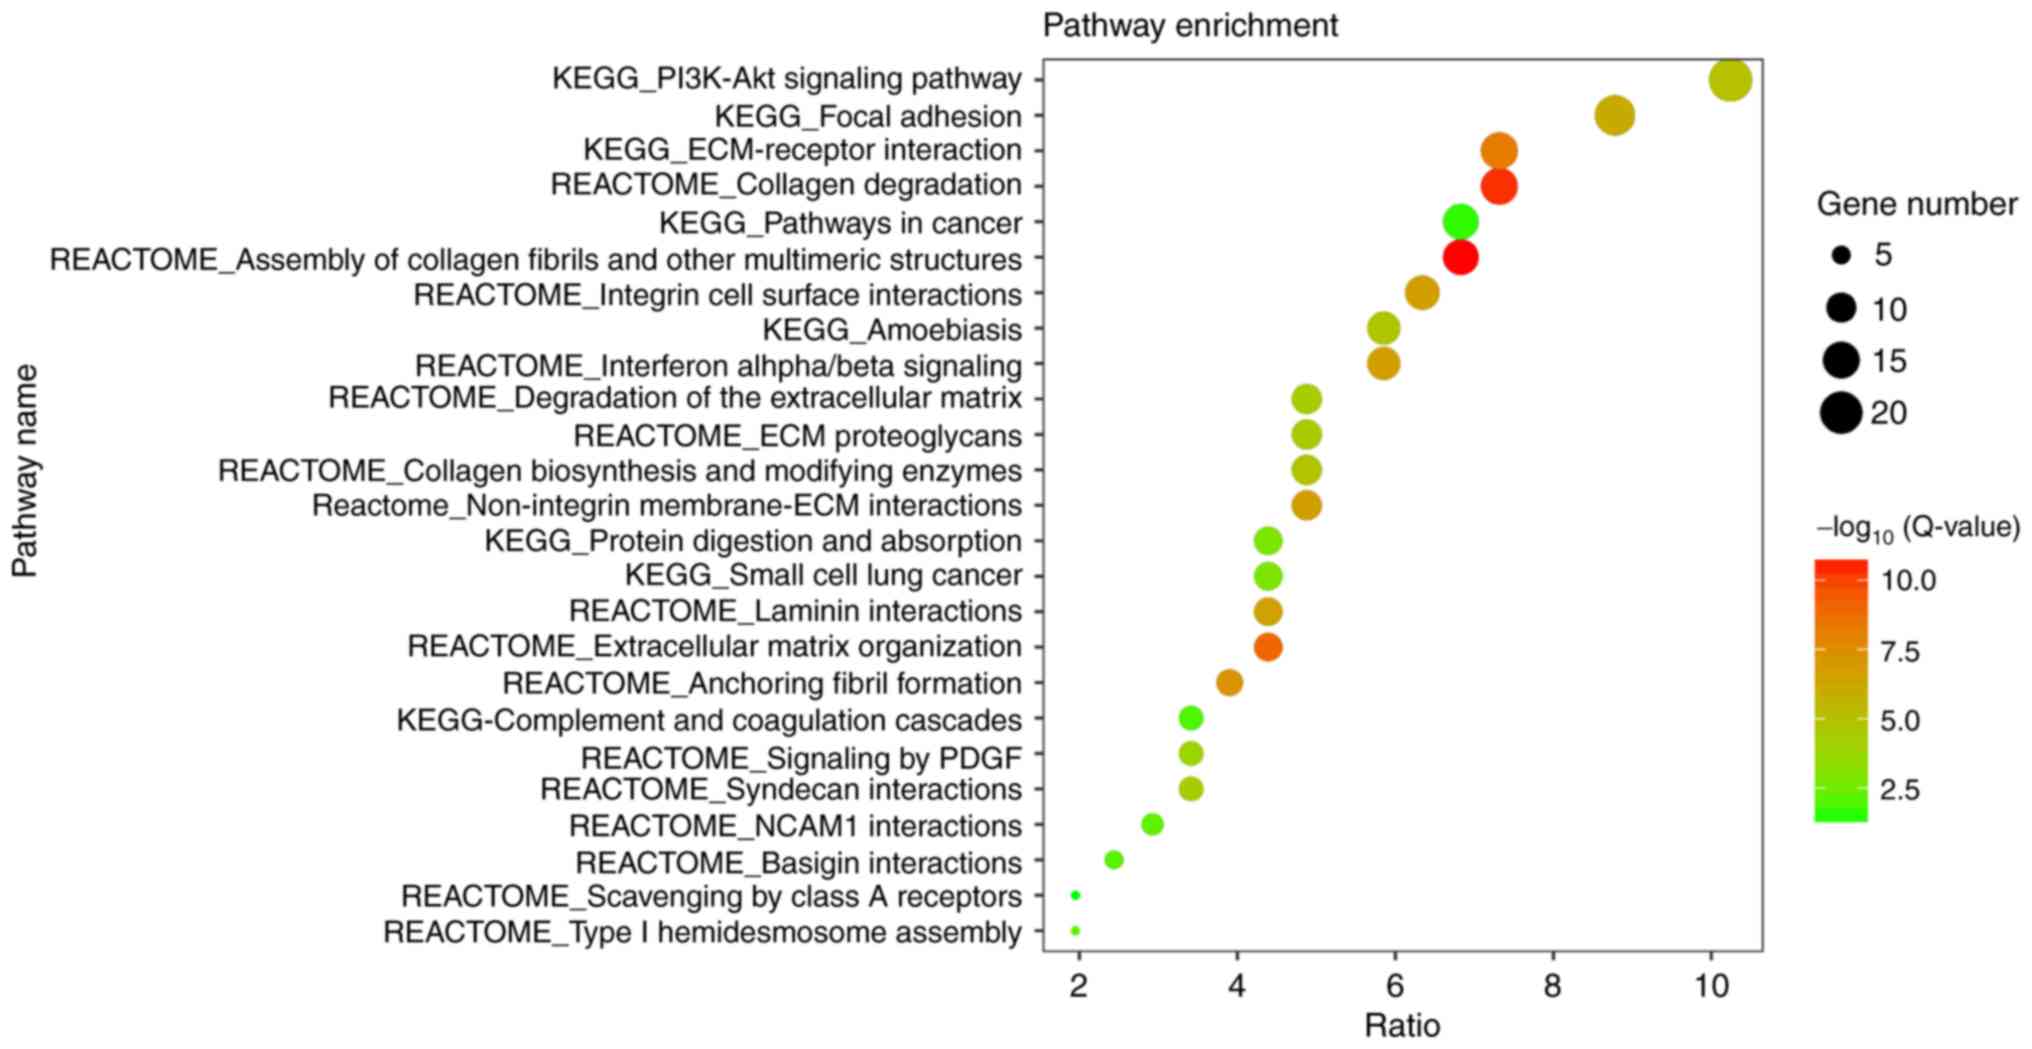 | Figure 3.Visualization of the pathway
enrichment analysis for 206 differentially expressed genes in oral
tongue squamous cell carcinoma. The pathway enrichment analysis was
performed with Database for Annotation, Visualization and
Integrated Discovery online tool, and the detailed information is
presented as a bubble chart. The y-axis represents the
significantly enriched pathways, the x-axis represents the
richness factor, the size of the bubbles represents the number of
assigned genes, and the color of bubbles represents the
-log10 (Q-value). The larger number of genes classified
into the pathway, the larger the node size is. The more significant
the pathway, the higher on the color bar the bubble is. KEGG, Kyoto
Encyclopedia of Genes and Genomes; PI3K, phosphoinositide 3-kinase;
Akt, protein kinase B; ECM, extracellular matrix; PDGF,
platelet-derived growth factor; Q-value, Bonferroni-adjusted
P-value. |
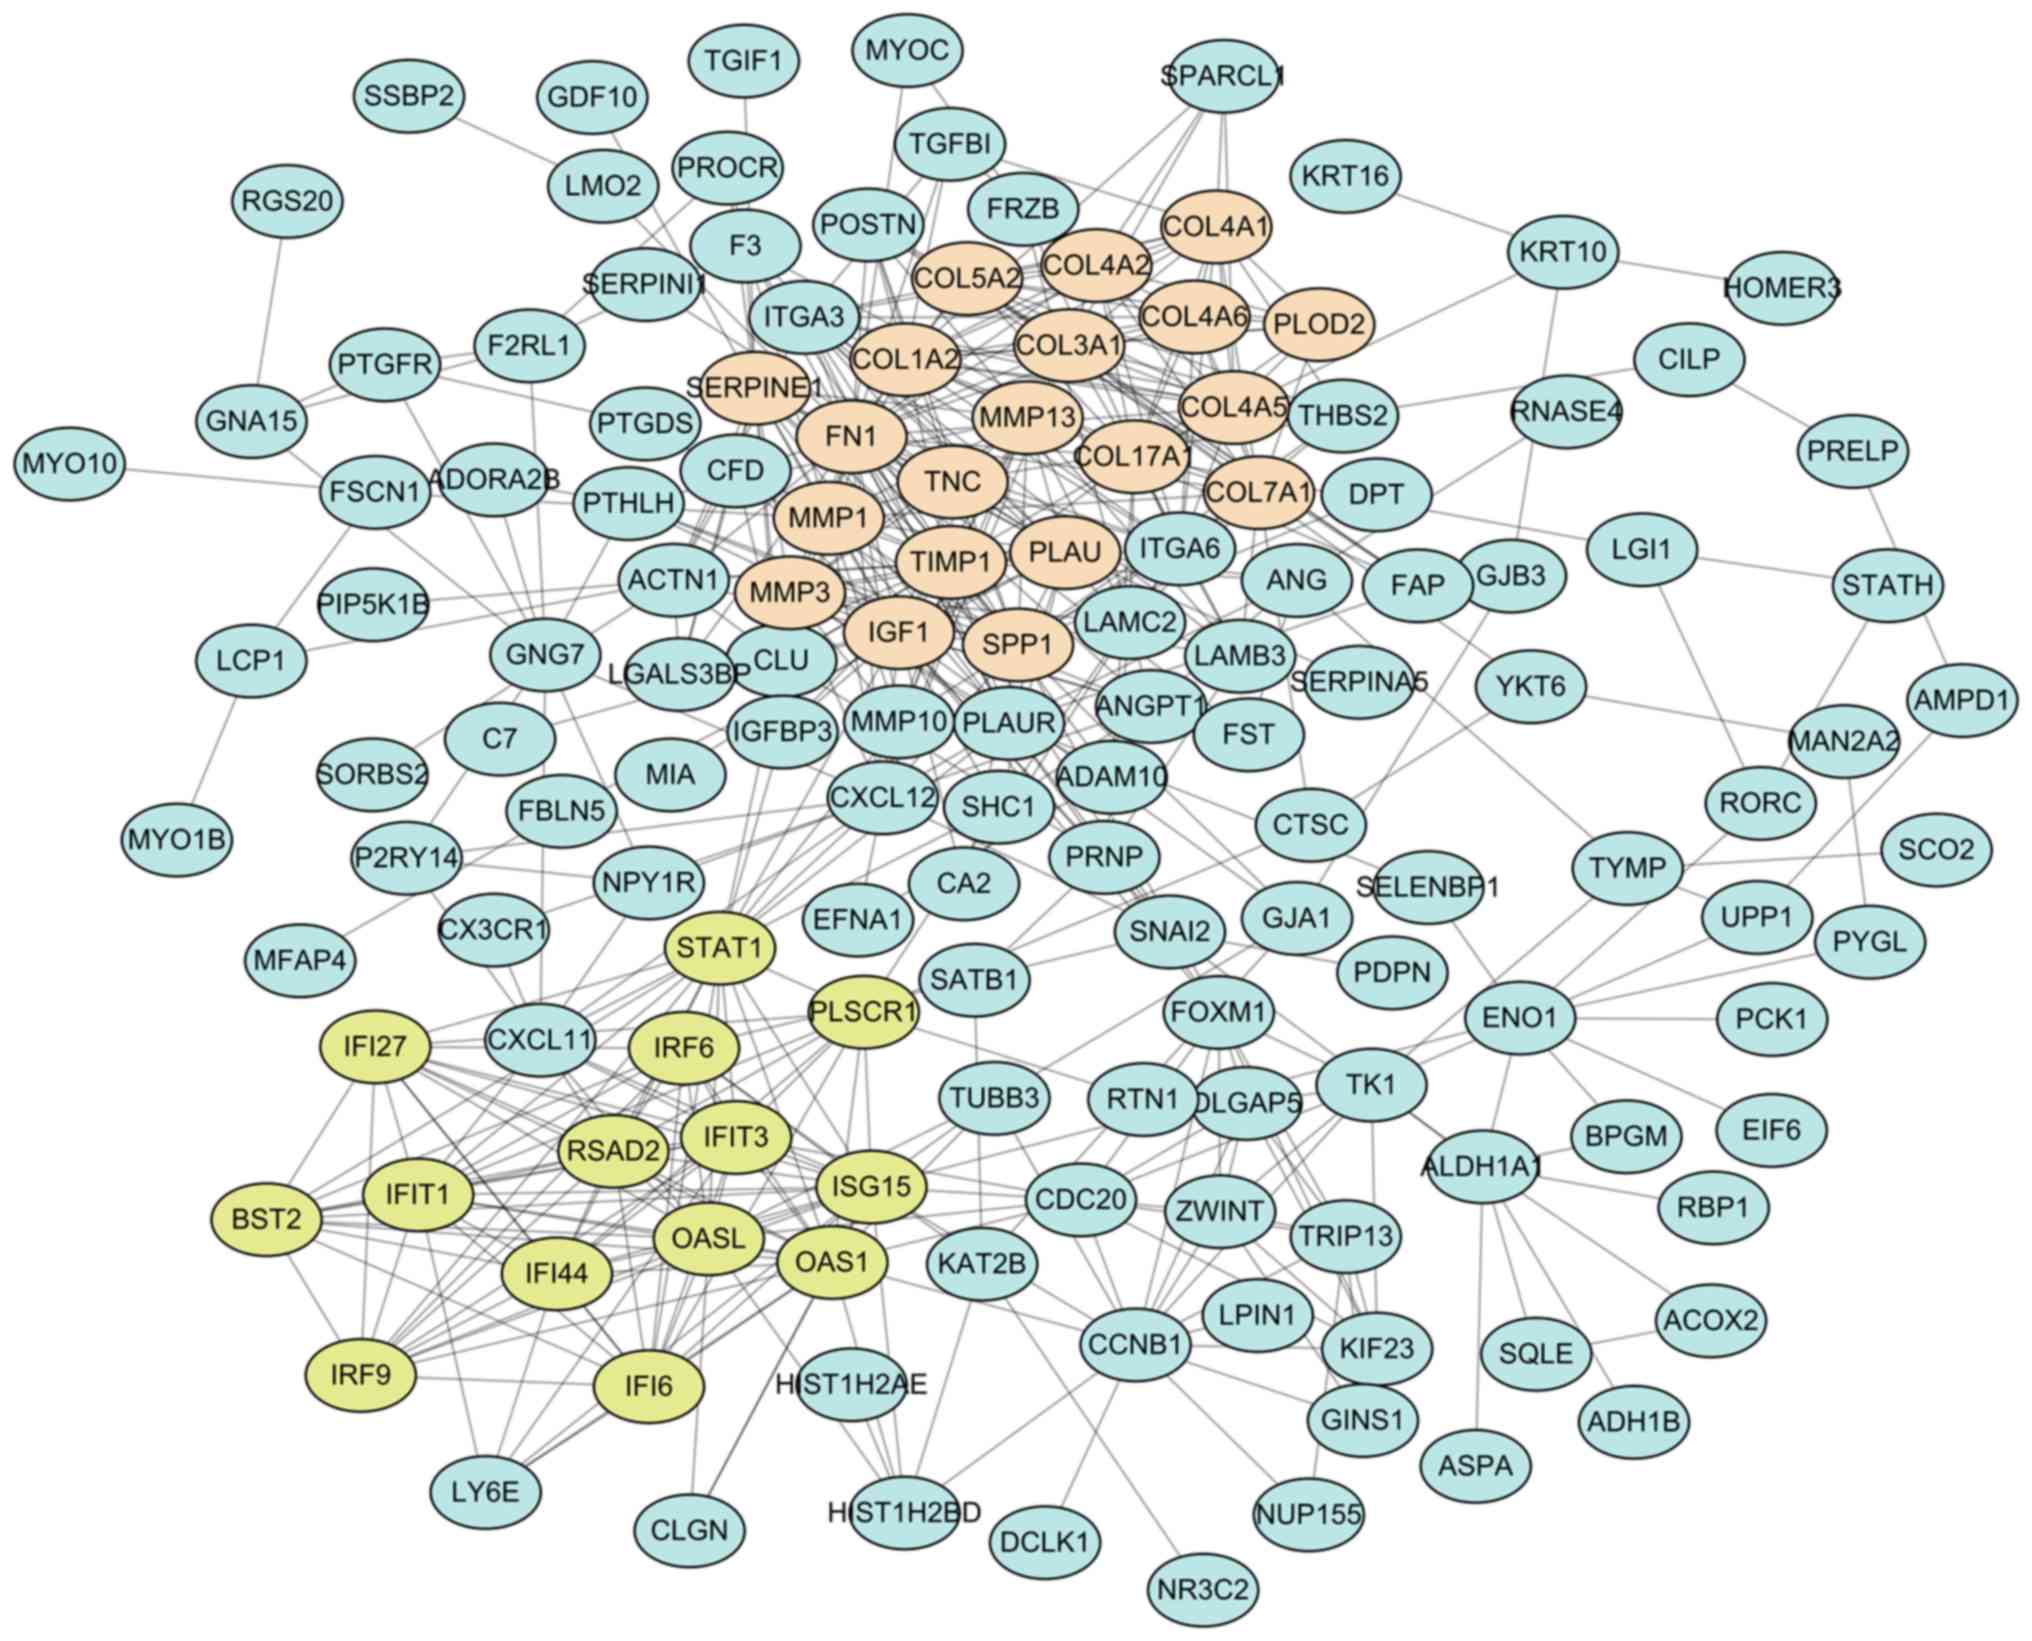
PPI network analysis in OTSCC
The 206 DEG-encoded proteins were searched in the
STRING database, and 206 proteins in Homo sapiens matched
the input. Among these, 142 proteins were filtered into the PPI
network with 523 edges, whereas the remaining 64 disconnected nodes
were hidden (Fig. 4). For the 142
connected nodes, the 20 central nodes were selected with the
filtering criterion of degree >10 within the top 30 betweenness
centrality nodes. These were FN1, IGF1, TIMP1, ISG15, STAT1, SPP1,
COL17A1, SERPINE1, CXCL12, PLAU, MMP1, COL7A1, ITGA6, PLAUR, CCNB1,
ACTN1, PLSCR1, CLU, CXCL11 and FOXM1, among which STAT1 and FOXM1
were identified as transcription factors. Subsequently, two modules
with score >10 were identified using the MCODE plugin and marked
in different colors. Module 1 consisted of 103 edges and 20 nodes
in light salmon, and module 2 consisted of 85 edges and 14 nodes in
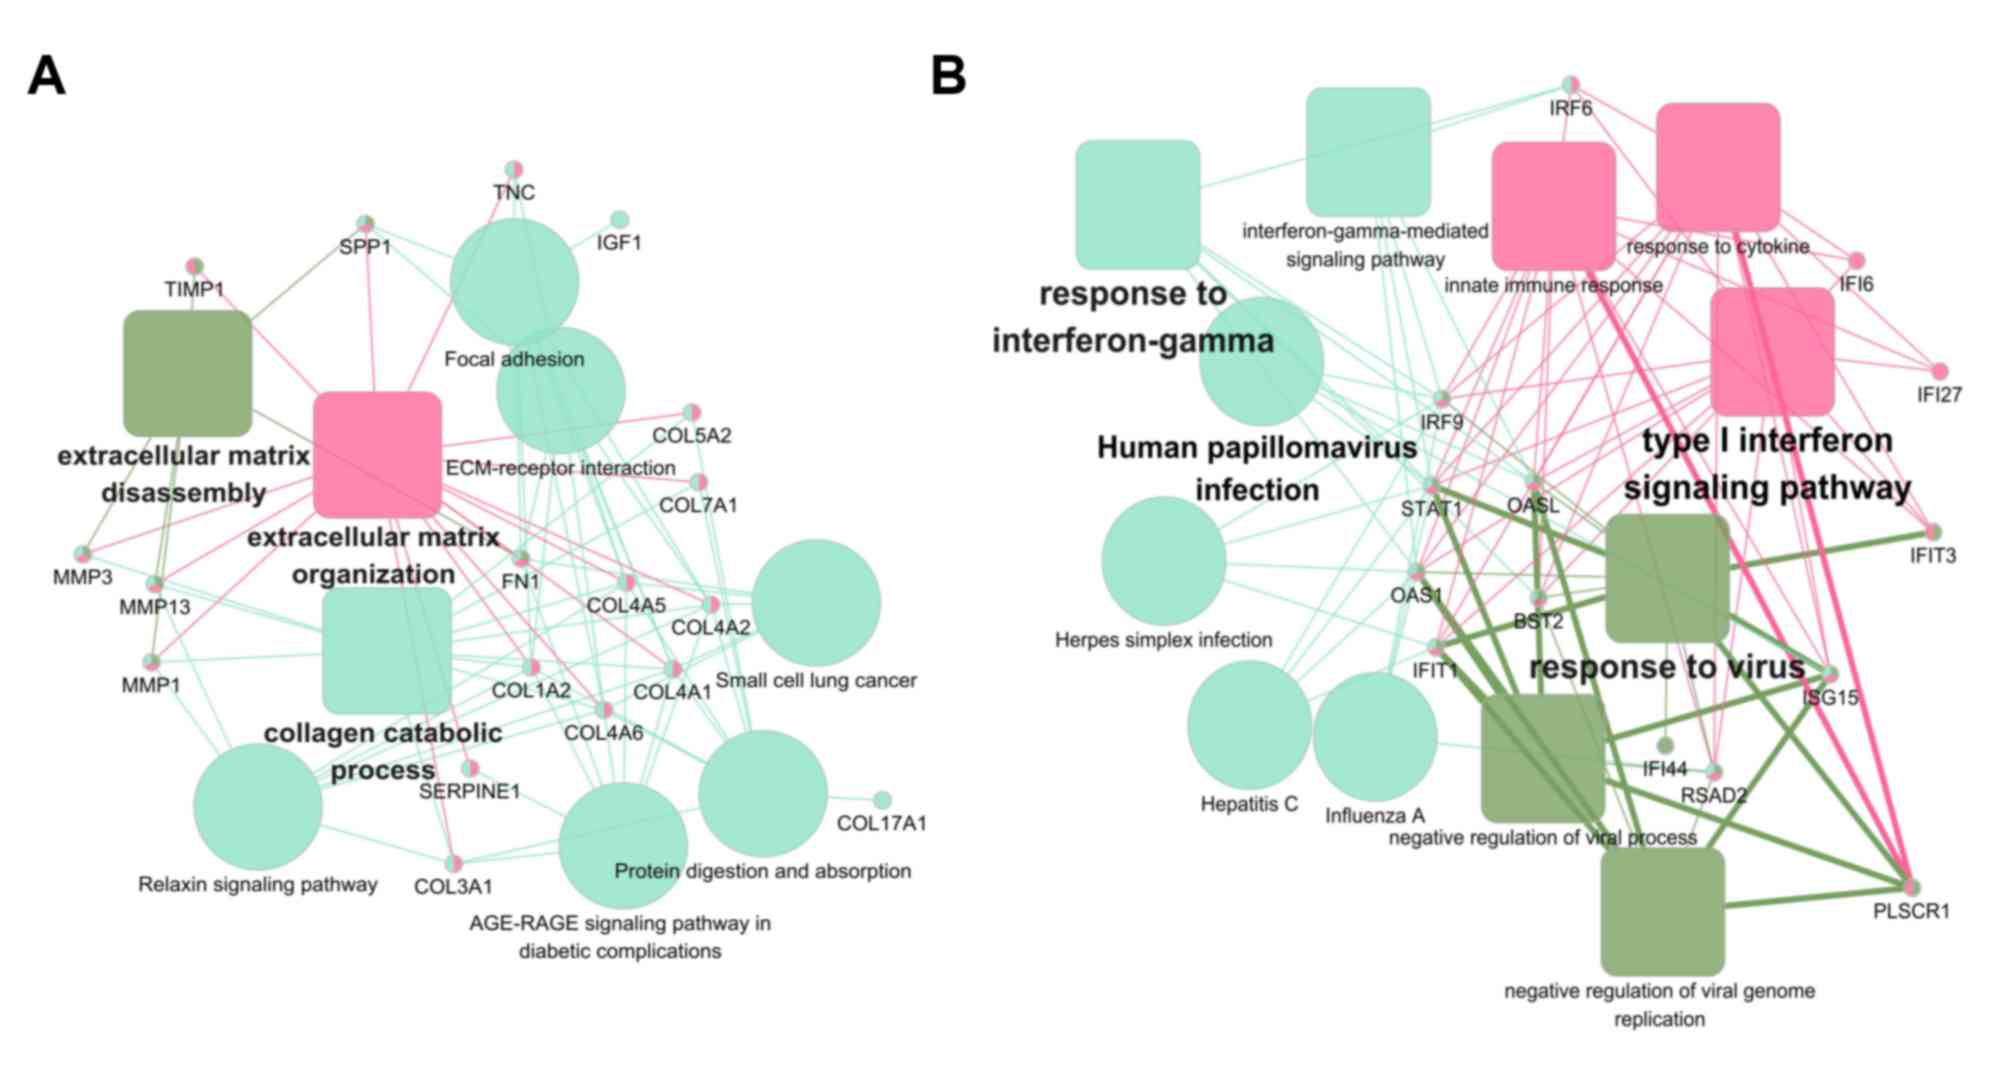
yellow-green. For a further analysis, functional enrichment of
these two modules was conducted using ClueGO + CluePedia plugin.
The function annotation results demonstrated that module 1 was
principally associated with ECM organization (Fig. 5A) and module 2 was principally
associated with human papillomavirus (HPV) infection (Fig. 5B).
Validation of the distinctive
expression profile in OTSCC
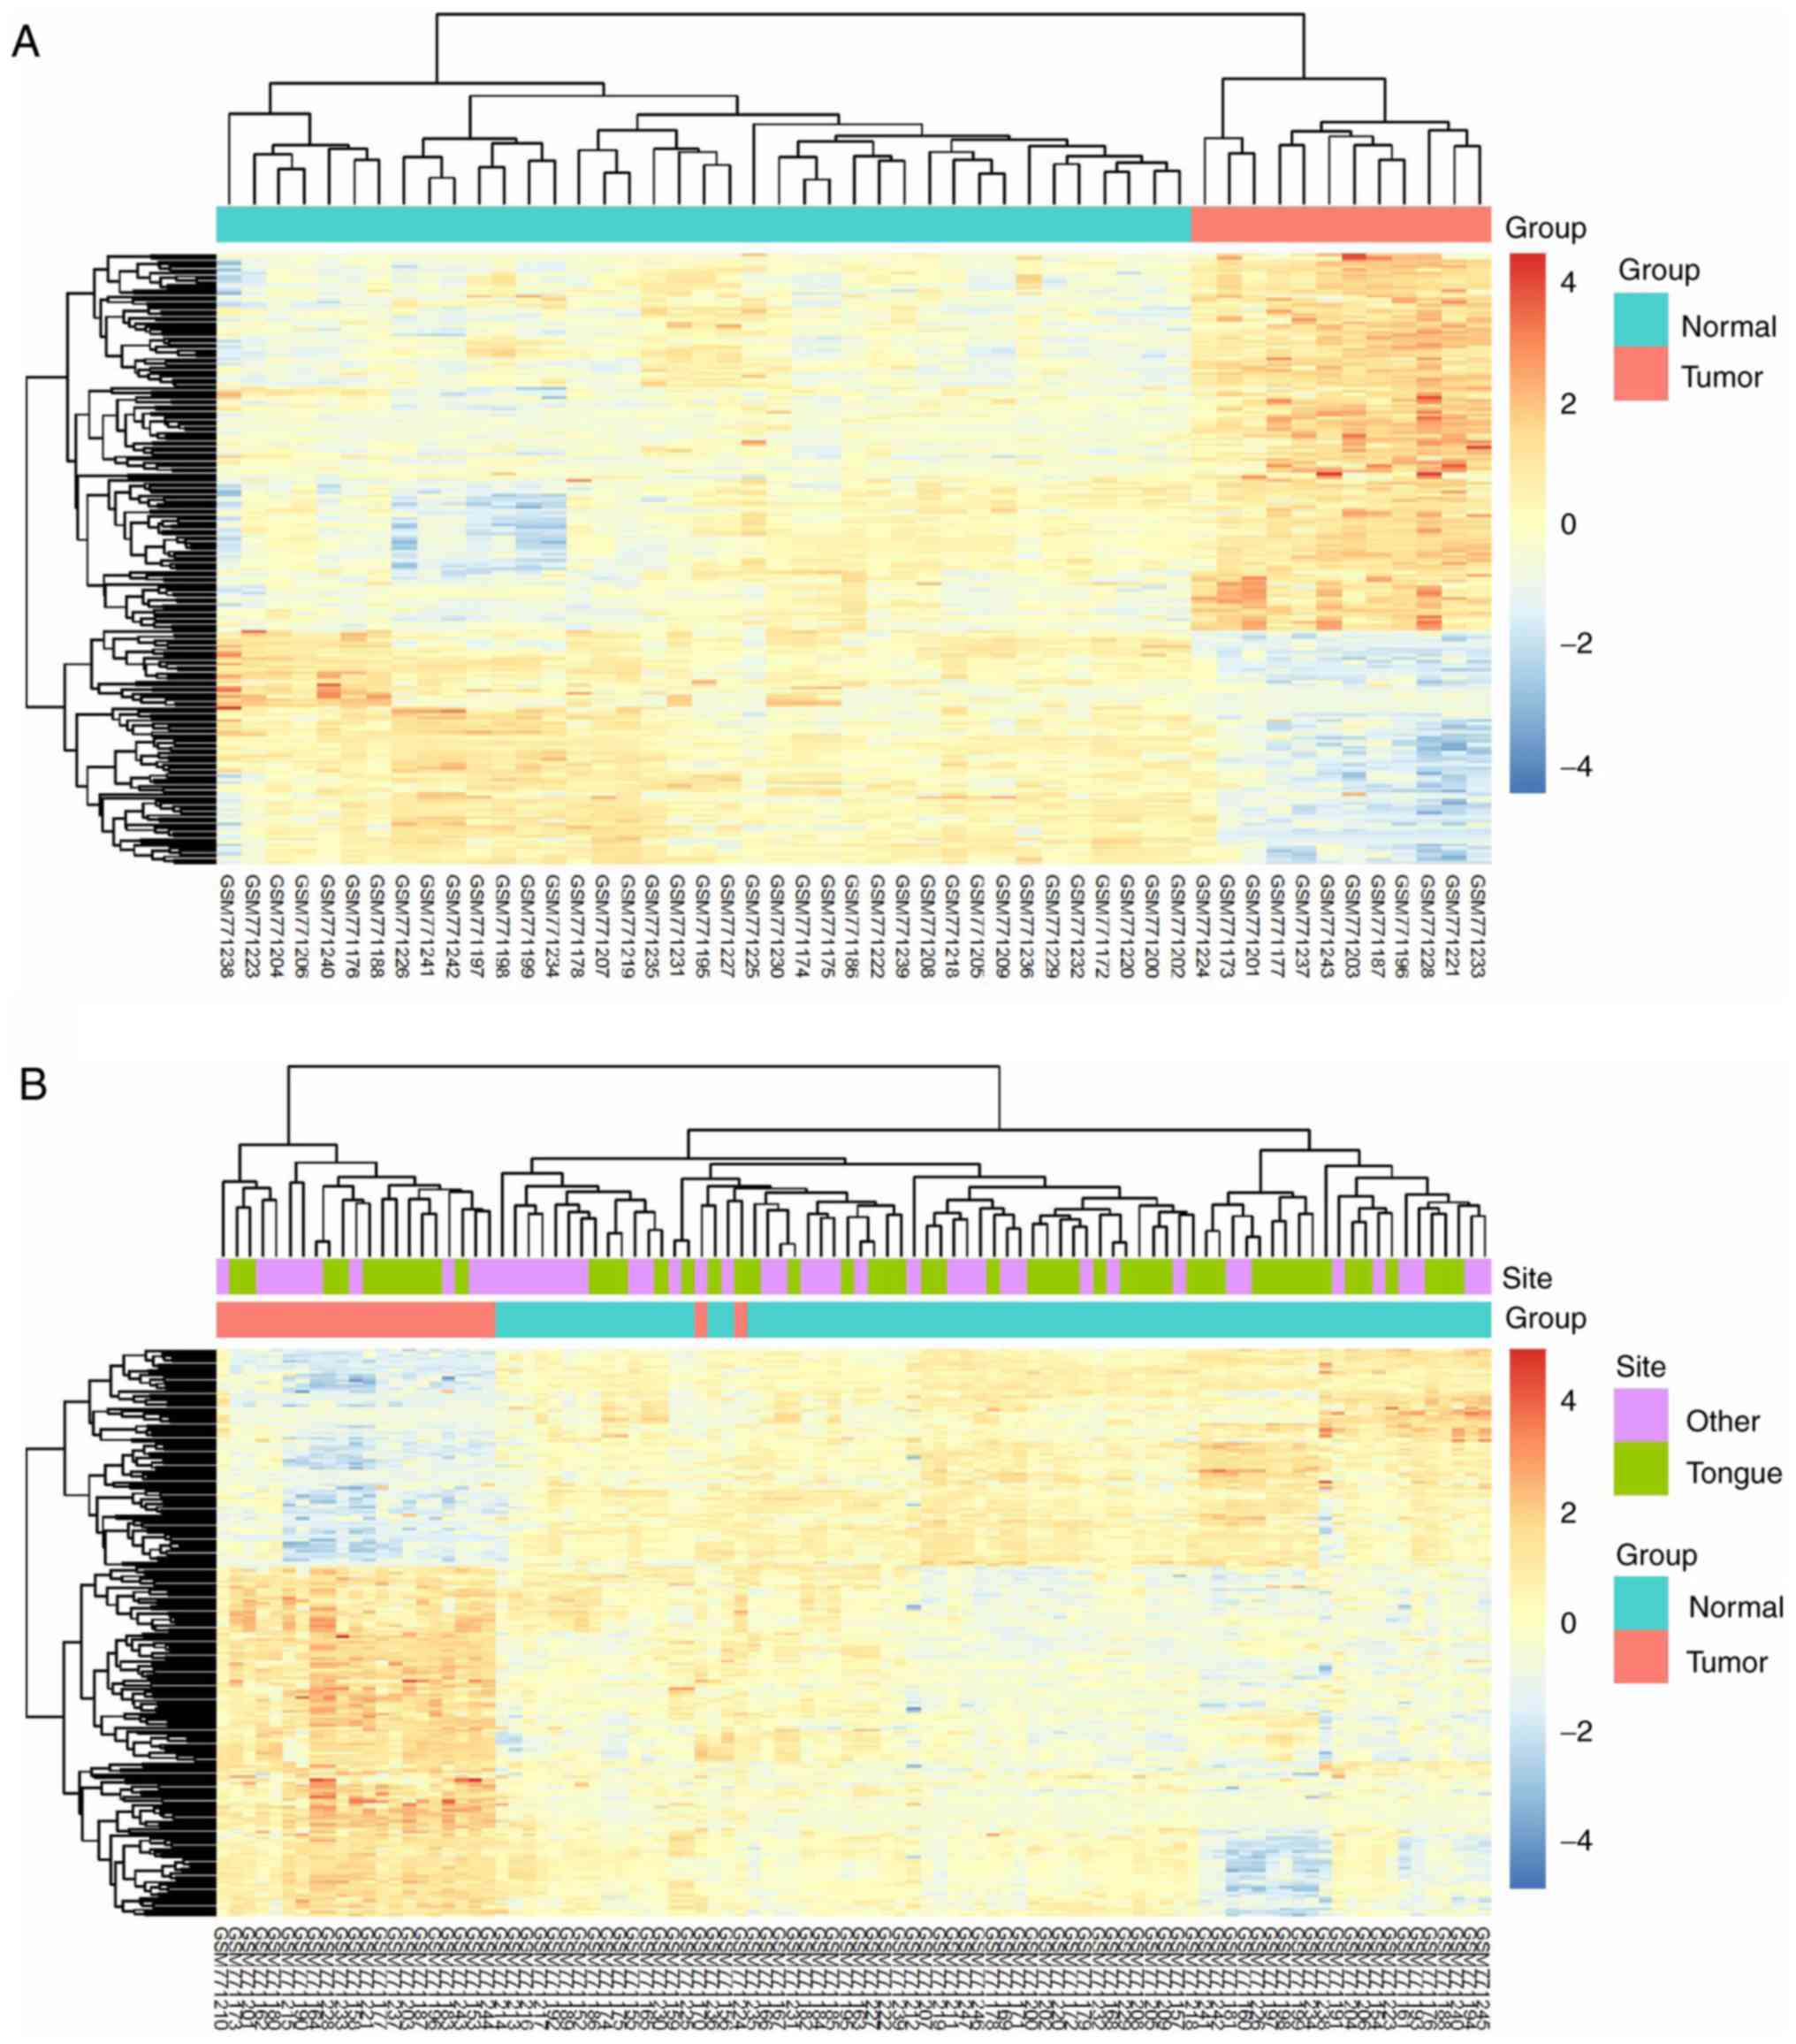
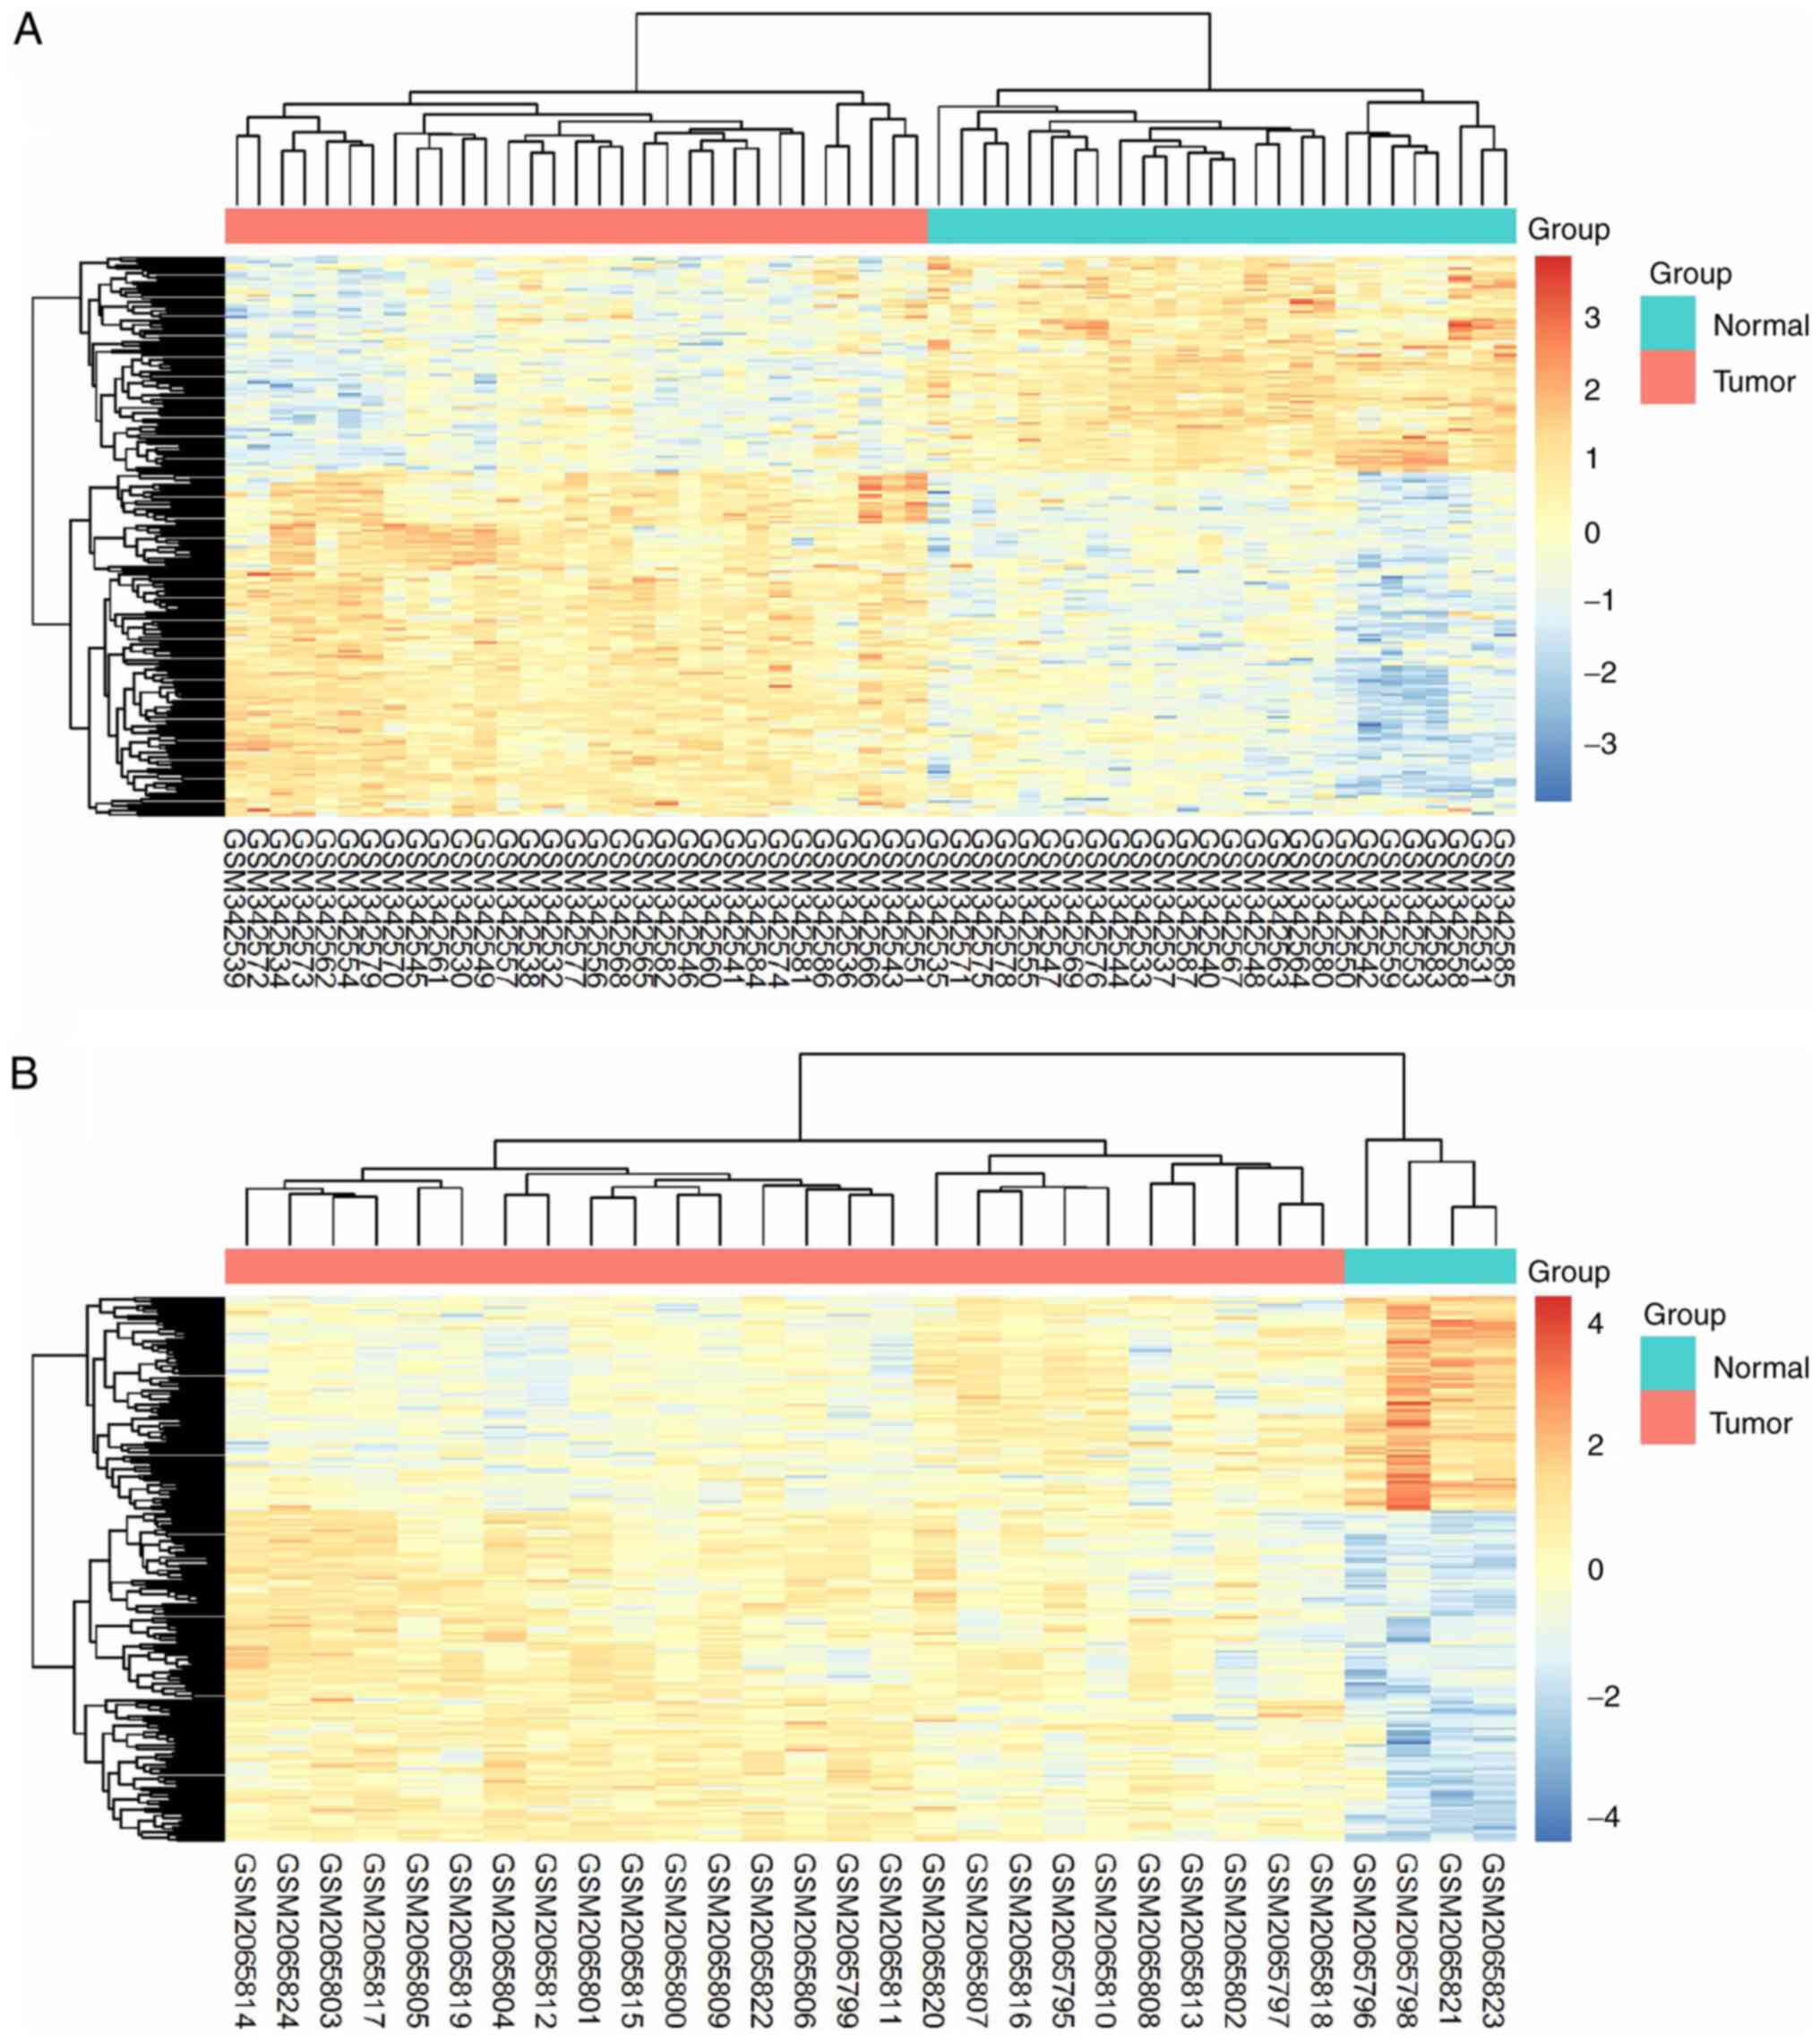
The 206 identified DEGs were subjected to a
two-dimensional hierarchical clustering analysis. In dataset
GSE31056, distinct clusters of tumor and normal tissues were formed
for all tongue samples (Fig. 6A),
whereas for all oral samples, two tumor tissues were grouped within
the cluster of normal tissues (Fig.
6B). As expected, separate clusters between tongue tumors and
normal tongue tissues were also observed for the samples of
GSE13601 (Fig. 7A) and GSE78060
(Fig. 7B). These results revealed the
differences in gene expression profiles between OSTCC and OSCC.
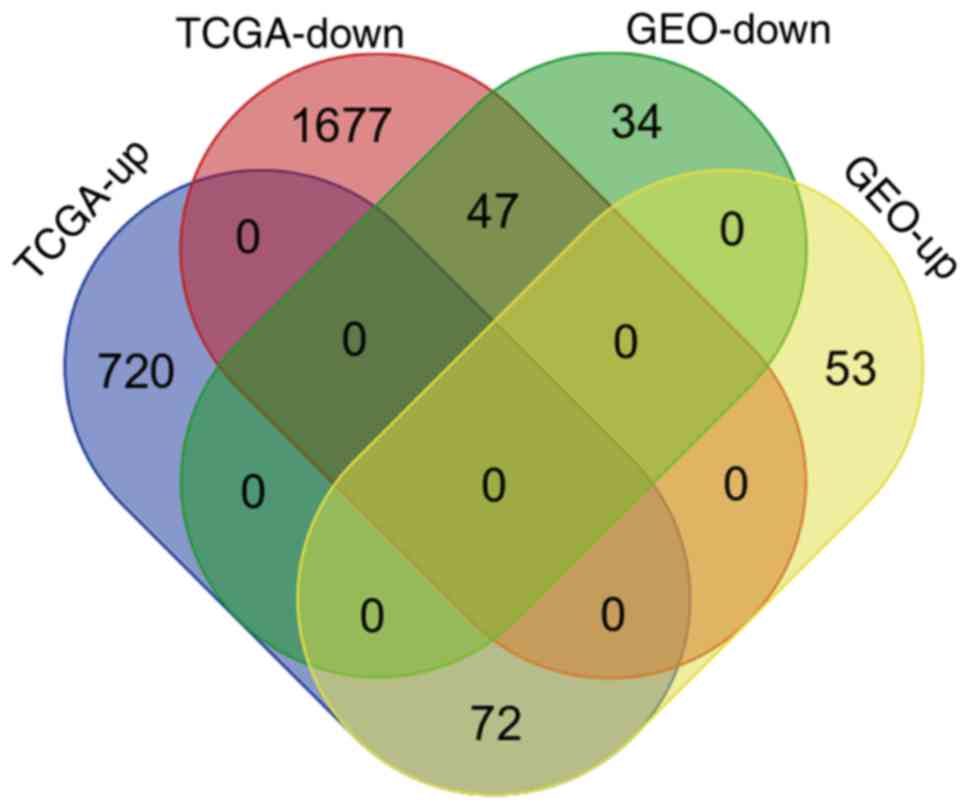
Finally, to confirm the reliability of the identified DEGs,
aberrant genes in OTSCC were screened from data of OTSCC and normal
tongue tissue from TCGA database in order to investigate the
overlap between the data of these two databases. In TCGA OTSCC
data, 1,724 downregulated and 792 upregulated genes were
identified. Although more DEGs were identified in TCGA data, a
total of 119 genes (72 upregulated and 47 downregulated genes) were
identified as concordant between the data of the two databases
(Fig. 8) and are listed in Table III.
| Table III.List of 119 aberrant genes in oral
tongue squamous cell carcinoma identified from the Gene Expression
Omnibus and the cancer Genome Atlas databases. |
Table III.
List of 119 aberrant genes in oral
tongue squamous cell carcinoma identified from the Gene Expression
Omnibus and the cancer Genome Atlas databases.
| Gene
expression | Differentially
expressed genes |
|---|
| Upregulated
(n=72) | COL4A5, CCNB1,
SHC1, ITGA3, GINS1, FOXM1, PXDN, TPBG, FN1, IFI27, FST, COL5A2,
SPP1, ITGA6, PLOD2, MMP1, MMP12, BNC1, KIF23, GNLY, CDH3, COL4A2,
MMP3, POSTN, FSCN1, PLSCR1, DLGAP5, COL4A6, COL4A1, LAMC2, TPST1,
ACTN1, COL1A2, PROCR, SLC16A1, FOLR3, IFIT3, MYO1B, PLAU, MMP13,
HOMER3, PTHLH, CXCL11, MYO10, PTK7, ADAM10, CDC20, RAB31, OASL,
PRNP, TRIP13, DFNA5, ISG15, PDPN, TK1, TNC, FAP, BST2, IFI6, PYGL,
IFIT1, THBS2, PRSS23, SERPINE1, RSAD2, SOX11, RBP1, TGFBI, SNAI2,
SCG5, IFI44, CTSC |
| Downregulated
(n=47) | GDF10, CPEB3, TOX3,
HLF, SORBS2, NPY1R, CLDN10, MIA, SSBP2, NR3C2, CBX7, MYOC,
SLC25A20, GAS2, GNG7, RORC, PIP5K1B, LPIN1, CX3CR1, ATP6V0E2,
SERPINA5, SYNGR1, CFD, RNASE4, SATB1, KAT2B, ENPP4, FAM149A, LMOD1,
ASPA, AMPD1, ANG, BEX4, CRISP3, STATH, DPT, PTGDS, NFIB, SLITRK5,
ALDH1A1, ITM2A, GPRASP1, ADH1B, MYRIP, FRZB, ACOX2, SELENBP1 |
Discussion
Microarrays have been extensively applied to gene
expression studies of human cancer, describing the genetic profiles
of the disease. In the present study, gene expression data of
multiple cohorts were obtained from the GEO database for the
screening of OTSCC-associated genes. Consistent with the results of
previous studies on gene expression in OTSCC (40–42) and
other carcinomas, including hepatocellular carcinoma, ovarian
cancer and nasopharyngeal carcinoma (43–46), the
present study revealed numbers of DEGs in the order of
103 in each cohort. However, the majority of previous
studies were performed on a single cohort and focused on a single
genetic event (40–42). Patient and sample heterogeneity in
independent studies is inevitable, and consequently inconsistencies
exist among these single cohorts. Furthermore, OTSCC has been
classified as OSCC for investigation, thus the distinct gene
expression profile underlying OTSCC remains undefined. By
integrating multiple cohorts, the combination of integrative
bioinformatics methods and expression datasets is an innovative way
to solve these problems. Therefore, a multiple-cohort integrative
analysis with a relatively stringent sample filtering was applied
in the present study. The term OTSCC was used as a query to screen
the candidate microarray datasets in the GEO database. First,
datasets with ambiguous anatomical information were removed.
Secondly, those with <30 tongue samples were removed. Thirdly,
certain datasets concerning formalin-fixed paraffin-embedded
samples in long-term archives were removed, owing to the poor
quality of RNA. Finally, three datasets with a total of 69 tumors
and 69 normal tissues of the tongue were included in the present
study and an overlap of 206 DEGs was identified. Numerous studies
have demonstrated that the anatomical site is one of the factors
that influences progression and prognosis of OSCC (10,47). Owing
to a rich blood supply and lymphatic drainage, OTSCCs are more
likely to metastasize compared with other types of OSCC (48). A number of studies suggested that
OTSCC possesses distinct epidemiological characteristics (7,8), and a
corresponding distinct gene profile is therefore expected. From the
expression data of 206 DEGs in datasets A, B and C, the
distribution of the samples in two separate clusters was in
agreement with their classification as tumor or normal tissue.
Notably, taking all samples of GSE31056 into account, one tongue
tumor sample (GSM771224) and one buccal carcinoma sample were
classified within the cluster of normal tissues, which might
suggest these two samples have distinct gene expression compared
with the other OTSCC samples.
GO analysis is a method used to annotate genes and
provide evidence-based statements associating them with specific
ontology terms (27,28), whereas pathway databases, including
KEGG (29,30) and Reactome (31–32), are
web resources for understanding high-level functions and
interpreting pathway knowledge to support basic and clinical
research. In the present study, the samples were analyzed using the
DAVID online tool, which integrates a comprehensive set of
functional annotation tools including the three aforementioned
databases (25,26), in order to decipher the biological
functions of the identified DEGs. Regarding GO annotation, the most
significantly enriched terms were all associated with the ECM, in
agreement with the results of a previous study (41). Certain biological ECM molecules,
including fragments of glycosaminoglycan and hyaluronan, are key
regulators of injury and inflammatory response during
carcinogenesis (49). Certain other
ECM proteins, including MMP, regulate cell motility, which may
account for the high probability of distant metastasis of OTSCC.
Furthermore, the appearance of cell adhesion and angiogenesis terms
in OTSCC is reasonable, as these processes are associated with
cancer development and metastasis. Regarding the pathway
enrichment, the majority of significantly enriched terms were
associated with ECM organization, in agreement with the results of
the GO enrichment. The majority of detected DEGs were involved in
the PI3K/Akt signaling pathway, which is a critical pathway
regulating diverse cellular functions, including metabolism,
growth, proliferation, survival, transcription and protein
synthesis (50). Aberrant Akt
signaling is the underlying defect in a number of diseases,
including cancer (51). Numerous
studies have demonstrated that the PI3K/Akt signaling pathway
serves an essential function in the origin and progression of OTSCC
(52,53). In addition, Yu et al (54) suggested that the pathway may be a key
regulator of radiosensitization in patients with OSCC. Therefore,
the result that the PI3K/Akt signaling pathway is affected in OTSCC
is reasonable.
In order to delineate complex biological processes,
including cancer initiation and progression, it is helpful to
consider DEGs in the context of a complex molecular network. The
STRING database is an online resource curating known and predicted
PPIs for constructing functional protein association networks.
Although human PPI maps represent only a fraction of the complete
interaction network, their utility in interpreting complex cancer
signatures has led to them being more widely used and a valuable
aid in research. In the present study, a PPI network consisting of
142 nodes and 523 edges was established. Topology analysis
suggested that FN1, IGF1, TIMP1, ISG15, STAT1, SPP1, COL17A1,
SERPINE1, CXCL12, PLAU, MMP1, COL7A1, ITGA6, PLAUR, CCNB1, ACTN1,
PLSCR1, CLU, CXCL11 and FOXM1 were the hub molecules. Among them,
IGF1, FN1, SERPINE1, SPP1, COL17A1, COL7A1, MMP1, TIMP1, ITGA6 and
ACTN1 are involved in the regulation of cancer cell adhesion and
motility (55–58). Additionally, CCNB1, SERPINE1 and IGF1
are involved in the cellular tumor antigen p53 signaling pathway
(59), and COL17A1 has been
identified as a novel target of p53 with an inhibitory effect on
breast cancer migration and invasion (60). Furthermore, STAT1 and FOXM1 are
transcription factors. A previous study suggested that BCL10
promotes OSCC progression through activating STAT1 and ATF4
(61). Yang et al (62) provided evidence that FOXM1 is a
mediator of epithelial-mesenchymal transition, facilitating OTSCC
migration and invasion. Another study noted the importance of PLAU
and PLAUR in complement and coagulation cascades that are linked to
immune responses to tumors (63).
Therefore, these molecules may represent promising candidates for
molecular diagnosis and therapeutic intervention for patients with
OTSCC. In further exploration, a sub-network analysis was performed
and three representative modules were identified. As expected, an
ECM organization-associated module was represented. Notably, the
other module was associated with HPV infection, which has been
identified as an emerging risk factor for OTSCC (64). Together, the results support the
reliability of functional analysis of DEGs, and propose these hub
genes as promising candidates for further functional
experimentation.
Finally, an analysis of overlap further verified the
reliability of the results of the present study. In total, 119/206
were also differentially expressed in TCGA OTSCC samples. Although
the DEG lists derived from the two datasets were not identical, the
disparity is explicable. First, different detecting platforms may
partly account for the differences between the results from the two
datasets, as neither RNA sequencing data nor microarray data cover
the complete genome. Secondly, the absence of probes in certain
datasets may result in fewer identified DEGs in the present
analysis. Specifically, HOXD11, CDK1 and CCL15 were identified as
DEGs in TCGA data. However, HOXD11, CDK1 and CCL15 are not present
on the GSE13601, GSE31056 or GSE78060 arrays, respectively.
Furthermore, the different genetic background of individuals and
tumor heterogeneity may also be part of the reason.
In conclusion, using multiple cohort profile
datasets and integrative bioinformatics analysis, the present study
has identified a set of DEGs that may help in better distinguishing
OTSCC from normal tongue tissue. The identified gene set may
contain candidate molecular targets for disease-specific diagnosis
and therapy.
Acknowledgements
Not applicable.
Funding
The present study was supported in part by the
National Natural Science Foundation of China (grant nos. 81703005
and 81201730), the Natural Science Foundation of Hunan Province
(grant nos. 2017JJ3195, 2018JJ3311 and 12JJ5073), the China
Postdoctoral Science Foundation (grant no. 2012M521565), the
Research Project of Health and Family Planning Commission of Hunan
Province (grant no. B2017098) and the Hunan Provincial Science and
Technology Program (grant no. 2010FJ3078).
Availability of data and materials
The datasets analyzed during the current study are
available from the Gene Expression Omnibus (www.ncbi.nlm.nih.gov/geo) and The Cancer Genome Atlas
(cancergenome.nih.gov).
Authors' contributions
YL, YZ and XZ conceived and designed the study; YL,
RW, HW, BZ, SD, QD, MP, XS, JY and RH performed data analysis; YL
wrote the manuscript; YL, XZ, HW, and YZ edited the manuscript
prior to acceptance. All authors reviewed the manuscript and
approved the final version.
Ethics approval and consent to
participate
Not applicable.
Patient consent for publication
Not applicable.
Competing interests
The authors declare that they have no competing
interests.
References
|
1
|
Torre LA, Bray F, Siegel RL, Ferlay J,
Lortet-Tieulent J and Jemal A: Global cancer statistics, 2012. CA
Cancer J Clin. 65:87–108. 2015. View Article : Google Scholar : PubMed/NCBI
|
|
2
|
Harris SL, Kimple RJ, Hayes DN, Couch ME
and Rosenman JG: Never-smokers, never-drinkers: Unique clinical
subgroup of young patients with head and neck squamous cell
cancers. Head Neck. 32:499–503. 2010.PubMed/NCBI
|
|
3
|
Chaturvedi AK, Engels EA, Anderson WF and
Gillison ML: Incidence trends for human papillomavirus-related and
-unrelated oral squamous cell carcinomas in the United States. J
Clin Oncol. 26:612–619. 2008. View Article : Google Scholar : PubMed/NCBI
|
|
4
|
Shiboski CH, Schmidt BL and Jordan RC:
Tongue and tonsil carcinoma: Increasing trends in the U.S.
population ages 20–44 years. Cancer. 103:1843–1849. 2005.
View Article : Google Scholar : PubMed/NCBI
|
|
5
|
Tota JE, Anderson WF, Coffey C, Califano
J, Cozen W, Ferris RL, St John M, Cohen EE and Chaturvedi AK:
Rising incidence of oral tongue cancer among white men and women in
the United States, 1973–2012. Oral Oncol. 67:146–152. 2017.
View Article : Google Scholar : PubMed/NCBI
|
|
6
|
Patel SC, Carpenter WR, Tyree S, Couch ME,
Weissler M, Hackman T, Hayes DN, Shores C and Chera BS: Increasing
incidence of oral tongue squamous cell carcinoma in young white
women, age 18 to 44 years. J Clin Oncol. 29:1488–1494. 2011.
View Article : Google Scholar : PubMed/NCBI
|
|
7
|
Li R, Koch WM, Fakhry C and Gourin CG:
Distinct epidemiologic characteristics of oral tongue cancer
patients. Otolaryngol Head Neck Surg. 148:792–796. 2013. View Article : Google Scholar : PubMed/NCBI
|
|
8
|
Bello IO, Soini Y and Salo T: Prognostic
evaluation of oral tongue cancer: Means, markers and perspectives
(I). Oral Oncol. 46:630–635. 2010. View Article : Google Scholar : PubMed/NCBI
|
|
9
|
Sano D and Myers JN: Metastasis of
squamous cell carcinoma of the oral tongue. Cancer Metastasis Rev.
26:645–662. 2007. View Article : Google Scholar : PubMed/NCBI
|
|
10
|
Jansen L, Buttmann-Schweiger N, Listl S,
Ressing M, Holleczek B, Katalinic A, Luttmann S, Kraywinkel K and
Brenner H: GEKID Cancer Survival Working Group: Differences in
incidence and survival of oral cavity and pharyngeal cancers
between Germany and the United States depend on the HPV-association
of the cancer site. Oral Oncol. 76:8–15. 2018. View Article : Google Scholar : PubMed/NCBI
|
|
11
|
Vogelstein B, Papadopoulos N, Velculescu
VE, Zhou S, Diaz LA Jr and Kinzler KW: Cancer genome landscapes.
Science. 339:1546–1558. 2013. View Article : Google Scholar : PubMed/NCBI
|
|
12
|
Mikhail S, Faltas B, Salem ME and
Bekaii-Saab T: Application of next-generation sequencing in
gastrointestinal and liver tumors. Cancer Lett. 374:187–191. 2016.
View Article : Google Scholar : PubMed/NCBI
|
|
13
|
Ou J, Wu T, Sijmons R, Ni D, Xu W and Upur
H: Prevalence of BRCA1 and BRCA2 germline mutations in breast
cancer women of multiple ethnic region in northwest China. J Breast
Cancer. 16:50–54. 2013. View Article : Google Scholar : PubMed/NCBI
|
|
14
|
Liu F, Zhang Z, Zhang Y, Chen Y, Yang X,
Li J and Zhao J: Genetic polymorphisms in the telomere
length-related gene ACYP2 are associated with the risk of
colorectal cancer in a Chinese Han population. Oncotarget.
8:9849–9857. 2017.PubMed/NCBI
|
|
15
|
Guo Y, Bao Y, Ma M and Yang W:
Identification of key candidate genes and pathways in colorectal
cancer by integrated bioinformatical analysis. Int J Mol Sci.
18:7222017. View Article : Google Scholar
|
|
16
|
Zhao P, Hu W, Wang H, Yu S, Li C, Bai J,
Gui S and Zhang Y: Identification of differentially expressed genes
in pituitary adenomas by integrating analysis of microarray data.
Int J Endocrinol. 2015:1640872015. View Article : Google Scholar : PubMed/NCBI
|
|
17
|
Li WX, He K, Tang L, Dai SX, Li GH, Lv WW,
Guo YC, An SQ, Wu GY, Liu D and Huang JF: Comprehensive
tissue-specific gene set enrichment analysis and transcription
factor analysis of breast cancer by integrating 14 gene expression
datasets. Oncotarget. 8:6775–6786. 2017.PubMed/NCBI
|
|
18
|
Estilo CL, O-charoenrat P, Talbot S, Socci
ND, Carlson DL, Ghossein R, Williams T, Yonekawa Y, Ramanathan Y,
Boyle JO, et al: Oral tongue cancer gene expression profiling:
Identification of novel potential prognosticators by
oligonucleotide microarray analysis. BMC Cancer. 9:112009.
View Article : Google Scholar : PubMed/NCBI
|
|
19
|
Reis PP, Waldron L, Perez-Ordonez B,
Pintilie M, Galloni NN, Xuan Y, Cervigne NK, Warner GC, Makitie AA,
Simpson C, et al: A gene signature in histologically normal
surgical margins is predictive of oral carcinoma recurrence. BMC
Cancer. 11:4372011. View Article : Google Scholar : PubMed/NCBI
|
|
20
|
Enokida T, Fujii S, Takahashi M, Higuchi
Y, Nomura S, Wakasugi T, Yamazaki T, Hayashi R, Ohtsu A and Tahara
M: Gene expression profiling to predict recurrence of advanced
squamous cell carcinoma of the tongue: Discovery and external
validation. Oncotarget. 8:61786–61799. 2017. View Article : Google Scholar : PubMed/NCBI
|
|
21
|
Gautier L, Cope L, Bolstad BM and Irizarry
RA: affy-analysis of Affymetrix GeneChip data at the probe level.
Bioinformatics. 20:307–315. 2004. View Article : Google Scholar : PubMed/NCBI
|
|
22
|
Diboun I, Wernisch L, Orengo CA and
Koltzenburg M: Microarray analysis after RNA amplification can
detect pronounced differences in gene expression using limma. BMC
Genomics. 7:2522006. View Article : Google Scholar : PubMed/NCBI
|
|
23
|
Ritchie ME, Phipson B, Wu D, Hu Y, Law CW,
Shi W and Smyth GK: Limma powers differential expression analyses
for RNA-sequencing and microarray studies. Nucleic Acids Res.
43:e472015. View Article : Google Scholar : PubMed/NCBI
|
|
24
|
Robinson MD, McCarthy DJ and Smyth GK:
edgeR: A bioconductor package for differential expression analysis
of digital gene expression data. Bioinformatics. 26:139–140. 2010.
View Article : Google Scholar : PubMed/NCBI
|
|
25
|
Huang da W, Sherman BT and Lempicki RA:
Systematic and integrative analysis of large gene lists using DAVID
bioinformatics resources. Nat Protoc. 4:44–57. 2009. View Article : Google Scholar : PubMed/NCBI
|
|
26
|
Huang da W, Sherman BT and Lempicki RA:
Bioinformatics enrichment tools: Paths toward the comprehensive
functional analysis of large gene lists. Nucleic Acids Res.
37:1–13. 2009. View Article : Google Scholar : PubMed/NCBI
|
|
27
|
The Gene Ontology Consortium: Expansion of
the gene ontology knowledgebase and resources. Nucleic Acids Res.
45:(D1). D331–D338. 2017. View Article : Google Scholar : PubMed/NCBI
|
|
28
|
Ashburner M, Ball CA, Blake JA, Botstein
D, Butler H, Cherry JM, Davis AP, Dolinski K, Dwight SS, Eppig JT,
et al: Gene ontology: Tool for the unification of biology. The Gene
Ontology Consortium. Nat Genet. 25:25–29. 2000. View Article : Google Scholar : PubMed/NCBI
|
|
29
|
Kanehisa M and Goto S: KEGG: Kyoto
encyclopedia of genes and genomes. Nucleic Acids Res. 28:27–30.
2000. View Article : Google Scholar : PubMed/NCBI
|
|
30
|
Ogata H, Goto S, Sato K, Fujibuchi W, Bono
H and Kanehisa M: KEGG: Kyoto encyclopedia of genes and genomes.
Nucleic Acids Res. 27:29–34. 1999. View Article : Google Scholar : PubMed/NCBI
|
|
31
|
Croft D, Mundo AF, Haw R, Milacic M,
Weiser J, Wu G, Caudy M, Garapati P, Gillespie M, Kamdar MR, et al:
The reactome pathway knowledgebase. Nucleic Acids Res. 42:(Database
Issue). D472–D477. 2014. View Article : Google Scholar : PubMed/NCBI
|
|
32
|
Fabregat A, Jupe S, Matthews L,
Sidiropoulos K, Gillespie M, Garapati P, Haw R, Jassal B, Korninger
F, May B, et al: The reactome pathway knowledgebase. Nucleic Acids
Res. 46:(D1). D649–D655. 2018. View Article : Google Scholar : PubMed/NCBI
|
|
33
|
Szklarczyk D, Franceschini A, Wyder S,
Forslund K, Heller D, Huerta-Cepas J, Simonovic M, Roth A, Santos
A, Tsafou KP, et al: STRING v10: Protein-protein interaction
networks, integrated over the tree of life. Nucleic Acids Res.
43:(Database Issue). D447–D452. 2015. View Article : Google Scholar : PubMed/NCBI
|
|
34
|
Shannon P, Markiel A, Ozier O, Baliga NS,
Wang JT, Ramage D, Amin N, Schwikowski B and Ideker T: Cytoscape: A
software environment for integrated models of biomolecular
interaction networks. Genome Res. 13:2498–2504. 2003. View Article : Google Scholar : PubMed/NCBI
|
|
35
|
Scardoni G, Petterlini M and Laudanna C:
Analyzing biological network parameters with CentiScaPe.
Bioinformatics. 25:2857–2859. 2009. View Article : Google Scholar : PubMed/NCBI
|
|
36
|
Scardoni G, Tosadori G, Faizan M, Spoto F,
Fabbri F and Laudanna C: Biological network analysis with
CentiScaPe: Centralities and experimental dataset integration.
Version 2. F1000Res. 3:1392014. View Article : Google Scholar : PubMed/NCBI
|
|
37
|
Bader GD and Hogue CW: An automated method
for finding molecular complexes in large protein interaction
networks. BMC Bioinformatics. 4:22003. View Article : Google Scholar : PubMed/NCBI
|
|
38
|
Bindea G, Galon J and Mlecnik B: CluePedia
cytoscape plugin: Pathway insights using integrated experimental
and in silico data. Bioinformatics. 29:661–663. 2013. View Article : Google Scholar : PubMed/NCBI
|
|
39
|
Bindea G, Mlecnik B, Hackl H, Charoentong
P, Tosolini M, Kirilovsky A, Fridman WH, Pagès F, Trajanoski Z and
Galon J: ClueGO: A cytoscape plug-in to decipher functionally
grouped gene ontology and pathway annotation networks.
Bioinformatics. 25:1091–1093. 2009. View Article : Google Scholar : PubMed/NCBI
|
|
40
|
Sun W, Qiu Z, Huang W and Cao M: Gene
expression profiles and protein-protein interaction networks during
tongue carcinogenesis in the tumor microenvironment. Mol Med Rep.
17:165–171. 2018.PubMed/NCBI
|
|
41
|
Zhang H, Liu J, Fu X and Yang A:
Identification of key genes and pathways in tongue squamous cell
carcinoma using bioinformatics analysis. Med Sci Monit.
23:5924–5932. 2017. View Article : Google Scholar : PubMed/NCBI
|
|
42
|
Carinci F, Lo Muzio L, Piattelli A, Rubini
C, Chiesa F, Ionna F, Palmieri A, Maiorano E, Pastore A, Laino G,
et al: Potential markers of tongue tumor progression selected by
cDNA microarray. Int J Immunopathol Pharmacol. 18:513–524. 2005.
View Article : Google Scholar : PubMed/NCBI
|
|
43
|
Yin F, Shu L, Liu X, Li T, Peng T, Nan Y,
Li S, Zeng X and Qiu X: Microarray-based identification of genes
associated with cancer progression and prognosis in hepatocellular
carcinoma. J Exp Clin Cancer Res. 35:1272016. View Article : Google Scholar : PubMed/NCBI
|
|
44
|
Li S, Li H, Xu Y and Lv X: Identification
of candidate biomarkers for epithelial ovarian cancer metastasis
using microarray data. Oncol Lett. 14:3967–3974. 2017. View Article : Google Scholar : PubMed/NCBI
|
|
45
|
Duffy MJ: Use of biomarkers in screening
for cancer. Adv Exp Med Biol. 867:27–39. 2015. View Article : Google Scholar : PubMed/NCBI
|
|
46
|
Wen X, Tang X, Li Y, Ren X, He Q, Yang X,
Zhang J, Wang Y, Ma J and Liu N: Microarray expression profiling of
long non-coding RNAs involved in nasopharyngeal carcinoma
metastasis. Int J Mol Sci. 17(pii): E19562016. View Article : Google Scholar : PubMed/NCBI
|
|
47
|
Chi AC, Day TA and Neville BW: Oral cavity
and oropharyngeal squamous cell carcinoma-an update. CA Cancer J
Clin. 65:401–421. 2015. View Article : Google Scholar : PubMed/NCBI
|
|
48
|
Ho CM, Lam KH, Wei WI, Lau SK and Lam LK:
Occult lymph node metastasis in small oral tongue cancers. Head
Neck. 14:359–363. 1992. View Article : Google Scholar : PubMed/NCBI
|
|
49
|
Misra S, Hascall VC, Markwald RR and
Ghatak S: Interactions between hyaluronan and its receptors (CD44,
RHAMM) regulate the activities of inflammation and cancer. Front
Immunol. 6:2012015. View Article : Google Scholar : PubMed/NCBI
|
|
50
|
Carnero A, Blanco-Aparicio C, Renner O,
Link W and Leal JF: The PTEN/PI3K/AKT signalling pathway in cancer,
therapeutic implications. Curr Cancer Drug Targets. 8:187–198.
2008. View Article : Google Scholar : PubMed/NCBI
|
|
51
|
Tran NT, Su H, Khodadadi-Jamayran A, Lin
S, Zhang L, Zhou D, Pawlik KM, Townes TM, Chen Y, Mulloy JC and
Zhao X: The AS-RBM15 lncRNA enhances RBM15 protein translation
during megakaryocyte differentiation. EMBO Rep. 17:887–900. 2016.
View Article : Google Scholar : PubMed/NCBI
|
|
52
|
Massarelli E, Liu DD, Lee JJ, El-Naggar
AK, Lo Muzio L, Staibano S, De Placido S, Myers JN and
Papadimitrakopoulou VA: Akt activation correlates with adverse
outcome in tongue cancer. Cancer. 104:2430–2436. 2005. View Article : Google Scholar : PubMed/NCBI
|
|
53
|
Wang K, Lin C, Wang C, Shao Q, Gao W, Song
B, Wang L, Song X, Qu X and Wei F: Silencing Kif2a induces
apoptosis in squamous cell carcinoma of the oral tongue through
inhibition of the PI3K/Akt signaling pathway. Mol Med Rep.
9:273–278. 2014. View Article : Google Scholar : PubMed/NCBI
|
|
54
|
Yu CC, Hung SK, Lin HY, Chiou WY, Lee MS,
Liao HF, Huang HB, Ho HC and Su YC: Targeting the PI3K/AKT/mTOR
signaling pathway as an effectively radiosensitizing strategy for
treating human oral squamous cell carcinoma in vitro and in vivo.
Oncotarget. 8:68641–68653. 2017.PubMed/NCBI
|
|
55
|
Novak M, Leonard MK, Yang XH, Kowluru A,
Belkin AM and Kaetzel DM: Metastasis suppressor NME1 regulates
melanoma cell morphology, self-adhesion and motility via induction
of fibronectin expression. Exp Dermatol. 24:455–461. 2015.
View Article : Google Scholar : PubMed/NCBI
|
|
56
|
Lu YC, Chang JT, Liao CT, Kang CJ, Huang
SF, Chen IH, Huang CC, Huang YC, Chen WH, Tsai CY, et al:
OncomiR-196 promotes an invasive phenotype in oral cancer through
the NME4-JNK-TIMP1-MMP signaling pathway. Mol Cancer. 13:2182014.
View Article : Google Scholar : PubMed/NCBI
|
|
57
|
Moilanen JM, Löffek S, Kokkonen N, Salo S,
Väyrynen JP, Hurskainen T, Manninen A, Riihilä P, Heljasvaara R,
Franzke CW, et al: Significant role of collagen XVII and integrin
beta4 in migration and invasion of the less aggressive squamous
cell carcinoma cells. Sci Rep. 7:450572017. View Article : Google Scholar : PubMed/NCBI
|
|
58
|
Brooks DL, Schwab LP, Krutilina R, Parke
DN, Sethuraman A, Hoogewijs D, Schörg A, Gotwald L, Fan M, Wenger
RH and Seagroves TN: ITGA6 is directly regulated by
hypoxia-inducible factors and enriches for cancer stem cell
activity and invasion in metastatic breast cancer models. Mol
Cancer. 15:262016. View Article : Google Scholar : PubMed/NCBI
|
|
59
|
Joerger AC and Fersht AR: The p53 pathway:
Origins, inactivation in cancer, and emerging therapeutic
approaches. Annu Rev Biochem. 85:375–404. 2016. View Article : Google Scholar : PubMed/NCBI
|
|
60
|
Yodsurang V, Tanikawa C, Miyamoto T, Lo
PHY, Hirata M and Matsuda K: Identification of a novel p53 target,
COL17A1, that inhibits breast cancer cell migration and invasion.
Oncotarget. 8:55790–55803. 2017. View Article : Google Scholar : PubMed/NCBI
|
|
61
|
Wu TS, Tan CT, Chang CC, Lin BR, Lai WT,
Chen ST, Yen-Ping Kuo M, Rau CL, Jaw FS and Chang HH: B-cell
lymphoma/leukemia 10 promotes oral cancer progression through
STAT1/ATF4/S100P signaling pathway. Oncogene. 36:54402017.
View Article : Google Scholar : PubMed/NCBI
|
|
62
|
Yang H, Wen L, Wen M, Liu T, Zhao L, Wu B,
Yun Y, Liu W, Wang H, Wang Y and Wen N: FoxM1 promotes
epithelial-mesenchymal transition, invasion and migration of tongue
squamous cell carcinoma cells through a c-Met/AKT-dependent
positive feedback loop. Anticancer Drugs. 29:216–226.
2018.PubMed/NCBI
|
|
63
|
Li D, Wei P, Peng Z, Huang C, Tang H, Jia
Z, Cui J, Le X, Huang S and Xie K: The critical role of
dysregulated FOXM1-PLAUR signaling in human colon cancer
progression and metastasis. Clin Cancer Res. 19:62–72. 2013.
View Article : Google Scholar : PubMed/NCBI
|
|
64
|
Zumsteg ZS, Cook-Wiens G, Yoshida E, Shiao
SL, Lee NY, Mita A, Jeon C, Goodman MT and Ho AS: Incidence of
oropharyngeal cancer among elderly patients in the united states.
JAMA Oncol. 2:1617–1623. 2016. View Article : Google Scholar : PubMed/NCBI
|