Introduction
In recent years, polysaccharides from fungi have
attracted increasing attention for the prevention and treatment of
cancer because of their efficiency in tumor inhibition and low
toxicity (1,2). Immunomodulatory and antitumor properties
are usually associated with the ability to activate the immune and
complement systems (3). The function
of immune system is to recognize and eliminate antigenic foreign
bodies, co-ordinating with other systems of the body, and
maintaining the stability of the internal environment and
physiological balance of the body. B lymphocytes, also called B
cells, are a pluripotent stem cell derived from bone marrow
(4,5).
Macrophages participate in non-specific defense (congenital
immunity) and specific defense (cellular immunity) in vertebrates.
Their main function is to phagocytose cell debris and pathogens in
the form of fixed or free cells (i.e., phagocytosis and digestion),
and activate lymphocytes or other immune cells to react to
pathogens (6). B cells and
macrophages can initiate natural immune responses and then act as
effector cells which help to manage the immune responses, such as
fighting an infection, angiogenesis and inflammation (7,8).
Polysaccharides are ubiquitous substances in
organisms. They are natural macromolecule polymers linked by aldose
or ketose through glycosidic bonds. They are important biological
macromolecules in organisms and are basic substances to maintain
normal operation of cellular activities (9). A number of polysaccharides (including
polysaccharides from plants, animals and fungi) regulate or promote
immune function. Their primary functions are to enhance the
activities of the reticuloendothelial system, macrophages, natural
killer cells, killer T cells, lymphokine-activated killer cells and
other cytokines, and to promote antibody, complement production,
protein synthesis, etc. (10). The
biological activity of polysaccharides depends on the process of
recognition and interaction between polysaccharides and their
receptors. When polysaccharides interact with receptors, specific
oligosaccharide fragments often bind to receptors, recognizing the
activation of polysaccharide receptors by ligands to initiate
intracellular signal transduction pathways and thus produce
effectual functions (11–13).
Our group recently isolated a novel polysaccharide
from Lactarius deliciosus (L. ex Fr.) Gray named LDG-A,
which has a backbone of 1,6-disubstituted-α-L-mannopyranose which
is branched at O-2, with branches mainly composed of
α→3-α-D-xylopyranose residues (14).
LDG-A also exhibits significant antitumor activities in
vivo, and activates lymphocytes and macrophages in vitro
(15). However, the molecular
mechanism underlying antitumor and immunomodulatory activity of
LDG-A remain unclear. In the present study, cell cycle analysis of
macrophages and B cells was performed and the transcriptomes of
macrophages of the control group and LDG-A group were sequenced
using Illumina sequencing technology. Protein chip technology was
also used to determine the cytokines secreted by macrophages. The
aim of the present study was to determine the molecular mechanism
underlying the effect of polysaccharide LDG-A in antitumor and
immune regulation.
Materials and methods
Materials
RPMI-1640 medium, D-Hanks solution,
dimethylsulfoxide and fetal bovine serum (FBS) were purchased from
Gibco; Thermo Fisher Scientific, Inc. (Waltham, MA, USA), The Cell
Counting kit-8 (CCK-8) reagent was purchased from Dojindo Molecular
Technologies, Inc. (Tokyo, Japan). Lipopolysaccharide (LPS),
streptomycin and penicillin G were purchased from Sigma; Merck KGaA
(Darmstadt, Germany). The RAW264.7 cell line and B cell line (Raji)
were purchased from the Institute of Biochemistry and Cell Biology
(Shanghai Academy of Life Sciences, Chinese Academy of Sciences).
LDG-A was prepared in our laboratory as described previously
(14). All other chemicals and
solvents used were of analytical grade.
Cell lines and reagents
D-Hanks solution was used for cell digestion and
passage. The dimethylsulfoxide was used for cell cryopreservation.
The CCK-8 reagent was used for cell activity detection. The
RAW264.7 cell line and B cell line (Raji) were cultured at 37°C in
a humidified atmosphere containing 5% CO2 in RPMI-1640
medium containing 1% penicillin G (100 IU/ml), 10% FBS and
streptomycin (100 mg/l).
RAW264.7 cell and B cell cycle
analysis by flow cytometry
Cells were stained using a cell apoptosis detection
kit (cat. no. C1052; Beyotime Institute of Biotechnology, Haimen,
China). Following staining of the cells with propidium iodide (PI),
the effect of LDG-A on the cell cycle distribution was determined
using flow cytometry. RAW264.7 cells and B cells (5×10⁵
cells/well) were cultured and exposed to LDG-A (1, 5 or 10 µg/ml)
for 24 h and then washed with PBS twice and fixed in ice-cold 70%
ethanol for 4 h at 4°C. Following an additional wash in PBS, the
cells were resuspended in staining buffer (0.5 ml) containing 25 µl
PI and 10 µl RNase, then incubated at 37°C in the dark for 30 min.
The DNA content of the cells was determined using a flow cytometer
(BD Accuri C6; San Jose, CA, USA), and the cell population
was calculated in each phase using the ModFit LT program (version
2.0, Verity Software House Inc., Topsham, ME, US). Each experiment
was performed three times.
RNA extraction, library preparation
and high-throughput sequencing
The LDG-A concentration used to analyze the
transcriptome of RAW264.7 cells was 15 µg/ml. Total RNA was
extracted using TRIzol® reagent (Invitrogen; Thermo
Fisher Scientific, Inc.), and the RNA quality and purity were
determined using 1% agarose gels (16). RNA purity was analyzed at a wavelength
of 260 nm using a NanoPhotometer spectrophotometer (Implen, Inc.,
Westlake Village, CA, USA). The transcriptome libraries were
generated using the Illumina TruSeq™ RNA Sample Preparation kit
(Illumina, Inc., San Diego, CA, USA). The libraries were sequenced
on an Illumina HiSeq 2000 platform.
Transcriptome data analysis
The raw data in FASTQ format were processed using
in-house Perl scripts to remove low-quality reads, including poly-N
stretches (partially unsequenced regions) and adapter sequences.
The high-quality clean sequences were used for the downstream
analyses.
Differential expression and
quantification analysis of the transcripts
An edgeR program package of Bioconductor (version
3.8; Affymetrix; Thermo Fisher Scientific, Inc.) was used for each
sequenced library through one scaling normalized factor to adjust
the read counts prior to the differential gene expression analysis
and the DEGSeq R package was used to identify the DEGs between the
two cell groups. Values of |log2 ratio| ≥1 and FDR
≤0.001 were set as the thresholds for significant differential
expression. The transcript level expression was quantified using
the reads per kilobase per million reads (RPKM) method (17) and the number of reads mapped to each
transcript was determined using HTSeq (version 0.5.3, Affymetrix;
Thermo Fisher Scientific, Inc.). The RPKM value was calculated on
the basis of the sequencing depth, mapped transcript fragments and
transcript length. The read counts with one scaling normalized
factor were completed using the edgeR Bioconductor package prior to
the differential gene expression analysis. The threshold of
statistically significant differential expression was a P-value of
0.05 and a log2 fold change of ±1. A |log2
fold change| >5 was used to identify differentially expressed
genes (DEGs).
Protein chip assay
RAW264.7 cells (5×10⁵ cells/well) were
cultured and exposed to LDG-A (15 µg/ml) for 24 h. Cells were
collected and centrifuged at 300 × g at 4°C for 2 min. The
supernatant was used to perform the protein chip assay. The mouse
cytokine array reagent kit (cat. no. QAM-CAA-4000; RayBiotech Life,
Norcross, GA, USA) was used according to the manufacturer's
protocol.
Differential expression and
quantification analysis of the cytokines
The experimental data were extracted following the
protein chip assay using the microarray analysis software
ArrayVision (version 7.0; Affymetrix; Thermo Fisher Scientific
Inc.). The quantitative data were analyzed using Quantibody
Q-Analyzer software (version R; Affymetrix; Thermo Fisher
Scientific Inc.).
Gene Ontology (GO) annotation and
GO/Kyoto Encyclopedia of Genes and Genomes (KEGG) enrichment
analyses
BLASTX and InterProScan against the National Center
for Biotechnology Information database was used to annotate the
protein functions of all genes. The resulting InterPro annotations
and BLASTX results were then converted into GO annotations. All GO
terms were mapped onto the GO Slim categories. The statistical
significance of the functional GO Slim enrichment was determined
using Fisher's exact test within Blast2GO [false discovery rate
(FDR) <0.05]. The significantly enriched KEGG pathways were
identified using the hypergeometric test and the Benjamini-Hochberg
FDR correction with KEGG Orthology-Based Annotation System (KOBAS;
version 2.0; Affymetrix; Thermo Fisher Scientific, Inc.).
Statistical analysis
All results are presented as the mean ± standard
deviation of three replicates. Statistical analyses were performed
using Student's t-test and one-way analysis of variance followed by
Student-Newman-Keuls test with SPSS (version 10.0; SPSS, Inc.,
Chicago, IL, USA). P<0.05 was considered to indicate a
statistically significant difference.
Results
Effect of LDG-A on the cell cycle
distribution of B cells
Cell cycle analysis of B cells was performed using
flow cytometry to investigate the effects of LDG-A on cell cycle
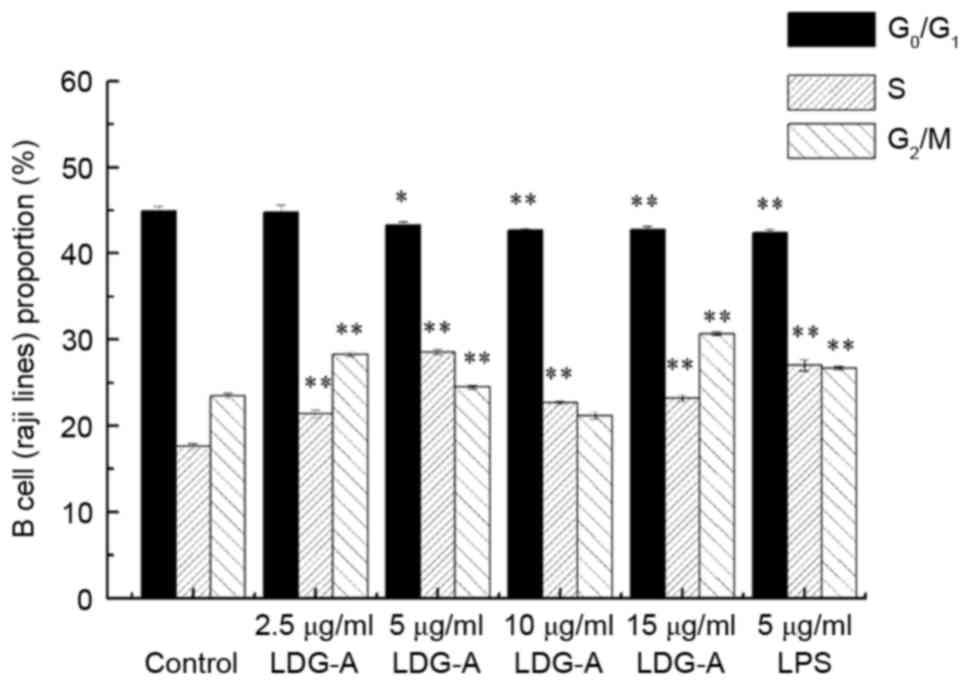
progression. Fig. 1 presents the
results of the effect of LDG-A on the cell cycle phase distribution
(G0/G1, S and G2/M) of B cells
with PI staining using flow cytometry. The treatment of B cells
with LDG-A for 24 h at 2.5, 5, 10 and 15 µg/ml induced a
concomitant decrease in the percentage of cells in
G0/G1 phase from 44.9 (control group) to
45.0, 43.3 (P<0.05), 42.7 (P<0.01) and 42.8% (P<0.01),
respectively, with a concentration-dependent and significant
increase in the G2/M-phase population from 23.5 (control
group) to 30.7% of the LDG-A (15 µg/ml) group (P<0.01). LDG-A,
at concentrations of 2.5, 5, 10 and 15 µg/ml, also induced a
significant increase in the S-phase population, from 17.6 %
(control group) to 21.2% (P<0.01), 28.6% (P<0.01), 22.7%
(P<0.01) and 23.2% (P<0.01), respectively. In the positive
control group, 5 µg/ml LPS could promote B cell proliferation by
inhibiting G0/G1 phase and promoting S phase
and G2/M phases. These results suggested that LDG-A
could promote the proliferation of B cells by promoting cell cycle
progression in S phase and G2/M phases, and eliminating
cell cycle arrest in G0/G1 phase, which may
induce cell division.
Effect of LDG-A on the cell cycle
distribution of RAW264.7 cells
The primary function of macrophages is to
phagocytose cell debris and pathogens in the form of fixed cells or
free cells (phagocytosis and digestion), and activate lymphocytes
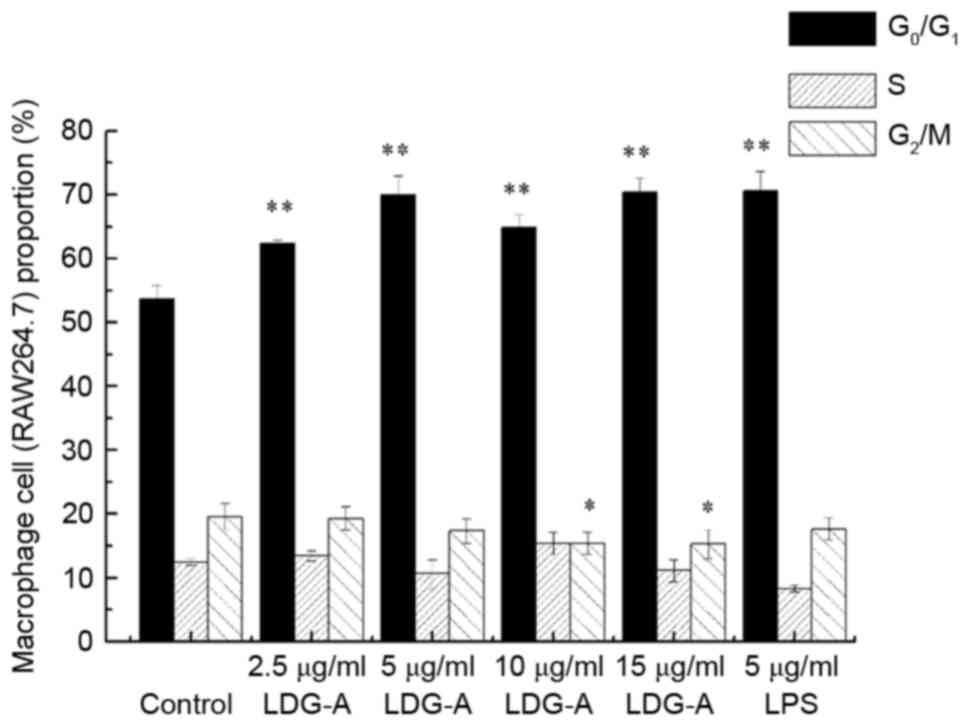
or other immune cells to react to pathogens. Fig. 2 presents the results of the effect of
LDG-A on the cell cycle phase (G0/G1, S and
G2/M) distribution of macrophages RAW264.7 cells with PI
staining using flow cytometry. The treatment of RAW264.7 cells with
LDG-A at 2.5, 5, 10 and 15 µg/ml for 24 h induced a concomitant
increase in the proportion of cells in G0/G1
phase from 53.8 for the control group to 62.4 (P<0.01), 70.0
(P<0.01), 64.8 (P<0.01) and 70.5% (P<0.01), respectively,
with a concentration-dependent decrease in the G2/M
phase population from 19.9 for the control group to 19.2, 17.0,
15.4 (P<0.05) and 15.1% (P<0.05), respectively. In the
positive control group, 5 µg/ml LPS could promote macrophages
RAW264.7 cell proliferation by inhibiting S phase and
G2/M phases and promoting G0/G1
phases. These results suggested that LDG-A could promote the
proliferation of macrophage cells by promoting cell cycle
progression in G0/G1 phase and eliminating
cell cycle arrest in G2/M phases, which may also induce
cell division.
Transcriptome sequencing and de novo
assembly
High-throughput sequencing technology was used to
investigate the differences in the RAW264.7 cell transcriptomes
between the control and the LDG-A group. The respective total RNA
from the control group and LDG-A group was used to construct the
two cDNA libraries. An Illumina HiSeq 2000 platform was used to
sequence the prepared libraries. Following removal of the
low-quality reads and adapter sequences, a total of 11,620,079 and
12,498,414 bp paired-end reads were obtained for the LDG-A and
control groups, respectively, which corresponded to a total size of
11.6 and 12.5 Gbp, respectively (Table
I). The clean reads were mapped onto the RAW264.7 cell
reference genome. The proportion of total reads that mapped onto
the genome in the two RAW264.7 cell transcriptome libraries ranged
between 41.04 and 43.50%. The sequencing saturation analysis
indicated that the number of genes detected by the library was
saturated. The 5′-3′ sequence preference statistical analysis
indicated that the bias at the two ends was limited and the
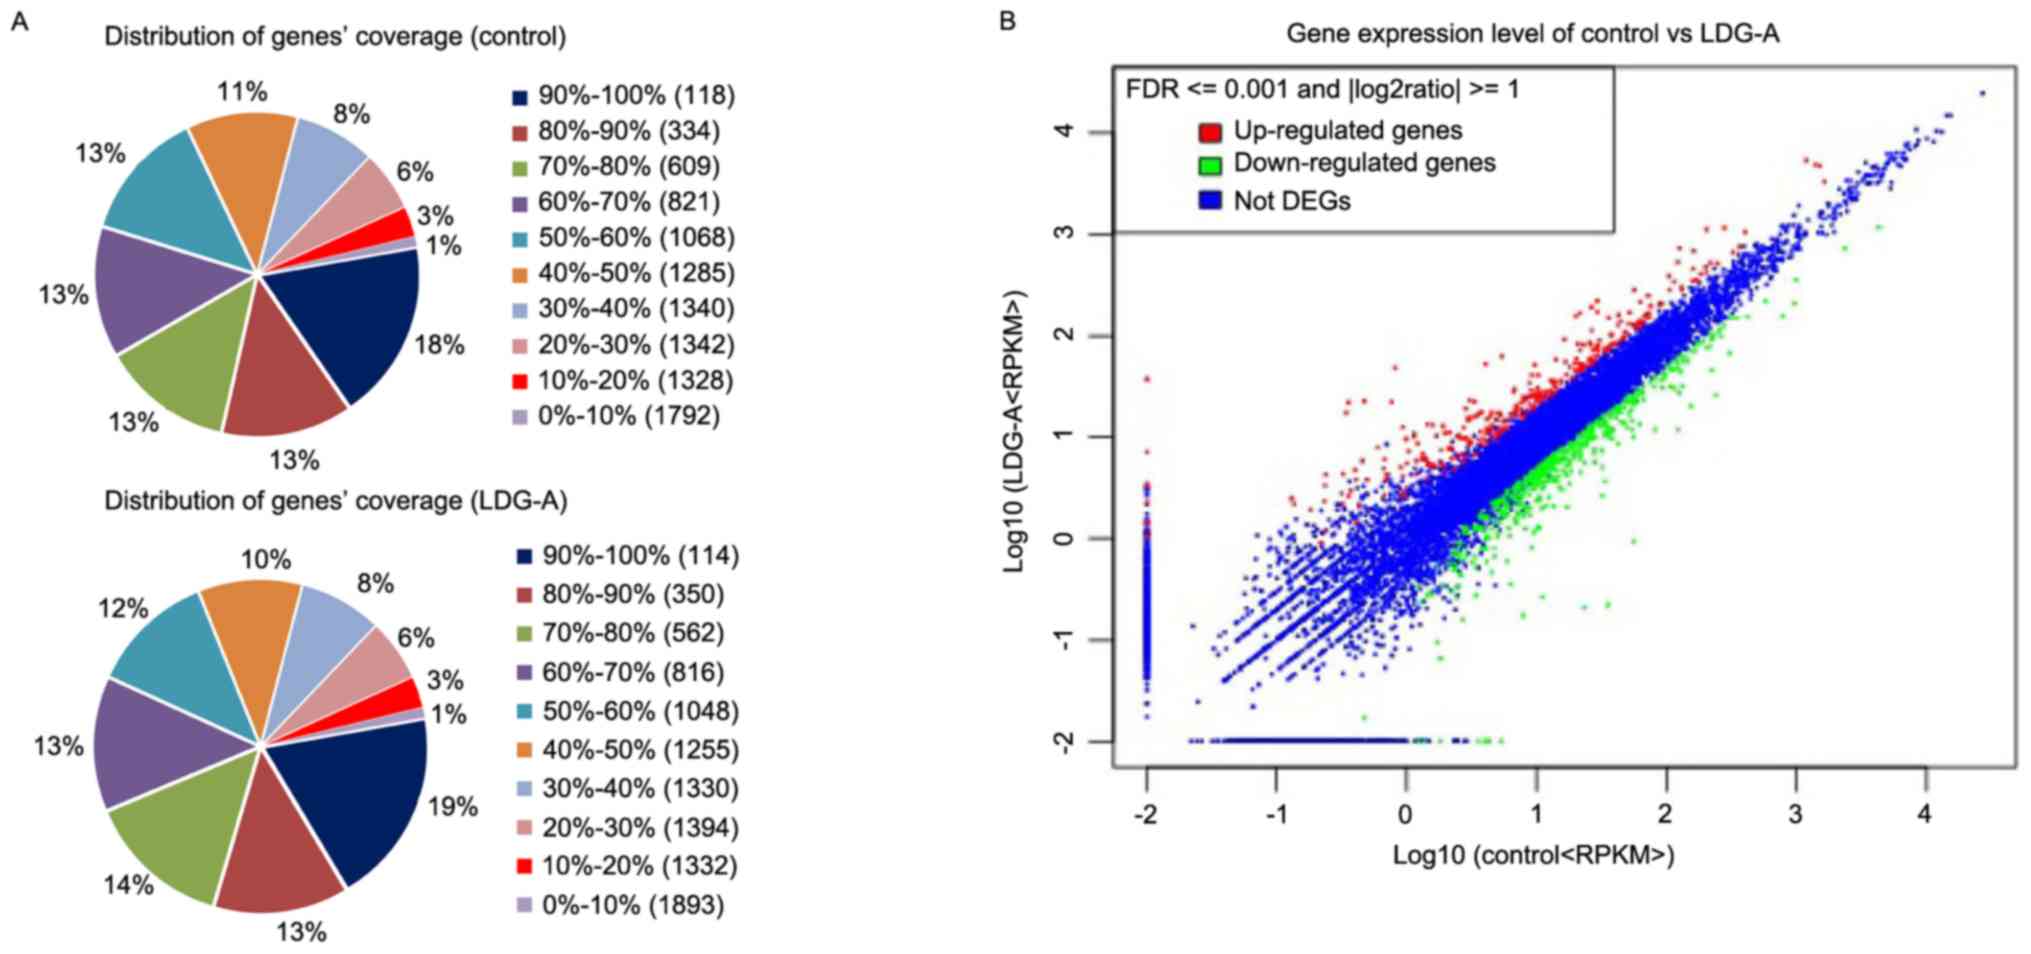
sequencing was primarily focused on the gene body region. The
distribution of gene coverage (presented in Fig. 3A) provides a good basis for the
follow-up analysis.
 | Table I.Summary of the mapping results
(mapping to reference genome). |
Table I.
Summary of the mapping results
(mapping to reference genome).
| Sample | Total reads | Total base pairs | Total mapped
reads | Perfect matches | ≤2 bp mismatches | Unique matches | Multi-position
matches | Total unmapped
reads |
|---|
| Control | 12,498,414 | 612,422,286 | 5,129,004 | 985,094 | 4,143,910 | 3,166,326 | 1,962,678 | 7,369,410 |
|
| (100.00%) | (100.00%) | (41.04%) | (7.88%) | (33.16%) | (25.33%) | (15.70%) | (58.96%) |
| LDG-A | 11,620,079 | 569,383,871 | 5,054,912 | 930,977 | 4,123,935 | 3,032,909 | 2,022,003 | 6,565,167 |
|
| (100.00%) | (100.00%) | (43.50%) | (8.01%) | (35.49%) | (26.10%) | (17.40%) | (56.50%) |
Transcriptome profiles of the two
RAW264.7 cell groups
The abundance of all genes was normalized and
calculated by the RPKM method using uniquely mapped reads. The
distribution of the expression levels for the two groups of all the
genes was similar. Genes with RPKMs in the interval 0–1 were
considered to be expressed at low levels or not expressed at all,
and genes with RPKM >60 were considered to be expressed at a
high level. The results indicated that in the LDG-A group, ~77.00%
of the total number of genes (8,140) were expressed (RPKM ≥1) and
>1,352 genes were highly expressed (RPKM >60), whereas in the
control group, ~81.77% of the total number of genes (8,208) were
expressed (RPKM ≥1) and >1,333 genes were highly expressed (RPKM
>60).
The results also indicated that, in the LDG-A group,
there were seven genes (Fth1, Eef1a1, Rps24, Rpl23, Rps27, Tpt1 and
Rps6) that were highly expressed (RPKM >10,000; Table II). It is worthy of note that the
RPKM of the Fth1 gene was 78,249 in the LDG-A group, but only
16,044 in the control group.
| Table II.Quantification of gene expression in
the LDG-A group (RPKM >10,000). |
Table II.
Quantification of gene expression in
the LDG-A group (RPKM >10,000).
| NCBI gene
identifier | Number of unique
reads | Length, bp | Coverage, % | RPKM | Symbol | Description | KEGG orthology |
|---|
| 25319 | 240,012 | 828 | 99.88 | 78,249.08 | Fth1 | Ferritin, heavy
polypeptide 1 | K00522 |
| 171361 | 160,104 | 1,737 | 98.22 | 24,881.64 | Eef1a1 | Eukaryotic
translation elongation factor 1 α1 | K03231 |
| 81776 | 25,825 | 466 | 93.56 | 14,959.98 | Rps24 | Ribosomal protein
S24 | K02974 |
| 29282 | 28,702 | 518 | 91.89 | 14,957.50 | Rpl23 | Ribosomal protein
L23 | K02894 |
| 94266 | 14,657 | 366 | 95.08 | 10,810.37 | Rps27 | Ribosomal protein
S27 | K02978 |
| 116646 | 30,486 | 794 | 95.47 | 10,364.70 | Tpt1 | Tumor protein,
translationally controlled 1 | K02894 |
| 29304 | 30,550 | 801 | 81.52 | 10,295.69 | Rps6 | Ribosomal protein
S6 | K02991 |
Identification of DEGs between the
control and LDG-A groups
The edgeR program with one scaling normalized factor
was used to adjust the reads. On the basis of the
log10-transformed RPKMs of the two cell groups,
hierarchical clustering for all the DEGs was performed to identify
the gene expression patterns (Fig.
3B). In total, 775 unigenes were identified as the DEGs, and
~469 genes were downregulated, whereas 306 genes were upregulated
(Fig. 3B). The numbers of DEGs in the
control group compared with in the LDG-A group were 27 for
transcripts detected with |log2 fold change| >5 and
201 for transcripts detected with |log2 fold change|
>2. In total, 12 genes were upregulated among the DEGs within
the |log2 fold change| >5 threshold, including Lcn2,
Mir22, Mreg, Nos2 and Ap5s1, whereas 15 genes were downregulated,
including C1qc, Gpr34, RT1-Db2, Sult1a1 and Kmo, which were the top
five upregulated and downregulated genes (Table III).
| Table III.Differentially expressed genes:
Upregulated and downregulated (|log2 fold change|
>8). |
Table III.
Differentially expressed genes:
Upregulated and downregulated (|log2 fold change|
>8).
| NCBI gene
identifier | Gene length,
bp | Log2
ratio (LDG-A/control) | Symbol | Description | KEGG orthology |
|---|
| 170496 | 876 | 11.88811 | Lcn2 | Lipocalin 2 | K01830, K03999 |
| 100314001 | 95 | 11.85097 | Mir22 | MicroRNA 22 | – |
| 501162 | 645 | 9.47469 | Mreg | Melanoregulin | – |
| 24599 | 3,793 | 8.44597 | Nos2 | Nitric oxide
synthase 2 | K13241 |
| 499893 | 1,130 | 8.38563 | Ap5s1 | Adaptor-related
protein complex 5, σ1 subunit | – |
| 362634 | 1,060 | −9.05405 | C1qc | Complement
component 1, q subcomponent, C chain | K03988 |
| 554353 | 1,299 | −8.76072 | Gpr34 | G-protein-coupled
receptor 34 | K08383 |
| 24981 | 1,134 | −8.73430 | RT1-Db2 | RT1 class II, locus
Db2 | K06752 |
| 83783 | 1,227 | −8.62059 | Sult1a1 | Sulfotransferase
family, cytosolic, 1A, phenol-preferring, member 1 | K01014 |
| 59113 | 1,733 | −8.47609 | Kmo | Kynurenine
3-mono-oxygenase (kynurenine 3-hydroxylase) | K00486 |
GO and KEGG enrichment analyses of the
DEGs
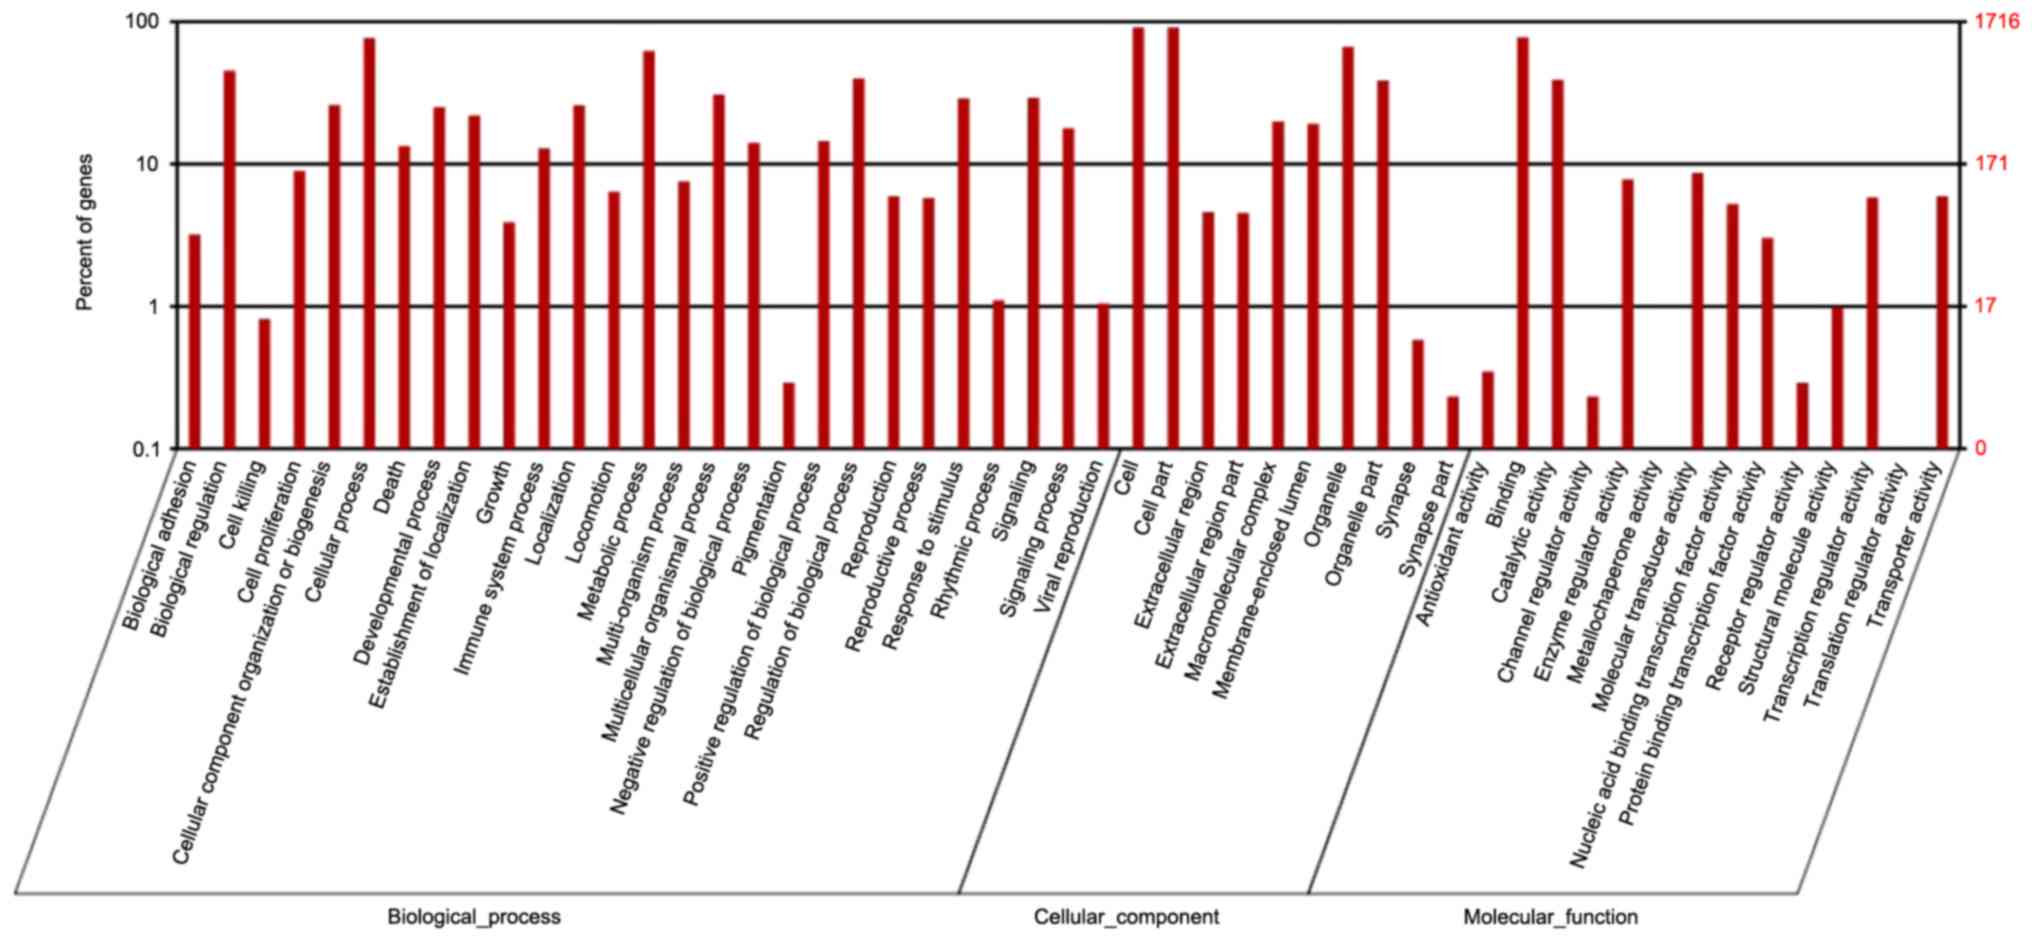
The functional classifications of the annotated
unigenes were confirmed and the transcripts with known proteins
were classified using GO analyses. A total of 39,271 genes were
converted into generic GO Slim terms and annotated using GO terms.
Fisher's exact test in Blast2GO was used to perform the GO
enrichment analysis and to analyze the gene functions of the DEGs.
In the category of cellular components, 71.5 and 71.2% of the
unigenes were classified as intracellular (GO 0005622) and
intracellular part (GO 0044424), respectively. Under the molecular
functions, the majority of the GO terms were classified as binding
(GO 0005488; 75.60%) and catalytic activity (GO 0008152; 36.40%).
The majority of the biological process categories were associated
with metabolic processes (GO 0008152; 49.70%) and cellular
processes (GO 0009987; 67.50%) (Fig.
4).
The KEGG pathway database was used to perform the
pathway analysis to understand further the biological function of
the gene products. KOBAS was used to perform the KEGG pathway
enrichment analysis. A KEGG analysis identifies the molecular
interaction networks that are specific to particular organisms in
cells with variants. It was identified that the mitogen-activated
protein kinase (MAPK) signaling pathway (32 DEGs; 4.87%), the DNA
replication (15 DEGs; 2.28%), the Toll-like receptor signaling
pathway (19 DEGs; 2.89%), the regulation of actin cytoskeleton (38
DEGs; 5.78%), the metabolic pathways (91 DEGs; 13.85%), the
cytokine-cytokine receptor interaction (23 DEGs; 3.5%), the
phagosome (23 DEGs; 3.5%), the focal adhesion (25 DEGs; 3.81%), the
chemokine signaling pathway (17 DEGs; 2.59%), the natural killer
cell-mediated cytotoxicity (10 DEGs; 1.52%), the vascular
endothelial growth factor (VEGF) signaling pathway (10 DEGs; 1.52%)
and the transforming growth factor (TGF)-β signaling pathway (10
DEGs; 1.52%) were significantly enriched in the DEGs between the
two cell groups. It is worth noting that the cell cycle between the
two cell groups (27 DEGs with pathway annotation; 4.11%) is also
significantly enriched for DEGs. These results are consistent with
the hypothesis that LDG-A could promote the proliferation of
macrophages by promoting cell cycle progression in
G0/G1 phase and eliminating cell cycle arrest
in G2/M phase, which may induce cell division.
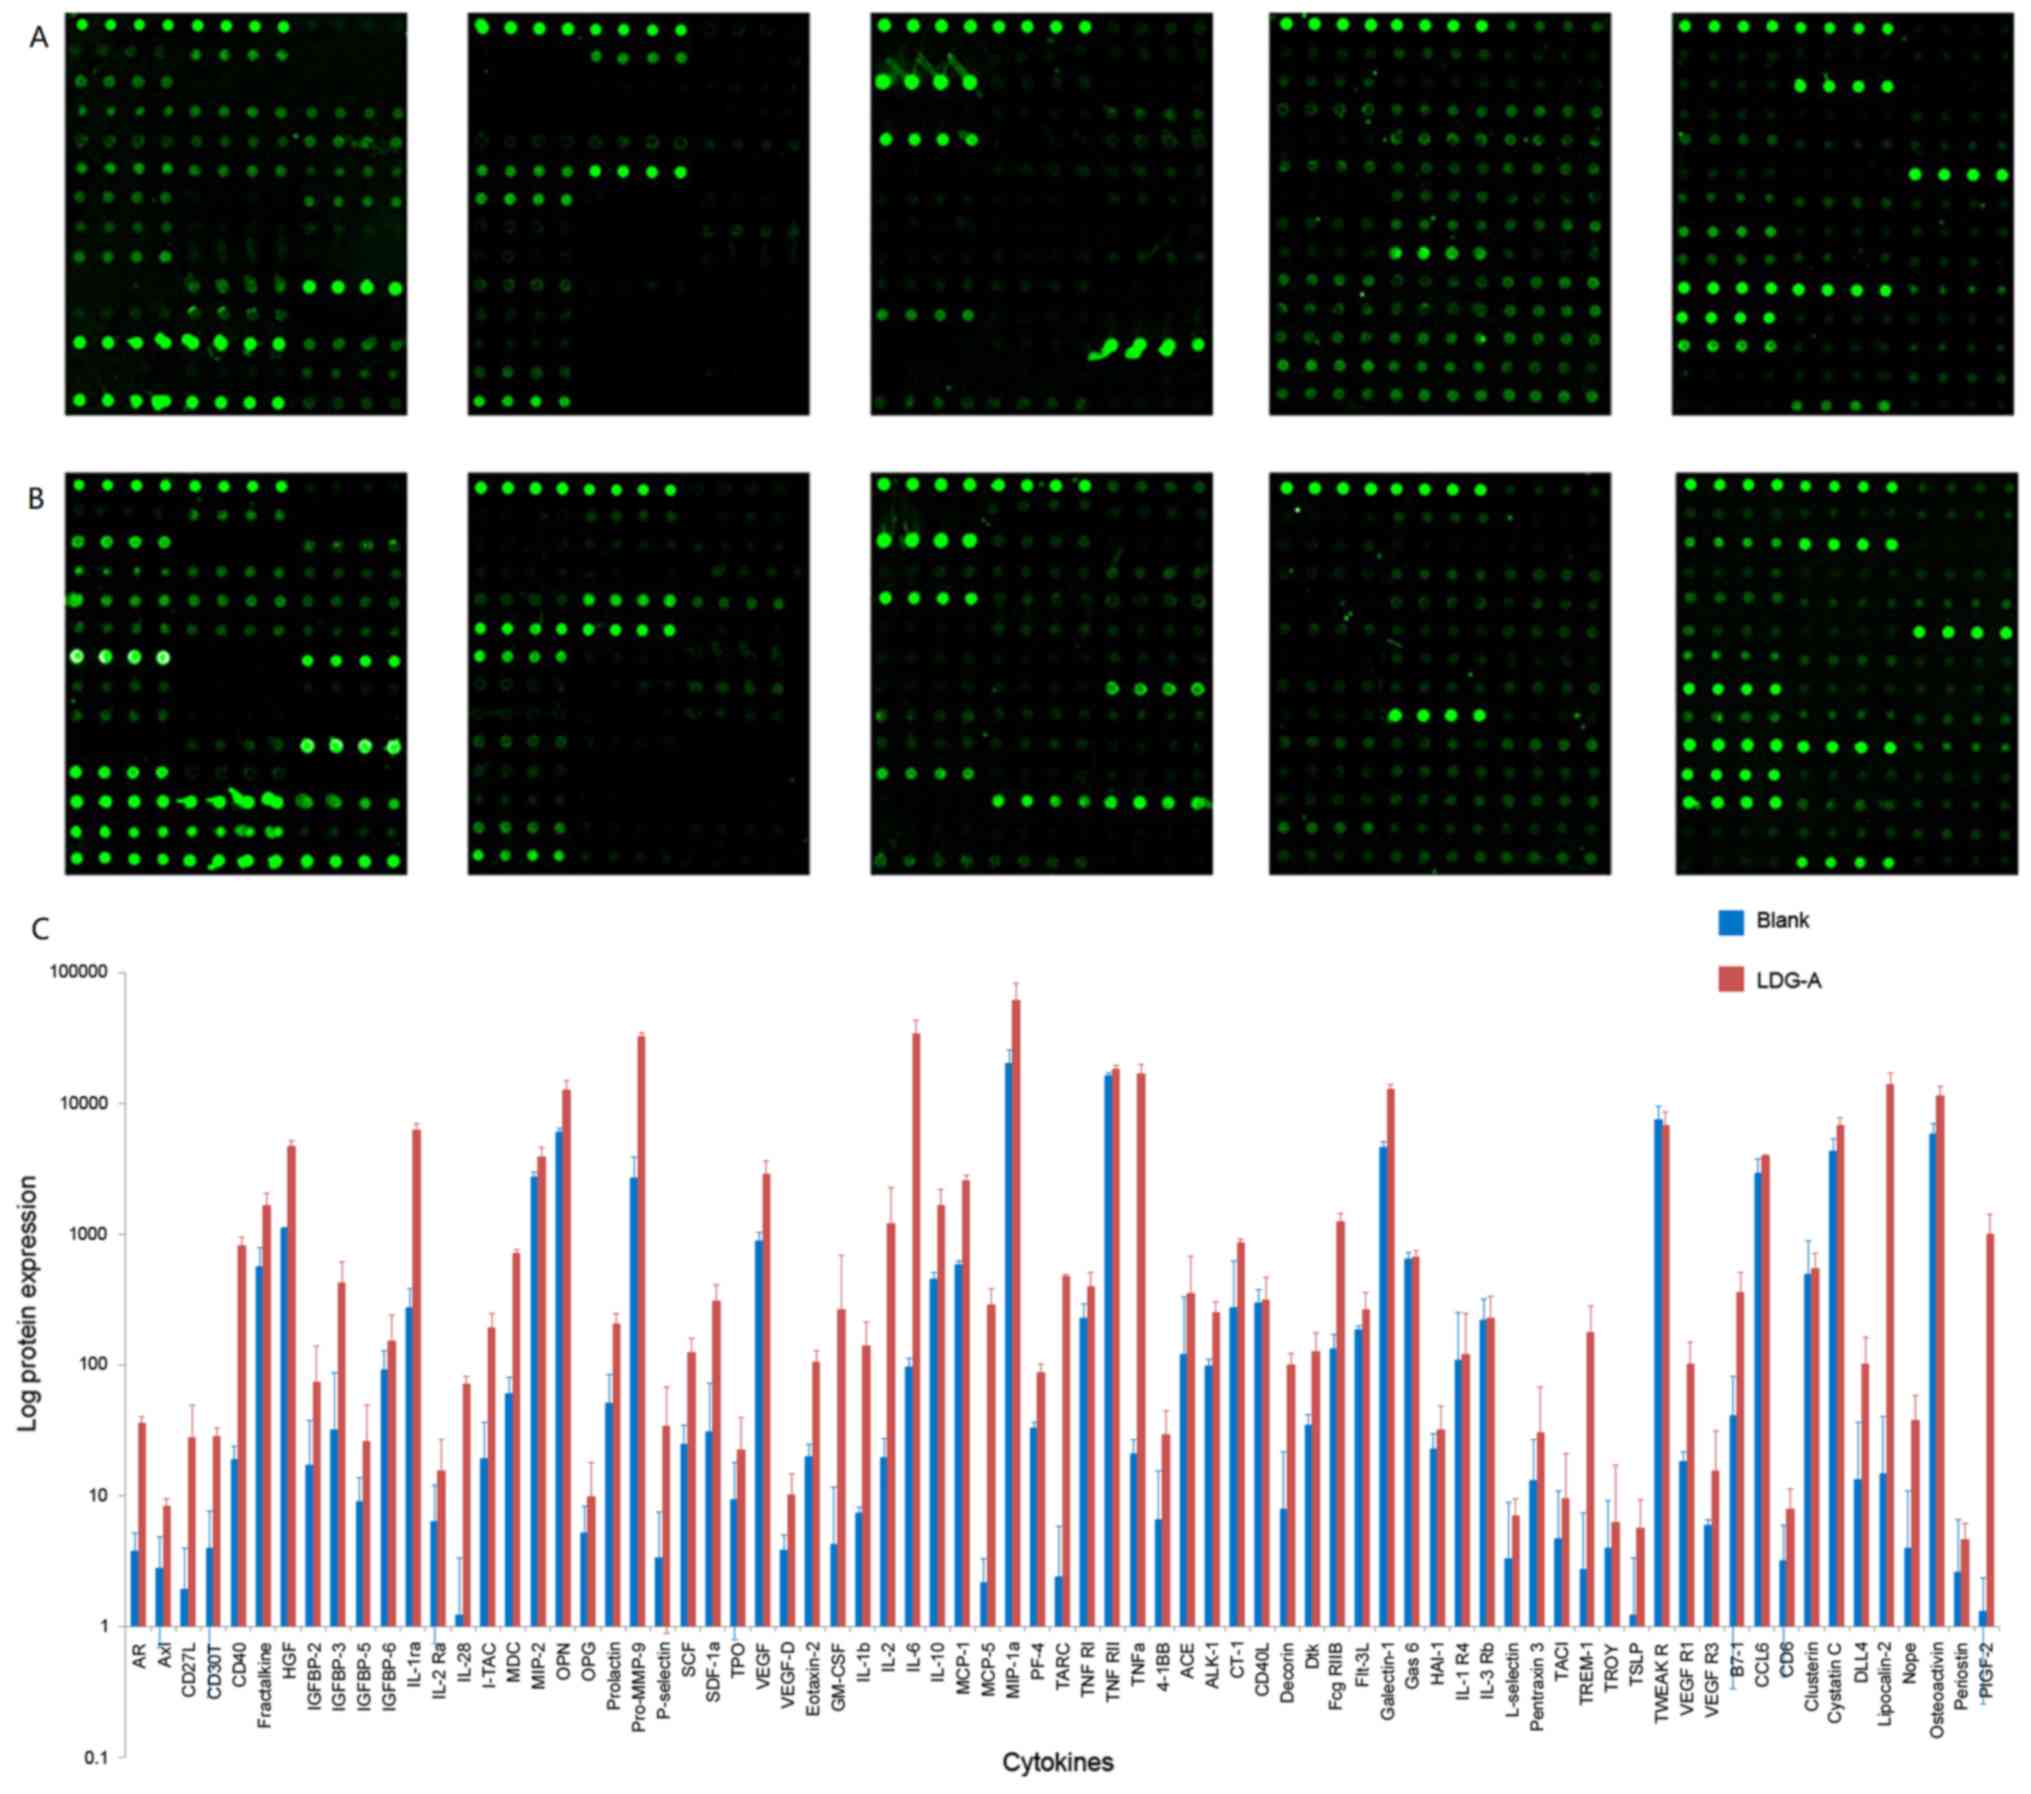
Changes in cytokines secreted by
macrophages
The protein microarray experiments identified 200
cytokines (Fig. 5), which enabled the
identification of 76 upregulated cytokines, including androgen
receptor, cluster of differentiation (CD)27 ligand, CD30T, CD40 and
fractalkine, and 44 downregulated cytokines, including CXC
chemokine ligand 16, epidermal growth factor (EGF), insulin-like
growth factor (IGF)-1, interleukin (IL)-2 and IL-21, and 82
cytokines with no change, including E-selectin, IGF-binding protein
5, T cell activation 3, CD27, cytotoxic T lymphocyte antigen 4,
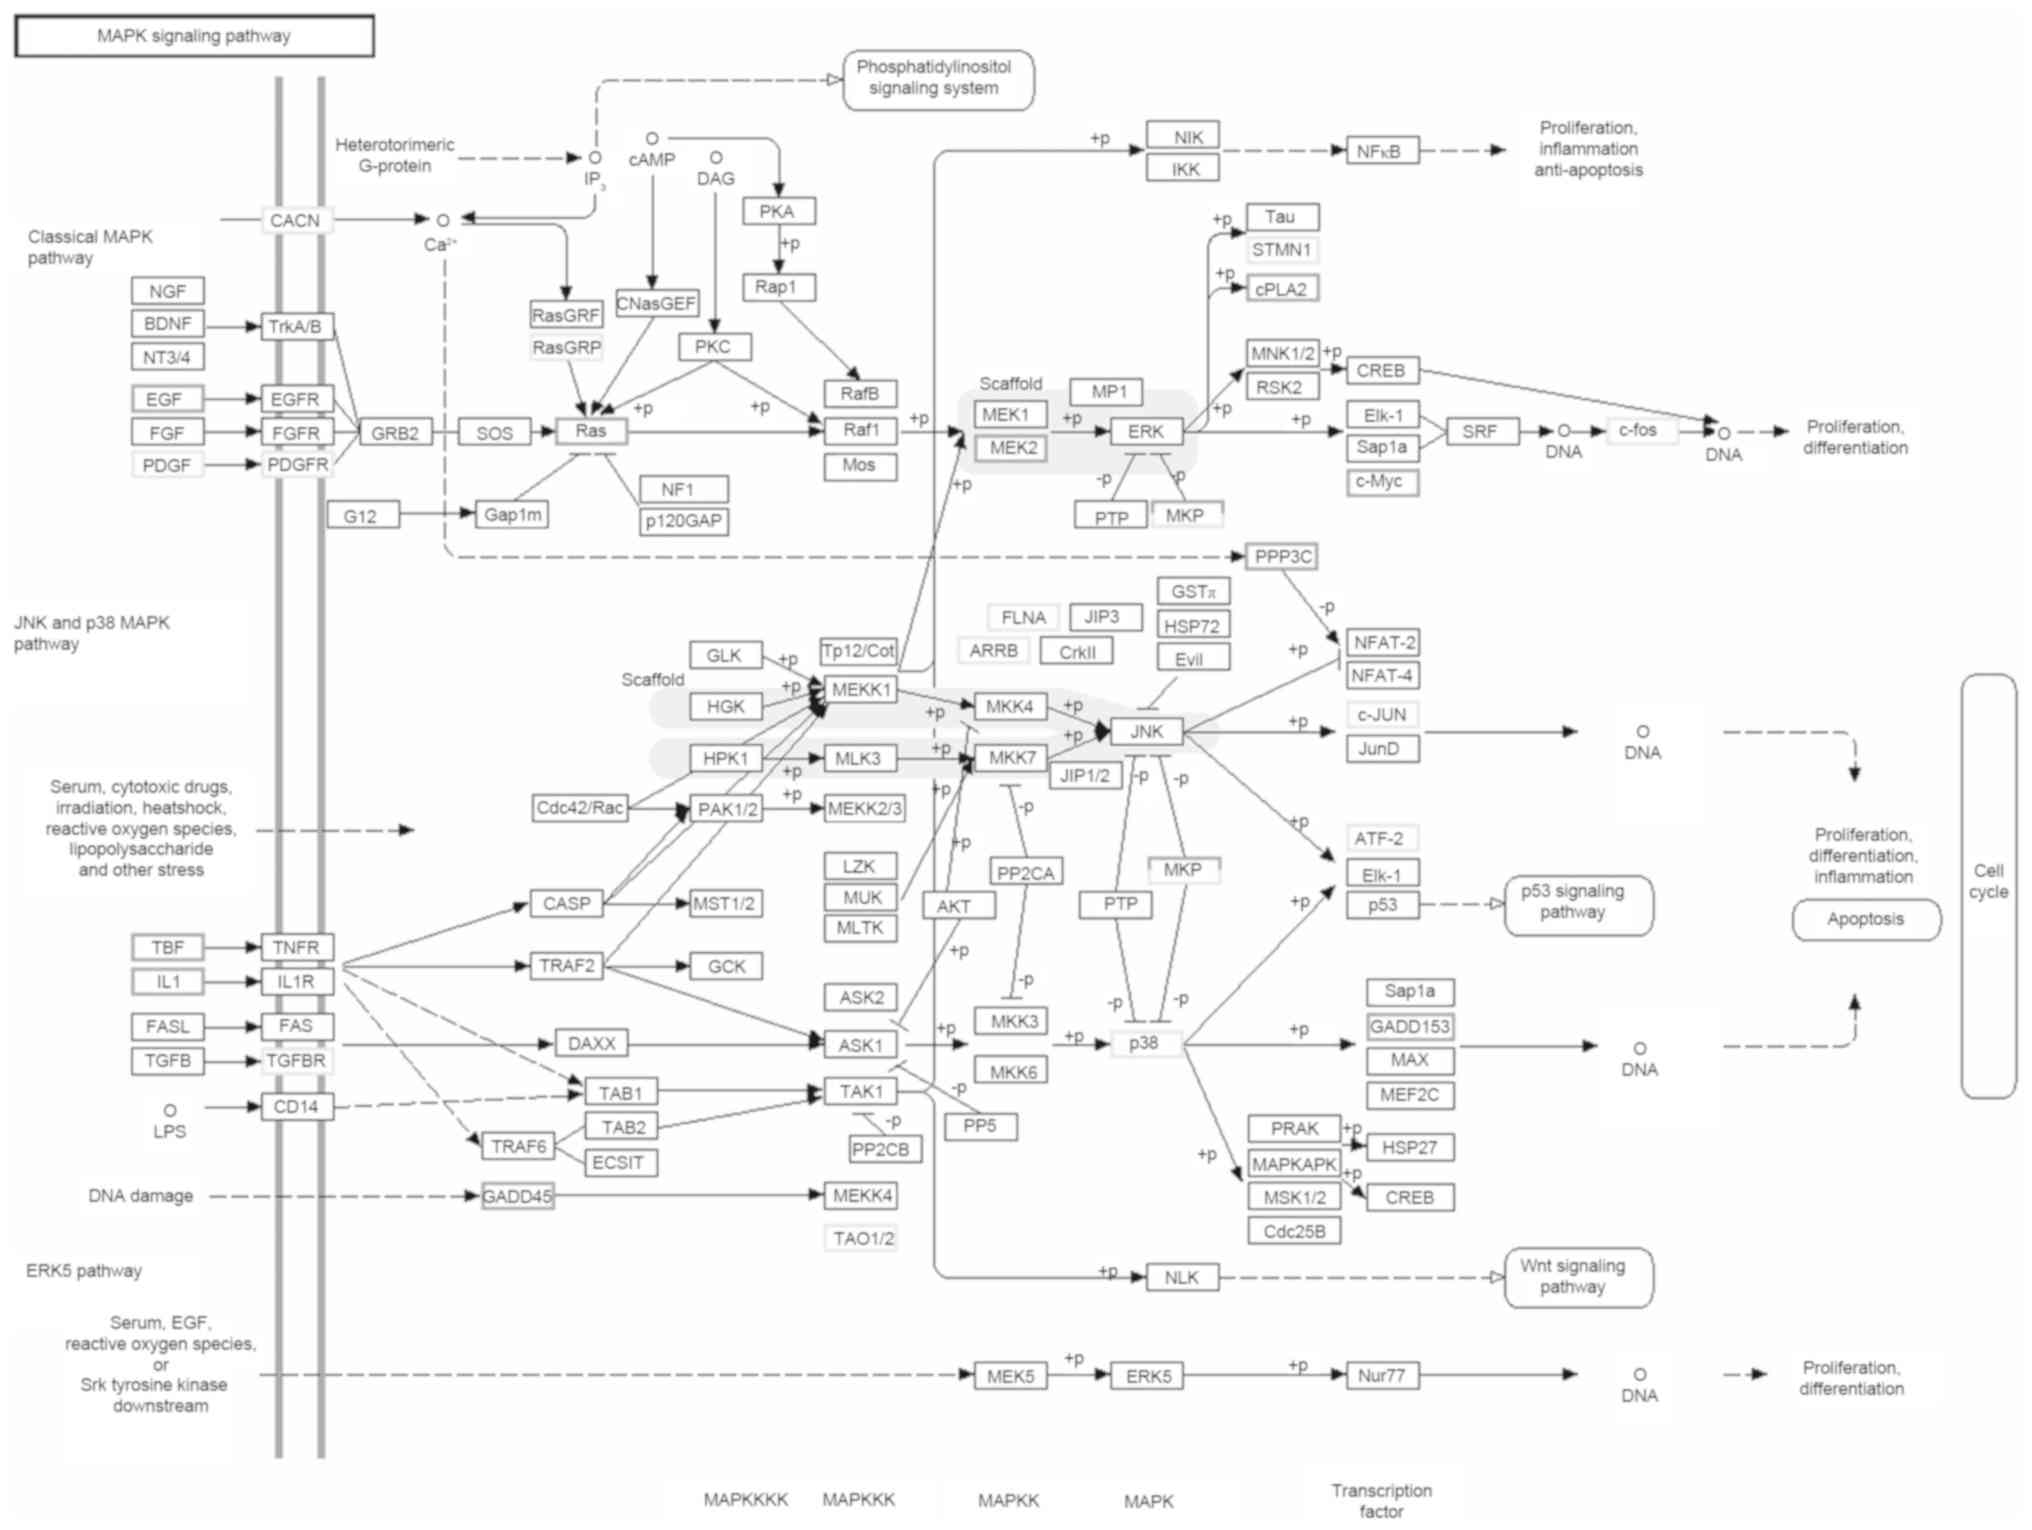
Dickkopf 1 and matrix metalloproteinase-10 (Fig. 5). Using KEGG pathway analysis,
polysaccharide LDG-A was identified to use a range of signaling
pathways to induce the immune response of macrophages, including
the JAK (Janus kinase)/STAT (signal transducer and activator of
transcription) signaling pathway, the TNF (tumor necrosis factor)
signaling pathway, the nuclear factor κB signaling pathway, the
phosphoinositide 3-kinase/protein kinase B signaling pathway, the T
cell receptor signaling pathway, pathways in cancer, the TGF-β
signaling pathway and the MAPK signaling pathway (Fig. 6). These results are also consistent
with the hypothesis that LDG-A could promote the proliferation of
macrophage cells by promoting cell cycle progression in
G0/G1 phase and eliminating cell cycle arrest
in G2/M phases, which may induce cell division.
Discussion
LDG-A exhibits significant antitumor activities
in vivo. However, the antitumor activities and mechanism of
action of LDG-A remain unclear. In the present study, the cell
cycle analysis of macrophages and B cells was performed, and the
transcriptomes of LDG-A group macrophages and control group
macrophages were sequenced to identify DEGs using Illumina
sequencing technology and to determine the molecular mechanisms of
the antitumor and immunomodulatory activities of LDG-A in
macrophages. In addition, a protein chip assay was used to identify
the cytokines secreted by macrophages. In conclusion, LDG-A could
promote the proliferation of B cells by promoting cell cycle
progression in S phase and G2/M phase and eliminating
cell cycle arrest in G0/G1 phase, and could
promote the proliferation of macrophages by promoting cell cycle
progression in G0/G1 phase and eliminating
cell cycle arrest in G2/M phase, which may induce
division of these cells. The effect of LDG-A on cell cycle was
similar to that of LPS, which is a mitogen that promotes cell
division and proliferation. The RPKM analysis indicated that the
RPKM of the Fth1 gene was 78,249 in the LDG-A group, but only
16,044 in the control group.
Ferritin is a major intracellular iron storage
protein in eukaryotes. It is composed of 24 subunits of heavy and
light ferritin chains. The Fth1 gene encodes the heavy subunit of
ferritin. Variation in ferritin subunit composition may affect the
rates of iron uptake and release in different tissues. A major
function of ferritin is the storage of iron in a soluble and
non-toxic state. Defects in ferritin proteins are associated with
several neurodegenerative diseases. This gene has multiple
pseudogenes, and several alternatively spliced transcript variants
have been identified, but their biological validity has not been
determined. Ferritin Heavy Subunit is also associated with
macrophage aggregation and polarization (18,19).
The GO enrichment analysis and the KEGG pathway
enrichment analysis revealed that the JAK/STAT, MAPK, chemokine,
VEGF and TGF-β signaling pathway, among others, are significantly
enriched for DEGs. In total, 32 DEGs were identified in the MAPK
signaling pathway, 15 of which were upregulated in the LDG-A group,
including TNF [K03156; 24835 (1.2)], EGF [K04357; 294559 (2.1)],
IL-1 [K04383; 24493 (3.6) and K04519; 24494 (1.8)], Ras [K07829;
361568 (1.3)], MAPK/extracellular-signal-regulated kinase kinase
(MEK) 2 [K04369; 58960 (1.1)], c-Myc [K04377; 24577 (3.7)], protein
phosphatase 2B catalytic subunit [K04348; 171378 (1.2)], and growth
arrest and DNA damage 153 [K04452; 29467 (2.9)], whereas 17 were
downregulated, including c-fos (K12362; 313874 (−2.3)] and c-Jun
[K03283; 24468 (−1.5)]. The basic component of the MAPK signaling
pathway is a conserved three-stage kinase pattern from yeast to
humans, and is one of the most important pathways in eukaryotic
signaling networks and serves a key function in the regulation of
gene expression and cytoplasmic function, including MAPK, MEK (also
known as MAPK kinase) and MEK kinase (also known as MAPK kinase
kinase). These three kinases may be activated sequentially and
regulate cell proliferation, differentiation, stress adaptation to
the environment, etc. (20). EGF is a
growth factor in the MAPK signaling pathway. Its principal function
is to promote the division of cells. Studies have indicated that a
small amount of EGF can strongly stimulate cell proliferation,
inhibit the expression of aging genes, prevent cell aging and
maintain the best physiological state of cell components (21,22). This
process would adequately explain the mechanism of LDG-A's
proliferative activity on macrophages. The results of the present
study provide a good foundation for further studies.
Acknowledgements
Not applicable.
Funding
This project was supported by the Science and
Technology Support Project of Sichuan Province (grant nos.
2018JY0087 and 2018NZ0055), the Cultivate Major Projects of Sichuan
Province (grant no. 16CZ0018), Nanchong Science and Technology
Bureau of Sichuan Province (grant no. 16YFZJ0043), Talent Program
of China West Normal University (grant nos. 17YC328, 17YC136 and
17YC329), National Training Project of China West Normal University
(grant no. 17c039) and Innovative Team Project of China West Normal
University (grant no. CXTD2017-3).
Availability of data and materials
The datasets used and/or analyzed during the current
study are available from the corresponding author on reasonable
request.
Authors' contributions
YH conceived the presented idea and carried out the
experiment. YH and MW analyzed the data and wrote the manuscript.
DZ, LL, XD and WH interpreted the data, discussed the results and
implications, commented on the manuscript at all stages and revised
the manuscript critically. All authors gave final approval of the
version to be published and agreed to be accountable for all
aspects of the study in ensuring that questions related to the
accuracy or integrity of any part of the study are appropriately
investigated and resolved.
Ethics approval and consent to
participate
Not applicable.
Patient consent for publication
Not applicable.
Competing interests
The authors declare that they have no competing
interests.
References
|
1
|
Song G and Du Q: Structure
characterization and antitumor activity of an α β-glucan
polysaccharide from auricularia polytricha. Food Res Int.
45:381–387. 2012. View Article : Google Scholar
|
|
2
|
Schepetkin I and Quinn M: Botanical
polysaccharides: Macrophage immunomodulation and therapeutic
potential. Int Immunopharmacol. 6:317–333. 2006. View Article : Google Scholar : PubMed/NCBI
|
|
3
|
Zhao Z, Li J, Wu X, Dai H, Gao X and Liu
M: Structures and immunological activities of two pectic
polysaccharides from the fruits of Ziziphus jujuba Mill. cv.
jinsixiaozao Hort. Food Res Int. 39:917–923. 2006. View Article : Google Scholar
|
|
4
|
Lee K and Jeon Y: Macrophage activation by
polysaccharide isolated from astragalus membranaceus. Int
Immunopharmacol. 5:1225–1233. 2005. View Article : Google Scholar : PubMed/NCBI
|
|
5
|
Song JY, Han SK, Son EH, Pyo SN, Yun YS
and Yi SY: Induction of secretory and tumoricidal activities in
peritoneal macrophages by ginsan. Int Immunopharmacol. 2:857–865.
2002. View Article : Google Scholar : PubMed/NCBI
|
|
6
|
Ma H, Liu G, Ding W, Wu Y, Cai L and Zhao
Y: Diabetes-induced alteration of F4/80+ macrophages: A study in
mice with streptozotocin-induced diabetes for a long term. J Mol
Med (Berl). 86:391–400. 2008. View Article : Google Scholar : PubMed/NCBI
|
|
7
|
Di Carlo E, Forni G, Lollini P, Colombo M,
Modesti A and Musiani P: The intriguing role of polymorphonuclear
neutrophils in antitumor reactions. Blood. 97:339–345. 2001.
View Article : Google Scholar : PubMed/NCBI
|
|
8
|
Chen G and Goeddel D: TNF-R1 signaling: A
beautiful pathway. Science. 296:1634–1635. 2002. View Article : Google Scholar : PubMed/NCBI
|
|
9
|
Cheng A, Wan F, Wang J, Jin Z and Xu X:
Macrophage immunomodulatory activity of polysaccharides isolated
from Glycyrrhiza uralensis fish. Int Immunopharmacol. 8:43–50.
2008. View Article : Google Scholar : PubMed/NCBI
|
|
10
|
Chihara G, Maeda Y, Hamuro J, Sasaki T and
Fukuoka F: Inhibition of mouse sarcoma 180 by polysaccharides from
Lentinus edodes (Berk.) sing. Nature. 222:687–688. 1969. View Article : Google Scholar : PubMed/NCBI
|
|
11
|
Kobayashi H, Yoshida R, Kanada Y, Fukuda
Y, Yagyu T, Inagaki K, Kondo T, Kurita N, Suzuki M and Terao T:
Suppressing effects of daily oral supplementation of beta-glucan
extracted from agaricus blazei Murill on spontaneous and peritoneal
disseminated metastasis in mouse model. J Cancer Res Clin Oncol.
131:527–538. 2005. View Article : Google Scholar : PubMed/NCBI
|
|
12
|
Nakazato H, Koike A, Saji S, Ogawa N and
Sakamoto J: Efficacy of immunochemotherapy as adjuvant treatment
after curative resection of gastric cancer. Study Group of
Immunochemotherapy with PSK for gastric cancer. Lancet.
343:1122–1126. 1994. View Article : Google Scholar : PubMed/NCBI
|
|
13
|
Shin JY, Song JY, Yun YS, Yang HO, Rhee DK
and Pyo S: Immunostimulating effects of acidic polysaccharides
extract of panax ginseng on macrophage function. Immunopharmacol
Immunotoxicol. 24:469–482. 2002. View Article : Google Scholar : PubMed/NCBI
|
|
14
|
Ding X, Hou Y and Hou W: Structure feature
and antitumor activity of a novel polysaccharide isolated from
Lactarius deliciosus Gray. Carbohydr Polym. 89:397–402.
2012. View Article : Google Scholar : PubMed/NCBI
|
|
15
|
Hou Y, Ding X, Hou W, Song B, Wang T, Wang
F and Zhong J: Immunostimulant activity of a novel polysaccharide
isolated from Lactarius deliciosus (L. ex Fr.) gray. Indian
J Pharm Sci. 75:393–399. 2013. View Article : Google Scholar : PubMed/NCBI
|
|
16
|
Jianwei G, Jianzhong L, Bin L and
Zhensheng L: Isolation and purification of functional total RNA
from blue-grained wheat endosperm tissues containing high levels of
starches and flavonoids. Plant Mol Biol Rep. 19:185–186. 2001.
View Article : Google Scholar
|
|
17
|
Wagner GP, Kin K and Lynch VJ: Measurement
of mRNA abundance using RNA-seq data: RPKM measure is inconsistent
among samples. Theor Biosc. 131:281–285. 2012. View Article : Google Scholar
|
|
18
|
Zhang Y, Meng Q, Jiang T, Wang H, Xie L
and Zhang R: A novel ferritin subunit involved in shell formation
from the pearl oyster (Pinctada fucata). Comp Biochem Physiol B
Biochem Mol Biol. 135:43–54. 2003. View Article : Google Scholar : PubMed/NCBI
|
|
19
|
Honarmand Ebrahimi K, Bill E, Hagedoorn P
and Hagen W: The catalytic center of ferritin regulates iron
storage via Fe(II)-Fe(III) displacement. Nat Chem Biol. 8:941–948.
2012. View Article : Google Scholar : PubMed/NCBI
|
|
20
|
Orton R, Sturm O, Vyshemirsky V, Calder M,
Gilbert D and Kolch W: Computational modelling of the
receptor-tyrosine-kinase-activated MAPK pathway. Biochem J.
392:249–261. 2005. View Article : Google Scholar : PubMed/NCBI
|
|
21
|
Herbst R: Review of epidermal growth
factor receptor biology. Int J Radiat Oncol Biol Phys. 59 Suppl
2:S21–S26. 2004. View Article : Google Scholar
|
|
22
|
Nagashima T, Suzuki T, Kondo S, Kuroki Y,
Takahashi K, Ide K, Yumoto N, Hasegawa A, Toyoda T, Kojima T, et
al: Integrative genome-wide expression analysis bears evidence of
estrogen receptor-independent transcription in heregulin-stimulated
MCF-7 cells. PLoS One. 3:e18032008. View Article : Google Scholar : PubMed/NCBI
|