Introduction
The incidence of lung cancer has risen in patients
in developed countries, with an estimated 1,800,000 new cases of
lung cancer diagnosed in 2012 (1).
In cases of primary lung cancer (2–4) and in
the lung metastases of patients with other types of cancer
(5,6), tumor cells and clusters may
occasionally be identified in pleural effusion. As a result, the
detection of cancer cells in pleural effusion samples, which are
considered to be liquid biopsy specimens, may assist in the
diagnosis of lung cancer (2,7). Rather than clusters, previous
investigations (8) have focused on
single tumor cells, and as a result there has been a lack of
systematic research on tumor clusters in pleural effusion, and
whether there is any notable association between tumor clusters in
pleural effusion and the diagnosis or metastases of lung cancer.
The current lack of effective separation and detection techniques
for hydrothorax tumor clusters may be one of the factors
contributing to the limited investigation in this area.
Erythrocytes, granulocytes, lymphocytes, alveolar
macrophages, mesothelial cells and tumor cells can be observed in
pleural effusions (9). The
classification of these cells is based on their morphological
features. Clinical cytopathologists identify tumor cells in pleural
effusions by their morphological character, thereby identifying the
difference between tumor and non-tumor cells (9). For situations when cells are under
inflammatory stimulation or metaplasia, the morphology becomes
indecipherable, particularly for mesothelial cells or clusters
(8,10). Therefore, immunolabeling techniques
are able to assist with tumor cell identification (11,12).
Numerous studies have revealed that the biomarkers
of granulocytes, lymphocytes and epithelial cells may improve the
analysis of pleural effusion through the use of flow cytometry,
which can assist with clinical diagnosis and evaluation of the
clinical therapeutic effect (13,14).
However, using this method makes it difficult to evaluate the
biological properties of tumor clusters. In terms of the immune
affinity technique, antibodies may be used for the screening of
tumor cells in the hydrothorax, which can assist in diagnosing lung
cancer (15,16), however, this type of technology is
circumscribed to the analysis of tumor clusters in the
hydrothorax.
Clinically, the quantity of the collected pleural
effusion required is >20 ml (17), however, an increasing number of
reports have identified that a larger volume of specimen may
improve cytological sensitivity in pleural effusions (18,19). At
present, the process of the pathological diagnosis of pleural
effusion cells, whether by a direct smear or through centrifugation
enrichment followed by observation under a microscope, uses only
part of the sample for assessment, leading to the loss of tumor
cells or clusters, which require detection (8).
Numerous studies have reported that image
recognition can be used for cell type classification (20–22).
Additionally, a method based on the cell image feature
classification model has been established, and can successfully
identify tumor and non-tumor cells (23), thereby providing the foundation for
future investigations to discern tumor clusters in pleural
effusion.
In order to avoid abnormally enlarged epithelial
cells and non-tumor cell clusters or fibrous protein aggregations
coiling around parts of the cell constituents, which may influence
test results, a size-based microfluidic chip was designed in the
present study, in order to separate the clusters. By recruiting the
clusters and performing non-specific labeling of the nucleotides
with acridine orange (AO) fluorescence, based on the results of
previous studies (24,25), combined with the propagation of
morphological differences between the tumor and non-tumor cells or
clusters, the present study was able to identify tumor cells or
clusters, and identify hydrothorax tumor cell clusters in one
step.
Materials and methods
Sample preparation
In the present study, two cell lines were recruited.
One of the cell lines used was a lung cancer cell line (A549)
obtained from the Institute of Lung Cancer, General Hospital of
Tianjin Medical University (Tianjin, China). The other cell line
used was an immortalized mesothelial cell line (Met-5A; cat. no.
BNCC341331; BeNa Culture Collection, Jiangsu, China), which had
been transfected with the pRSV-T plasmid (an SV40 ori-construct
containing the SV40 early region and the Rous sarcoma virus long
terminal repeat) and cloned. The cells were cultured under 37°C and
5% CO2 separately in Dulbecco's modified eagle's medium
(DMEM) basic and DMEM-high glucose culture medium (Beijing Solarbio
Science & Technology Co., Ltd., Beijing, China) with 10% fetal
bovine serum (FBS; Biological Industries, Kibbutz Beit Haemek,
Israel) and 1% Penicillin-Streptomycin (Beijing Solarbio Science
& Technology Co., Ltd., Beijing, China) in a 25 cm2
rectangular canted neck cell culture flask with a vent cap. When
cell growth reached ~80% of the area of the culture flask, 600 µl
of 0.25% Trypsin-EDTA solution (Beijing Solarbio Science &
Technology Co., Ltd.) was used to digest the cells, followed by
centrifugation at 1,721 × g for 10 min at 25°C. Subsequently, 3 ml
phosphate buffer solution (PBS; pH 7.4) was added, followed by
careful blowing 3–5 times to resuspend the cells and establish
clusters using a disposable pipette. A total of 10 µl of the sample
was selected to manually count the number of cells on a Neubauer
hemocytometer under a light microscope (×400 magnification),
followed by adjustment of the concentration of the sample to
1×10⁸−1×10¹⁰ cell/ml (with one cluster
treated as one cell) and then the sample was set aside.
The white blood cells (WBCs) were harvested from a
healthy male donor's (age, 25 years) whole blood obtained at the
Affiliated Hospital of Chinese Medicine Research Institute
(Tianjin, China) in January 2017. A total of 500 µl blood was
collected, and 1.5 ml red blood cell lysis buffer (Beijing Solarbio
Science & Technology Co., Ltd.) was added. The sample was then
gently swirled 10 times and then placed on ice (4°C) for 15 min. At
a temperature of 4°C, the sample was centrifuged at 191 × g for 10
min and the supernatant was discarded, followed by the addition of
1 ml red blood cell lysis buffer, which was then placed on ice
(4°C) for 15 min. The sample was then centrifuged at 1,721 × g for
10 min at 4°C, following which the supernatant was discarded, and
500 µl PBS (pH 7.4) was added. A disposable pipette was used to
suspend the cells 3–5 times, and the sample was set aside.
Chip characteristics
Prior to the experiment, the chip was rinsed using
PBS (pH 7.4). Inlet A (samples) and B (buffer) were connected with
syringe pump (cat no. RSP01-BD, Jiashan Ristron, Electronic
Technology Co., Ltd., Jiashan, China) No. 1 and No. 2. Subsequent
to operating at an experimental programmed flow rate (e.g. Va=10
ml/h, Vb=8.5 ml/h where Va represents to velocity of inlet A and Vb
represents the velocity of inlet B), the chip was washed using PBS
buffer from inlet B at a velocity of 100 ml/h for 30 sec to wash
out the residual components within the channels, and the sample in
the five outlets was finally collected.
In the cell velocity-filling experiment, the sample
was loaded with whole blood diluted with PBS (1:10 dilution) at a
final volume of 3 ml. The ratio and speed of the entrance velocity
were then set, the chip was run for 5 min, and the filling rate of
cells in each channel was observed and recorded under a light
microscope (×40 magnification).
In the recovery experiment, the prepared A549 cell
suspension and PBS buffer were assembled into syringe pumps A and
B, respectively. A series of inlet velocities were set and run for
10 min, following which the cells were collected from all outlets.
The different cluster groups (2, 3, 4, 5–6, 7–10, 11–15 and >16
cells/cluster) were counted manually, and the proportion of each
cluster type from each outlet was calculated. The total recovery
rate was determined by adding the number of clusters collected from
all channels, and the distribution rate of each cluster in each
channel group under different velocity pairs was calculated. All
trials were repeated five times.
Trypan blue (Beijing Solarbio Science &
Technology Co., Ltd.) was used for the viability experiment. The
sample was prepared with an A549 cell cluster using the
aforementioned method in PBS (pH 7.4) solution. Prior to the chip
preparation process, a 10 µl sample was selected for trypan blue
staining. By evenly mixing the sample and the 0.4% trypan blue
reagent at a ratio of 9:1, a final concentration of 0.04% was
prepared. Following staining at 25°C for 3 min, at least 200 cells
were counted manually under a light microscope (×100 magnification)
in 3 min, in order to obtain the control group activity. Subsequent
to running the chip sorting process for 10 min, the samples were
recovered from each outlet, the staining process was repeated and
the viability of the experimental group was obtained. For all
groups, the experiment was repeated three times.
Fluid stimulation
Subsequent to the construction of a whole chip model
with a commercial software package (Solid Works, Version 2014,
Dassault Systemes S.A, Vélizy-Villacoublay, France), fluid
stimulation was performed using ANSYS Fluent (version 16.0, ANSYS,
Inc., Canonsburg, PA, USA). The simulating medium used was water.
By simulating a series of velocity conditions, the shear stress
results in each region of the chip were obtained.
Cell staining and parameter
settings
The clusters of each cell line recovered from the
chip were stained with AO. The AO fluorescent dye (60 µmol/l; AAT
Bioquest, Inc., Sunnyvale, CA, USA) was mixed with the sample at a
proportion of 1:5, with a final concentration of 10 µmol/l.
Staining was performed for 10–15 min at 25°C. A total of 10 µl
sample was placed onto a glass slide and images were captured under
×40 magnification with a fluorescence microscope (Eclipse Ni; Nikon
Corporation, Tokyo, Japan) with a charge-coupled device camera
(DS-Ril; Nikon Corporation) and saved using NIS-Elements F (ver
4.30.01, Nikon Corporation) software. The exposure time was 80–100
ms and the optical gain was ×4.0.
Cell modeling
The operating platform used for the cell modeling
was Matlab (ver 2014a, MathWorks, Inc., Natick, MA, USA). The
sample was divided into cluster groups and individual cell groups,
and the background in the images was processed using Microsoft
Paint (ver 1709, Microsoft Corporation, Redmond, WA, USA) to ensure
that each image was analyzed using a single observation objective.
In total, nine types of commonly used imaging features were
selected to analyze the objective component. These were as follows:
i) Mean energy value, ii) energy variance, iii) mean entropy value,
iv) entropy variance, v) mean contrast value, vi) contrast
variance, vii) mean correlation value, viii) correlation variance
and ix) color histogram. For each observation feature, eigenvalues
of the Red and Green channel were analyzed, and the ratio of these
two channels was calculated.
Patient pleural effusion sorting and
identification experiment
Two clinical pleural effusion samples were obtained
from two male patients (mean age: 61.5 years, age range: 54–69
years), who were diagnosed with lung cancer combined with pleural
effusion symptoms, from Tianjin Chest Hospital (Tianjin, China) in
March 2017. From each patient, pleural effusion samples were
collected and extracted into syringe 1, and PBS buffer was added to
syringe 2 as the control. The chip sorting procedure was performed
under the conditions of Va=10 ml/h and Vb=8.5 ml/h. When the cells
were recovered from each outlet of the chip, they were stained and
analyzed using AO as described above.
Hematoxylin and eosin (H&E)
staining
The lung tissues were immersed in 4%
paraformaldehyde for 4 h, and transferred to 70% ethanol.
Individual lobes of the lung tissue biopsy specimens were placed in
processing cassettes, dehydrated through a serial alcohol gradient,
and embedded in paraffin wax blocks. Prior to immunostaining,
4-µm-thick lung tissue sections were dewaxed in xylene, rehydrated
through decreasing concentrations of ethanol and washed in PBS,
followed by staining with H&E. Following staining, the sections
were dehydrated through increasing concentrations of ethanol and
xylene. A fluorescence microscope (Eclipse Ni; Nikon Corporation,
Tokyo, Japan; magnification ×10 and ×40) was used to visualize
staining, a charge-coupled device camera (DS-Ril; Nikon
Corporation) was used to capture images and images were saved using
NIS-Elements F (version 4.30.01, Nikon Corporation) software.
Immunohistochemistry for
carcinoembryonic antigen (CEA), mesothelial cells, P53 and thyroid
transcription factor (TTF-1)
The dewaxed 4-µm-thick lung tissues were fixed in
10% neutral formalin liquid (cat. no G2161, Beijing Solarbio
Science & Technology Co., Ltd.) at 37°C for 30 min and blocked
in 5% BSA (cat. no. SW3015, Beijing Solarbio Science &
Technology Co., Ltd.) at 37°C for 30 min. Primary antibodies (CEA:
cat. no. MAB-0043; Mesothelial cell: cat. no. MAB-0130; P53: cat.
no. MAB-0674; and TTF-1: cat. no. MAB-0677) were obtained from
Fuzhou Maixin Biotechnology Development Co., Ltd. (Fuzhou, China).
Following dilution to 1:100-200, the antibodies were incubated with
tissues at 4°C overnight. The secondary antibodies [horseradish
peroxidase (HRP)-conjugated goat anti-mouse IgG H&L: cat. no.
ab205719; and HRP-conjugated goat anti-rabbit IgG H&L: cat.
nos. ab205718] were from Abcam (Cambridge, UK), Following dilution
to 1:500, they were incubated with tissues for 1.5 h at 37°C.
Subsequently, a DAB kit (cat. no. ab64238, Abcam) was used to stain
the tissue.
Statistical analysis
GraphPad Prism software (version 7.0; GraphPad
Software, Inc., La Jolla, CA, USA) was utilized to analyze the data
in the present study. Data are presented as the mean ± standard
error of the mean. Statistical differences in the feature analysis
between each group in patients were detected using an unpaired
t-test, and all other analyses were performed using one-way
analysis of variance. P<0.05 was considered to indicate a
statistically significant difference.
Results
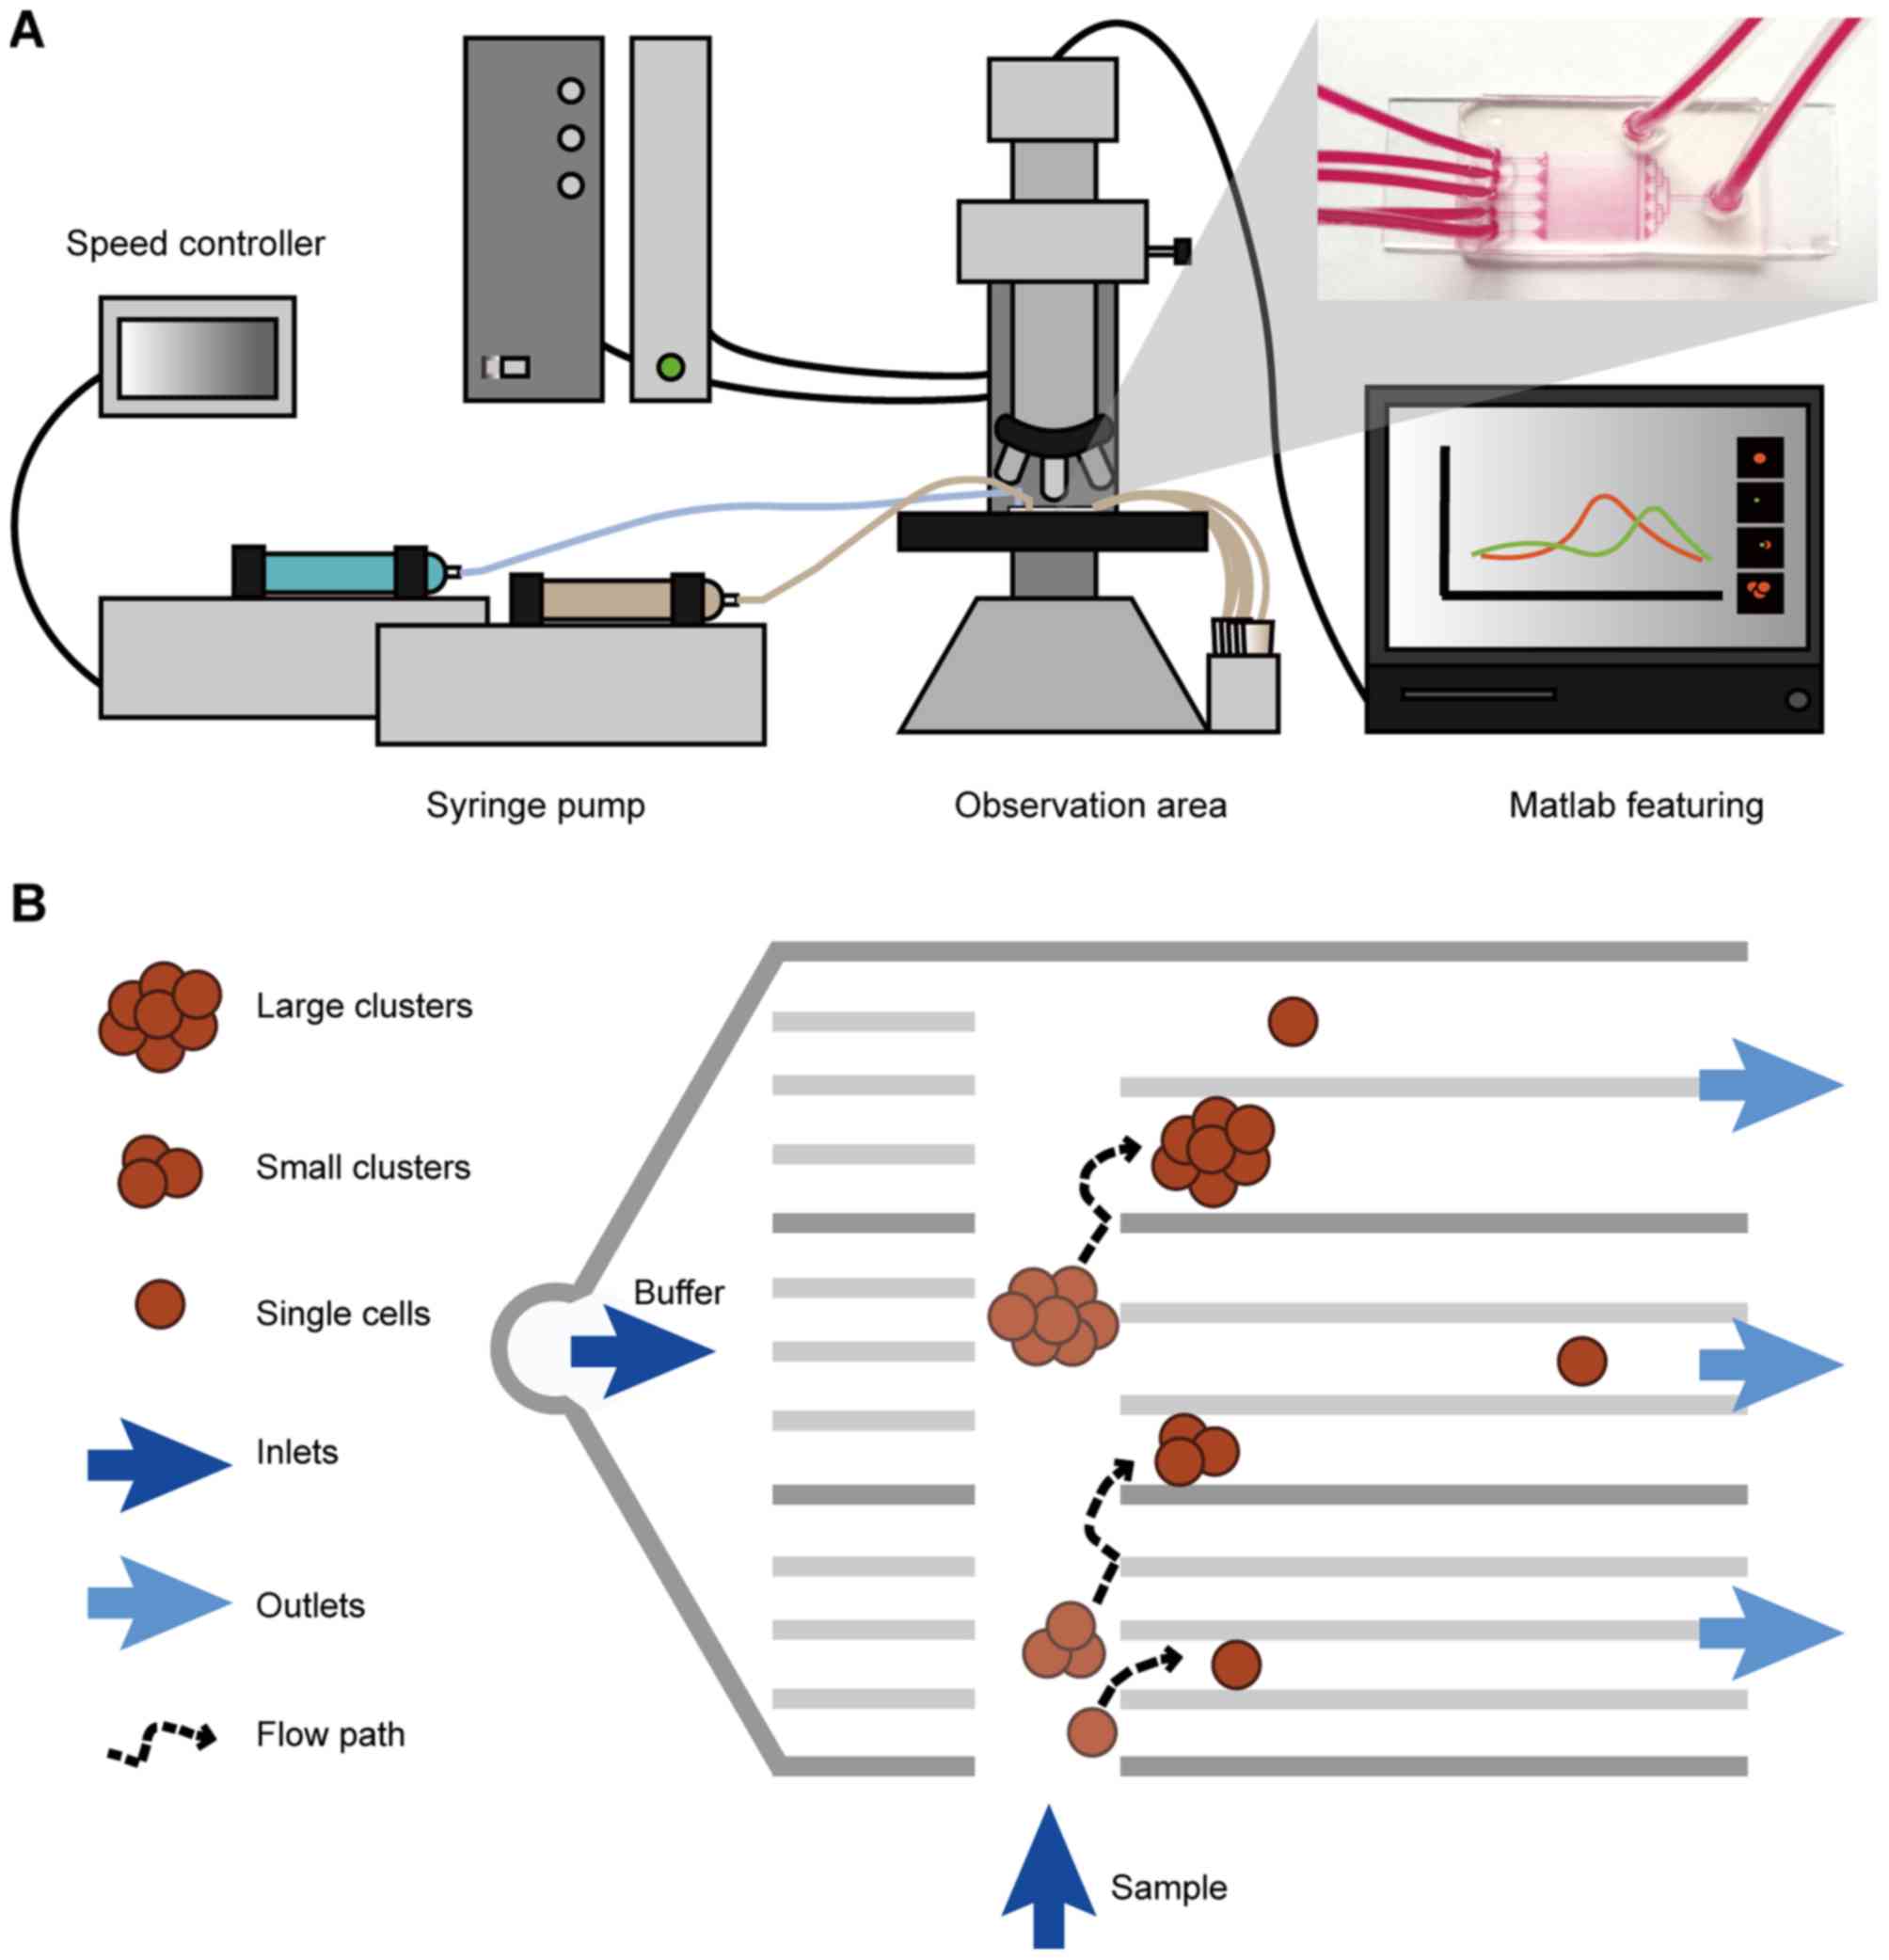
Design of the identifier system
The identifier system consists of two components,
the cell cluster sorting chip and image recognition.
For the first component, a microfluidic platform was
constructed, controlled by a two-way injection pump, as presented
in Fig. 1A. This platform consists
of two injection pumps, a controller, a microfluidic chip and a
fluorescence microscope. By adjusting the ratio of the sample and
buffer in the chip at the inlet, the target cell cluster can be
collected and analyzed from the desired outlet.
The chip contains two sample inlets (Fig. 1B), five groups of sets of different
width channels and corresponding outlets. At the entrance, a set of
fences was designed to equalize the distribution of the buffer. The
width of the fence aperture was 10 µm. By taking into consideration
the diversity of cell and cluster sizes, the sizes of each channel
group are set based on the different diameter of the target cell or
cluster. The width of the five groups of channels is 10, 12, 15, 20
and 40 µm, respectively. The number of channels in the channel I–V
groups ranged between 49 and 10, and the aim was to make the path
long enough for the objective targets to reach the channel of best
fit. The height of the channel was 50 µm, ensuring it is suitable
for the majority of cell clusters to pass through.
As presented in Fig.
1B, when a small cell passes through a small width channel, the
cell may be affected by the buffer and enter into a narrow channel.
Additionally, the larger clusters that flow through may be
‘flicked’ by the counter force, rolling through the width of any
channel.
For the second component of the identifier system,
image recognition was performed using Matlab, and the target object
was subsequently selected by the chip. The image recognition
program was supported by analyzing the features of the AO
staining.
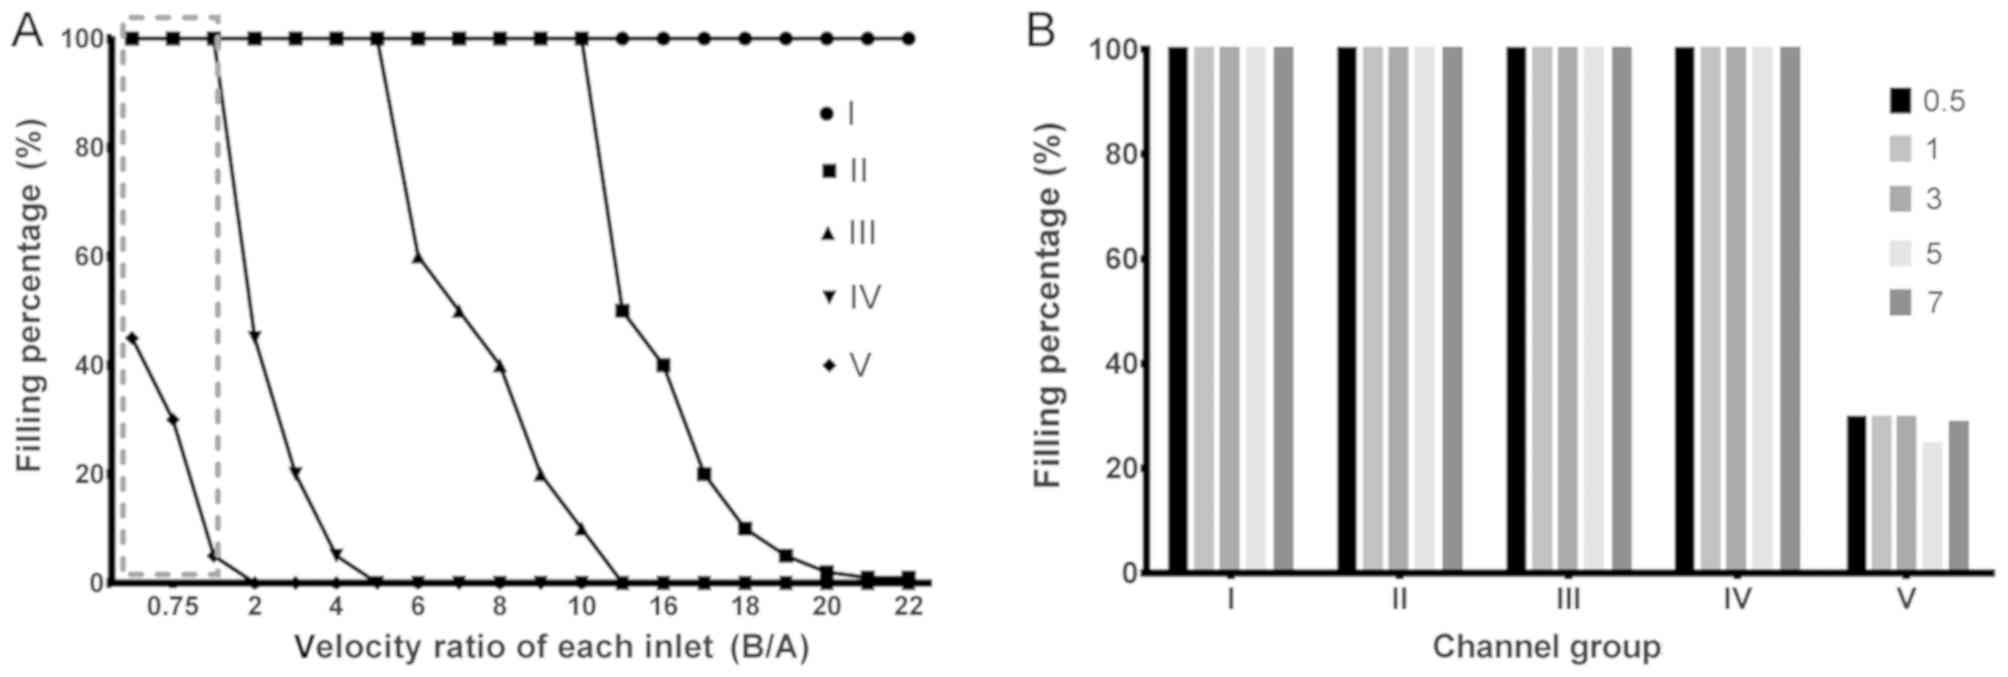
Fluid analysis
In order to identify the optimal operating
parameters of the device, which may assist in realizing the
collection of single cells and different size cell clusters in the
most fitting width channel group, a velocity-filling experiment was
performed. The filling rate was defined as the ratio of the number
of channels in which the target cells were filled in one channel
group. For example, if there were 10 channels in a channel group,
and seven channels containing cell components, then the filling
rate of the channel group would be 70%. In the present study, due
to the minimum width of the channel being 10 µm, the experiment was
performed using diluted whole blood in order to avoid the
phenomenon of backflow plugging in the test.
Firstly, in order to move the cells close to the
channel and to maintain a pressure <20 Pa, the inlet velocity
ratio of the sample and buffer was adjusted, in order to perform
the proportion-filling experiment. As presented in Fig. 2A, when the ratio of Vb:Va was 1:2,
channel group V was full of cells, resulting in no sorting effect.
When the ratio reached 2:1, the cells in channel V disappeared,
however the fence in channel I had produced a reverse flow (data
not shown). By setting a series of ratios, the optimal ratio which
satisfied channel group V with a certain filling rate and
maintained the pressure of the intersection was identified as Vb:
Va=1.00:0.85.
Secondly, in order to identify whether improvement
of the flow velocity under the aforementioned ratio affects the
filling rate and fluid pressure of the channel groups, a
speed-filling experiment was performed. The results, as presented
in Fig. 2B indicated that there was
no notable change in the filling rate under these conditions, and
only a relative improvement in speed was observed. According to the
results of shear stress stimulation (data not shown), when Va=10
ml/h (Vb=8.5 ml/h), the stress value was ~9.6 Pa at the region of
inlet A and channel intersection, which is within the normal human
arterial pressure range (5–20 Pa), indicating that it does not
contribute to the mechanical separation of clusters at the
intersection.
Recovery characteristics
In order to identify the maximum cell recovery rate,
the recovery characteristics of each channel of the chip were
analyzed at different velocity conditions. In the present study, a
prepared A549 cell cluster was used, and the sample was adjusted to
a concentration of 1×10⁸−1×10¹⁰ cell/ml prior
to the experiment. The numbers of all cell clusters were counted
when Va=3, 5, 7, 10 and 12 ml/h (whilst maintaining Va/Vb=0.85)
followed by execution of the chip-sorting process. The results, as
shown in Fig. 3A, indicated that the
recovery rate of a cell cluster reached its maximum value (~80%)
when Va=10 ml/h. As shown in Fig.
3B, the distribution results of the cell cluster indicated that
channel IV harvested the majority of the clusters under all flow
rates.
In order to identify the distribution situation of
various cluster groups (2, 3, 4, 5–6, 7–10, 11–15 and >16
cells/cluster), the number of cluster groups in each outlet were
counted and their 100% stacked column charts were statistically
analyzed. The results, as presented in Fig. 3C, revealed that all clusters were
mainly distributed in the III, IV and V channels, and larger
clusters (cells/cluster>10) only emerged in channels IV and V.
Therefore, in order to analyze the characteristics of large
clusters, the corresponding outlet (either IV or V) requires
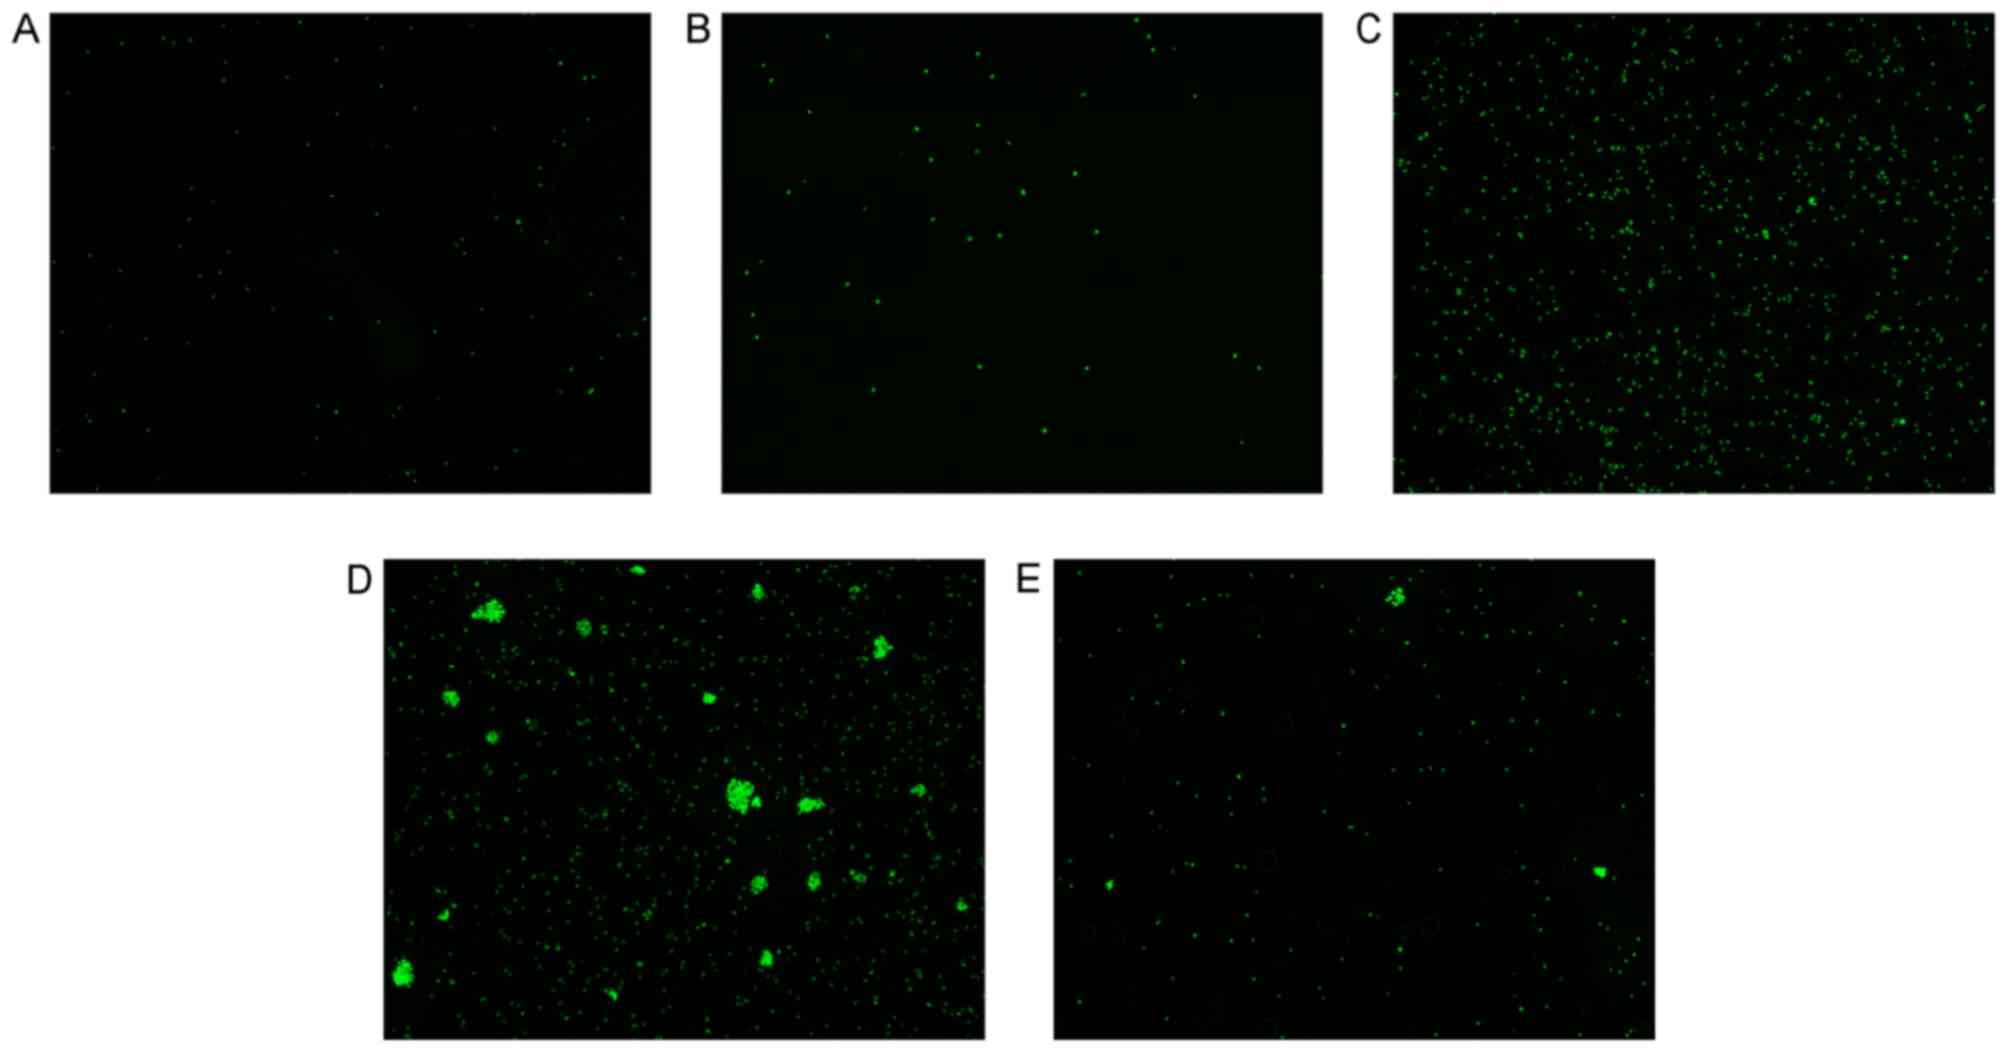
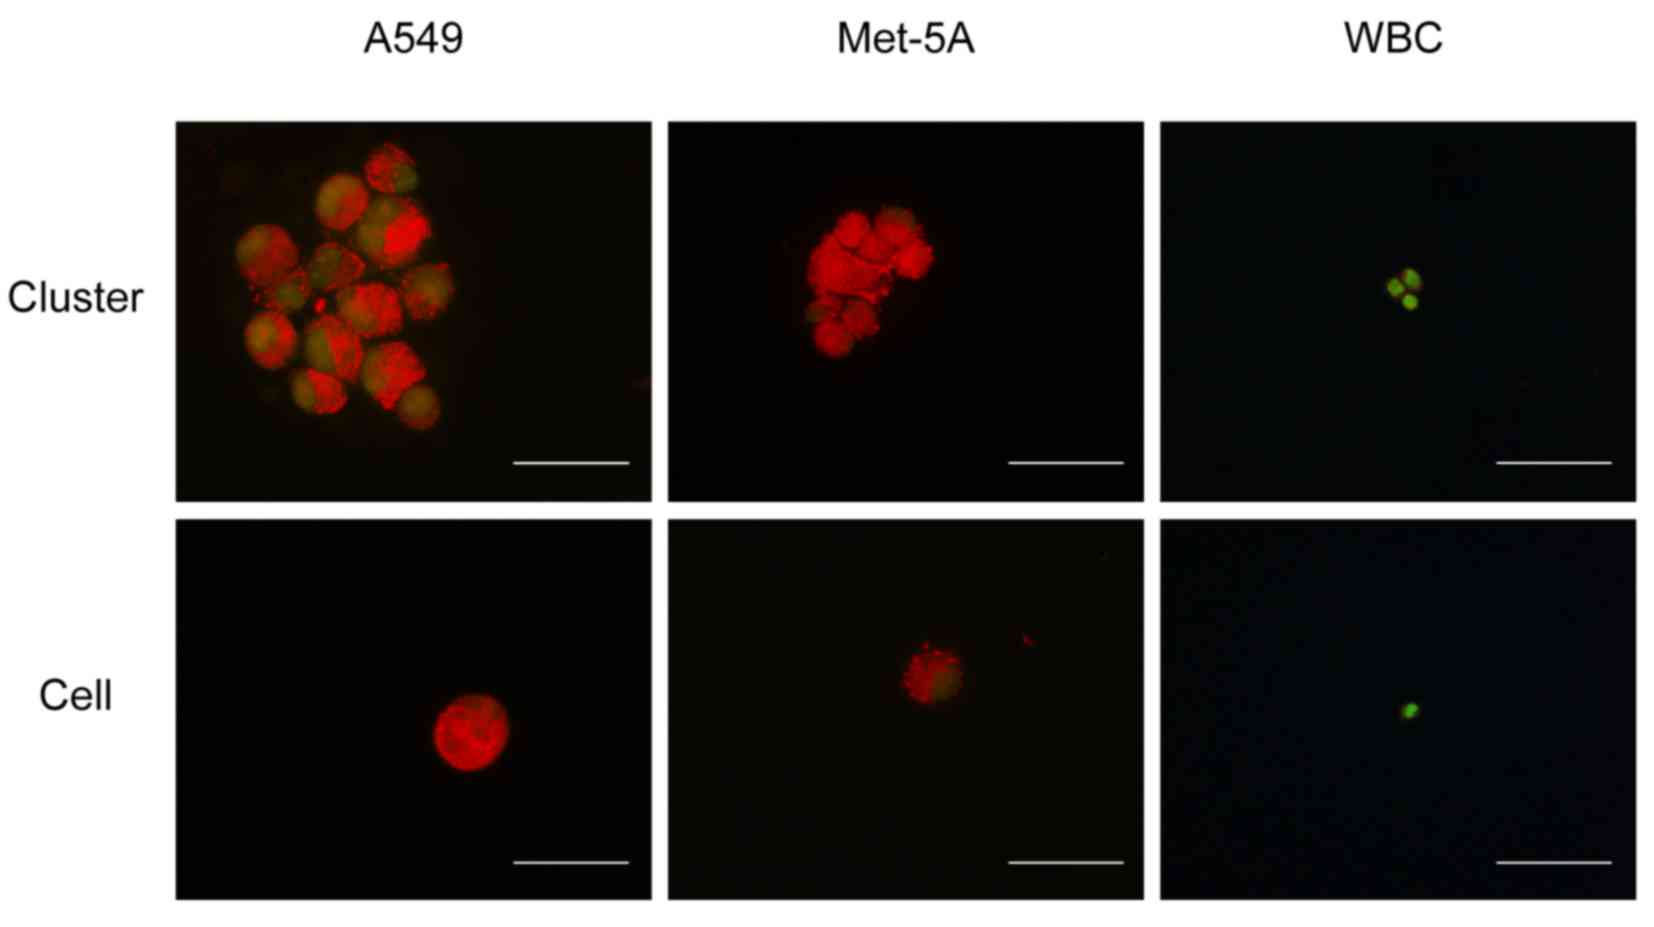
selection. Images of the AO fluorescence staining under the
fluorescein isothiocyanate light are shown in Fig. 4A-E, which presents the results of
Fig. 3C visually.
Viability of the chip
Subsequent to analyzing the recovery characteristics
of each channel, the present study aimed to examine whether the
chip exerted any influence on the viability of cells, therefore, a
cell viability assay was performed using trypan blue.
Through analysis of the cluster samples collected
from the outlets (III–V), the results (Fig. 3D) revealed that, following 10 min of
sorting by the chip, the cell viability in the clusters did not
differ significantly compared with that in the control group. This
indicates that the clusters collected by the chip may be used for
further downstream analysis.
Establishment of a diagnosis
model
Tumor cells and mesothelial cells are always
difficult to differentiate clinically, particularly those
stimulated to proliferate under inflammation. AO fluorescence dye
can be used to stain the nucleotide chain different colors. It
combines with double-stranded DNA by embedding between the two
chains and emits a bright green fluorescence. In the case of
single-stranded DNA and RNA, the dye is deposited on its phosphate
group by electrostatic attraction, which results in the emission of
orange-red fluorescence (24).
Therefore, the present study aimed to assess whether AO staining
can be used, by analyzing each image color channel characteristic
(green or red), to evaluate the proliferation characteristics of
tumor cells and mesothelium cells to distinguish between them.
In the present study, the A549 lung cancer cell line
and SV40 virus immortalized Met-5A human pleural mesothelial cell
line were used to conduct a comparative experiment. The WBCs
extracted from the whole blood of a healthy donor were used as the
control group. Samples were collected from each outlet (three
samples for each cell line) and stained with AO subsequent to
mixing with 0.01 M PBS to a final concentration of 1×10⁸
cells/ml (with each cluster counted as one cell). The fluorescent
results are presented in Fig. 5,
which reveal that the mesothelial cell clusters and lung cancer
cell clusters exhibited a large area of orange fluorescence, and it
was not possible to distinguish the nucleus boundary for the
majority of them. By contrast, the WBCs had a clear nuclear outline
and exhibited a higher level of green fluorescence compared with
the mesothelial or lung cancer cells. For individual cells, the
outlines of the nucleus in the mesothelial and lung cancer cells
were clearer compared with those in the WBCs, which may indicate
that this phenomenon is associated with cell adhesion and
proliferation ability. However, further experiments are required to
confirm this.
Therefore, an analysis system was established using
Matlab to examine various cells and cell clusters to determine
whether there are features that may be used to distinguish
different types of cells or clusters. A total number of 375 images
were analyzed, including 70 of A549 clusters and 50 of single
cells; 80 of Met-5A clusters and 39 of single cells; and 36 of WBC
clusters and 100 of single cells. The selected features for image
analysis were commonly used indicators, including the following: i)
mean energy value, ii) energy variance, iii) mean entropy value,
iv) entropy variance, v) mean contrast value, vi) contrast
variance, vii) mean correlation value, viii) correlation variance
and ix) color histogram.
The co-occurrence matrix eigenvalue results are
presented in Fig. 6. For clusters in
channel R (Fig. 6A), seven
statistically significant differences were found between the A549
and Met-5A cell lines. For clusters in channel G (Fig. 6B), seven statistically significant
differences were also identified between the Met-5A and A549 cells.
However, there were marginal differences between each feature. For
single cells (Fig. 7), statistically
significant differences were identified in four features in channel
G (Fig. 7A) and six features in
channel R (Fig. 7B) between the cell
types. For clusters in channel R/G (Fig.
8A), statistically significant differences were identified
between the Met-5A and A549 cells for only two features. For single
cells in channel R/G (Fig. 8B), five
features differed significantly between the Met-5A and A549
cells.
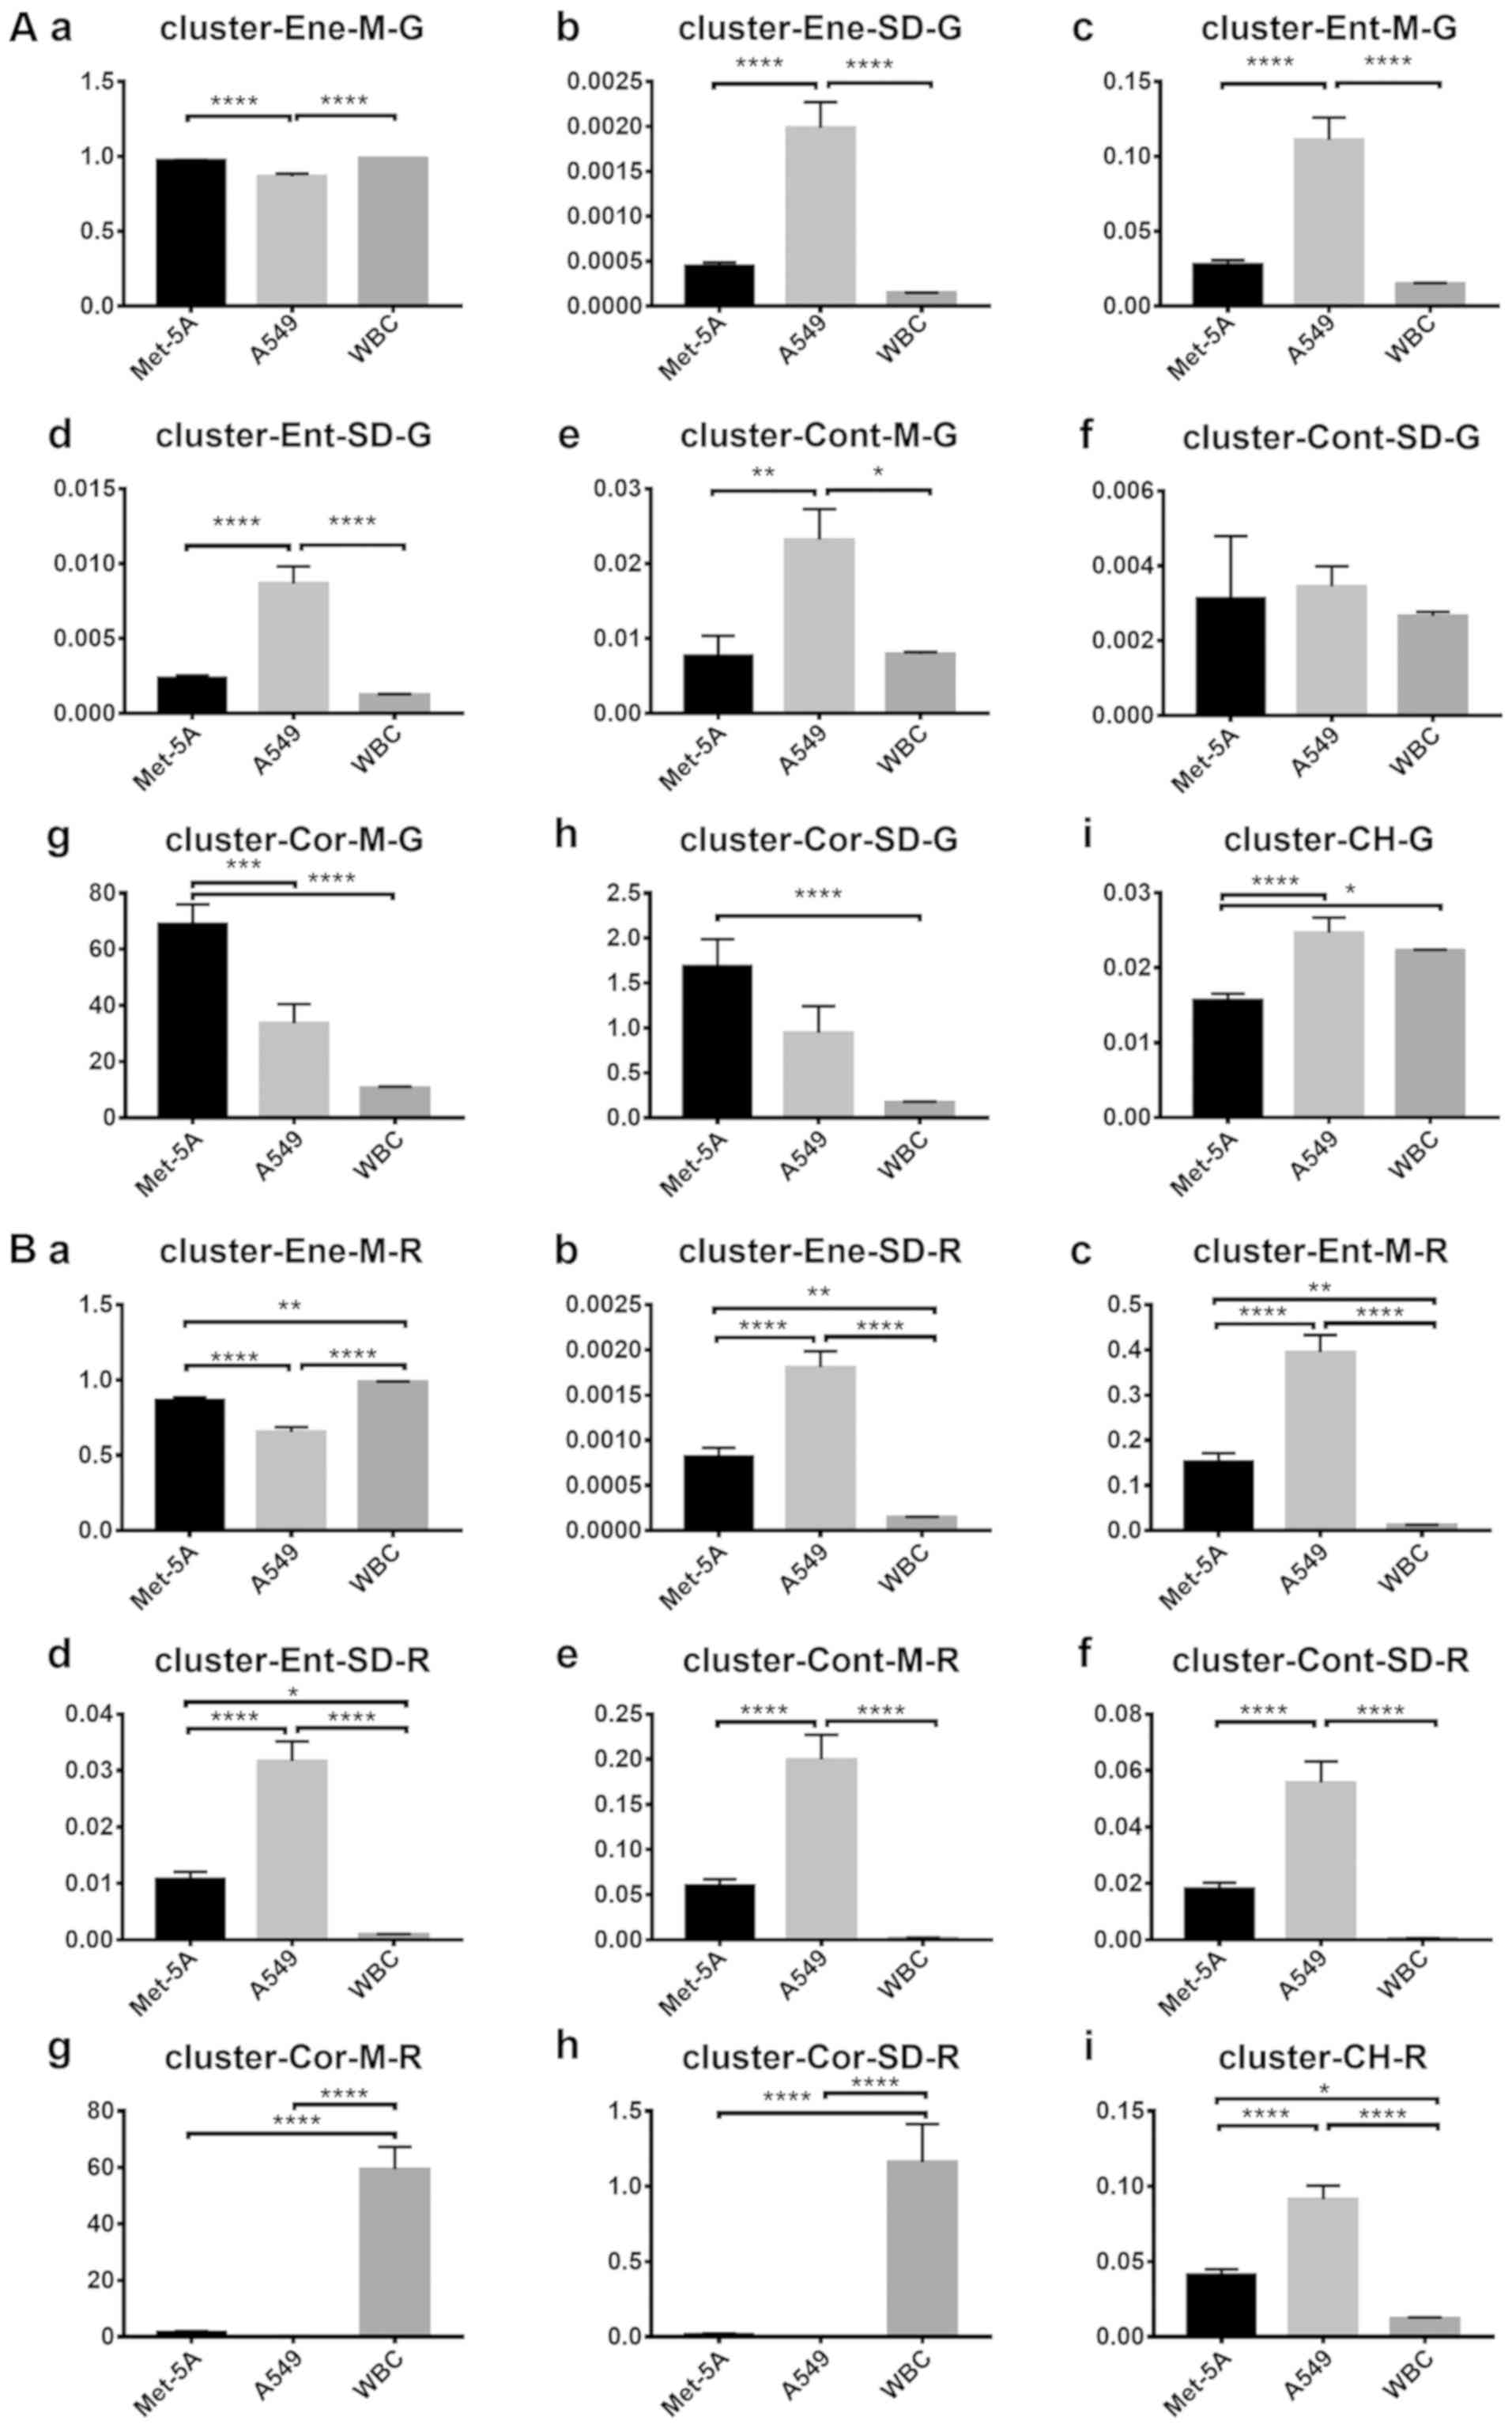 | Figure 6.Comparison of the features between
each cluster. (A) G values of each cluster feature: (Aa) Mean
energy value, (Ab) energy variance, (Ac) mean entropy value, (Ad)
entropy variance, (Ae) mean contrast value, (Af) contrast variance,
(Ag) mean correlation value, (Ah) correlation variance and (Ai)
color histogram. (B) R values of each feature: (Ba) Mean energy
value, (Bb) energy variance, (Bc) mean entropy value, (Bd) entropy
variance, (Be) mean contrast value, (Bf) contrast variance, (Bg)
mean correlation value, (Bh) correlation variance and (Bi) color
histogram. The vertical axis represents the feature values in
channel G or R. The horizontal axis represents the three cell types
used. One-way analysis of variance was used for the analysis of
each group. Error bars represent the mean ± standard error of the
mean. *P<0.05, **P<0.01, ***P<0.001 and ****P<0.0001.
WBC, white blood cell. |
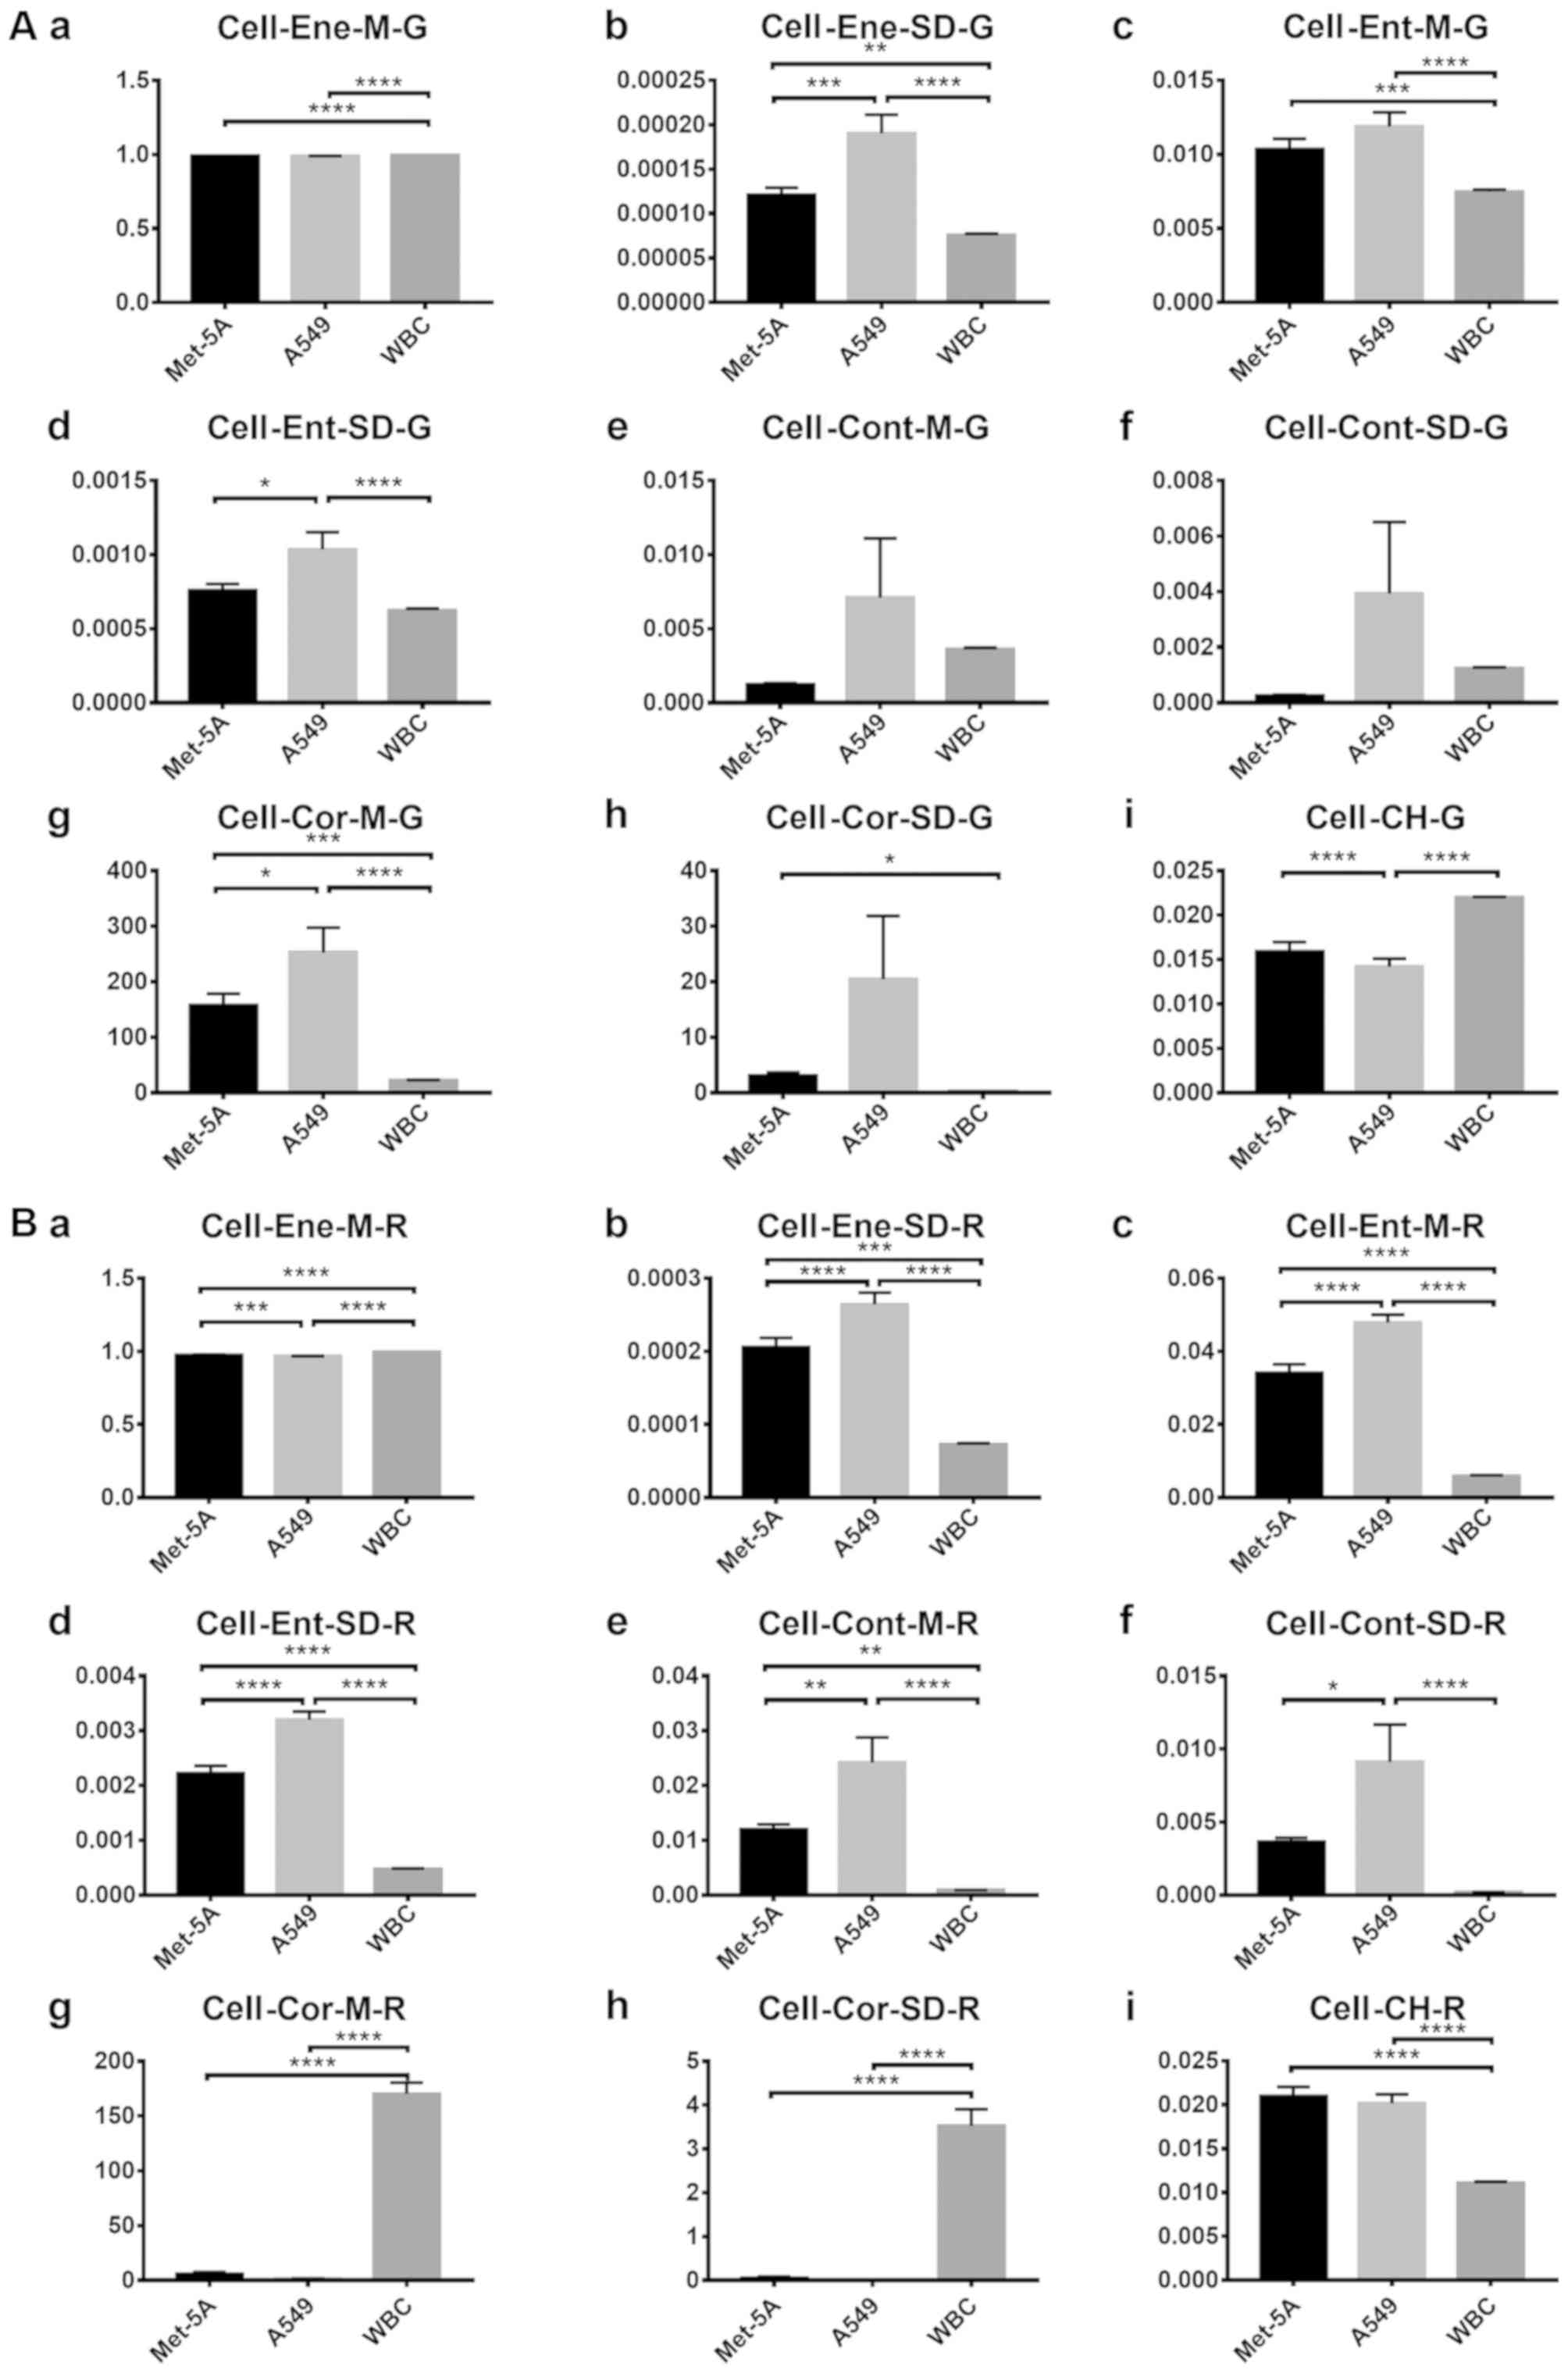 | Figure 7.Comparison of the features between
cells. (A) G values of each cell feature: (Aa) Mean energy value,
(Ab) energy variance, (Ac) mean entropy value, (Ad) entropy
variance, (Ae) mean contrast value, (Af) contrast variance, (Ag)
mean correlation value, (Ah) correlation variance and (Ai) color
histogram. (B) R values of each cell feature: (Ba) Mean energy
value, (Bb) energy variance, (Bc) mean entropy value, (Bd) entropy
variance, (Be) mean contrast value, (Bf) contrast variance, (Bg)
mean correlation value, (Bh) correlation variance and (Bi) color
histogram. The vertical axis represents the feature values in
channel G or R. The horizontal axis represents the three cell types
used. One-way analysis of variance was used for the analysis. of
each group. Error bars represent the mean ± standard error of the
mean. *P<0.05, **P<0.01, ***P<0.001 and ****P<0.0001.
WBC, white blood cell. |
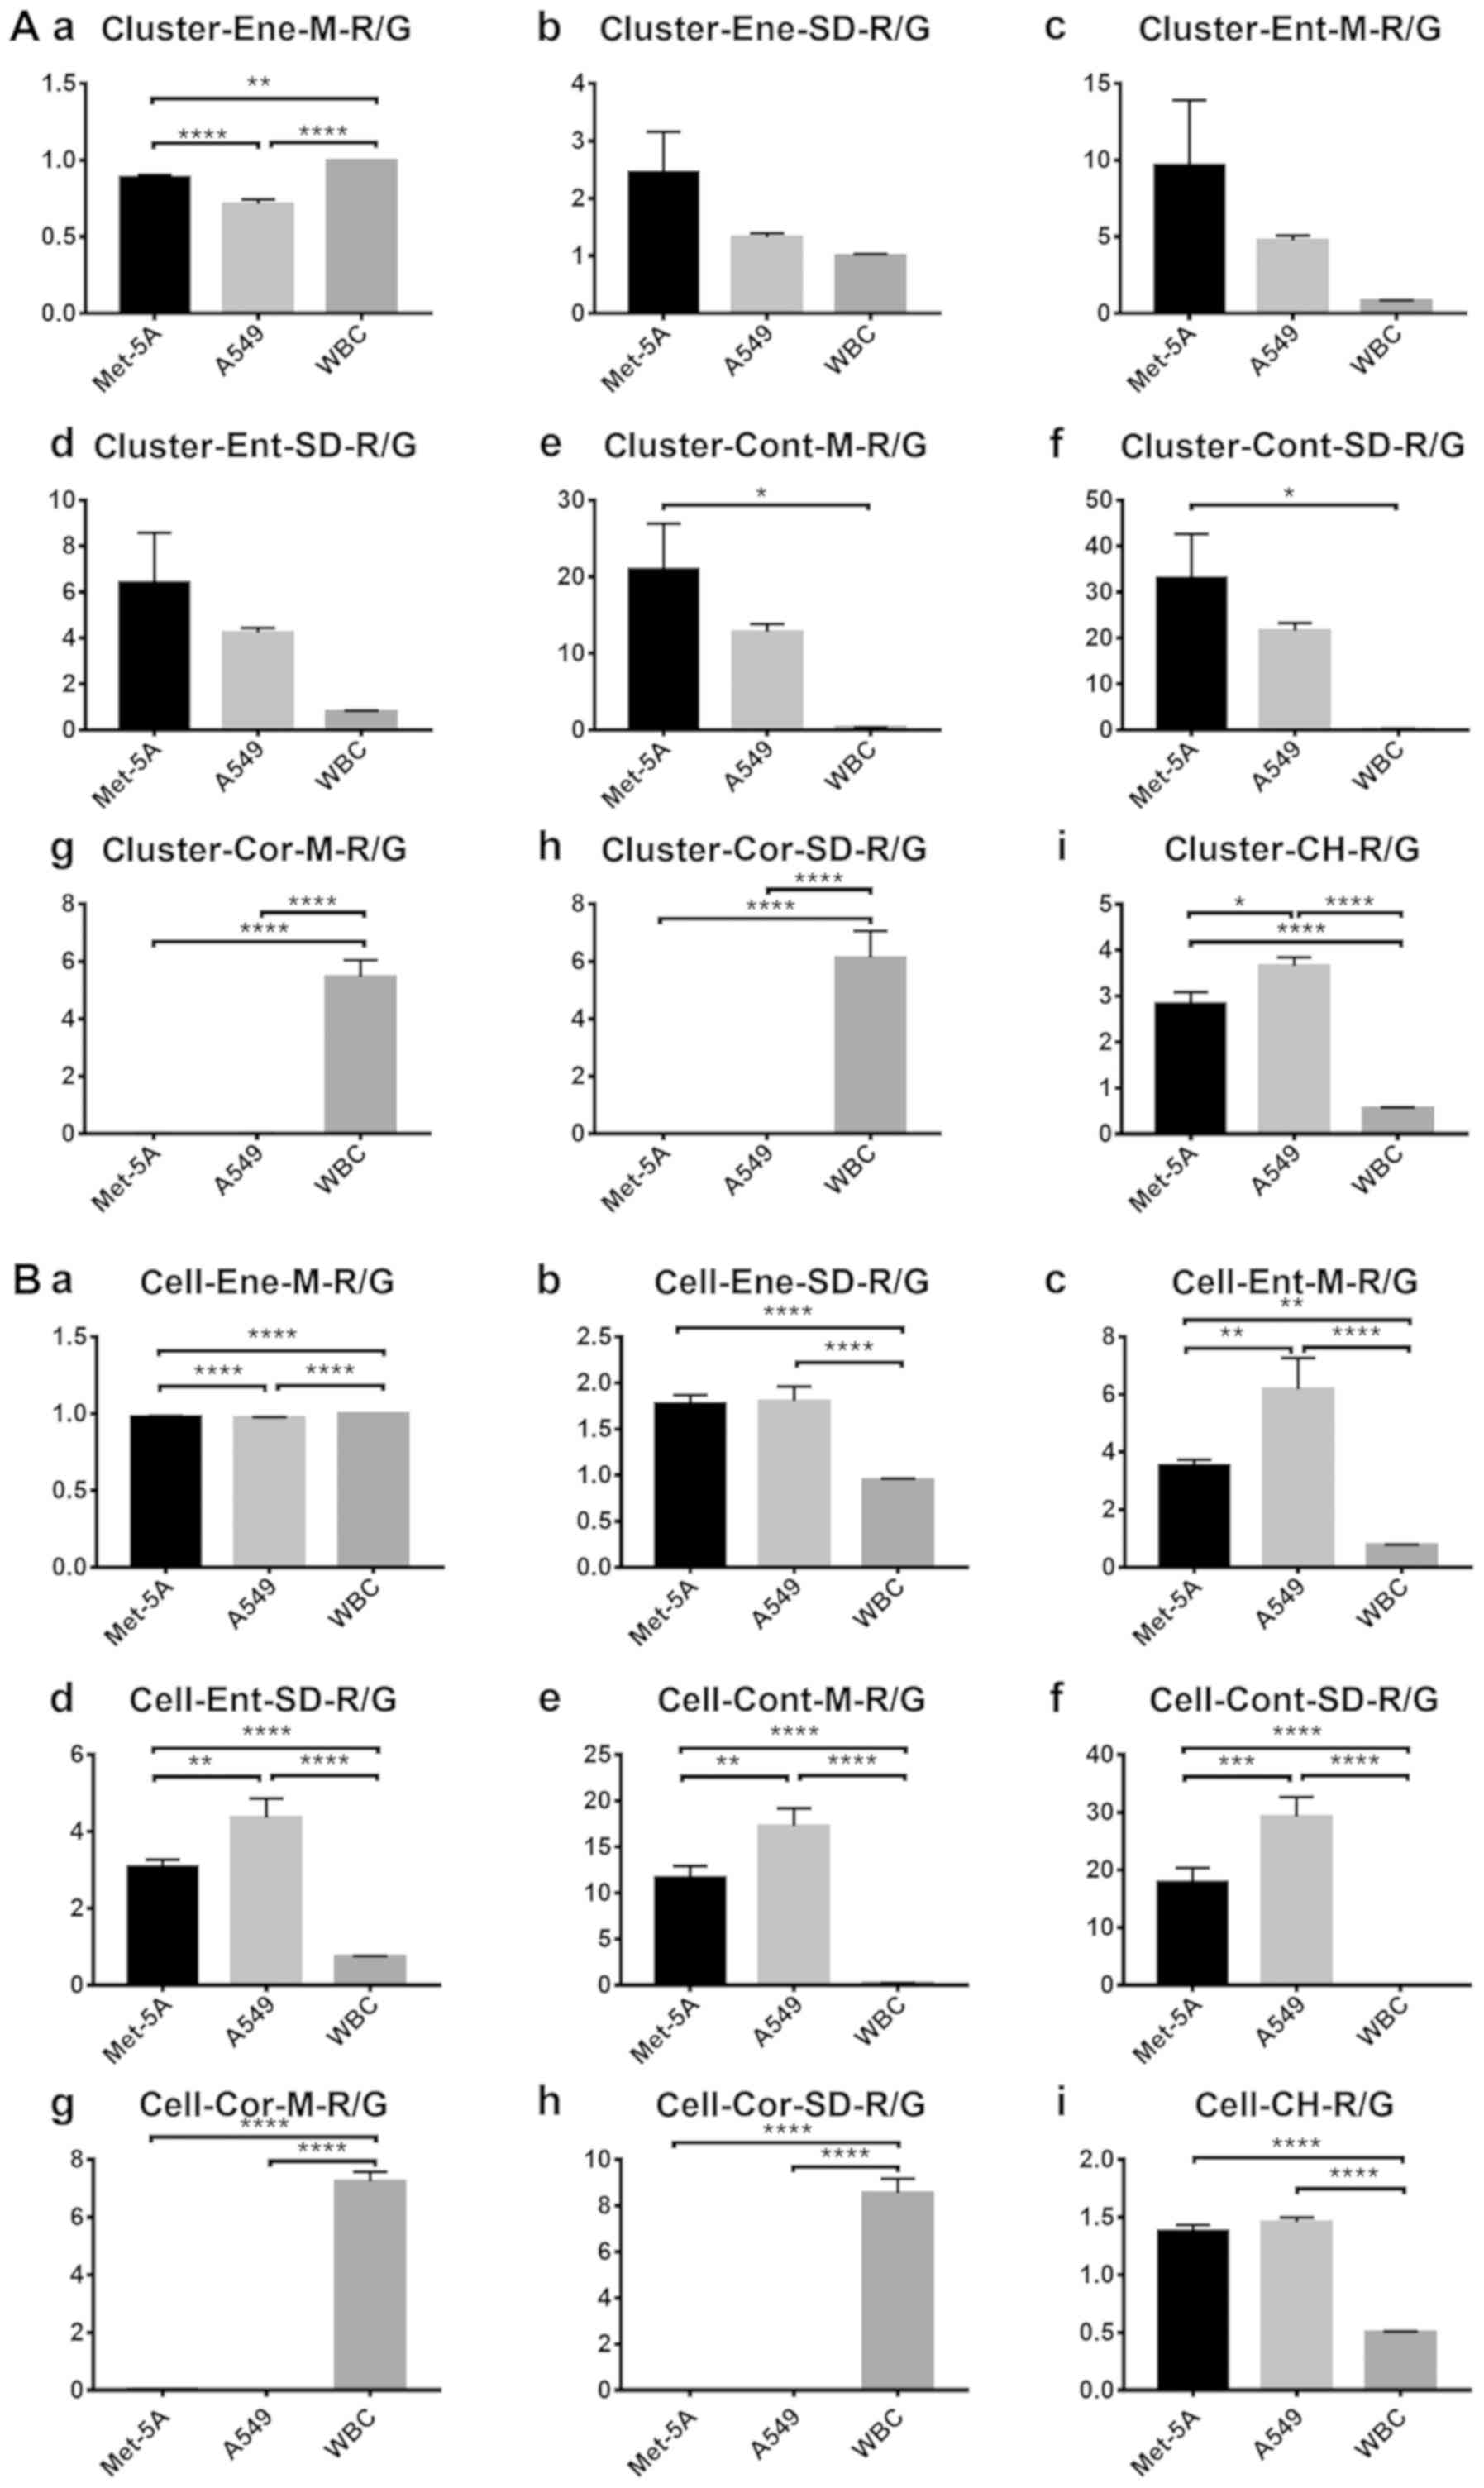 | Figure 8.R/G values of clusters and cells. R/G
values of each (A) cell cluster for (Aa) mean energy value, (Ab)
energy variance, (Ac) mean entropy value, (Ad) entropy variance,
(Ae) mean contrast value, (Af) contrast variance, (Ag) mean
correlation value, (Ah) correlation variance and (Ai) color
histogram. (B) R/G values of each single cell for (Ba) mean energy
value, (Bb) energy variance, (Bc) mean entropy value, (Bd) entropy
variance, (Be) mean contrast value, (Bf) contrast variance, (Bg)
mean correlation value, (Bh) correlation variance and (Bi) color
histogram. The vertical axis represents the feature values in
channel R/G. The horizontal axis represents the three cell types
used. One-way analysis of variance was used for the analysis of
each group. Error bars represent the mean ± standard error of the
mean. *P<0.05, **P<0.01, ***P<0.001 and ****P<0.0001.
WBC, white blood cell. |
These results suggest that it is feasible to
distinguish between A549 and Met-5A cells using AO fluorescence
staining in the R or G channels, and that there are a greater
number of features distinguishing tumor clusters from normal
clusters compared with single tumor cells.
Therefore, it is possible to distinguish between
different types of cells by screening a greater number of features,
and by setting threshold and confidence intervals and assessing the
accuracy of each feature, the identification of tumor cells may be
improved in the future.
Identification of pleural effusion in
patients
Subsequent to the collection of pleural effusion
samples from two patients who had been diagnosed with lung cancer
at Tianjin Chest Hospital, chip sorting and image analysis were
performed. A representative example is shown in Fig. 9, which presents the experimental
results of one patient. From the H&E staining, tumor clusters
were identified. The immunohistochemical staining results were as
follows: CEA (+), mesothelial cell (−), tumor protein P53 (+) and
TTF-1 (+), suggesting that the clusters are the adenocarcinoma
type. For each cluster type, three images were selected. The
characteristic identification analysis revealed that six features
were significantly different in channel R, and five features were
significantly different in channel G. This indicated that, for
clinical specimens, different types of clusters can be
differentiated by the platform.
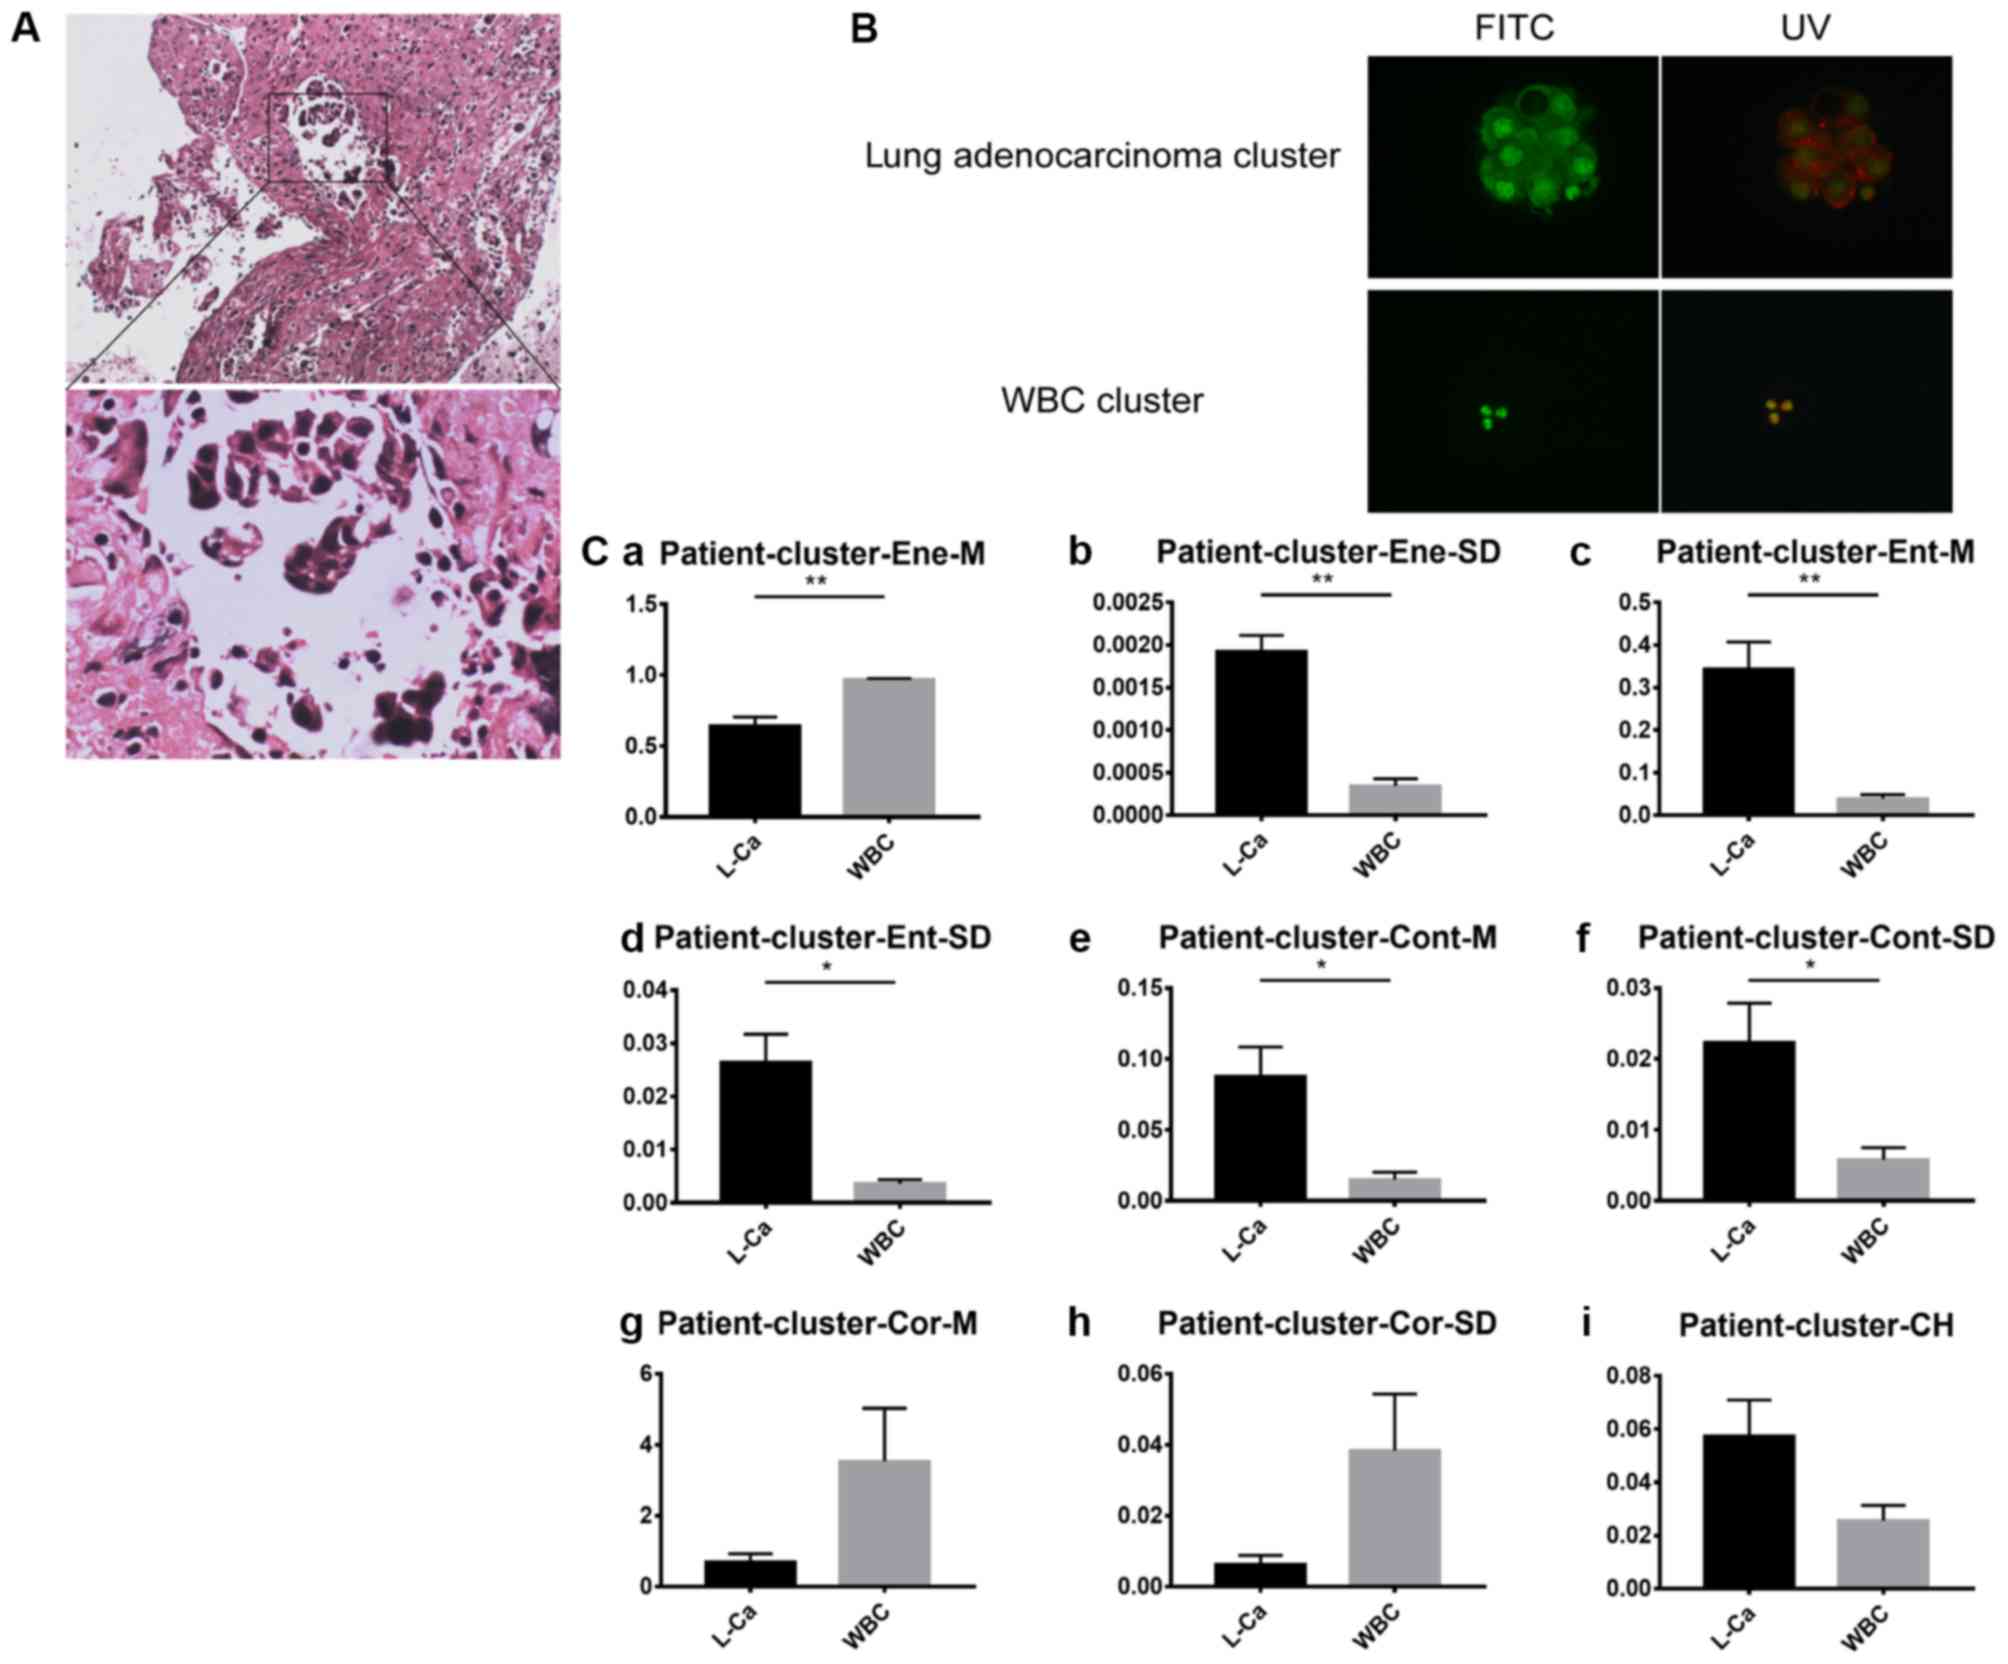 | Figure 9.Pleural effusion sample analysis from
patients with lung cancer. (A) Lung tissue biopsy hematoxylin and
eosin staining results. Upper panel, magnification, ×10 and lower
panel, magnification, ×40. (B) Clusters stained by acridine orange
in pleural effusion samples under FITC and UV light. Magnification,
×40. (C) R values of each cluster feature: (Ca) Mean energy value,
(Cb) energy variance, (Cc) mean entropy value, (Cd) entropy
variance, (Ce) mean contrast value, (Cf) contrast variance, (Cg)
mean correlation value, (Ch) correlation variance and (Ci) color
histogram The vertical axis represents the feature values of
channel R. The horizontal axis includes the patient clusters
assessed. Unpaired t-test analysis was used for each group. Error
bars represent the mean ± standard error of the mean. *P<0.05
and **P<0.01. FITC, fluorescein isothiocyanate; UV, ultraviolet;
WBC, white blood cell; L-Ca, lung cancer. |
Discussion
As malignant pleural effusion mainly consists of the
following components: Red blood cells, WBCs, mesothelial cells and
tumor cells or tumor clusters, it is possible to identify single
cells by analyzing various characteristics, including size
(26,27), electric features (28), acoustic features (29,30) and
immunomagnetic features (31,32).
However, the gold standard of tumor diagnosis remains its
pathological appearance. Additionally, with the exception of
circulating tumor clusters (33,34),
there remains a lack of systematic analysis of pleural effusion
clusters. Therefore, the present study established a microfluidic
chip and algorithm based on cell sorting and a morphological method
for pleural effusion cluster identification.
In the present study, microfluidic technology was
used to separate tumor cells and clusters from pleural effusion
samples obtained from patients and identify them from the selective
outlets. For isolation, the most suitable velocity pair for sorting
was identified as Va=0 ml/h and Vb=8.5 ml/h, and with clusters
being harvested from outlets IV and V and single cells gathered
mainly from outlet III, the total recovery rate of the clusters was
~80%. In the present study, almost 20% of the target clusters were
lost. This absence frequency may be due to the long duration of the
running process, which results in the phenomenon of the sample in
the horizontally-oriented inlet pipeline (~10 cm), which can be
avoided by using a vertical setting on the syringe pumps.
For identification, AO staining was used in order to
make use of its non-specificity. Usually, specific cell markers can
be lost due to the heterogeneity of biomarkers, particularly in
pleural effusion. However, the internal nucleic acid distribution
is maintained. Therefore, by staining the cells with AO under UV
light, the distribution of nucleic acids can be detected using this
method to visualize and analyze the composition of the nucleus. In
addition, the color difference between double chain and single
nucleic acid can be used to determine the cell proliferation
condition. Using a set of image analyzers, the tumor cells or
clusters were characterized and distinguished from the non-tumor
cells or clusters. The characteristics of different color channel
ratios may be preliminarily distinguishable between different cell
clusters and single cells. However, as the present study used only
one lung cancer cell line, it was not possible to separate the
identifying columns into sub-types. For future investigations, the
addition of additional lung cancer-associated cell lines may be
used to fulfill the model. In addition, the pleural effusion
contains numerous tissue fragments, even fibrinous aggregates;
however, the image recognition principle in the present study was
based on the shape, texture, color, contrast or other features of
the captured images. Tissue fragments or fibrin are different from
cells, and certain fragments do not have cellular structures. At
present, the procedure in the present study does not collect data
to account for this, however, through subsequent improvements,
these data can be collected for characteristic recognition, or by
setting thresholds of cells to rule out the foreign body.
In conclusion, on the basis of cell size, a suitable
microfluidic chip was designed for hydrothorax tumor cell clusters:
When a cell cluster has >10 cells, they appear only in channel
IV and V of the chip. AO fluorescent staining of the cells was
used, and this revealed certain identification features used to
distinguish between tumor and non-tumor cell clusters. The
characteristics of the two selected cell lines indicate, to a
certain extent, that this method may be used to identify lung
cancer cells and mesothelial cells in malignant pleural
effusion.
Acknowledgements
The authors would like to thank Dr Zhao Gang
(Department of Pathology, Cancer Hospital, Tianjin Medical
University, Tianjin, China) for assisting with pathological
technology and diagnosis.
Funding
The present study was supported by the National
Natural Science Foundation of China through the Operational
Competitiveness Program and national funding from the Natural
Science Foundation of Tianjin City (grant nos. 30973157, 81772945
and 15JCYBJC268000).
Availability of data and materials
The datasets used and/or analyzed in the present
study are available from the corresponding author on reasonable
request.
Authors' contributions
LZ designed the research, collected the sample,
performed the experiment, analyzed the data and wrote the
manuscript. YY assisted with the chip experiment. MZ and ZZ
designed the feature algorithm and analyzed images of samples. YG
and XW contributed to patient sample collection. FZ and XS
contributed significantly to statistical analysis. All authors read
and approved the final manuscript.
Ethics approval and consent to
participate
The study was approved by the Ethics Committee of
Tianjin Medical University (Tianjin, China; study no.
TMUhMEC2017012), and the patients or their families signed informed
consent.
Patient consent for publication
Not applicable.
Competing interests
The authors declare that they have no competing
interests.
Glossary
Abbreviations
Abbreviations:
|
AO
|
acridine orange
|
|
DMEM
|
Dulbecco's modified Eagle's medium
|
|
PBS
|
phosphate buffer solution
|
References
|
1
|
Torre LA, Bray F, Siegel RL, Ferlay J,
Lortet-Tieulent J and Jemal A: Global cancer statistics, 2012. CA
Cancer J Clin. 65:87–108. 2015. View Article : Google Scholar : PubMed/NCBI
|
|
2
|
Toufektzian L, Sepsas E, Drossos V,
Gkiozos I and Syrigos K: Pleural lavage cytology: Where do we
stand? Lung Cancer. 83:14–22. 2014. View Article : Google Scholar : PubMed/NCBI
|
|
3
|
Tsuchido K, Yamada M, Satou T, Otsuki Y,
Shimizu S and Kobayashi H: Cytology of sclerosing epithelioid
fibrosarcoma in pleural effusion. Diagn Cytopathol. 38:748–753.
2010.PubMed/NCBI
|
|
4
|
Huang CC and Michael CW: Cytomorphological
features of metastatic squamous cell carcinoma in serous effusions.
Cytopathology. 25:112–119. 2014. View Article : Google Scholar : PubMed/NCBI
|
|
5
|
Omori M, Kondo T, Yuminamochi T, Nakazawa
K, Ishii Y, Fukasawa H, Hashi A and Hirata S: Cytologic features of
ovarian granulosa cell tumors in pleural and ascitic fluids. Diagn
Cytopathol. 43:581–584. 2015. View
Article : Google Scholar : PubMed/NCBI
|
|
6
|
Kosmas K, Tsonou A, Mitropoulou G, Salemi
E, Kazi D and Theofanopoulou A: Malignant pleural effusion from
papillary thyroid carcinoma diagnosed by pleural effusion cytology:
A case report. Diagn Cytopathol. 46:204–207. 2018. View Article : Google Scholar : PubMed/NCBI
|
|
7
|
Ferreiro L, Toubes ME and Valdes L:
Contribution of pleural fluid analysis to the diagnosis of pleural
effusion. Med Clin (Barc). 145:171–177. 2015. View Article : Google Scholar : PubMed/NCBI
|
|
8
|
Che J, Mach AJ, Go DE, Talati I, Ying Y,
Rao J, Kulkarni RP and Di Carlo D: Microfluidic purification and
concentration of malignant pleural effusions for improved molecular
and cytomorphological diagnostics. PLoS One. 8:e781942013.
View Article : Google Scholar : PubMed/NCBI
|
|
9
|
Rashmi K, Shashikala P, Hiremath S and
Basavaraj HG: Cells in pleural fluid and their value in
differential diagnosis. J Cytology. 25:138–143. 2008. View Article : Google Scholar
|
|
10
|
Attanoos RL, Galateau-Salle F, Gibbs AR,
Muller S, Ghandour F and Dojcinov SD: Primary thymic epithelial
tumours of the pleura mimicking malignant mesothelioma.
Histopathology. 41:42–49. 2002. View Article : Google Scholar : PubMed/NCBI
|
|
11
|
Wendel M, Bazhenova L, Boshuizen R,
Kolatkar A, Honnatti M, Cho EH, Marrinucci D, Sandhu A, Perricone
A, Thistlethwaite P, et al: Fluid biopsy for circulating tumor cell
identification in patients with early-and late-stage non-small cell
lung cancer: A glimpse into lung cancer biology. Phys Biol. Feb
9;0160052012.doi: 10.1088/1478-3967/9/1/016005. View Article : Google Scholar : PubMed/NCBI
|
|
12
|
Hsieh TC, Huang WW, Lai CL, Tsao SM and Su
CC: Diagnostic value of tumor markers in lung
adenocarcinoma-associated cytologically negative pleural effusions.
Cancer Cytopathol. 121:883–888. 2013. View Article : Google Scholar
|
|
13
|
Bisht B, Handa U, Mohan H and Lehl SS:
Complementary value of DNA flow cytometry and image morphometry in
detection of malignant cells in effusion fluids. Malays J Pathol.
36:83–90. 2014.PubMed/NCBI
|
|
14
|
Ai T, Tabe Y, Takemura H, Kimura K,
Takahashi T, Yang H, Tsuchiya K, Konishi A, Uchihashi K, Horii T
and Ohsaka A: Novel flowcytometry-based approach of malignant cell
detection in body fluids using an automated hematology analyzer.
PLoS One. 13:e01908862018. View Article : Google Scholar : PubMed/NCBI
|
|
15
|
Miédougé M, Rouzaud P, Salama G, Pujazon
MC, Vincent C, Mauduyt MA, Reyre J, Carles P and Serre G:
Evaluation of seven tumour markers in pleural fluid for the
diagnosis of malignant effusions. Br J Cancer. 81:1059–1065. 1999.
View Article : Google Scholar : PubMed/NCBI
|
|
16
|
Yanaihara N, Caplen N Bowman E, Seike M,
Kumamoto K, Yi M, Stephens RM, Okamoto A, Yokota J, Tanaka T, et
al: Unique microRNA molecular profiles in lung cancer diagnosis and
prognosis. Cancer Cell. 9:189–198. 2006. View Article : Google Scholar : PubMed/NCBI
|
|
17
|
Hooper C, Lee YC and Maskell N; BTS
Pleural Guideline Group, : Investigation of a unilateral pleural
effusion in adults: British thoracic society pleural disease
guideline 2010. Thorax. 65:ii4–ii17. 2010. View Article : Google Scholar : PubMed/NCBI
|
|
18
|
Swiderek J, Morcos S, Donthireddy V,
Surapaneni R, Jackson-Thompson V, Schultz L, Kini S and Kvale P:
Prospective study to determine the volume of pleural fluid required
to diagnose malignancy. Chest. 137:68–73. 2010. View Article : Google Scholar : PubMed/NCBI
|
|
19
|
Rooper LM, Ali SZ and Olson MT: A minimum
fluid volume of 75 ml is needed to ensure adequacy in a pleural
effusion: A retrospective analysis of 2540 Cases. Cancer
Cytopathol. 122:657–665. 2014. View Article : Google Scholar : PubMed/NCBI
|
|
20
|
Scholtens TM, Schreuder F, Ligthart ST,
Swennenhuis JF, Tibbe AGJ, Greve J and Terstappen LW: Cell Tracks
TDI: An image cytometer for cell characterization. Cytometry A.
79:203–213. 2011. View Article : Google Scholar : PubMed/NCBI
|
|
21
|
Yasuda K, Hattori A, Kim H, Terazono H,
Hayashi M, Takei H, Kaneko T and Nomura F: Non-destructive on-chip
imaging flow cell-sorting system for on-chip cellomics.
Microfluidics and Nanofluidics. 14:907–931. 2013. View Article : Google Scholar
|
|
22
|
Smith ZJ, Gao T, Chu K, Lane SM, Matthews
DL, Dwyre DM, Hood J, Tatsukawa K, Heifetz L and Wachsmann-Hogiu S:
Single-step preparation and image-based counting of minute volumes
of human blood. Lab Chip. 14:3029–3036. 2014. View Article : Google Scholar : PubMed/NCBI
|
|
23
|
Zhao M, Wu A, Song J, Sun X and Dong N:
Automatic screening of cervical cells using block image processing.
Biomed Eng Online. 15:142016. View Article : Google Scholar : PubMed/NCBI
|
|
24
|
Amado AM, Pazin WM, Ito AS, Kuzmin VA and
Borissevitch IE: Acridine orange interaction with DNA: Effect of
ionic strength. Biochim Biophys Acta Gen Subj. 1861:900–909. 2017.
View Article : Google Scholar : PubMed/NCBI
|
|
25
|
Liu M, Li R, Tang Y, Chang J, Han R, Zhang
S, Jiang N and Ma F: New applications of the acridine orange
fluorescence staining method: Screening for circulating tumor
cells. Oncol Lett. 13:2221–2229. 2017. View Article : Google Scholar : PubMed/NCBI
|
|
26
|
Vona G Sabile A, Louha M, Sitruk V, Romana
S, Schütze K, Capron F, Franco D, Pazzagli M, Vekemans M, et al:
Isolation by size of epithelial tumor cells-A new method for the
immunomorphological and molecular characterization of circulating
tumor cells. Am J Pathol. 156:57–63. 2000. View Article : Google Scholar : PubMed/NCBI
|
|
27
|
Mohamed H, Murray M, Turner JN and Caggana
M: Isolation of tumor cells using size and deformation. J
Chromatogr A. 1216:8289–8295. 2009. View Article : Google Scholar : PubMed/NCBI
|
|
28
|
Yang H, Li L, Ding Y Ye D, Wang Y, Cui S
and Liao L: Molecularly imprinted electrochemical sensor based on
bioinspired Au microflowers for ultra-trace cholesterol assay.
Biosens Bioelectron. 92:748–754. 2017. View Article : Google Scholar : PubMed/NCBI
|
|
29
|
Fakhfouri A, Devendran C, Collins J, Ai Y
and Neild A: Virtual membrane for filtration of particles using
surface acoustic waves (SAW). Lab Chip. 16:3515–3523. 2016.
View Article : Google Scholar : PubMed/NCBI
|
|
30
|
Ren L, Chen Y, Li P, Mao Z, Huang PH, Rufo
J, Guo F, Wang L, McCoy JP, Levine SJ and Huang TJ: A
high-throughput acoustic cell sorter. Lab Chip. 15:3870–3879. 2015.
View Article : Google Scholar : PubMed/NCBI
|
|
31
|
Adams JD, Kim U and Soh HT: Multitarget
magnetic activated cell sorter. Proc Natl Acad Sci USA.
105:18165–18170. 2008. View Article : Google Scholar : PubMed/NCBI
|
|
32
|
Osman O, Toru S, Dumas-Bouchiat F, Dempsey
NM, Haddour N, Zanini LF, Buret F, Reyne G and Frenea-Robin M:
Microfluidic immunomagnetic cell separation using integrated
permanent micromagnets. Biomicrofluidics. 7:541152013. View Article : Google Scholar : PubMed/NCBI
|
|
33
|
Sarioglu AF, Aceto N, Kojic N, Donaldson
MC, Zeinali M, Hamza B, Engstrom A, Zhu H, Sundaresan TK, Miyamoto
DT, et al: A microfluidic device for label-free, physical capture
of circulating tumor cell clusters. Nat Methods. 12:685–691. 2015.
View Article : Google Scholar : PubMed/NCBI
|
|
34
|
Au SH, Edd J, Stoddard AE, Wong KHK,
Fachin F, Maheswaran S, Haber DA, Stott SL, Kapur R and Toner M:
Microfluidic isolation of circulating tumor cell clusters by size
and asymmetry. Sci Rep. 7:24332017. View Article : Google Scholar : PubMed/NCBI
|