Introduction
Lung cancer is the leading cause of
cancer-associated mortality among men and the second leading cause
among women worldwide (1). The vast
majority of lung cancer cases are non-small cell lung cancer
(NSCLC), comprising 80–85% of cases (2), among which adenocarcinoma is the most
common histological type (~50% of all NSCLCs) (3). However, despite continuous clinical
research from 1975 onwards, the overall 5-year survival rate of
patients with NSCLC has only improved from 14 to 18% (4). Therefore, although previous studies
have focused on genes associated with lung adenocarcinoma, the
genetic molecular mechanism underlying the development of this type
of cancer remains to be elucidated.
Studies investigating lung adenocarcinoma-associated
genes may improve the prognosis, diagnosis and treatment of lung
adenocarcinoma. With the developments in the field of
biotechnology, the expression levels of thousands of genes can be
detected simultaneously by microarray, providing a record of the
RNA transcriptional levels in the tissues being studied, further
facilitating the study of lung adenocarcinoma (5). All microarray datasets used in the
present study are available from the Gene Expression Omnibus (GEO)
public database at the National Center for Biotechnology
Information (6). However, the large
volume of data must be preprocessed and converted into a smaller
set of genes, which exhibit meaningful biological differences
between the control and test systems. Analyzing such a huge amount
of information from microarray datasets to identify molecular
pathways and key genes deregulated in lung adenocarcinoma is
extremely challenging. Subramanian et al (7) addressed this problem by describing a
method, referred to as Gene Set Enrichment Analysis (GSEA), to
reveal significant differences in expression between normal and
patient samples. GSEA is a test for groups of genes rather than a
single gene. However, the sample capacity, the difference of
platforms and the standardization may affect the statistical
results, and the meta-analysis may also make a difference.
Meta-analysis of microarray data may be an improved method of
dealing with poor reproducibility and reliability (8,9). These
two methods were utilized to select significant genes for Gene
Ontology (GO) annotation and identify the genes involved in the
molecular mechanism underlying lung adenocarcinoma development.
These observations highlight the importance of improving our
understanding of the etiology of lung adenocarcinoma, as well as
the molecular changes underlying this disease.
Materials and methods
Data collection
All research datasets were selected from GEO
(www.ncbi.nlm.nih.gov/geo/), using ‘lung
neoplasms’ as the medical subheading search term and setting the
study type to ‘expression profiling by array’, then limiting the
species to ‘human’. A total of 168 sets of genome-wide expression
microarray data associated with lung neoplasms were identified. The
studies that met all the following criteria are listed in Table I: i) Data on the expression of
genome-wide RNA; ii) valid complete microarray raw data or
standardized data; iii) data providing a comparison between lung
adenocarcinoma patients with normal controls; iv) data containing
≥6 samples; v) raw data expressed as CEL files; and vi) the studied
organism was Homo sapiens. A total of 6 gene expression
datasets met all the selection criteria; however, two of the
datasets, GSE43458 and GSE19188, presented problems with exporting
the data or lacked a correspondence between normal and pathological
tissues, respectively, and were therefore discarded. Thus, four
datasets were retained containing data on 132 lung adenocarcinomas
and 132 normal.
 | Table I.Characteristics of datasets selected
in the studies. |
Table I.
Characteristics of datasets selected
in the studies.
| GEO Accession | Author, year | (Refs.) | Country | Chip | Experimental
design | Probes | Disease, n | Normal, n |
|---|
| GSE18842 | Sanchez-Palencia
et al (2010) | (34) | Spain | HG-U133_Plus_2 | Paired,
tissues | 54675 | 12 | 12 |
| GSE33356 | Lu et al
(2012) | (35) | Taiwan | GPL570
(HG-U133_Plus_2) GPL6801 (GenomeWideSNP_6) | Paired,
tissues | 54675 | 60 | 60 |
| GSE10072 | Landi et al
(2008) | (36) | USA | GPL96
(HG-U133A) | Paired,
tissues | 22283 | 33 | 33 |
| GSE7670 | Su et al
(2007) | (37) | Taiwan | HG-U133A | Paired,
tissues | 22283 | 27 | 27 |
GSEA
GSEA primarily analyzes microarray data, using
genomic and genetic sequencing to detect significant biological
differences in microarray datasets (10). In the present study, differentially
expressed genes and common crucial pathways between lung
adenocarcinoma patients and normal controls from microarray data
were identified by GSEA. Computing and general statistical analysis
were processed in the R computing language http://www.R-project.org/ (11). The datasets were normalized and the
intensity of the log10 probe set was calculated using the Robust
Multichip averaging algorithm with bio-conductors (12). The selected differentially expressed
genes were required to have been mapped to an explicit Kyoto
Encyclopedia of Genes and Genomes (KEGG; www.genome.jp/kegg/) pathway of the Database for
Annotation, Visualization and Integrated Discovery (DAVID;
david.abcc.ncifcrf.gov/) for further
analysis using the Venn and meta-analysis methods (13). Pathway analysis of each dataset was
performed independently. The variability was measured in the
interquartile range (IQR) and a cut-off was set in order to
foreclose IQR values <0.5 for all the remaining genes. If one
gene was targeted in multiple probe sets, the probe set with the
greatest variability was retained. In addition, genes in each
pathway were subjected to statistical analysis system (SAS), and
each pathway's P-value was obtained in the permutation test with
1000×. P<0.05 was considered to indicate a statistically
significant difference.
Meta-analysis
A meta-analysis was performed in order to obtain the
significantly differentially expressed genes from the genes
included in each dataset mentioned above. The meta-analysis was
conducted in SAS 9.4 (SAS Institute, Inc., Cary, NC, USA). Then,
the χ2 value of each gene was calculated based on the
formula according to Brown (14):
X2=-2∑i=1klogePi
A cut-off was set in order to foreclose
χ2 values <0.05 for all the remaining genes, which
were used to obtain the pathways of the KEGG from DAVID
Bioinformatics Resources 6.7; k is the number of datasets.
The Cancer Genome Atlas (TCGA)
database
TCGA is a coordinated and comprehensive method for
promoting our understanding of the molecular mechanisms underlying
cancer development. Additional information on lung
adenocarcinoma-associated genes identified through clinical data in
GSEA may be obtained. The P′-value (P-value in TCGA) was adjusted
to <0.05. A total of 2,494 significantly differentially
expressed genes were obtained. Subsequently, 610 differentially
expressed genes from the meta-analysis were matched with the 2,494
genes from TCGA by the Venn method, which allowed crucial genes to
be filtered out according to the survival data.
Gene annotation of DAVID
Crucial genes were entered into DAVID, selecting the
official gene symbol as ‘select identifier’ and gene list as ‘list
type’ in the upload. A species limit of humans was set in the list
and background. Selecting the functional annotation tool and
entering the option of pathways, crucial common pathways of crucial
genes were obtained by the KEGG pathway of DAVID and their numbers
in the KEGG database.
Identification of significant common
pathways and key genes
As the significant common pathways serve an
important role in the pathogenesis of lung adenocarcinoma,
identifying significant common pathways was also attempted. Crucial
common pathways were matched with upregulated and downregulated
pathways by the Venn method to identify significant common
pathways. Key genes serving important roles in significant common
pathways were obtained. Furthermore, in order to gain an improved
insight into the key genes, the Blast2GO software (version 1.9;
/david.ncifcrf.gov/) was used to annotate all 12
key genes. A preliminary understanding of the association between
key genes was also provided by the String website (http://string-db.org). The term ‘lung adenocarcinoma’
and organism ‘Homosapiens’ were used to search and obtain clinical
data of 221 patients from TCGA. Furthermore, the data was analyzed
by single factor Cox regression analysis, setting the minimum time
0.1 and the maximum time as 10, and the year as the time unit. From
the results of the Cox regression analysis, the Kaplan-Meier curves
were plotted and patients were organized into either high or low
risk.
Results
GSEA analysis
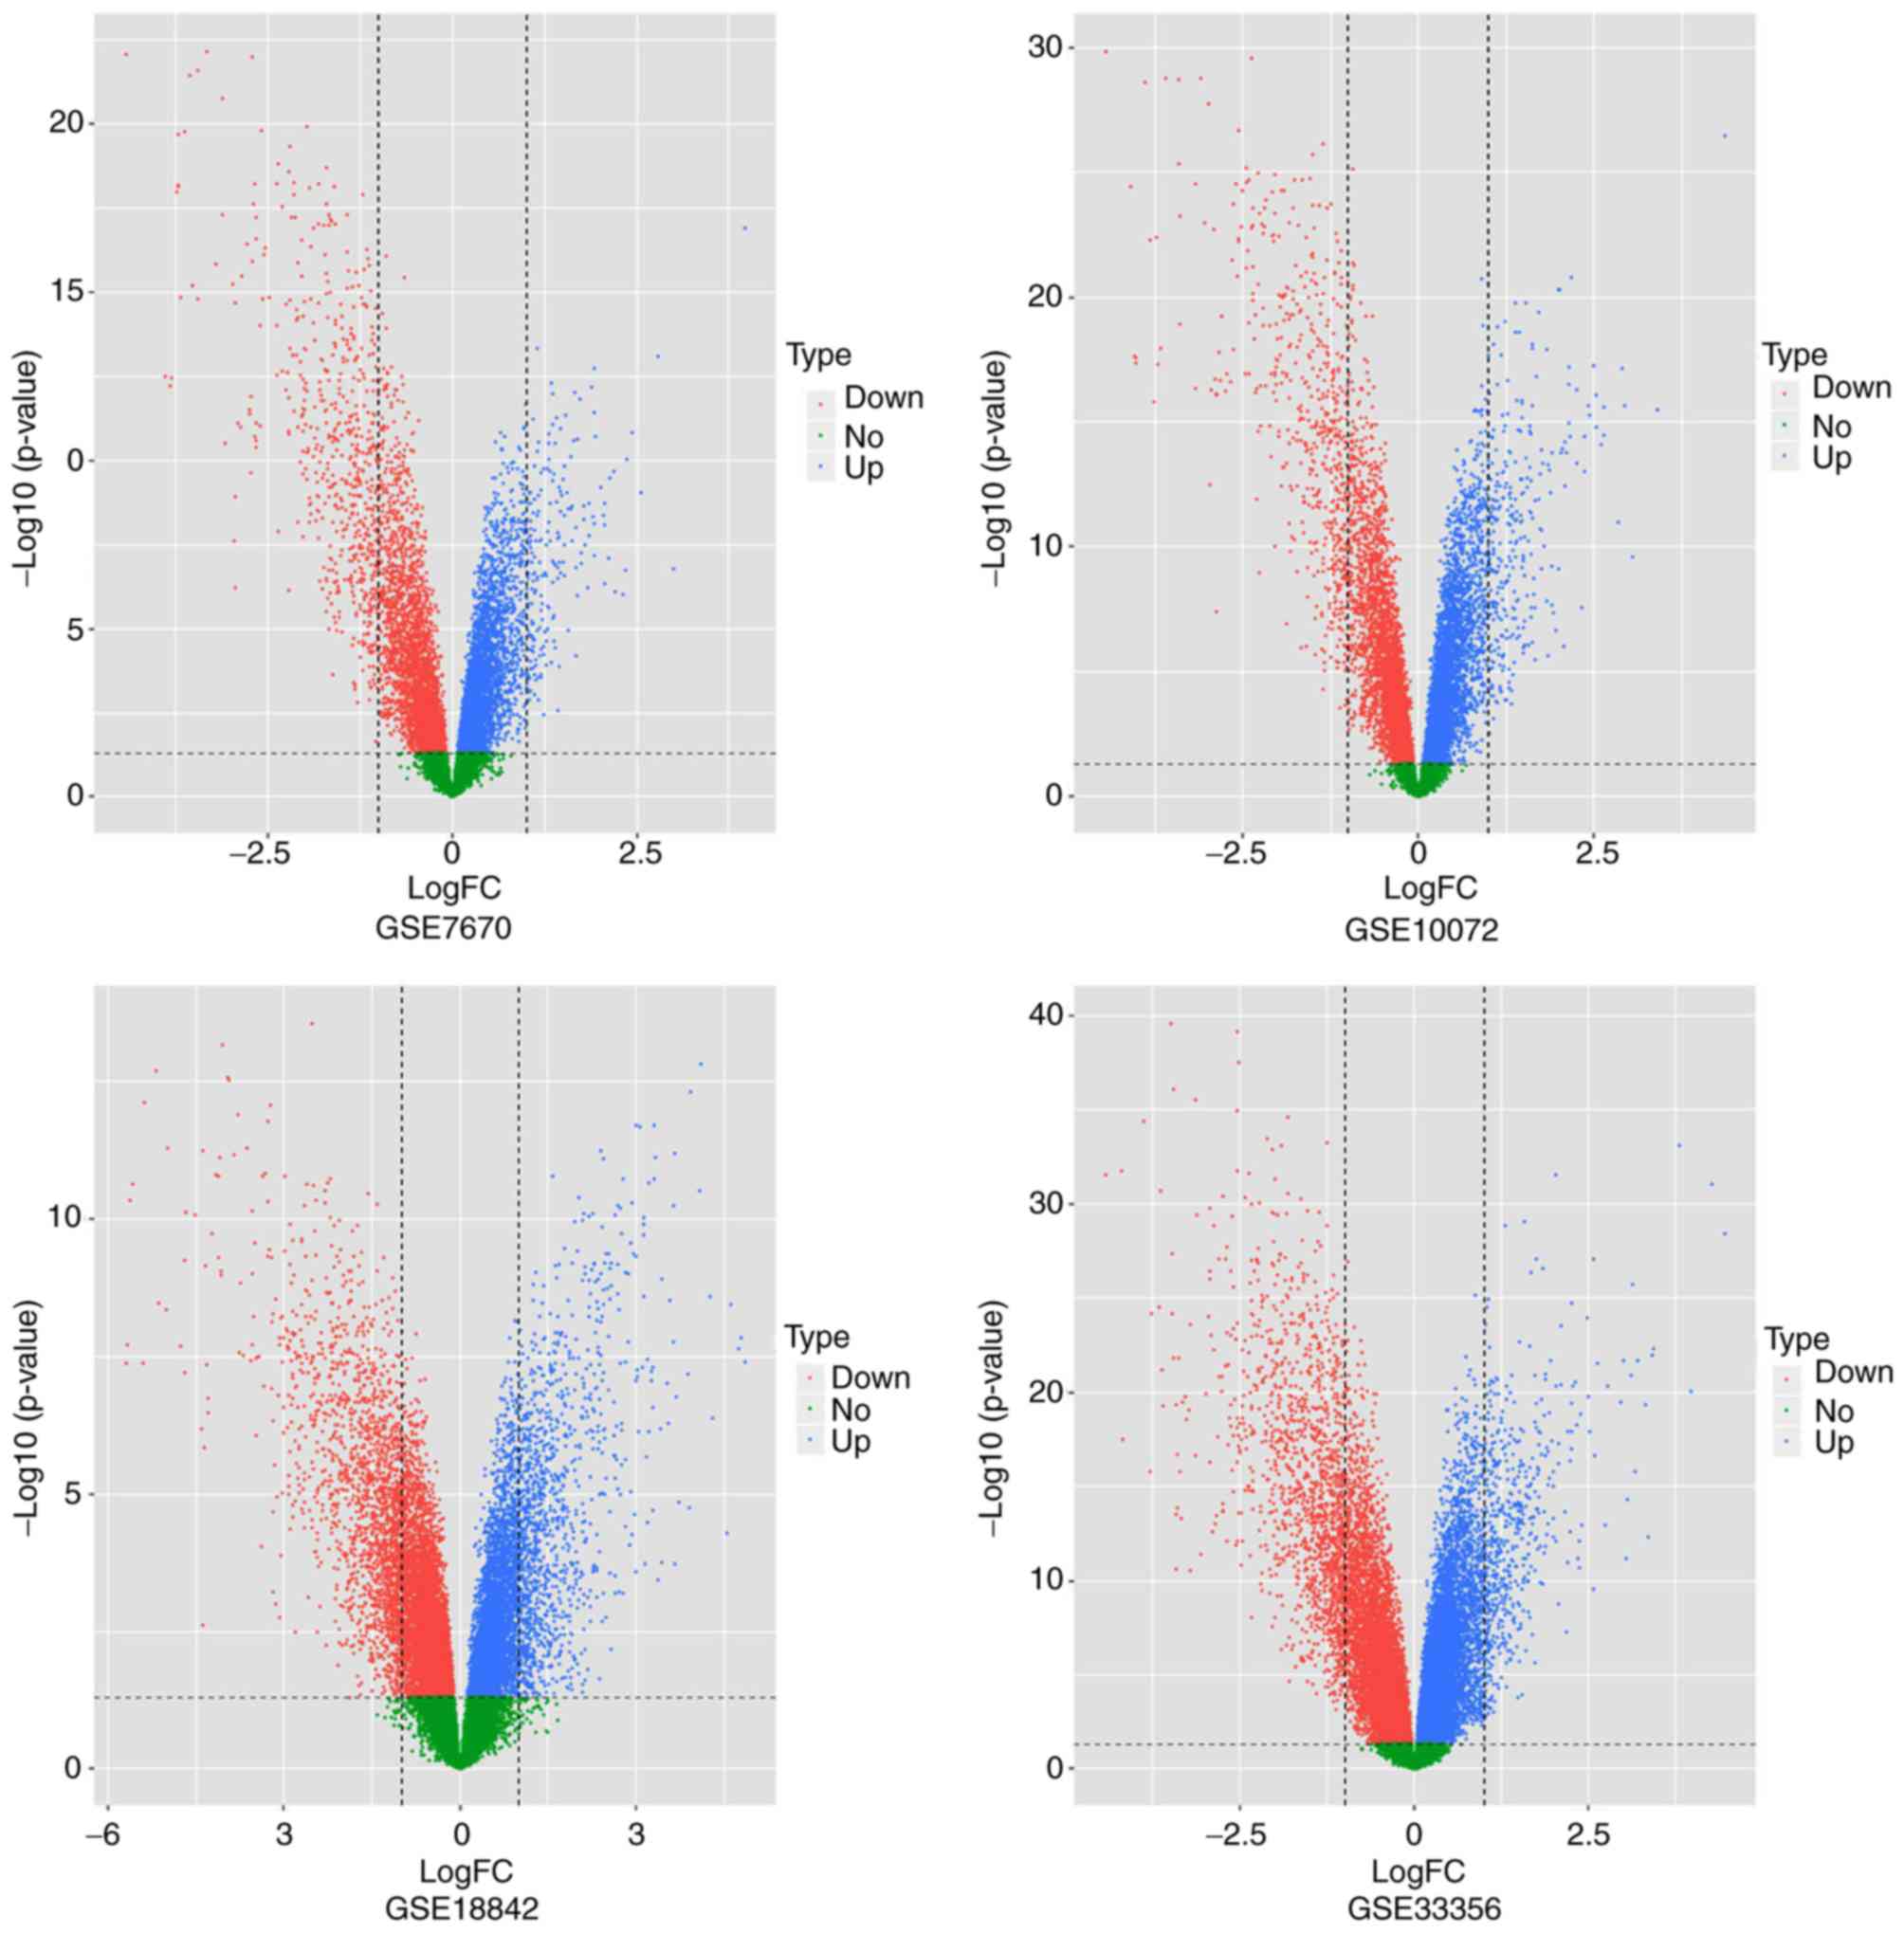
Based on the criteria mentioned above, six datasets
were obtained of which four were retained containing 132 lung
adenocarcinomas and 132 normal tissues. The GSEA method was
performed independently on the four datasets, and common pathways
and differentially expressed genes were screened out from the four
datasets. Detailed information on the analysis results is presented
in Table I. A volcano plot (Fig. 1) was used to initially screen the
genes in a crude manner. Genes present outside of the two vertical
lines were considered to be the differentially expressed genes of
each database. The distance a gene was from the vertical line
indicated the degree of difference in expression of that gene.
Meta-analysis
Meta-analysis is a tool that can help obtain
significantly differentially expressed genes from GSEA analysis
(15). The SAS was used to calculate
the P-value for each gene. In addition, the gene probe platform was
downloaded from the GEO database so that the gene probe number
could be translated into the gene name, and the gene names were
entered into SAS version 9.42 software for total analysis. A total
of 610 significant differentially expressed genes were obtained
(data not shown). The common pathways, including 78 upregulated and
20 downregulated pathways, were also identified. The names of the
common pathways are listed in Table
II.
| Table II.Details of the upregulated (n=78) and
downregulated (n=20) common crucial pathways. |
Table II.
Details of the upregulated (n=78) and
downregulated (n=20) common crucial pathways.
| Regulation | Pathway |
|---|
| Downregulated | ‘N-Glycan
biosynthesis’, ‘mismatch repair’, ‘cellular tumor antigen p53
signaling pathway’, ‘amino sugar and nucleotide sugar metabolism’,
‘aminoacyl-transferRNA biosynthesis’, ‘pyrimidine metabolism’,
‘drug metabolism-other enzymes’, ‘ribosome biogenesis in
eukaryotes’, ‘RNA transport’, ‘glycosphingolipid biosynthesis-lacto
and neolacto series’, ‘base excision repair’, ‘cell cycle’,
‘protein export’, ‘alanine’, ‘aspartate and glutamate metabolism’,
‘proteasome’, ‘fructose and mannose metabolism’, ‘pentose phosphate
pathway’, ‘DNA replication’, ‘Parkinson's disease’, ‘homologous
recombination’ |
| Upregulated | ‘Type I diabetes
mellitus’, ‘vascular smooth muscle contraction’, ‘gap junction’,
‘leukocyte transendothelial migration’, ‘leukocyte transendothelial
migration’, ‘janus kinase-signal transducer and activator of
transcription signaling pathway’, ‘osteoclast differentiation’,
‘ATP-binding cassette transporters’, ‘mitogen-activated protein
kinase signaling pathway’, ‘basal cell carcinoma’, ‘viral
myocarditis’, ‘metabolism of xenobiotics by cytochrome P450’,
‘tryptophan metabolism’, ‘B cell receptor signaling pathway’,
‘hypertrophic cardiomyopathy’, ‘drug metabolism-cytochrome P450’,
‘fatty acid degradation’, ‘neuroactive ligand-receptor
interaction’, ‘regulation of actin cytoskeleton’, ‘dorso-ventral
axis formation’, ‘neurotrophin signaling pathway’, ‘salivary
secretion’, ‘hematopoietic cell lineage’, ‘prion diseases’, ‘cell
adhesion molecules’, ‘inositol phosphate metabolism’, ‘peroxisome
proliferator-activated receptor signaling pathway’, ‘intestinal
immune network for IgA production’, ‘carbohydrate digestion and
absorption’, ‘phagosome’, ‘chronic myeloid leukemia’, ‘long-term
potentiation’, ‘natural killer cell mediated cytotoxicity’,
‘aldosterone-regulated sodium reabsorption’, ‘tight junction’,
‘phosphatidylinositol signaling system’, ‘acute myeloid leukemia’,
‘African trypanosomiasis’, ‘bile secretion’, ‘calcium signaling
pathway’, ‘adipocytokine signaling pathway’, ‘allograft rejection’,
‘type II diabetes mellitus’, ‘progonadoliberin-1 signaling
pathway’, ‘vascular endothelial growth factor signaling pathway’,
‘complement and coagulation cascades’, ‘graft-vs.-host disease’,
‘melanogenesis’, ‘rheumatoid arthritis’, ‘malaria’, ‘T cell
receptor signaling pathway’, ‘Fcε RI signaling pathway’,
‘autoimmune thyroid disease’, ‘gastric acid secretion’,
‘arachidonic acid metabolism’, ‘cytokine-cytokine receptor
interaction’, ‘soluble vesicle-fusing ATPase attachment protein
receptor interactions in vesicular transport’, ‘insulin signaling
pathway’, ‘proximal tubule bicarbonate reclamation’,
‘vasopressin-regulated water reabsorption’, ‘long-term depression’,
‘toxoplasmosis’, ‘asthma’, ‘transforming growth factor-β signaling
pathway’, ‘Fcγ R-mediated phagocytosis’, ‘dilated cardiomyopathy’,
‘histidine metabolism’, ‘epithelial cell signaling in
Helicobacter pylori infection’, ‘pancreatic secretion’,
‘endocytosis’, ‘nucleotide-binding oligomerization domain-like
receptor signaling pathway’, ‘cytosolic DNA-sensing pathway’,
‘chemokine signaling pathway’, ‘wingless/integrated signaling
pathway’, ‘hedgehog signaling pathway’, ‘chagas disease (American
trypanosomiasis)’, ‘apoptosis’, ‘leishmaniasis’, ‘Staphylococcus
aureus infection’ |
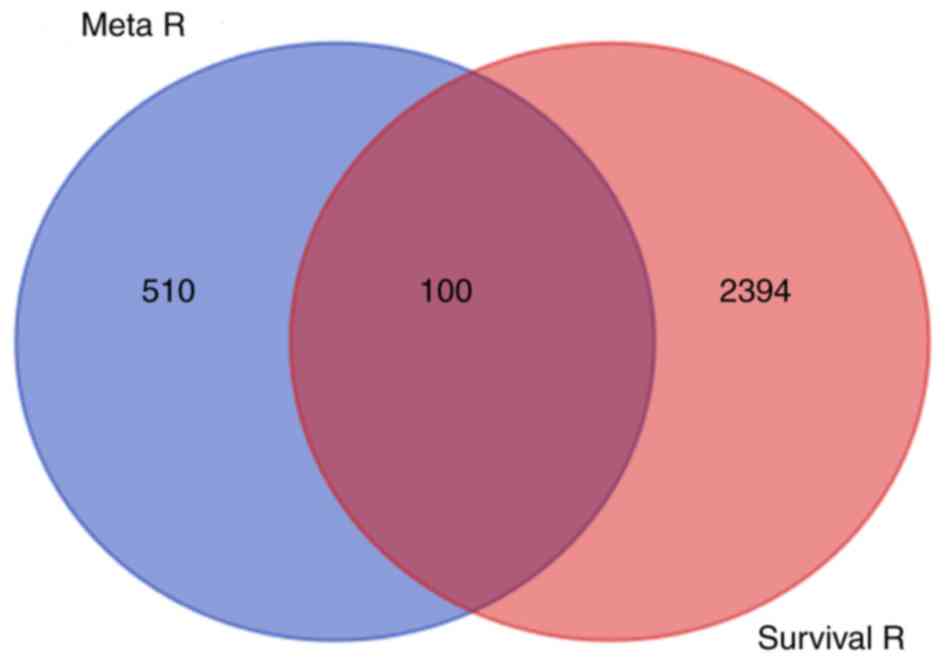
TCGA database
The clinical data and expression profiles of lung
adenocarcinoma in TCGA database were downloaded. Cox regression
analysis was used, and P′-value (P-value in TCGA) was adjusted to
<0.05. A total of 2,494 significant differentially expressed
genes were obtained. Subsequently, 610 differentially expressed
genes from the meta-analysis were matched with the 2,494 genes from
TCGA by the Venn method (Fig. 2);
100 common genes exhibited statistically significant differences in
expression and were considered to affect survival prognosis. The
names, P′-value and P-value of the 100 common genes are presented
in Table III.
| Table III.Common crucial genes significantly
differentially expressed in the meta-analysis and in The Cancer
Genome Atlas database. |
Table III.
Common crucial genes significantly
differentially expressed in the meta-analysis and in The Cancer
Genome Atlas database.
| Gene name | P-value | P′-value |
|---|
| ARRB2 |
2.58×10⁻⁶ |
1.51×10⁻³ |
| IL6R |
4.99×10⁻⁴ |
7.62×10⁻³ |
| HPGDS |
3.90×10⁻⁴ |
3.54×10⁻² |
| NR3C2 |
1.09×10⁻⁴ |
4.38×10⁻² |
| ALG8 |
5.36×10⁻¹³ |
4.62×10⁻² |
| ACSL4 |
8.73×10⁻³ |
1.85×10⁻² |
| BDNF |
1.69×10⁻¹² |
1.12×10⁻⁴ |
| ADRB2 |
<1.00×10⁻¹⁶ |
4.52×10⁻² |
| FGF2 |
1.22×10⁻¹⁵ |
7.90×10⁻⁴ |
| MCM6 |
7.92×10⁻⁸ |
3.87×10⁻² |
| NCF4 |
6.27×10⁻³ |
3.67×10⁻² |
| AURKA |
3.05×10⁻¹² |
1.28×10⁻² |
| IL20RA |
6.67×10⁻⁴ |
2.64×10⁻² |
| TACC3 |
9.2×10⁻⁸ |
1.12×10⁻² |
| COL4A6 |
1.06×10⁻³ |
4.05×10⁻³ |
| KAT2B |
5.24×10⁻¹² |
4.19×10⁻² |
| SEMA3A |
2.88×10⁻² |
2.11×10⁻³ |
| SGCG |
<1.00×10⁻¹⁶ |
2.94×10⁻² |
| ELOVL6 |
3.63×10⁻² |
1.60×10⁻³ |
| ABLIM3 |
6.65×10⁻¹⁴ |
1.04×10⁻³ |
| GALNT3 |
1.78×10⁻⁵ |
1.24×10⁻³ |
| HK3 |
6.49×10⁻¹⁰ |
3.88×10⁻² |
| PSMD12 |
1.48×10⁻³ |
1.64×10⁻² |
| FMO3 |
1.87×10⁻⁶ |
6.75×10⁻³ |
| LCP2 |
7.39×10⁻⁴ |
1.88×10⁻² |
| HYAL1 |
1.44×10⁻¹³ |
2.49×10⁻³ |
| PPARG |
1.56×10⁻¹⁰ |
2.01×10⁻² |
| BUB1 |
1.86×10⁻¹¹ |
4.65×10⁻² |
| BUB1B |
1.55×10⁻¹³ |
2.55×10⁻² |
| F12 |
1.47×10⁻⁸ |
2.13×10⁻² |
| COL4A5 |
9.88×10⁻⁵ |
3.38×10⁻³ |
| MAD2L1 |
1.14×10⁻¹⁰ |
1.02×10⁻² |
| TYMS |
1.45×10⁻¹⁴ |
7.92×10⁻⁴ |
| CSGALNACT1 |
8.60×10⁻⁵ |
6.00×10⁻⁴ |
| IL10RA |
1.27×10⁻⁴ |
4.15×10⁻² |
| CDC25A |
4.83×10⁻⁶ |
5.68×10⁻³ |
| CKS1B |
8.27×10⁻¹⁰ |
3.26×10⁻² |
| P2RY13 |
5.11×10⁻⁷ |
1.14×10⁻³ |
| CDKN1C |
5.84×10⁻¹² |
3.24×10⁻² |
| YKT6 |
1.80×10⁻⁷ |
3.08×10⁻² |
| FGR |
<1.00×10⁻¹⁶ |
4.18×10⁻² |
| BTK |
5.23×10⁻⁶ |
2.36×10⁻³ |
| GTSE1 |
4.07×10⁻⁹ |
8.18×10⁻³ |
| TLR7 |
1.76×10⁻² |
9.61×10⁻⁴ |
| PRKCH |
1.32×10⁻¹⁴ |
1.56×10⁻² |
| CHPT1 |
3.34×10⁻⁷ |
3.64×10⁻² |
| LEF1 |
1.43×10⁻³ |
3.32×10⁻² |
| P4HA2 |
2.48×10⁻² |
2.71×10⁻² |
| PPAT |
1.12×10⁻⁸ |
2.57×10⁻² |
| VIPR1 |
<1.00×10⁻¹⁶ |
1.61×10⁻² |
| SLK |
8.67×10⁻¹² |
1.86×10⁻² |
| HCK |
1.40×10⁻⁹ |
1.48×10⁻² |
| GPD1L |
5.28×10⁻⁴ |
6.20×10⁻⁴ |
| ARHGEF4 |
2.27×10⁻⁷ |
4.02×10⁻³ |
| GSTM5 |
4.37×10⁻¹³ |
1.74×10⁻² |
| CD4 |
9.53×10⁻³ |
2.11×10⁻² |
| AOC3 |
<1.00×10⁻¹⁶ |
2.02×10⁻² |
| FUT1 |
2.48×10⁻⁹ |
4.87×10⁻² |
| VCL |
2.84×10⁻³ |
3.22×10⁻² |
| TTK |
3.15×10⁻¹¹ |
3.84×10⁻² |
| BIRC5 |
2.20×10⁻¹⁴ |
1.78×10⁻² |
| ASAP2 |
2.56×10⁻² |
1.16×10⁻³ |
| VPS37B |
4.54×10⁻⁴ |
2.07×10⁻² |
| CDC45 |
7.5×10⁻¹⁰ |
2.05×10⁻² |
| CX3CR1 |
1.58×10⁻⁷ |
6.33×10⁻³ |
| DOCK2 |
8.47×10⁻⁶ |
2.69×10⁻² |
| OAS3 |
1.31×10⁻² |
1.06×10⁻² |
| UBE2S |
4.02×10⁻⁴ |
2.89×10⁻³ |
| ALG3 |
2.76×10⁻¹¹ |
3.51×10⁻² |
| ADCY9 |
4.62×10⁻⁶ |
7.66×10⁻³ |
| F2RL1 |
1.48×10⁻⁹ |
1.82×10⁻³ |
| POLD2 |
3.77×10⁻⁸ |
4.31×10⁻² |
| PTTG1 |
1.2×10⁻¹¹ |
6.39×10⁻³ |
| STIP1 |
1.68×10⁻³ |
2.46×10⁻² |
| FZD4 |
<1.00×10⁻¹⁶ |
1.01×10⁻² |
| DPYSL2 |
3.77×10⁻¹⁵ |
1.52×10⁻² |
| BLM |
1.16×10⁻³ |
1.54×10⁻² |
| ATP6V1B2 |
1.85×10⁻³ |
1.03×10⁻² |
| ARHGEF6 |
9.99×10⁻¹⁵ |
5.74×10⁻³ |
| CSF2RB |
6.37×10⁻⁷ |
3.03×10⁻² |
| NUP37 |
1.58×10⁻³ |
2.57×10⁻² |
| MTHFD1 |
4.28×10⁻⁵ |
6.66×10⁻³ |
| P2RY14 |
2.22×10⁻¹⁶ |
1.78×10⁻² |
| MCM4 |
8.75×10⁻¹² |
7.57×10⁻³ |
| WDR3 |
1.19×10⁻⁵ |
9.23×10⁻³ |
| CD33 |
3.15×10⁻³ |
7.13×10⁻³ |
| VEGFC |
1.35×10⁻³ |
1.0×10⁻² |
| ATP1A2 |
1.86×10⁻¹⁰ |
3.05×10⁻² |
| HMMR |
2.15×10⁻¹³ |
1.03×10⁻³ |
| C6 |
1.97×10⁻² |
4.86×10⁻² |
| PPP2R5A |
6.32×10⁻⁶ |
2.85×10⁻² |
| GRIA1 |
<1.00×10⁻¹⁶ |
1.89×10⁻² |
| HACD1 |
2.03×10⁻⁸ |
6.72×10⁻³ |
| PTPN6 |
3.57×10⁻⁴ |
8.81×10⁻³ |
| HGF |
1.02×10⁻⁵ |
1.49×10⁻² |
| PLK1 |
6.12×10⁻⁷ |
2.47×10⁻⁵ |
| DAPK2 |
5.99×10⁻¹³ |
2.27×10⁻² |
| TUBB6 |
1.03×10⁻⁸ |
3.66×10⁻⁴ |
| ADIPOR2 |
2.87×10⁻¹¹ |
5.48×10⁻⁴ |
| HCLS1 |
5.48×10⁻⁴ |
3.01×10⁻² |
Results of significant common pathways
and key genes
The official gene symbols of 100 crucial genes were
imported into the functional annotation tool of DAVID and five
crucial pathways were obtained by KEGG, which is a distinct pathway
analysis tool. A total of 78 upregulated and 20 downregulated
pathways were screened out by the Venn method among common pathways
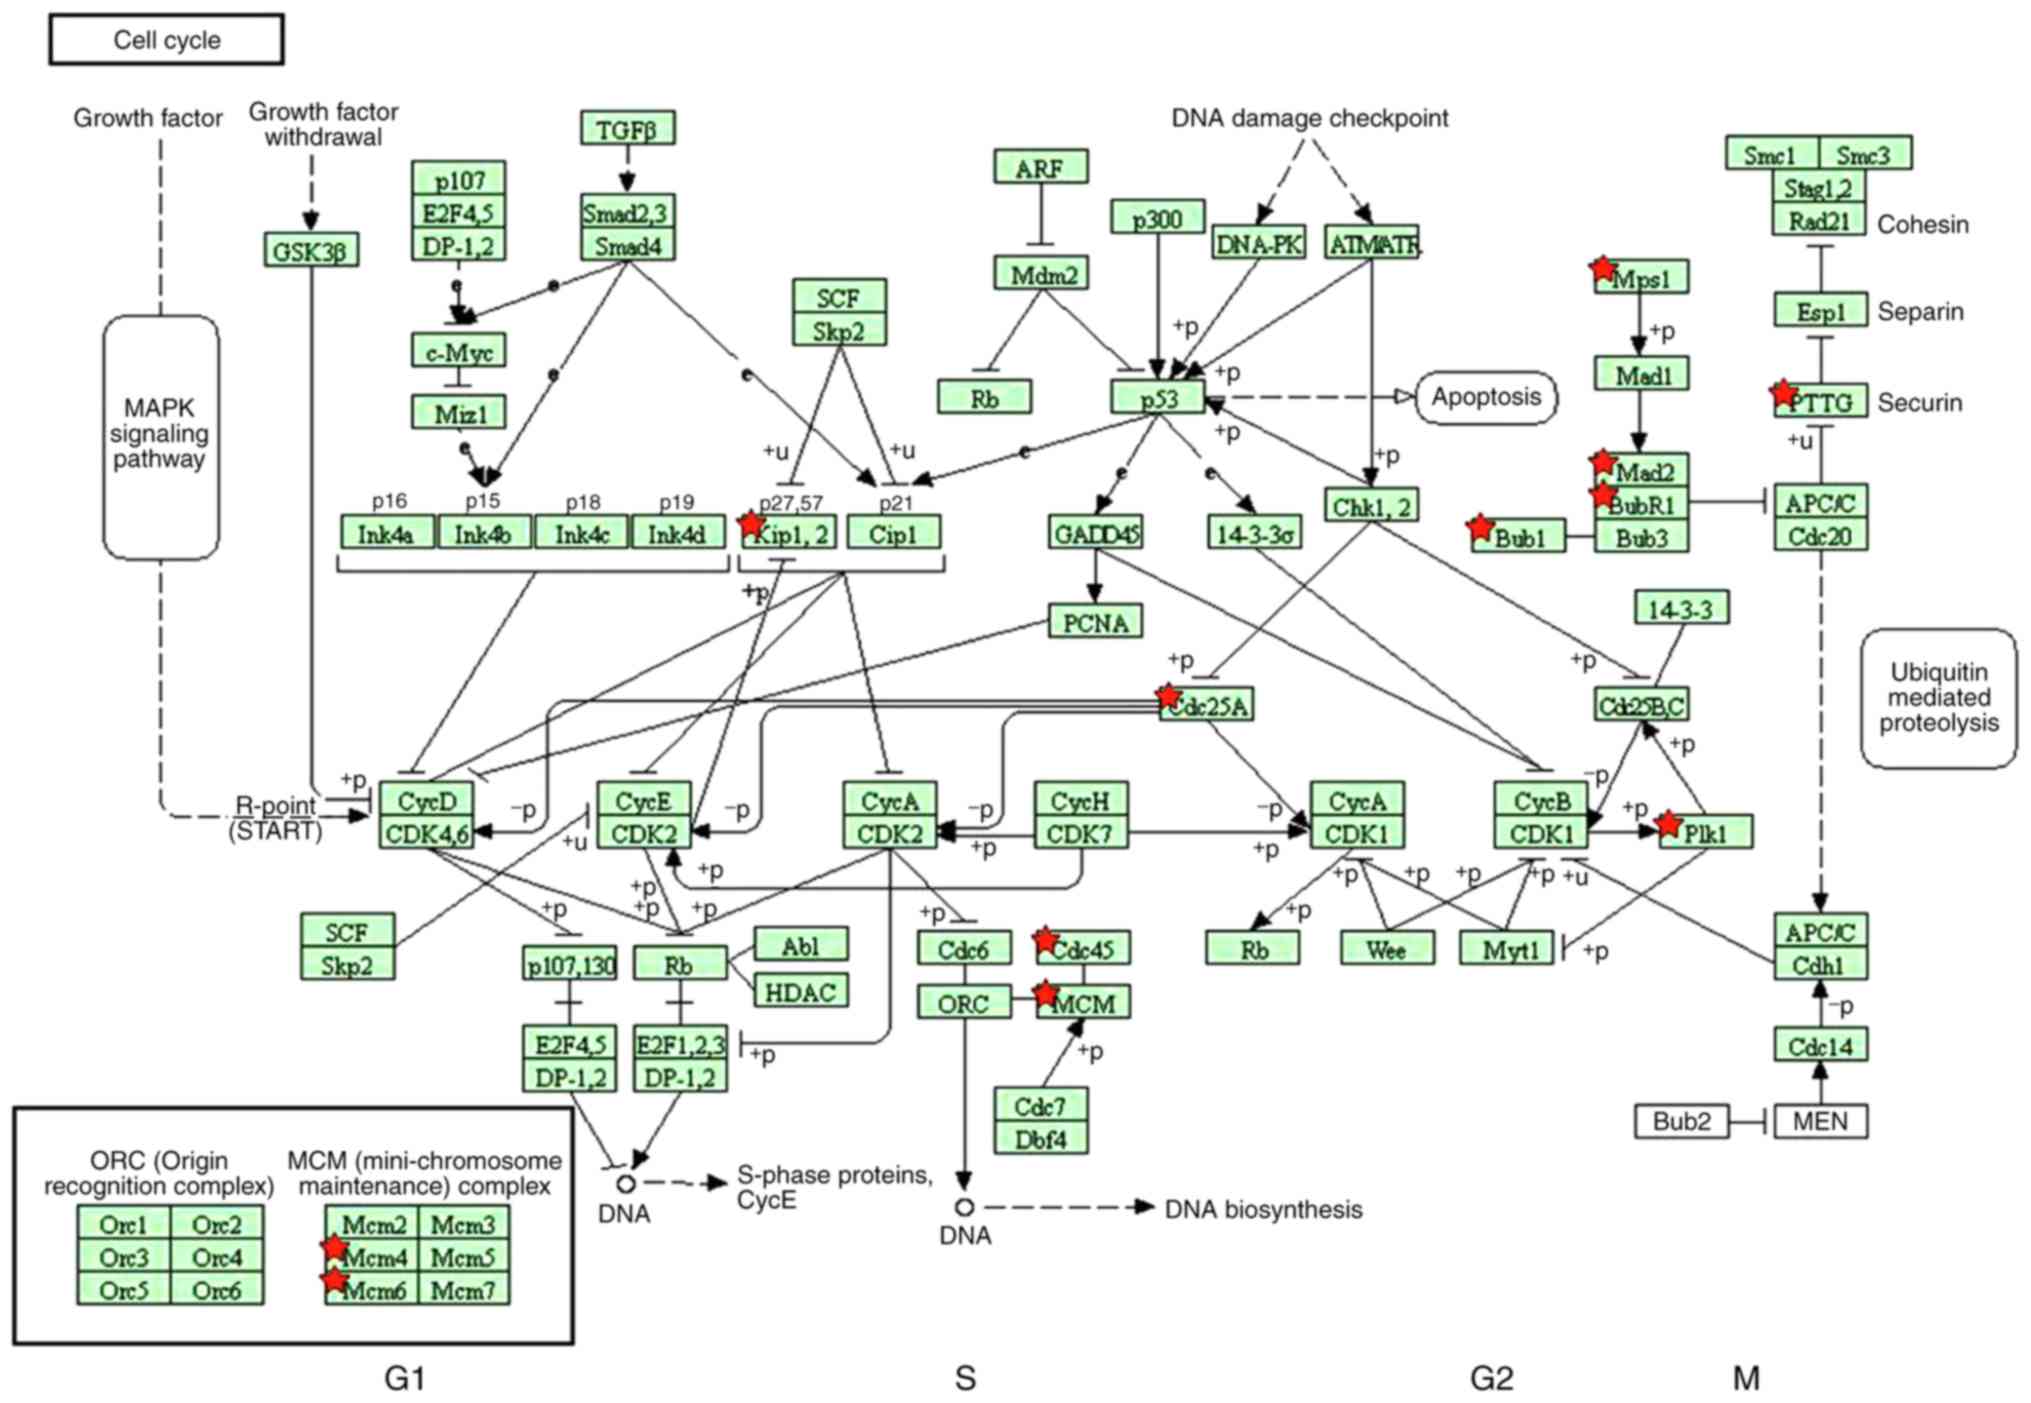
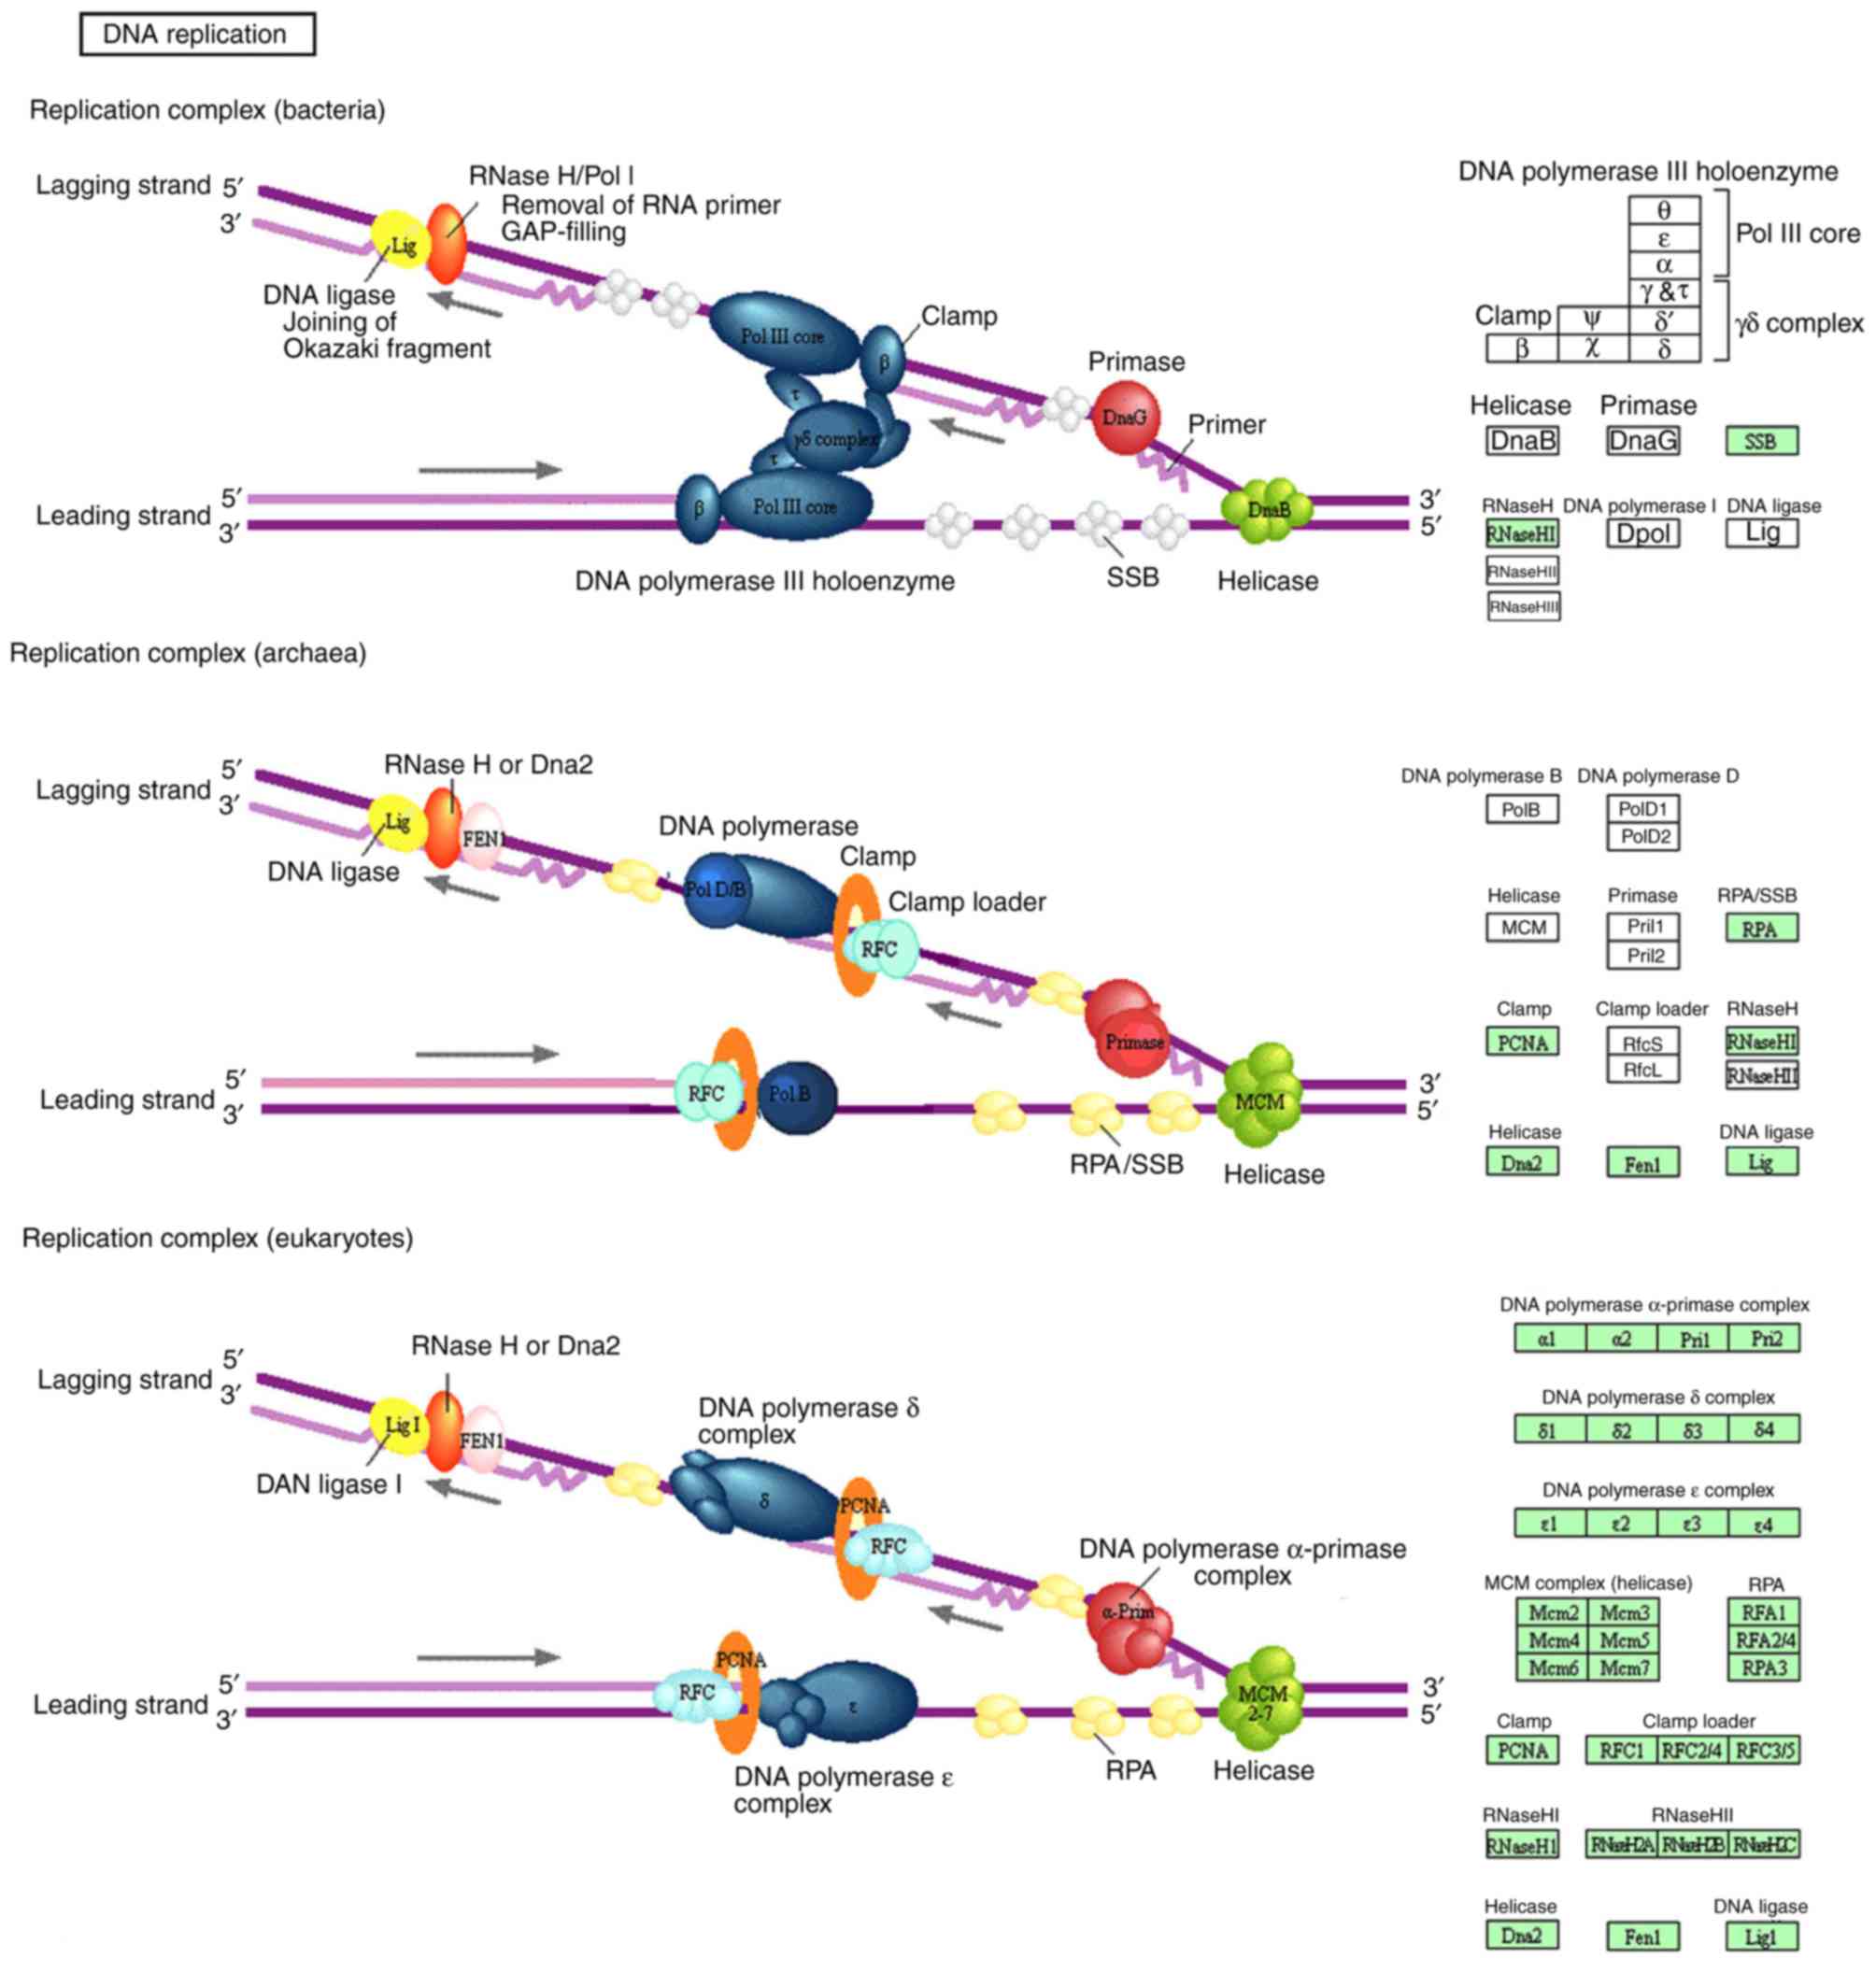
obtained from GSEA (Table II). A
total of five pathways were matched with 78 upregulated and 20
downregulated pathways by the Venn method, and two significant
pathways were identified: Cell cycle (Fig. 3) and DNA replication (Fig. 4). In addition, the genes from the
KEGG database were also identified to serve crucial roles in two
significant common pathways, presented in Figs. 3 and 4. According to the two significant
pathways, 12 key genes were obtained [DNA polymerase δ subunit 2
(POLD2), DNA replication licensing factor MCM4, MCM6, mitotic
checkpoint serine/threonine-protein kinase BUB1 (BUB1), BUB1β,
mitotic spindle assembly checkpoint protein MAD2A (MAD2L1), dual
specificity protein kinase TTK, M-phase inducer phosphatase 1
(CDC25A), cell division control protein 45 homolog (CDC45),
cyclin-dependent kinase inhibitor 1C (CDKN1C), pituitary
tumor-transforming gene 1 protein (PTTG1) and polo-like kinase 1
(PLK1)] from KEGG of DAVID. Subsequently, 12 key genes were mapped
in the String database to explore associations among them (Fig. 5), and MCM4 was identified to serve an
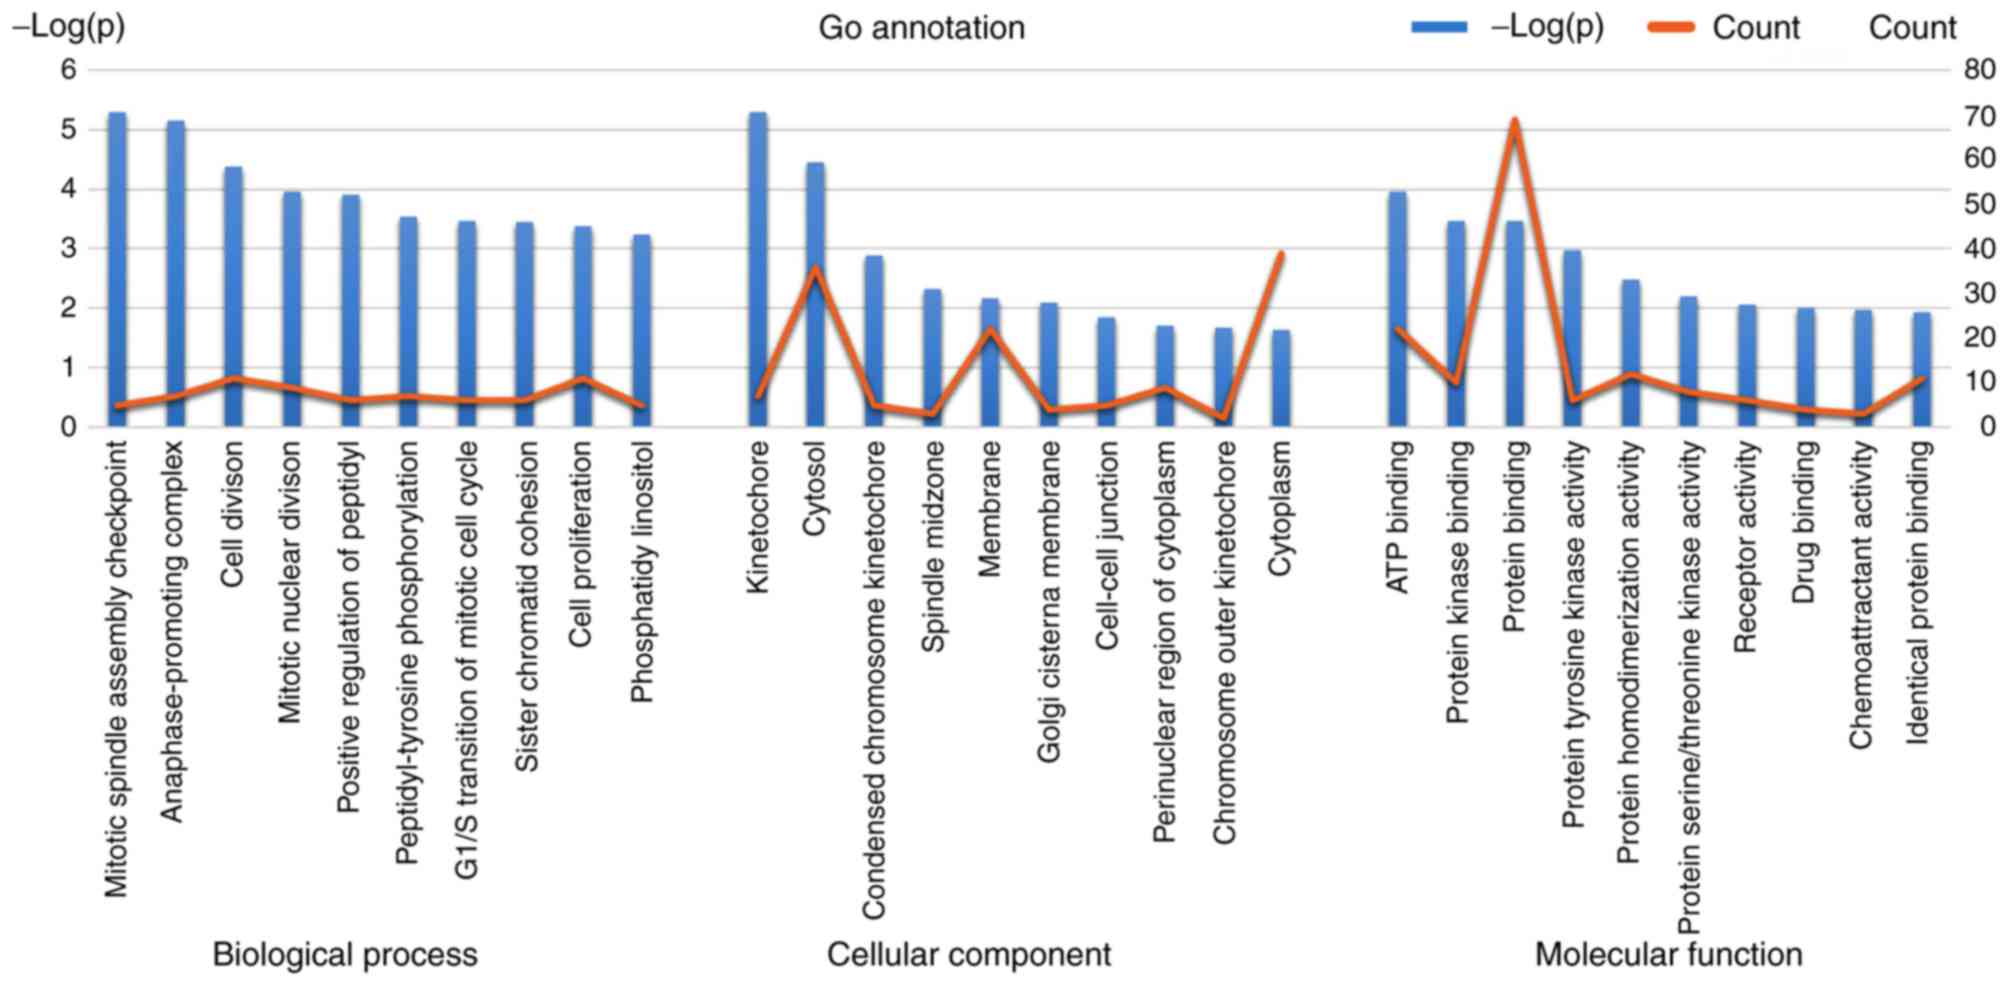
important role in their interactions. GO annotation was applied to
detect common pathways (Fig. 6) of
biological process, cellular components and molecular function.
Furthermore, the Kaplan-Meier curves (Fig. 7) of 12 key genes were obtained and
demonstrated that patients in the high-risk group had poorer
survival when compared with patients in the low-risk group.
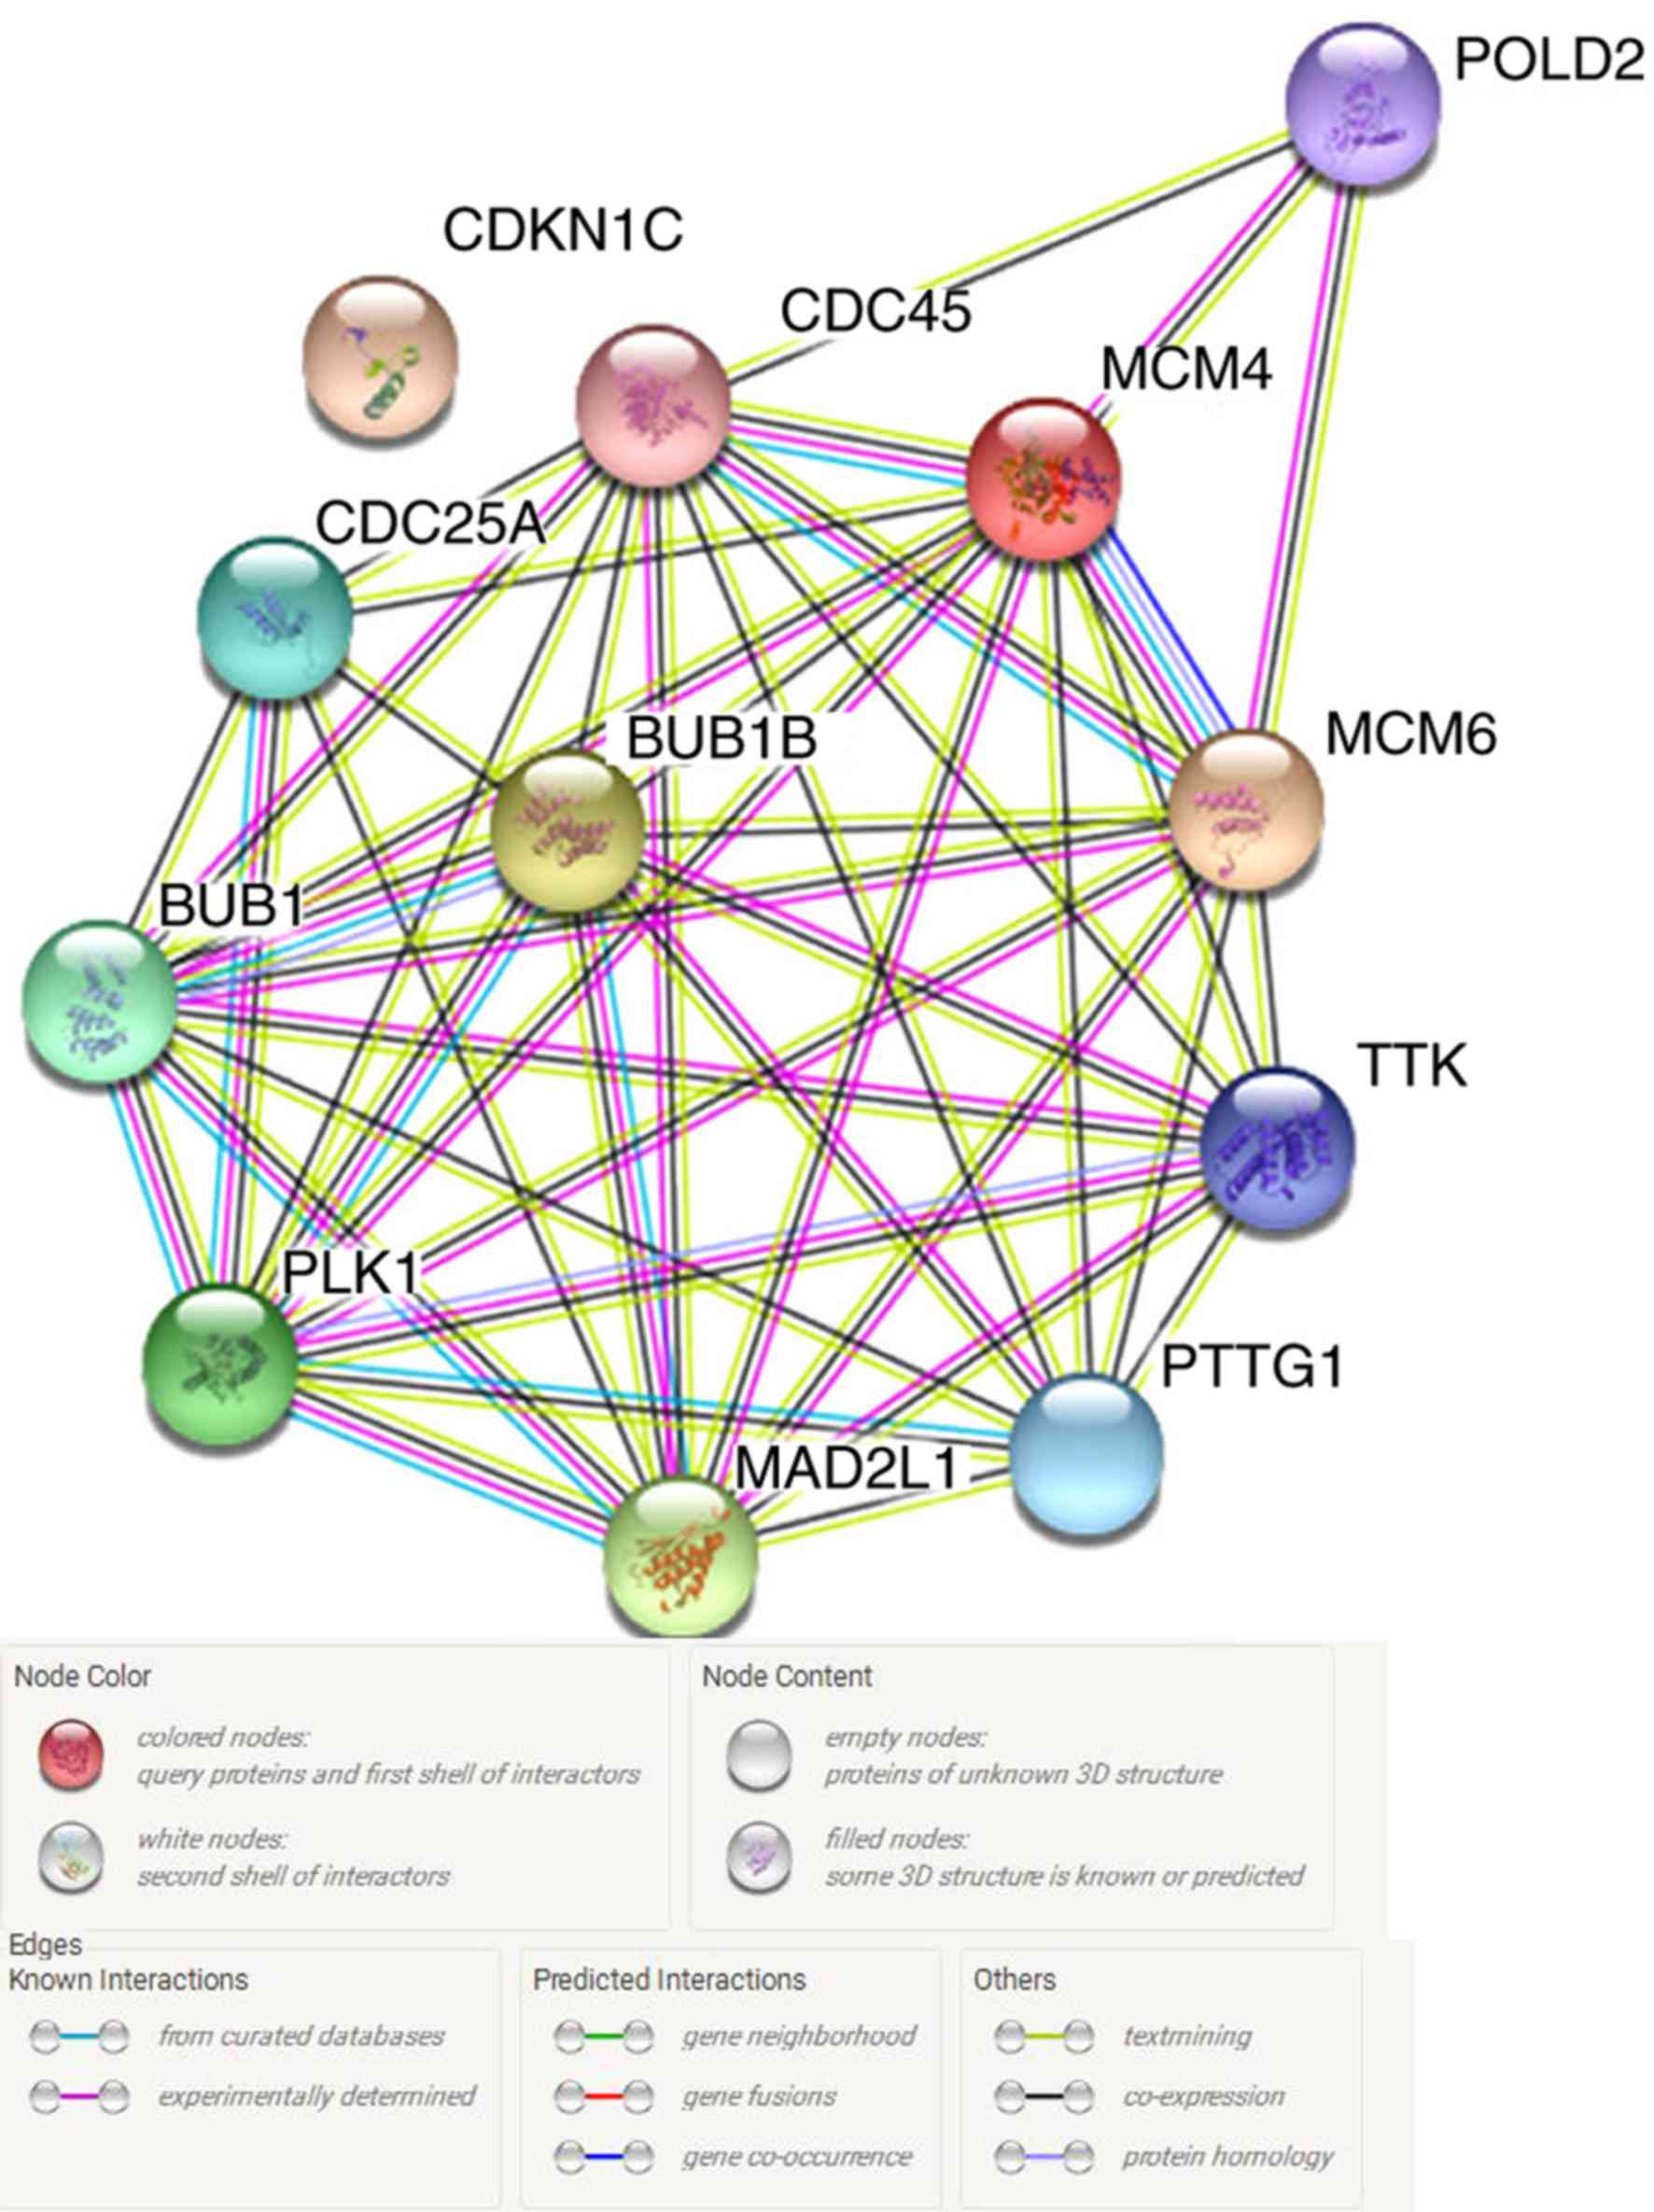 | Figure 5.A gene network of the 12 key genes
identified from the String database. POLD2, DNA polymerase δ
subunit 2; MCM, DNA replication licensing factor MCM; BUB1, mitotic
checkpoint serine/threonine-protein kinase BUB1; MAD2L1, mitotic
spindle assembly checkpoint protein MAD2A; TTK, dual specificity
protein kinase TTK; CDC25A, M-phase inducer phosphatase 1; CDC45,
cell division control protein 45 homolog, CDKN1C, cyclin-dependent
kinase inhibitor 1C; PTTG1, pituitary tumor-transforming gene 1
protein; PLK1, polo-like kinase 1. Nodes, network nodes represent
proteins. Splice isoforms or post-translational modifications are
collapsed, i.e., each node represents all protein-coding gene loci;
edges, edges represent protein-protein associations, associations
are meant to be specific and meaningful, i.e., proteins jointly
contribute to a shared function although this does not necessarily
mean they are physically binding to each other. |
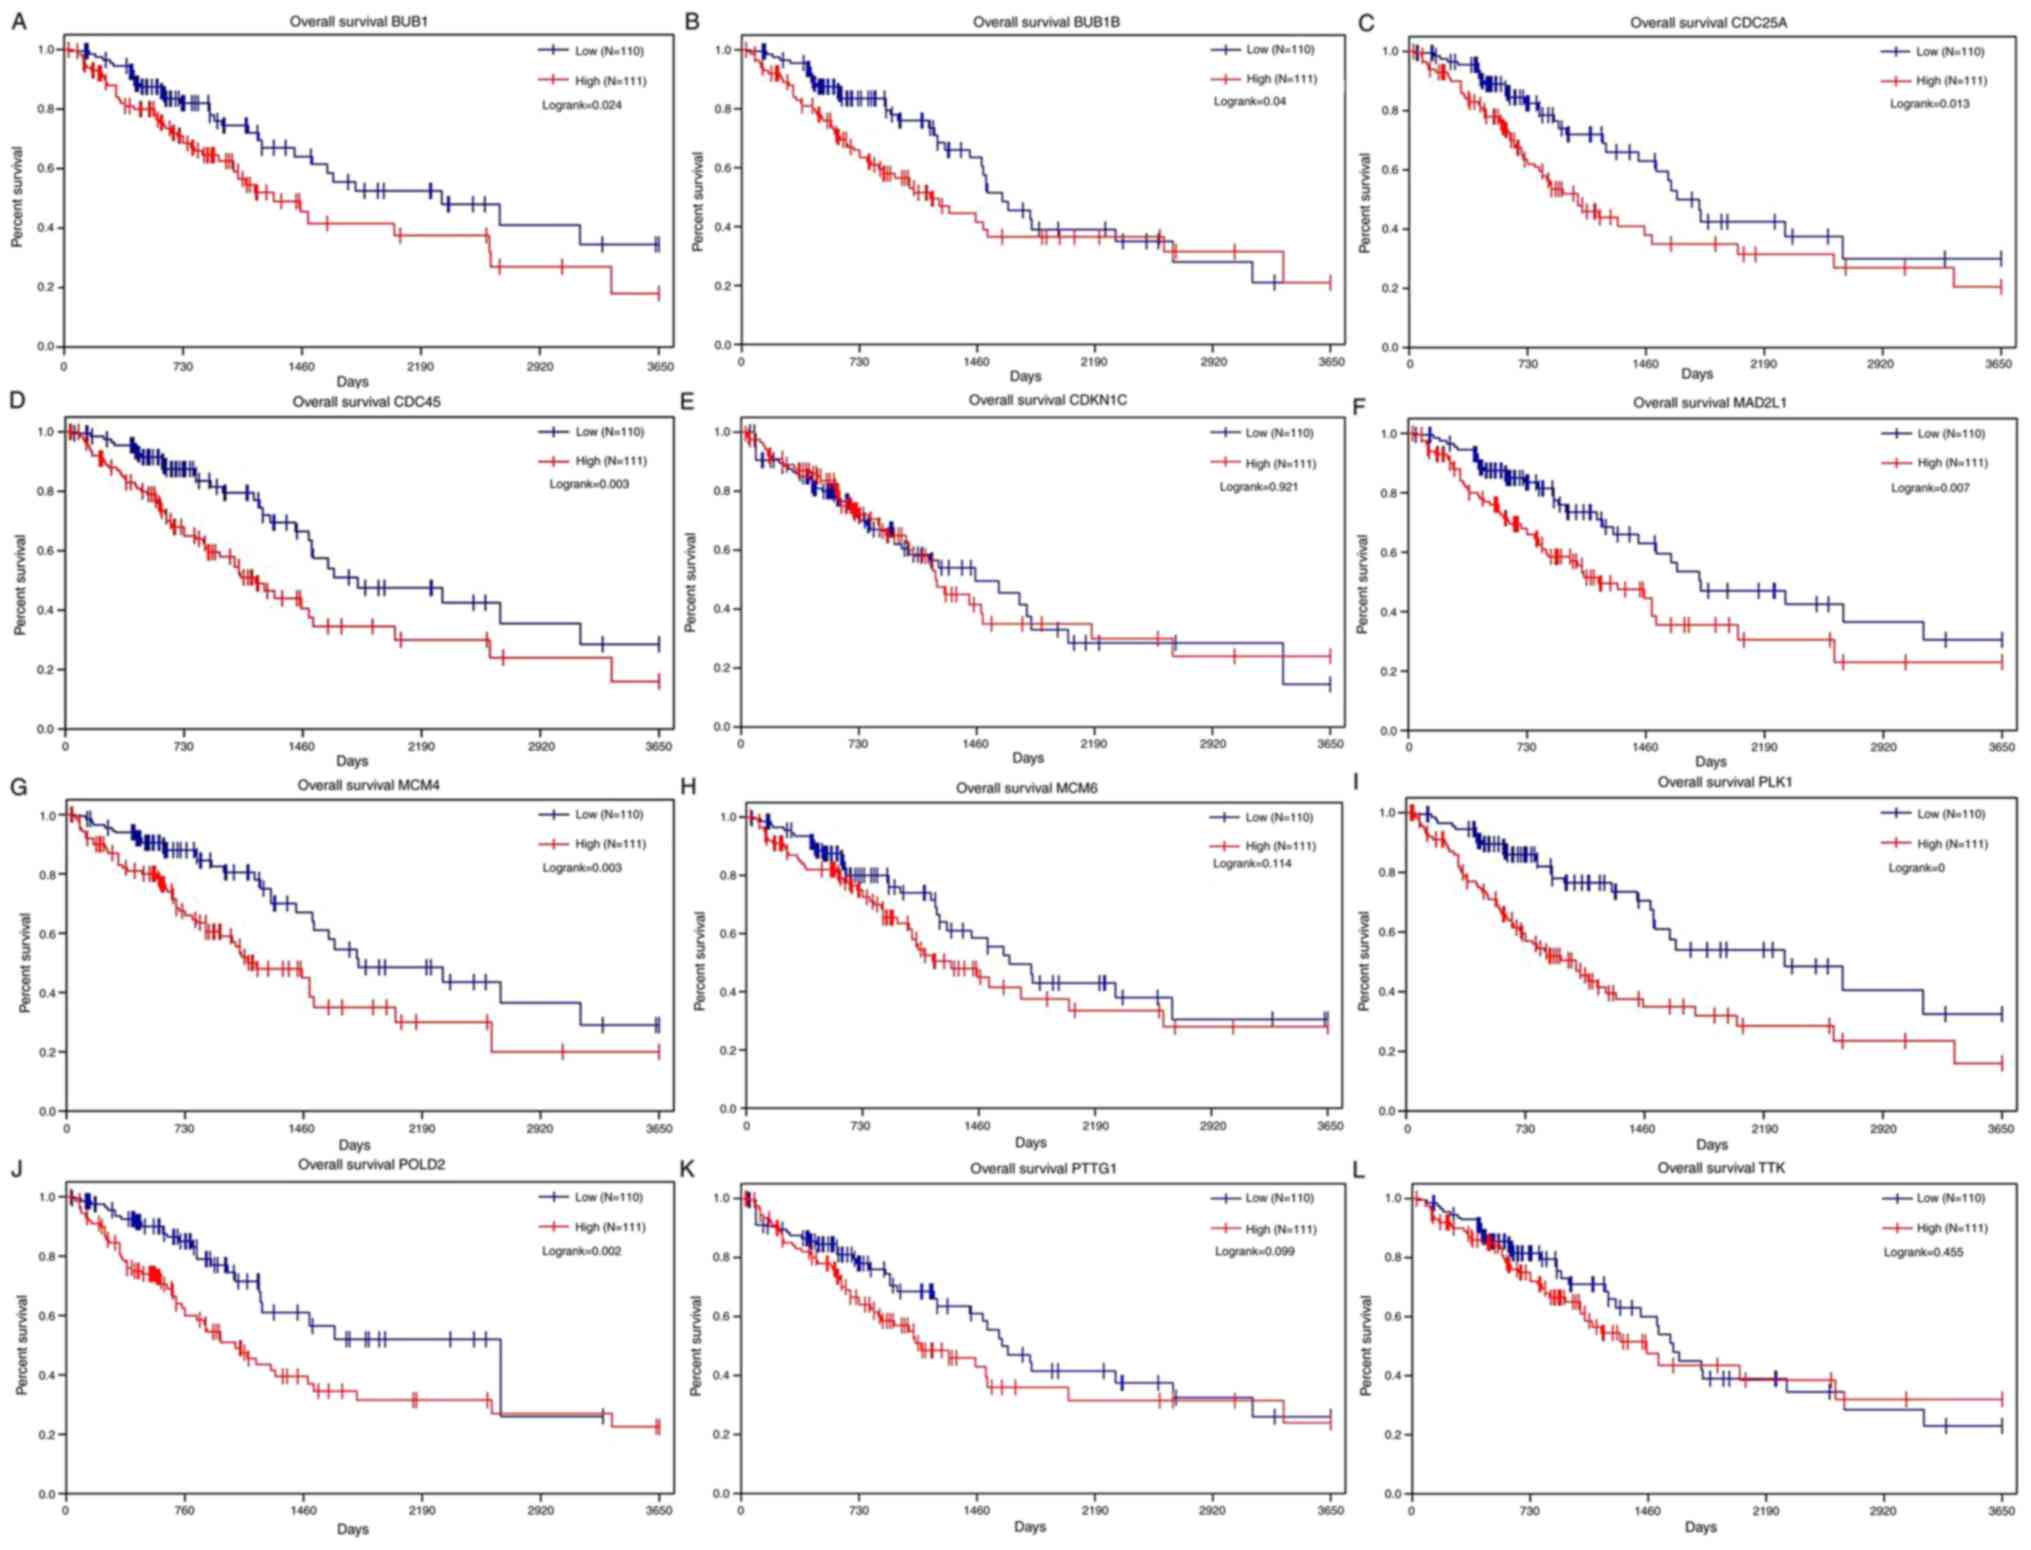 | Figure 7.Kaplan-Meier survival curves of the
12 key genes identified from the String database. (A) An increase
in BUB1 expression was associated with a significant decrease in
overall survival. (B) An increase in BUB1B expression was
associated with a significant decrease in overall survival. (C) An
increase in CDC25A expression was associated with a notable
decrease in overall survival. (D) An increase in CDC45 expression
was associated with a significant decrease in overall survival. (E)
The increase in CDKN1C expression is related to the decrease in
overall survival rate. (F) An increase in MAD2L1 expression was
associated with a significant decrease in overall survival. (G) An
increase in MCM4 expression was associated with a notable decrease
in overall survival. (H) An increase in MCM6 expression was
associated with a decrease in overall survival. (I) An increase in
PLK1 expression was associated with a significant decrease in
overall survival. (J) An increase in POLD2 expression was
associated with a significant decrease in overall survival. (K) An
increase in PTTG1 expression was associated with a decrease in
overall survival. (L) An increase in TTK expression is related to
the decrease in overall survival rate. POLD2, DNA polymerase δ
subunit 2; MCM, DNA replication licensing factor MCM; BUB1, mitotic
checkpoint serine/threonine-protein kinase BUB1; MAD2L1, mitotic
spindle assembly checkpoint protein MAD2A; TTK, dual specificity
protein kinase TTK; CDC25A, M-phase inducer phosphatase 1; CDC45,
cell division control protein 45 homolog, CDKN1C, cyclin-dependent
kinase inhibitor 1C; PTTG1, pituitary tumor-transforming gene 1
protein; PLK1, polo-like kinase 1. |
Discussion
Although lung adenocarcinoma is the most common
primary lung neoplasm (16), its
causes and underlying molecular mechanisms have not been fully
elucidated (17). Previous studies
primarily focused on a single factor that may lead to the
development of lung adenocarcinoma (18,19);
however, a single theory cannot provide a detailed explanation for
all the different cases of lung adenocarcinoma. Global analysis,
which includes metabolome, transcriptome, proteome and genome,
collectively referred to as ‘omics’ after the completion of the
Human Genome Project (20), enabled
the description of the genome-wide molecular mechanisms of lung
adenocarcinoma and revealed disease-specific molecular markers and
biomarkers for its diagnosis, classification and prognosis
(21). Furthermore, microarray
technology serves an important role in numerous studies based on
genomics and post-genomics (22). In
addition, microarray technology provides the basis for obtaining
significantly differentially expressed genes and crucial common
pathways.
A large number of genes are considered to be
associated with lung adenocarcinoma (23); however, it is difficult to determine
which genes are the most relevant. Previous studies have generally
investigated one gene or conducted only a single research method
(24–26). However, these studies may overlook
the key genes and crucial common pathways. In addition, there are
certain limitations regarding studies of a single gene chip
analysis. For example, it may not take into consideration
differences in expression levels among different samples, which may
cause various significant genes and key genes to go undetected
(27). Therefore, in the present
study, four groups of datasets containing samples of normal and
cancerous biological states were selected based on the GSEA method,
in order to avoid the deviation from the number of samples.
Analysis of these datasets is expected to more accurately identify
the significantly differentially expressed genes and common
pathways.
GSEA and meta-analysis were used simultaneously to
analyze four datasets in order to obtain the crucial genes and
significant common pathways in lung adenocarcinoma. The main
function of GSEA was to indicate differentially expressed genes
extracted from samples (number of samples ≥6). In addition, 610
significantly differentially expressed genes were obtained using
the R software and meta-analysis, and 78 upregulated and 20
downregulated pathways were identified by the Venn method. The
reasoning for selecting meta-analysis to identify the significantly
differentially expressed genes rather than overlap of samples were
as follows: Since the sample size was small, genes that were not
common to the four gene sets may have been overlooked, and a simple
comparison was additionally performed where a strict cut-off for
significance was not used, possibly introducing a statistical bias.
Therefore, meta-analysis was deemed to be an improved approach to
decrease deviations.
A total of 610 significantly differentially
expressed genes were matched with lung adenocarcinoma-associated
genes in the TCGA database and 100 crucial genes were obtained. To
identify genes closely associated with lung adenocarcinoma, the
common pathways of 100 genes were overlapped with 78 upregulated
and 20 downregulated pathways by the Venn method, and two crucial
pathways were filtered out: Cell cycle and DNA replication. In
addition, 12 key genes (POLD2, MCM4, MCM6, BUB1B, BUB1, MAD2L1,
TTK, CDC25A, CDC45, CDKN1C, PTTG1 and PLK1) were identified through
the KEGG pathway database when their roles in cell cycle and DNA
replication were examined. Blast2GO separated all key genes into
three groups: i) biological process; ii) cellular components; and
iii) molecular function. These genes may be closely associated with
tumor development, in which a proportion of the genes confer an
increased susceptibility to lung adenocarcinoma. Future experiments
are required to verify specific associations between these findings
and lung adenocarcinoma.
A number of studies demonstrated the function of key
genes identified in the present study and their impact on the
pathology of other diseases: Mutation of MCM4 may contribute to
skin cancer development by disturbing DNA replication (28), POLD2 is associated with the outcome
of ovarian carcinomas (29), BUB1B
may be a therapeutic target for glioblastoma (30), and the DNA-binding properties of
human CDC45 reveal its function as a molecular wedge for DNA
unwinding (31). In additional
studies on lung adenocarcinoma, MCM4 has been considered to affect
the tumorigenesis of lung adenocarcinoma (32), CDC45 was reported to be associated
with the diagnosis of lung adenocarcinoma (33) and TTK serves a role in the
development and survival of lung adenocarcinoma (34). However, the number of studies on the
effect of key genes affecting the pathology of lung adenocarcinoma
is limited. Furthermore, our results suggest that MCM4 and MCM6
affect cell cycle and DNA replication, while cell cycle and DNA
replication serve important roles in the pathogenesis of lung
adenocarcinoma. Therefore, MCM4 and MCM6 may serve a crucial role
in the diagnosis and treatment of lung adenocarcinoma. Studies of
the genes implicated, in the diagnosis and treatment of this type
of cancer are required.
In conclusion, the pathogenesis of lung
adenocarcinoma is complicated. The aim of the present study was to
provide insight into the underlying mechanisms by focusing on gene
sets or common pathways rather than on a single gene. In addition,
a number of consistent biological mechanisms involved in lung
adenocarcinoma were identified by GSEA and meta-analysis. Pathways
involved in cell cycle and DNA replication and 12 key genes (POLD2,
MCM4, MCM6, BUB1B, BUB1, MAD2L1, TTK, CDC25A, CDC45, CDKN1C, PTTG1
and PLK1) were identified as relevant. Follow-up experiments are
required to explore specific links between these data and the
prognosis of lung adenocarcinoma. In addition, new computational
and bioinformatics tools may prove to be of value for the diagnosis
and prognosis of lung adenocarcinoma.
Acknowledgements
Not applicable.
Funding
The present study was supported by Sichuan Science
and Technology Program (grant no. 2018SZ0199; China).
Availability of data and materials
All the data generated and analyzed in the present
study are available from the corresponding author on reasonable
request.
Authors' contributions
WH and YH contributed to the study design, data
acquisition and analysis, and drafted the manuscript. LF was
involved in GEO data acquisition and revision of the manuscript. QY
was involved in TCGA data acquisition and analysis. QZ worked on
aspects of the GO and KEGG analysis. KY was involved in data
acquisition and revision of the manuscript. LC contributed to the
study design and data analysis. All authors read and approved the
final manuscript.
Ethics approval and consent to
participate
Not applicable.
Patient consent for publication
Not applicable.
Competing interests
The authors declare that they have no competing
interests.
References
|
1
|
Torre LA, Siegel RL and Jemal A: Lung
Cancer Statistics. Adv Exp Med Biol. 893:1–19. 2016. View Article : Google Scholar : PubMed/NCBI
|
|
2
|
de Castro J, Tagliaferri P, de Lima VCC,
Ng S, Thomas M, Arunachalam A, Cao X, Kothari S, Burke T, Myeong H,
et al: Systemic therapy treatment patterns in patients with
advanced non-small cell lung cancer (NSCLC): PIvOTAL study. Eur J
Cancer Care (Engl). 26:e127342017. View Article : Google Scholar
|
|
3
|
Selvaggi G and Scagliotti GV: Histologic
subtype in NSCLC: Does it matter? Oncology (Williston Park).
23:1133–1140. 2009.PubMed/NCBI
|
|
4
|
Janssen-Heijnen ML, Schipper RM,
Klinkhamer PJ, Crommelin MA, Mooi WJ and Coebergh JW: Divergent
changes in survival for histological types of non-small-cell lung
cancer in the southeastern area of The Netherlands since 1975. Br J
Cancer. 77:2053–2057. 1998. View Article : Google Scholar : PubMed/NCBI
|
|
5
|
Huang H, Tang Y, He W, Huang Q, Zhong J
and Yang Z: Key pathways and genes controlling the development and
progression of clear cell renal cell carcinoma (ccRCC) based on
gene set enrichment analysis. Int Urol Nephrol. 46:539–553. 2014.
View Article : Google Scholar : PubMed/NCBI
|
|
6
|
Barrett T, Troup DB, Wilhite SE, Ledoux P,
Rudnev D, Evangelista C, Kim IF, Soboleva A, Tomashevsky M and
Edgar R: NCBI GEO: Mining tens of millions of expression profiles -
database and tools update. Nucleic Acids Res 35 (Database).
D760–D765. 2007. View Article : Google Scholar
|
|
7
|
Subramanian A, Kuehn H, Gould J, Tamayo P
and Mesirov JP: GSEA-P: A desktop application for Gene Set
Enrichment Analysis. Bioinformatics. 23:3251–3253. 2007. View Article : Google Scholar : PubMed/NCBI
|
|
8
|
Greenbaum D, Jansen R and Gerstein M:
Analysis of mRNA expression and protein abundance data: An approach
for the comparison of the enrichment of features in the cellular
population of proteins and transcripts. Bioinformatics. 18:585–596.
2002. View Article : Google Scholar : PubMed/NCBI
|
|
9
|
Manchia M, Piras IS, Huentelman MJ, Pinna
F, Zai CC, Kennedy JL and Carpiniello B: Pattern of gene expression
in different stages of schizophrenia: Down-regulation of NPTX2 gene
revealed by a meta-analysis of microarray datasets. Eur
Neuropsychopharmacol. 27:1054–1063. 2017. View Article : Google Scholar : PubMed/NCBI
|
|
10
|
Lai Y, Zhang F, Nayak TK, Modarres R, Lee
NH and McCaffrey TA: Concordant integrative gene set enrichment
analysis of multiple large-scale two-sample expression data sets.
BMC Genomics. 15 (Suppl 1):S62014. View Article : Google Scholar : PubMed/NCBI
|
|
11
|
Knopp-Sihota JA, Newburn-Cook CV, Homik J,
Cummings GG and Voaklander D: Calcitonin for treating acute and
chronic pain of recent and remote osteoporotic vertebral
compression fractures: A systematic review and meta-analysis.
Osteoporos Int. 23:17–38. 2012. View Article : Google Scholar : PubMed/NCBI
|
|
12
|
Gentleman RC, Carey VJ, Bates DM, Bolstad
B, Dettling M, Dudoit S, Ellis B, Gautier L, Ge Y, Gentry J, et al:
Bioconductor: Open software development for computational biology
and bioinformatics. Genome Biol. 5:R802004. View Article : Google Scholar : PubMed/NCBI
|
|
13
|
Ogata H, Goto S, Sato K, Fujibuchi W, Bono
H and Kanehisa M: KEGG: Kyoto Encyclopedia of Genes and Genomes.
Nucleic Acids Res. 27:29–34. 1999. View Article : Google Scholar : PubMed/NCBI
|
|
14
|
Pinelli NR, Cha R, Brown MB and Jaber LA:
Addition of thiazolidinedione or exenatide to oral agents in type 2
diabetes: A meta-analysis. Ann Pharmacother. 42:1541–1551. 2008.
View Article : Google Scholar : PubMed/NCBI
|
|
15
|
Tian H: Detection of differentially
expressed genes involved in osteoarthritis pathology. J Orthop Surg
Res. 13:492018. View Article : Google Scholar : PubMed/NCBI
|
|
16
|
Shinmura K, Kato H, Kawanishi Y, Igarashi
H, Inoue Y, Yoshimura K, Nakamura S, Fujita H, Funai K, Tanahashi
M, et al: WDR62 overexpression is associated with a poor prognosis
in patients with lung adenocarcinoma. Mol Carcinog. 56:1984–1991.
2017. View
Article : Google Scholar : PubMed/NCBI
|
|
17
|
Fahrmann JF, Grapov DD, Wanichthanarak K,
DeFelice BC, Salemi MR, Rom WN, Gandara DR, Phinney BS, Fiehn O,
Pass H, et al: Integrated Metabolomics and Proteomics Highlight
Altered Nicotinamide- and Polyamine Pathways in Lung
Adenocarcinoma. Carcinogenesis bgw205. 2017. View Article : Google Scholar
|
|
18
|
Gu MM, Gao D, Yao PA, Yu L, Yang XD, Xing
CG, Zhou J, Shang ZF and Li M: p53-inducible gene 3 promotes cell
migration and invasion by activating the FAK/Src pathway in lung
adenocarcinoma. Cancer Sci. 109:3783–3793. 2018. View Article : Google Scholar : PubMed/NCBI
|
|
19
|
Wang Z, Wei Y, Zhang R, Su L, Gogarten SM,
Liu G, Brennan P, Field JK, McKay JD, Lissowska J, et al:
Multi-Omics Analysis Reveals a HIF Network and Hub Gene EPAS1
Associated with Lung Adenocarcinoma. EBioMedicine. 32:93–101. 2018.
View Article : Google Scholar : PubMed/NCBI
|
|
20
|
Collins FS and Mansoura MK; The Human
Genome Project, : The Human Genome Project. Revealing the shared
inheritance of all humankind. Cancer. 91 (Suppl):221–225. 2001.
View Article : Google Scholar : PubMed/NCBI
|
|
21
|
Tang Y, He W, Wei Y, Qu Z, Zeng J and Qin
C: Screening key genes and pathways in glioma based on gene set
enrichment analysis and meta-analysis. J Mol Neurosci. 50:324–332.
2013. View Article : Google Scholar : PubMed/NCBI
|
|
22
|
Unger G: Antibody formation after cat gut
application. Zentralbl Chir. 95:290–292. 1970.(In German).
PubMed/NCBI
|
|
23
|
Deng H, Liu C, Zhang G, Wang X and Liu Y:
Lung adenocarcinoma with concurrent ALK and ROS1 rearrangement: A
case report and review of the literatures. Pathol Res Pract.
214:2103–2105. 2018. View Article : Google Scholar : PubMed/NCBI
|
|
24
|
Tane S, Sakai Y, Hokka D, Okuma H, Ogawa
H, Tanaka Y, Uchino K, Nishio W, Yoshimura M and Maniwa Y:
Significant role of Psf3 expression in non-small-cell lung cancer.
Cancer Sci. 106:1625–1634. 2015. View Article : Google Scholar : PubMed/NCBI
|
|
25
|
Jiang W, Wang H, Cui Y, Lei Y, Wang Y, Xu
D, Jiang N, Chen Y, Sun Y, Zhang Y, et al: Polymer nanofiber-based
microchips for EGFR mutation analysis of circulating tumor cells in
lung adenocarcinoma. Int J Nanomedicine. 13:1633–1642. 2018.
View Article : Google Scholar : PubMed/NCBI
|
|
26
|
Xu L, Lan H, Su Y, Li J and Wan J:
Clinicopathological significance and potential drug target of RUNX3
in non-small cell lung cancer: A meta-analysis. Drug Des Devel
Ther. 9:2855–2865. 2015. View Article : Google Scholar : PubMed/NCBI
|
|
27
|
He W, Qi B, Zhou Q, Lu C, Huang Q, Xian L
and Chen M: Key genes and pathways in thyroid cancer based on gene
set enrichment analysis. Oncol Rep. 30:1391–1397. 2013. View Article : Google Scholar : PubMed/NCBI
|
|
28
|
Ishimi Y and Irie D: G364R mutation of
MCM4 detected in human skin cancer cells affects DNA helicase
activity of MCM4/6/7 complex. J Biochem. 157:561–569. 2015.
View Article : Google Scholar : PubMed/NCBI
|
|
29
|
Elgaaen BV, Haug KB, Wang J, Olstad OK,
Fortunati D, Onsrud M, Staff AC, Sauer T and Gautvik KM: POLD2 and
KSP37 (FGFBP2) correlate strongly with histology, stage and outcome
in ovarian carcinomas. PLoS One. 5:e138372010. View Article : Google Scholar : PubMed/NCBI
|
|
30
|
Ding Y, Hubert CG, Herman J, Corrin P,
Toledo CM, Skutt-Kakaria K, Vazquez J, Basom R, Zhang B, Risler JK,
et al: Cancer-Specific requirement for BUB1B/BUBR1 in human brain
tumor isolates and genetically transformed cells. Cancer Discov.
3:198–211. 2013. View Article : Google Scholar : PubMed/NCBI
|
|
31
|
Szambowska A, Tessmer I, Kursula P,
Usskilat C, Prus P, Pospiech H and Grosse F: DNA binding properties
of human Cdc45 suggest a function as molecular wedge for DNA
unwinding. Nucleic Acids Res. 42:2308–2319. 2014. View Article : Google Scholar : PubMed/NCBI
|
|
32
|
Liu C, Zhang YH, Huang T and Cai Y:
Identification of transcription factors that may reprogram lung
adenocarcinoma. Artif Intell Med. 83:52–57. 2017. View Article : Google Scholar : PubMed/NCBI
|
|
33
|
Zhang W, Gong W, Ai H, Tang J and Shen C:
Gene expression analysis of lung adenocarcinoma and matched
adjacent non-tumor lung tissue. Tumori. 100:338–345.
2014.PubMed/NCBI
|
|
34
|
Sanchez-Palencia A, Gomez-Morales M,
Gomez-Capilla JA, Pedraza V, Boyero L, Rosell R and Fárez-Vidal ME:
Gene expression profiling reveals novel biomarkers in nonsmall cell
lung cancer. Int J Cancer. 129:355–364. 2011. View Article : Google Scholar : PubMed/NCBI
|
|
35
|
Lu TP, Lai LC, Tsai MH, Chen PC, Hsu CP,
Lee JM, Hsiao CK and Chuang EY: Integrated analyses of copy number
variations and gene expression in lung adenocarcinoma. PLoS One.
6:e248292011. View Article : Google Scholar : PubMed/NCBI
|
|
36
|
Landi MT, Dracheva T, Rotunno M, Figueroa
JD, Liu H, Dasgupta A, Mann FE, Fukuoka J, Hames M, Bergen AW, et
al: Gene expression signature of cigarette smoking and its role in
lung adenocarcinoma development and survival. PLoS One.
3:e16512008. View Article : Google Scholar : PubMed/NCBI
|
|
37
|
Su LJ, Chang CW, Wu YC, Chen KC, Lin CJ,
Liang SC, Lin CH, Whang-Peng J, Hsu SL, Chen CH, et al: Selection
of DDX5 as a novel internal control for Q-RT-PCR from microarray
data using a block bootstrap re-sampling scheme. BMC Genomics.
8:1402007. View Article : Google Scholar : PubMed/NCBI
|