Introduction
Hepatocellular carcinoma (HCC) is the sixth most
common malignant tumor and the second leading cause of tumor
mortality worldwide (1,2), and in 2015, its incidence and mortality
in China ranked the fourth and third, respectively (3). Surgical resection or liver
transplantation has been performed for patients with early stage
HCC, and is potentially curative (4). However, the high postoperative
recurrence of HCC remains a common problem (5).
In recent years, many clinical studies have shown
that microvascular invasion (MVI) is a significant risk factor for
the high rate of recurrence and poor prognosis, and could provide
information on which to base clinical treatment (6–8). A
previous study indicated that the incidence of MVI ranged from 15.0
to 57.1% (8). However, no widely
recognized definition of MVI is currently available. The commonly
accepted histopathological features of MVI include the presence of
tumor cells in the portal veins, in large capsular vessels or in
vascular spaces lined by endothelial cells (8,9). As
demonstrated in a previous study, a wide resection surgical margin
(SM) (58% with SM ≥10 mm vs. 29% with SM <10 mm) may prolong the
disease-free survival rate (58 vs. 29%) (10). Unfortunately, MVI can only be
detected after postoperative histopathological examination of the
whole surgical specimen, and therefore cannot be used for
prediction of treatment benefit. If MVI status could be predicted
preoperatively and noninvasively, appropriate treatment could be
selected to improve the prognosis.
Recently, a number of studies reported that certain
clinical features and morphological characteristics detected on
imaging examination could predict the MVI status, including the
tumor size, tumor margin, capsule formation and dynamic enhancing
pattern (10–12). However, clinical and traditional
imaging features were more subjective, lacked quantitative indexes
and always showed inter-observer differences, thereby leading to
poor reliability of the results that were largely affected by the
experience level of the radiologist. Functional imaging modalities,
including diffusion-weighted imaging, diffusion kurtosis imaging
and positron emission tomography-computed tomography (PET-CT), do
not have good predictive power because of their instability and
lack of reproducibility (13,14).
Thus, the current preoperative prediction of MVI based on imaging
signs and/or examinations has limitations, mainly the lack of
specificity and practicability. Therefore, developing a method to
accurately and quantitatively predict the MVI status of HCC
preoperatively is of great clinical significance.
Texture analysis is a widely used image
post-processing technique that extracts quantitative features from
radiological images to explore the correlation between these
features and clinical or histological factors (15,16).
Texture analysis enables noninvasive assessment of tumor
heterogeneity and provides indirect information on the tumor
microenvironment that cannot be obtained with the naked eye
(17). More recently, texture
analysis has been demonstrated to reveal tumor aggressiveness, thus
potentially helping predict the risk of disease progression or
recurrence and the response to treatment in many studies; this has
also enabled its application in CT, magnetic resonance imaging
(MRI) and PET-CT studies (18–21).
Several studies have also adopted texture analysis for the
differential diagnosis of liver nodules, treatment response
evaluation of HCC and prognosis prediction (22,23). In
addition, model-based texture analysis has been applied to improve
diagnostic efficiency, which could assist clinicians in making
treatment decisions (24).
In particular, contrast-enhanced MRI (CE-MRI) is
generally used for the diagnosis, treatment evaluation, prognosis
estimation, as well as MVI prediction of HCC (12). However, no reports to date have
documented the use of texture analysis for MVI prediction of HCC,
and none have documented the role of CE-MRI texture analysis in
predicting MVI.
The purpose of the present study was to explore the
value of CE-MRI texture analysis in preoperatively predicting the
MVI status of HCC and determining the diagnostic performance to
guide the clinician in choosing appropriate treatment options.
Materials and methods
Patient selection
The Independent Ethics Committee of the Cancer
Hospital, Chinese Academy of Medical Sciences (Beijing, China)
approved the current retrospective study and waived the requirement
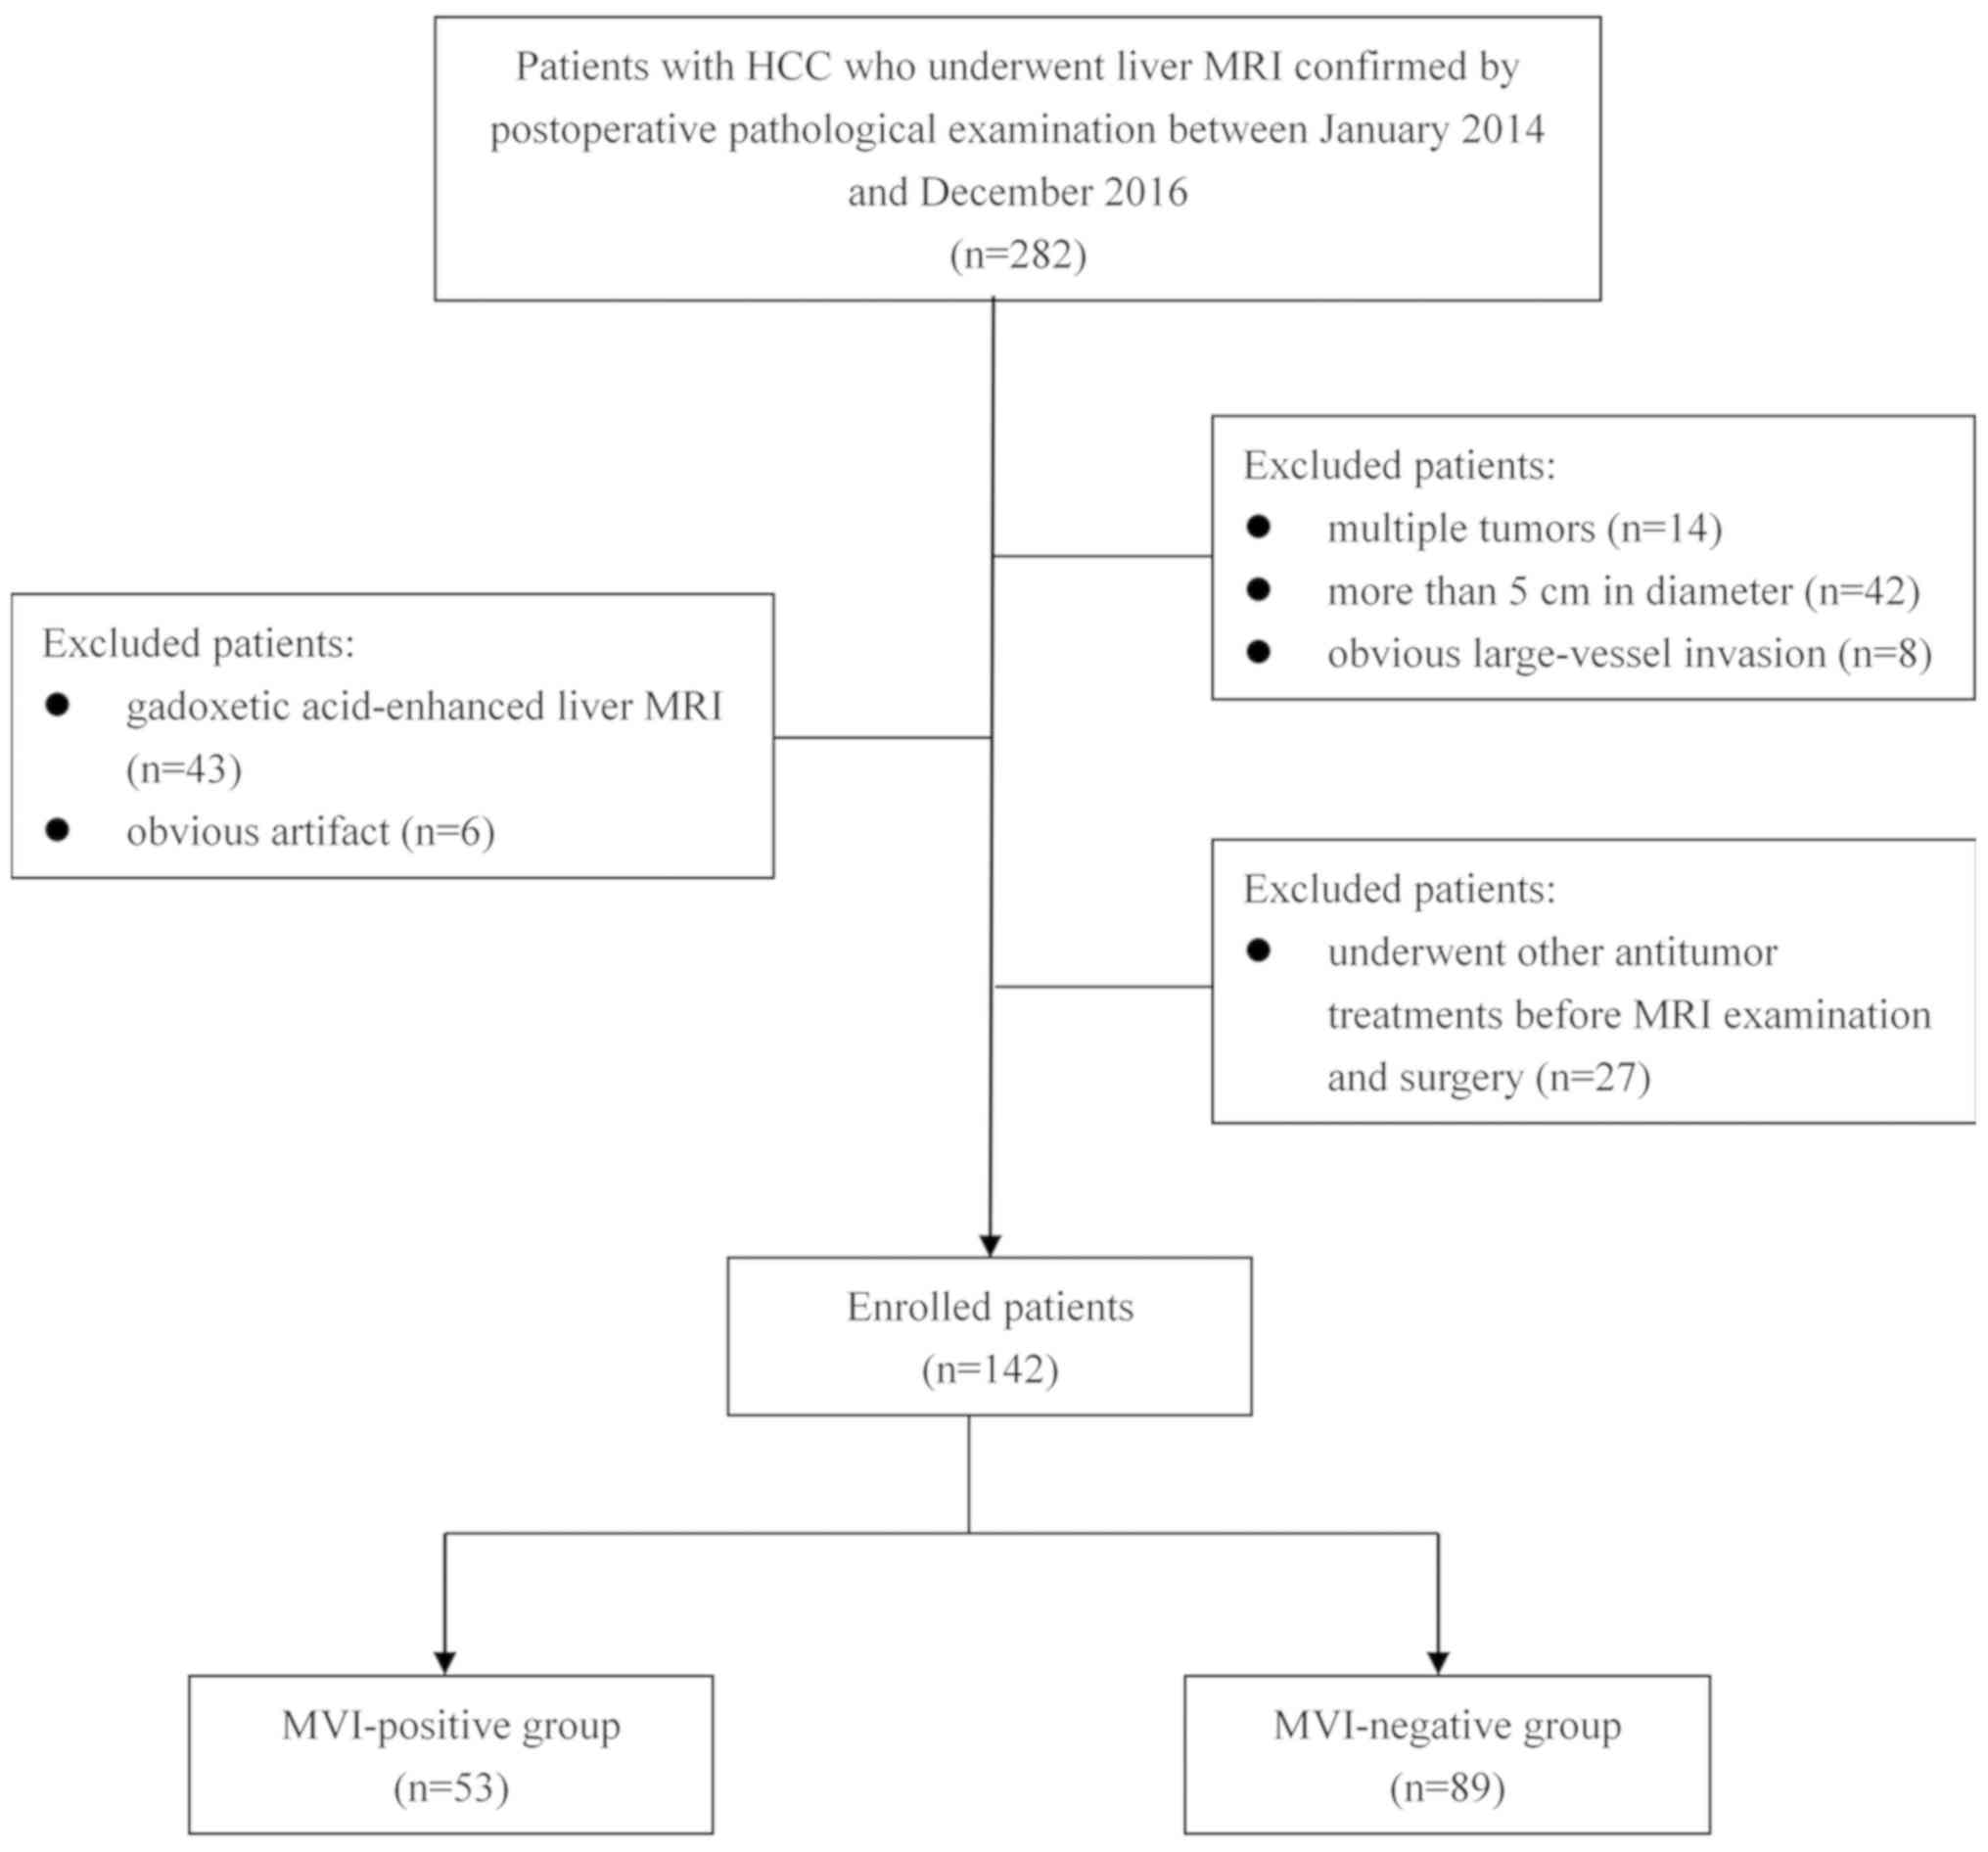
for informed patient consent. Between January 2014 and December
2016, a total of 282 patients with HCC underwent liver MRI
examination confirmed by postoperative pathological examinations.
The inclusion criteria were as follows: i) Single tumor with a
maximum diameter <5.0 cm, no large vessel invasion and no
distant metastasis; ii) underwent radical resection; iii) primary
HCC and MVI status confirmed by surgical pathological examination;
iv) no other antitumor treatment received before MRI examination
and operation; and v) no apparent artifact that may affect imaging
analysis. Fig. 1 shows the patient
selection flowchart. Consequently, 142 patients were enrolled in
the present study and were divided into the MVI-positive (MP) group
(n=53) and the MVI-negative (MN) group (n=89). Next, these 142
patients were divided into two cohorts, including the training
cohort with 99 patients who underwent MRI examination between
January 2014 and January 2016, and the validation cohort with 43
patients who underwent MRI examination between February 2016 and
December 2016. The mean time interval between MRI and surgery was
15 days (range, 7–35 days).
Clinicopathological data
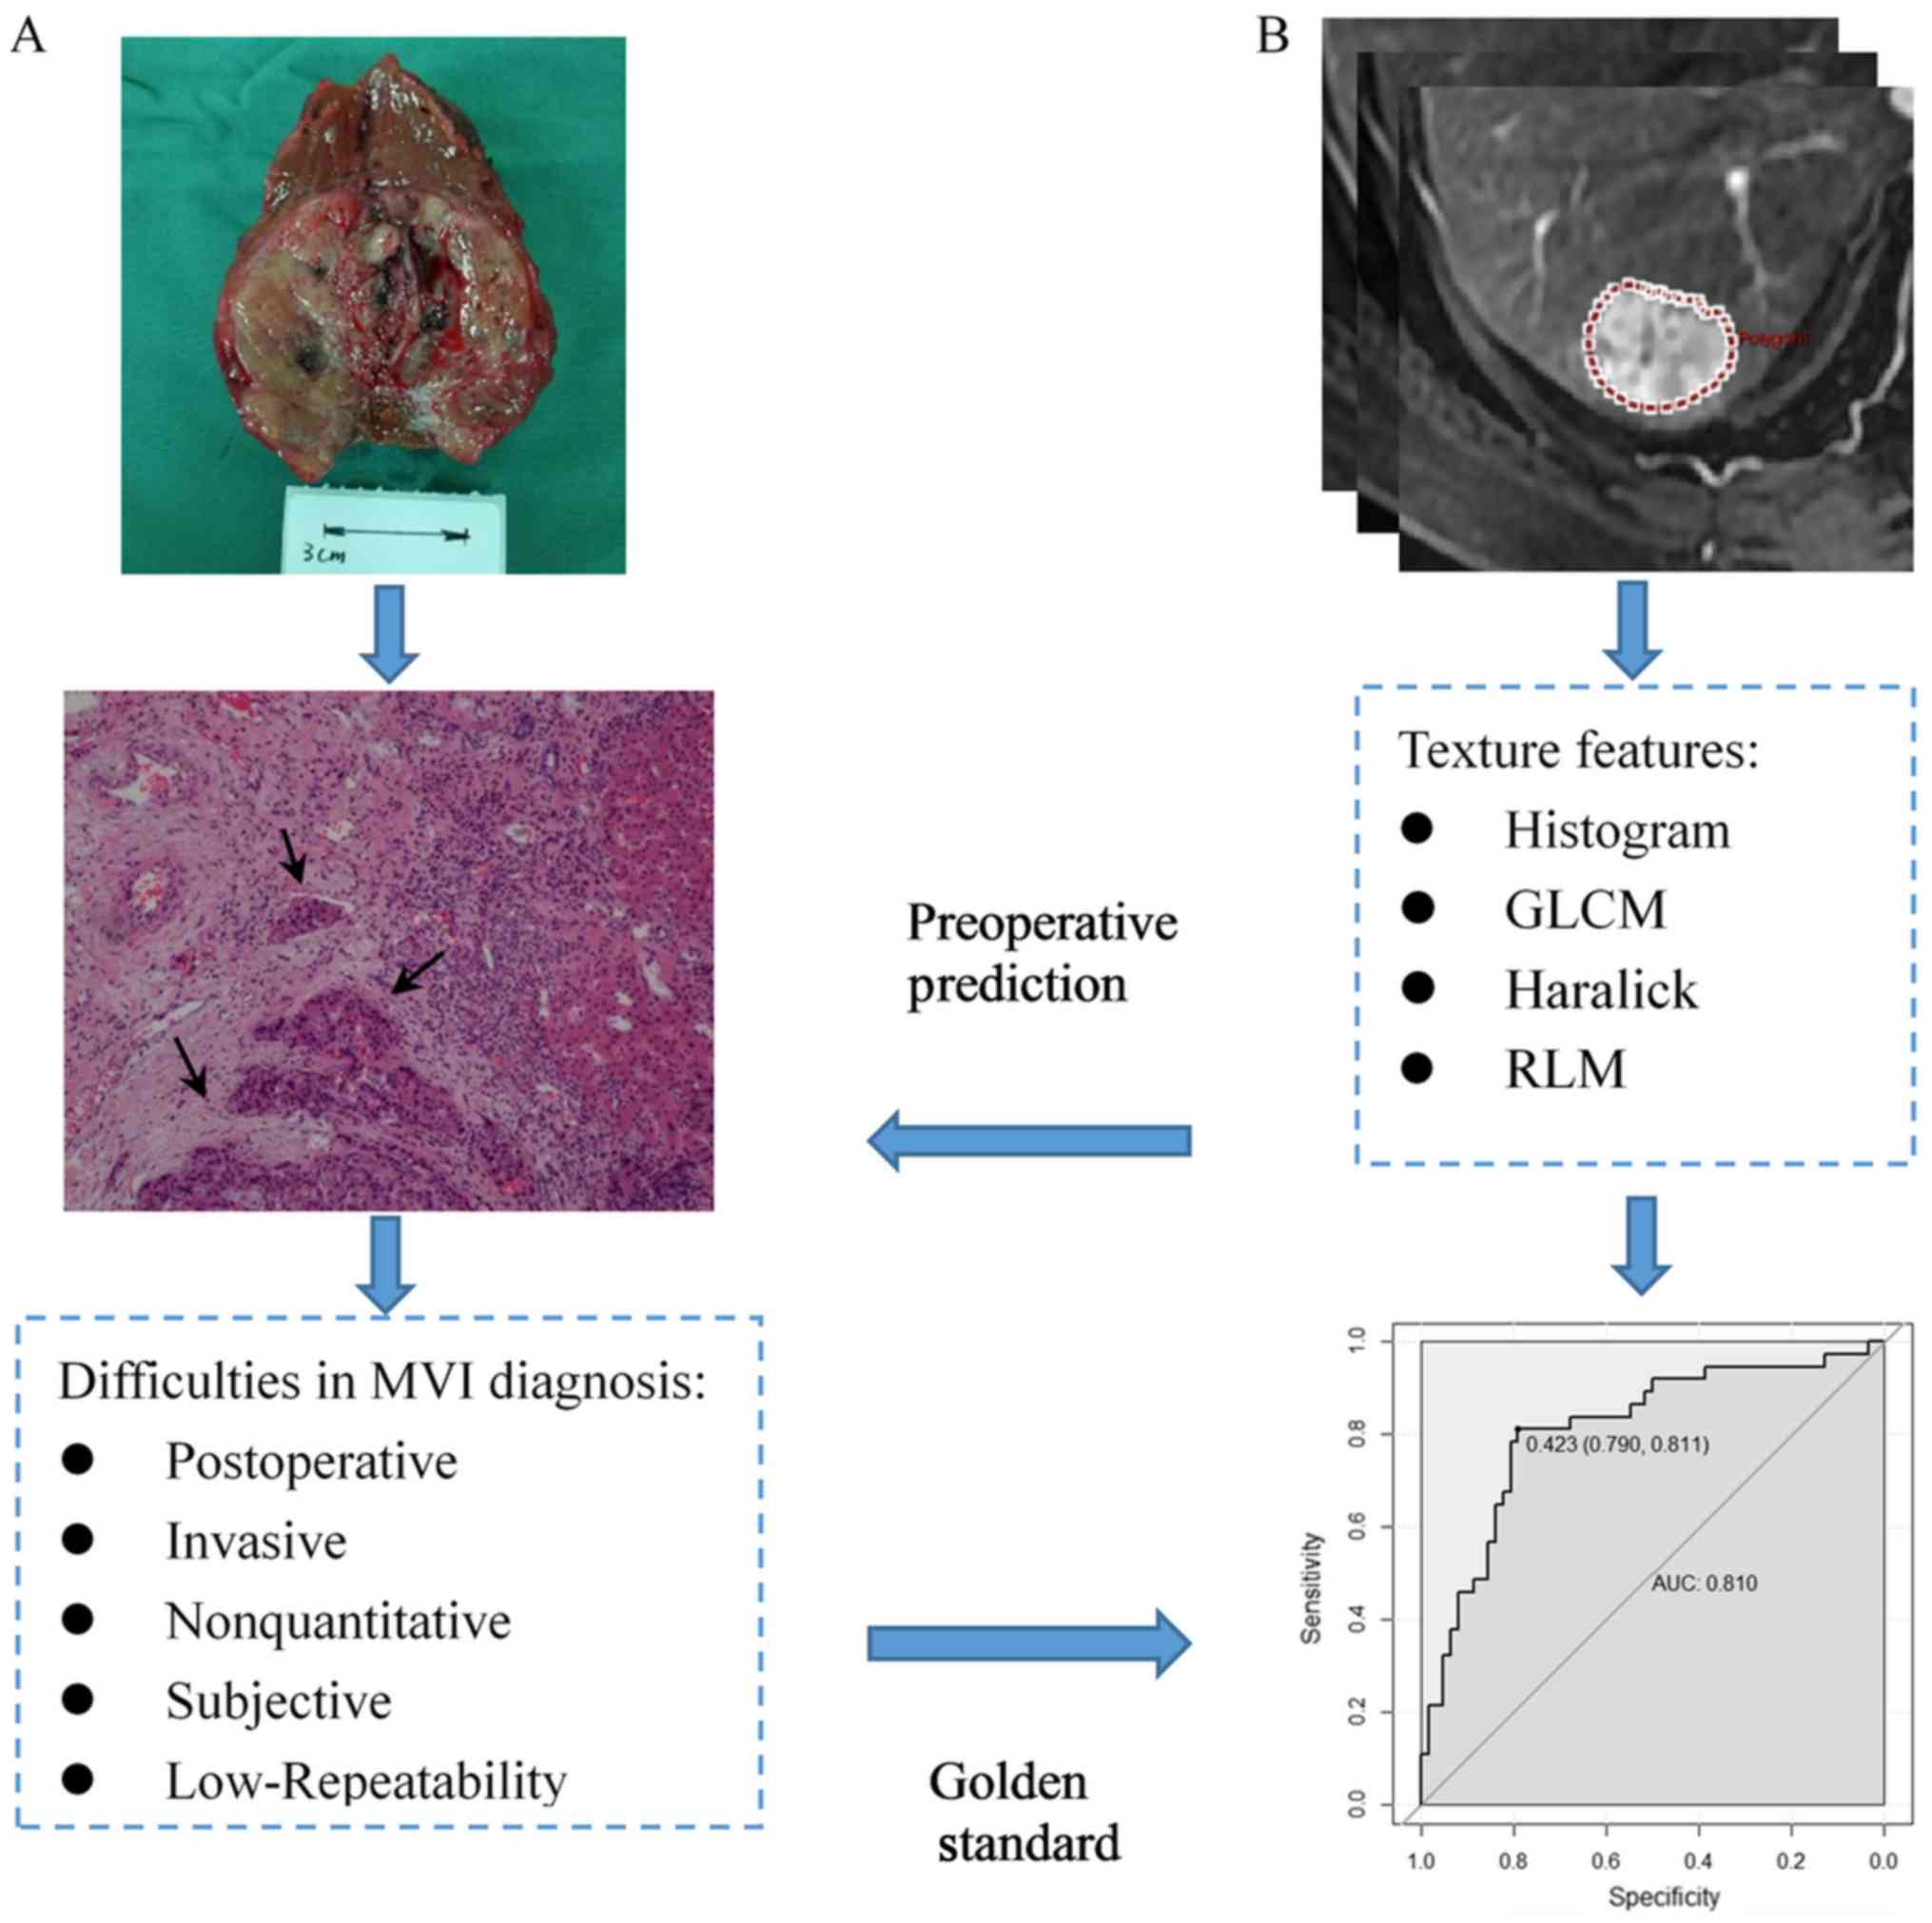
The pathological diagnostic criteria for MVI adopted
in this study were reported by Rodríguez-Perálvarez et al
(8), namely the presence of tumor
emboli in a portal vein, hepatic vein or a large capsule vessel,
but not a small bile duct of the surrounded hepatic tissue, as
shown in Fig. 2A. Clinical and
pathological data collected for analysis included sex, age at
diagnosis, α-fetoprotein (AFP) level (≤7, 7–400 or >400 ng/ml),
tumor location (left, right or caudate lobe), hepatitis B surface
antigen (HBsAg) status (positive or negative), hepatitis C antibody
(HCV-Ab) and histologic differentiation (well, moderate or poor).
The threshold values chosen for AFP were based on the normal ranges
and diagnostic value for HCC used at Cancer Hospital, Chinese
Academy of Medical Sciences and Peking Union Medical College.
MR image acquisition
The patients fasted for 6–8 h to empty the
gastrointestinal tract before undergoing MRI examination. All of
the MR images were acquired using a 3.0-T body MRI system
(Discovery MR750 3.0T, GE Medical Systems) equipped with an
8-channel phased-array body coil. The CE-MRI acquisitions were
performed with multiphase 3D spoiled gradient echo liver
acceleration volume acquisition (LAVA) sequence, with the following
scanning parameters: Repetition time, 2.9 msec; echo time, 1.3
msec; flip angle, 12°; field of view, 36–42×36–42 cm; matrix,
512×512; section thickness, 4 mm; gap, 0 mm; and number of
sections, 36–40. Gadodiamide (Omniscan 0.5 mmol/ml; GE Healthcare)
at a standard dose (0.2 ml/kg) was injected as a bolus through the
peripheral veins by using an automatic pump injector at the rate of
3.0 ml/sec, and followed immediately by 20 ml of a 0.9% sterile
saline solution injection. The contrast-enhanced dynamic images
were acquired at 15–20 sec (arterial phase, AP), 50–55 sec (portal
venous phase, PP) and 85–90 sec (delayed phase) after
contrast-agent injection by using the LAVA sequence.
MRI feature analysis
The basic MRI features included the maximum tumor
diameter (MTD) (measured by the maximum diameter on the maximum
axial section in PP MR image), liver background (cirrhosis or
noncirrhosis), tumor encapsulation (peripheral rim of smooth
hyperenhancement in PP image), fast wash-in (hyperenhancement of
the tumor in the AP), fast wash-out (hypoenhancement of the tumor
in the PP) and tumor necrosis (unenhanced areas). The features for
each patient were independently evaluated and recorded in a blinded
manner by two radiologists with 5 (YJZ) and 3 years (BF) of
experience in the interpretation of abdominal MRI to ensure
diagnostic accuracy. When a disagreement occurred between the two
reviewers during evaluation, a joint review was performed, and
consensus data were used for further statistical analysis.
Tumor imaging segmentation and texture
analysis
All the MR images were retrieved from the picture
archiving and communication system and transferred to a personal
computer in the Digital Imaging and Communications in Medicine
format. The same two radiologists reviewed and processed the images
in a random patient order by using an in-house developed software,
Omni-kinetics (version 2.0.10; GE Healthcare Life Sciences), to
obtain texture features. A 3D volume of interest (VOI) of the tumor
was manually contoured by the two readers, slightly along the
borders of the tumor to include the entire approximated tumor
volume.
After generating the VOI, a total of 58 texture
features were automatically extracted from the AP and PP images
using the Omni-kinetics software. The texture features could be
divided into four categories: i) 29 histogram features, ii) 8
gray-level co-occurrence matrix (GLCM) features, iii) 11 Haralick
features, and iv) 10 run-length matrix (RLM) features. A detailed
list of the features included in the present study is presented in
Table I. Fig. 2B shows the diagram of texture
analysis.
 | Table I.List of 58 texture analysis
parameters. |
Table I.
List of 58 texture analysis
parameters.
| Texture type | Texture
parameters |
|---|
| Histogram | MinIntensity,
MaxIntensity, MedianIntensity, MeanValue, stdDeviation, Variance,
VolumeCount, VoxelValueSum, RMS, Range, MeanDeviation,
RelativeDeviation, MinLocation, MaxLocation, Skewness, kurtosis,
uniformity, Energy, Entropy, FrequencySize, MPP, UPP, Quantile5,
Quantile10, Quantile25, Quantile50, Quantile75, Quantile90,
Quantile95 |
| GLCM | GlcmTotalFrequency,
GlcmEnergy, GlcmEntropy, Inertia, Correlation,
InverseDifferenceMoment, ClusterShade, ClusterProminence |
| Haralick |
HaralickCorrelation, HaraEntropy,
AngularSecondMoment, contrast, HaraVariance, sumAverage,
sumVariance, sumEntropy, differenceVariance, differenceEntropy,
inverseDifferenceMoment |
| RLM | ShortRunEmphasis,
LongRunEmphasis, GreyLevelNonuniformity, RunLengthNonuniformity,
LowGreyLevelRunEmphasis, HighGreyLevelRunEmphasis,
ShortRunLowGreyLevelEmphasis, ShortRunHighGreyLevelEmphasis,
LongRunLowGreyLevelEmphasis, LongRunHighGreyLevelEmphasis |
Statistical analysis and feature
reduction
The Kolmogorov-Smirnov test was used to determine
whether the distribution of all the features was normal, and
Levene's test was used for identifying the homogeneity of variance.
For the clinical-radiological features, a two-tailed unpaired
independent t-test was used to compare continuous variables with
normal distribution between the MP and MN groups. Categorical
variables were compared using the χ2 test or Fisher's
exact test.
For texture features, first, an independent t-test
or Kruskal-Wallis test was applied one by one. Features with
significant differences (P<0.05) were further analyzed by
univariate logistic regression analysis. Features in the univariate
logistic regression analysis with P<0.05 were selected. Finally,
to eliminate redundant features, Pearson correlation analysis was
conducted to remove features with high correlation (r>0.90),
which were not considered in the subsequent analysis. Features that
remained after adjusting for redundancy were entered into model
building.
All statistical analyses were performed using R
software (version 3.4.1; R Foundation for Statistical Computing),
with a two-tailed probability value. P<0.05 was considered to
indicate a statistically significant difference.
Model development
Multivariate logistic regression analysis was
applied for model building. First, the texture model was built on
the basis of the features selected from a previous step by directly
entering. The texture signature score (Texscore), which reflected
the overall texture features, was calculated for each patient using
the texture model. To involve both texture features and
clinical-radiological features to improve performance, the combined
model was built on the basis of the Texscore as well as other
significant clinical-radiological features in both AP and PP.
Receiver operating characteristic
(ROC) analysis and the nomogram plot of the model
The performance of the texture and combined models
was analyzed both in the training and validation cohorts by using a
ROC curve quantified by the area under the curve (AUC),
sensitivity, specificity and overall accuracy (ACC). The cutoff
point was calculated at the maximized value of the Youden index
(sensitivity + specificity-1) (25).
Nomogram of the combined model was formulated in order to visualize
model efficiency.
Results
Clinical and radiological
features
Of the 142 patients enrolled in the study, 124
patients were male and 18 were female. Median age was 57 years
(range, 34–80 years). The results revealed that MTD (P=0.002),
serum AFP level (P=0.025) and tumor differentiation (P=0.026)
showed significant differences between the MP and MN groups in the
training cohort. The MP group had greater MTD than did the MN group
(3.82±0.88 vs. 3.21±0.94 cm), and also tended to have a higher
serum AFP level and lower tumor differentiation. This result was
also confirmed in the validation cohort. The characteristics of the
training and validation cohorts showed no significant differences
(all P>0.05). The detailed clinical and radiological features of
the patients in the training and validation cohorts are listed in
Table II.
| Table II.The clinical and radiological
characteristics of patients in the training and validation
cohorts. |
Table II.
The clinical and radiological
characteristics of patients in the training and validation
cohorts.
| A, Clinical
characteristics |
|---|
|
|---|
|
| Training cohort
(n=99) | Validation cohort
(n=43) |
|
|---|
|
|
|
|
|
|---|
| Characteristic | MP (n=37) | MN (n=62) |
P-valuea | MP (n=16) | MN (n=27) |
P-valuea |
P-valueb |
|---|
| Sex |
|
| 0.931c |
|
| 0.723c | 0.805c |
|
Male | 32 | 54 |
| 15 | 23 |
|
|
|
Female | 5 | 8 |
| 1 | 4 |
|
|
| Mean age ± SD,
years | 57.49±9.56 | 56.45±9.71 | 0.607e | 55.88±8.63 | 55.41±8.00 | 0.858e | 0.456e |
| AFP, ng/ml |
|
| 0.025c |
|
| 0.038c | 0.715c |
| ≤7 | 9 | 32 |
| 5 | 16 |
|
|
|
7–400 | 17 | 20 |
| 5 | 9 |
|
|
|
>400 | 11 | 10 |
| 6 | 2 |
|
|
| Location |
|
| 0.561c |
|
| 0.372c | 0.581c |
|
Right | 31 | 49 |
| 10 | 23 |
|
|
|
Left | 6 | 13 |
| 6 | 4 |
|
|
| HBsAg |
|
| 0.325c |
|
| 0.614c | 0.668c |
|
Positive | 26 | 49 |
| 12 | 22 |
|
|
|
Negative | 11 | 13 |
| 4 | 5 |
|
|
| HCV-Ab |
|
| 1.000c |
|
| 1.000d | 0.989c |
|
Positive | 1 | 3 |
| 0 | 1 |
|
|
|
Negative | 36 | 59 |
| 16 | 26 |
|
|
|
Differentiation |
|
| 0.026c |
|
| 0.034d | 0.565c |
|
Well | 2 | 3 |
| 0 | 4 |
|
|
|
Moderate | 19 | 47 |
| 9 | 20 |
|
|
|
Poor | 16 | 12 |
| 7 | 3 |
|
|
|
| B, Radiological
characteristics |
|
|
| Training cohort
(n=99) | Validation
cohort (n=43) |
|
|
|
|
|
|
|
Characteristic | MP
(n=37) | MN
(n=62) |
P-valuea | MP
(n=16) | MN
(n=27) |
P-valuea |
P-valueb |
|
| MTD, cm | 3.82±0.88 | 3.21±0.94 | 0.002e | 3.75±0.80 | 2.92±0.62 |
<0.001e | 0.231e |
| Background
liver |
|
| 0.690c |
|
| 0.358c | 0.553c |
|
Noncirrhosis | 14 | 21 |
| 3 | 10 |
|
|
|
Cirrhosis | 23 | 41 |
| 13 | 17 |
|
|
| Tumor
encapsulation |
|
| 0.805c |
|
| 0.362c | 0.534c |
|
Absent | 11 | 17 |
| 2 | 8 |
|
|
|
Present | 26 | 45 |
| 14 | 19 |
|
|
| Fast wash-in |
|
| 0.292c |
|
| 0.929c | 0.742c |
|
Yes | 30 | 55 |
| 14 | 22 |
|
|
| No | 7 | 7 |
| 2 | 5 |
|
|
| Fast wash-out |
|
| 0.409c |
|
| 0.534c | 0.720c |
|
Yes | 24 | 35 |
| 11 | 16 |
|
|
| No | 13 | 27 |
| 5 | 11 |
|
|
| Tumor necrosis |
|
| 0.638c |
|
| 0.372c | 0.668c |
|
Absent | 29 | 46 |
| 11 | 23 |
|
|
|
Present | 8 | 16 |
| 5 | 4 |
|
|
Texture feature reduction
First, the Kruskal-Wallis test revealed that 19
texture features in AP and 18 in PP showed significant differences
(all P<0.05) between the MP and MN groups. In the univariate
logistic regression analysis, 10 texture features in AP and 12 in
PP showed a potential predictive value (P<0.05) to discriminate
between the MP and MN groups. Detailed results of the univariate
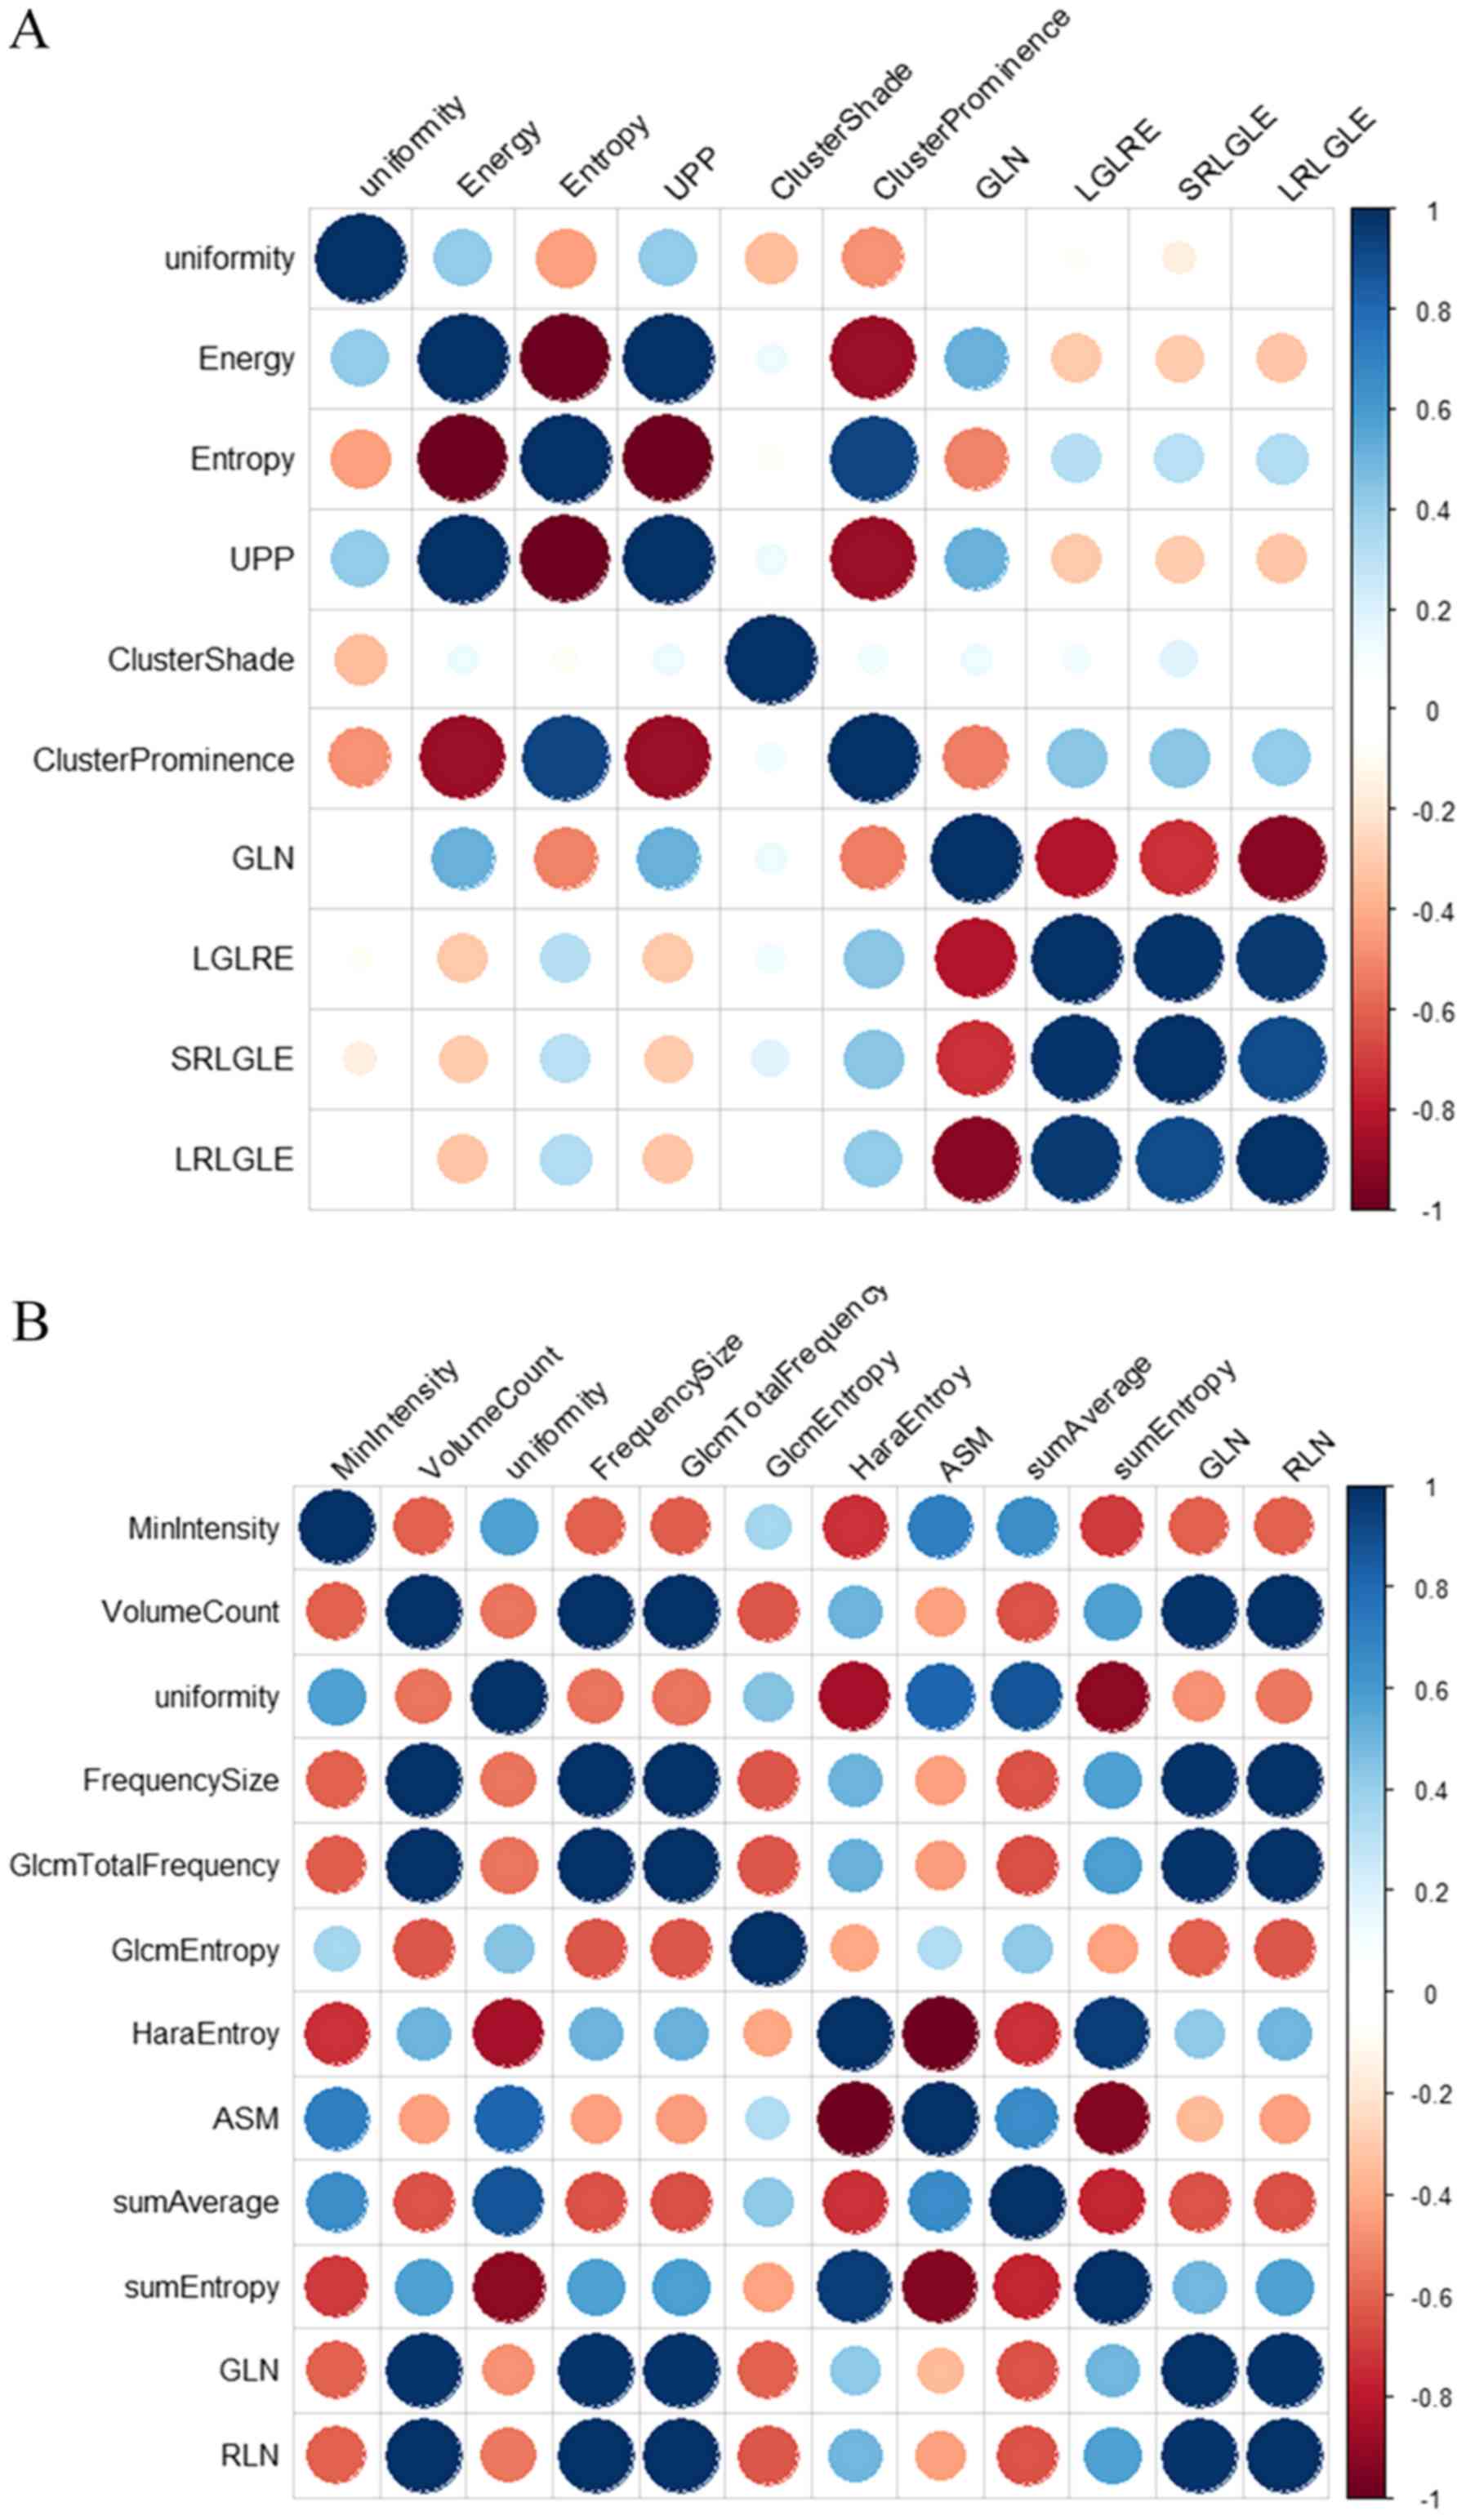
logistic regression analysis are demonstrated in Table III. Finally, a Pearson correlation
matrix was then calculated from the above features to detect highly
collinear texture features (Fig. 3).
After eliminating significant highly correlated features (defined
as Pearson's r≥0.90), four texture features in AP, including
uniformity, ClusterProminence, ClusterShade and
LongRunLowGreyLevelEmphasis (LRLGLE), and five in PP, including
MinIntensity, GlcmEntropy, sumAverage, sumEntropy and
RunLengthNonuniformity (RLN), were retained for the subsequent
analysis.
| Table III.Univariate logistic regression
analysis of the clinical and texture features to predict the
microvascular invasion status in the training cohort. |
Table III.
Univariate logistic regression
analysis of the clinical and texture features to predict the
microvascular invasion status in the training cohort.
|
| OR |
|
|---|
|
|
|
|
|---|
|
|
| 95% CI |
|
|---|
|
|
|
|
|
|---|
| Feature | Value | Lower | Upper | P-value |
|---|
| AP texture
features |
|
|
|
|
|
Uniformity |
1.209×10⁴ | 6.602 |
4.605×10⁷ | 0.019 |
|
Energy |
3.110×10121 |
4.556×10¹⁹ |
1.820×10229 | 0.022 |
|
Entropy |
1.123×10⁻¹ |
1.991×10⁻² |
5.647×10⁻¹ | 0.010 |
|
UPP |
3.110×10121 |
4.556×10¹⁹ |
1.820×10229 | 0.022 |
|
ClusterShade | 1.000 | 1.000 | 1.000 | 0.046 |
|
ClusterProminence | 1.000 | 1.000 | 1.000 | 0.005 |
|
GreyLevelNonuniformity | 1.003 | 1.001 | 1.007 | 0.023 |
|
LowGreyLevelRunEmphasis | 0.000 | 0.000 | 3.320
×10−192 | 0.034 |
|
ShortRunLowGreyLevelEmphasis | 0.000 | 0.000 |
2.140×10−255 | 0.035 |
|
LongRunLowGreyLevelEmphasis | 0.000 | 0.000 | 2.060
×10−79 | 0.036 |
| PP texture
features |
|
|
|
|
|
MinIntensity |
9.973×10⁻¹ |
9.947×10⁻¹ |
9.995×10⁻¹ | 0.025 |
|
VolumeCount | 1.000 | 1.000 | 1.000 | 0.027 |
|
Uniformity |
1.087×10⁻³ |
9.070×10⁻⁷ |
6.241×10⁻¹ | 0.044 |
|
FrequencySize | 1.000 | 1.000 | 1.000 | 0.027 |
|
GlcmTotalFrequency | 1.000 | 1.000 | 1.000 | 0.026 |
|
GlcmEntropy |
6.627×10⁻¹ |
4.454×10⁻¹ |
9.462×10⁻¹ | 0.030 |
|
HaraEntroy |
3.266×10⁵ |
2.273×101 |
1.286×10¹⁰ | 0.013 |
|
AngularSecondMoment | 0.000 | 0.000 |
4.329×10−94 | 0.026 |
|
sumAverage |
1.301×10⁻² |
2.238×10⁻⁴ |
5.748×10⁻¹ | 0.029 |
|
sumEntropy |
1.896×10⁴ | 4.127 |
1.996×10⁸ | 0.028 |
|
GreyLevelNonuniformity | 1.003 | 1.001 | 1.006 | 0.024 |
|
RunLengthNonuniformity | 1.000 | 1.000 | 1.000 | 0.025 |
Multivariate logistic regression
analysis and texture model building
Texture features identified from the above analysis
in AP and PP were entered into the multivariate logistic regression
model to build the texture predictive model. The detailed results
of the multivariate logistic regression analysis are shown in
Table IV.
| Table IV.Multivariate logistic regression
analysis of the texture parameters in predicting the microvascular
invasion status in the arterial and portal venous phases in the
training cohort. |
Table IV.
Multivariate logistic regression
analysis of the texture parameters in predicting the microvascular
invasion status in the arterial and portal venous phases in the
training cohort.
| A, Arterial
phase |
| Feature | OR | P-value |
|---|
|
(Intercept)a | 0.455 | 0.003 |
| Uniformity | 1.301 | 0.387 |
| ClusterShade | 0.524 | 0.059 |
|
ClusterProminence | 0.593 | 0.262 |
| LRLGLE | 0.494 | 0.170 |
|
| B, Portal venous
phase |
|
| Feature | OR | P-value |
|
|
(Intercept)a | 7.310 | 0.754 |
| GlcmEntropy | 0.732 | 0.146 |
| sumEntropy | 0.002 | 0.474 |
| sumAverage | 2.230e+05 | 0.124 |
| MinIntensity | 0.999 | 0.563 |
| RLN | 1.000 | 0.371 |
The texture signature score (Texscore) of each
patient in AP and PP could be calculated using the formula based on
multivariate logistic regression model as follows: Texscore (AP) =
0.455+1.30 × uniformity + 0.524 × ClusterProminence + 0.593 ×
ClusterShade + 0.494 × LRLGLE; and Texscore (PP) = 7.310 + 0.732 ×
GlcmEntropy + 0.002 × sumEntropy + 2.230×10⁵ ×
sumAverage + 0.999 × MinIntensity + 1.000 × RLN.
Development of the combined model
In the training cohort, two combined models were
built to predict the MVI status by clinical-radiological features
and the Texscore generated above in AP and PP separately (Table V). In the combined model in AP, only
the texture signature showed significant [odds ratio (OR), 2.552;
P=0.003], but none of the clinical-radiological features showed
significance. In the combined model in PP, MTD (OR, 0.759; P=0.032)
and AFP (OR, 1.307; P=0.027 and OR, 1.768; P=0.017) showed
significance, but the texture signature and differentiation did not
show significance.
| Table V.Multivariate logistic regression
analysis of the combined clinical-radiological and texture features
to predict the microvascular invasion status in the AP and PP in
the training cohort. |
Table V.
Multivariate logistic regression
analysis of the combined clinical-radiological and texture features
to predict the microvascular invasion status in the AP and PP in
the training cohort.
|
| AP Model | PP Model |
|---|
|
|
|
|
|---|
| Features | OR | P-value | OR | P-value |
|---|
|
(Intercept)a | 0.257 | 0.282 | −3.068 | 0.052 |
| MTD, cm | 1.395 | 0.242 | 0.759 | 0.032 |
|
Differentiation |
|
|
|
|
|
Moderate vs. poor | 0.559 | 0.284 | −0.838 | 0.179 |
| Well
vs. low | 0.672 | 0.747 | −0.697 | 0.560 |
| α-fetoprotein,
ng/ml |
|
|
|
|
| 7–400
vs. ≤7 | 1.801 | 0.298 | 1.307 | 0.027 |
| >400
vs. ≤7 | 3.771 | 0.053 | 1.768 | 0.017 |
| Texscore | 2.552 | 0.003 | 0.449 | 0.294 |
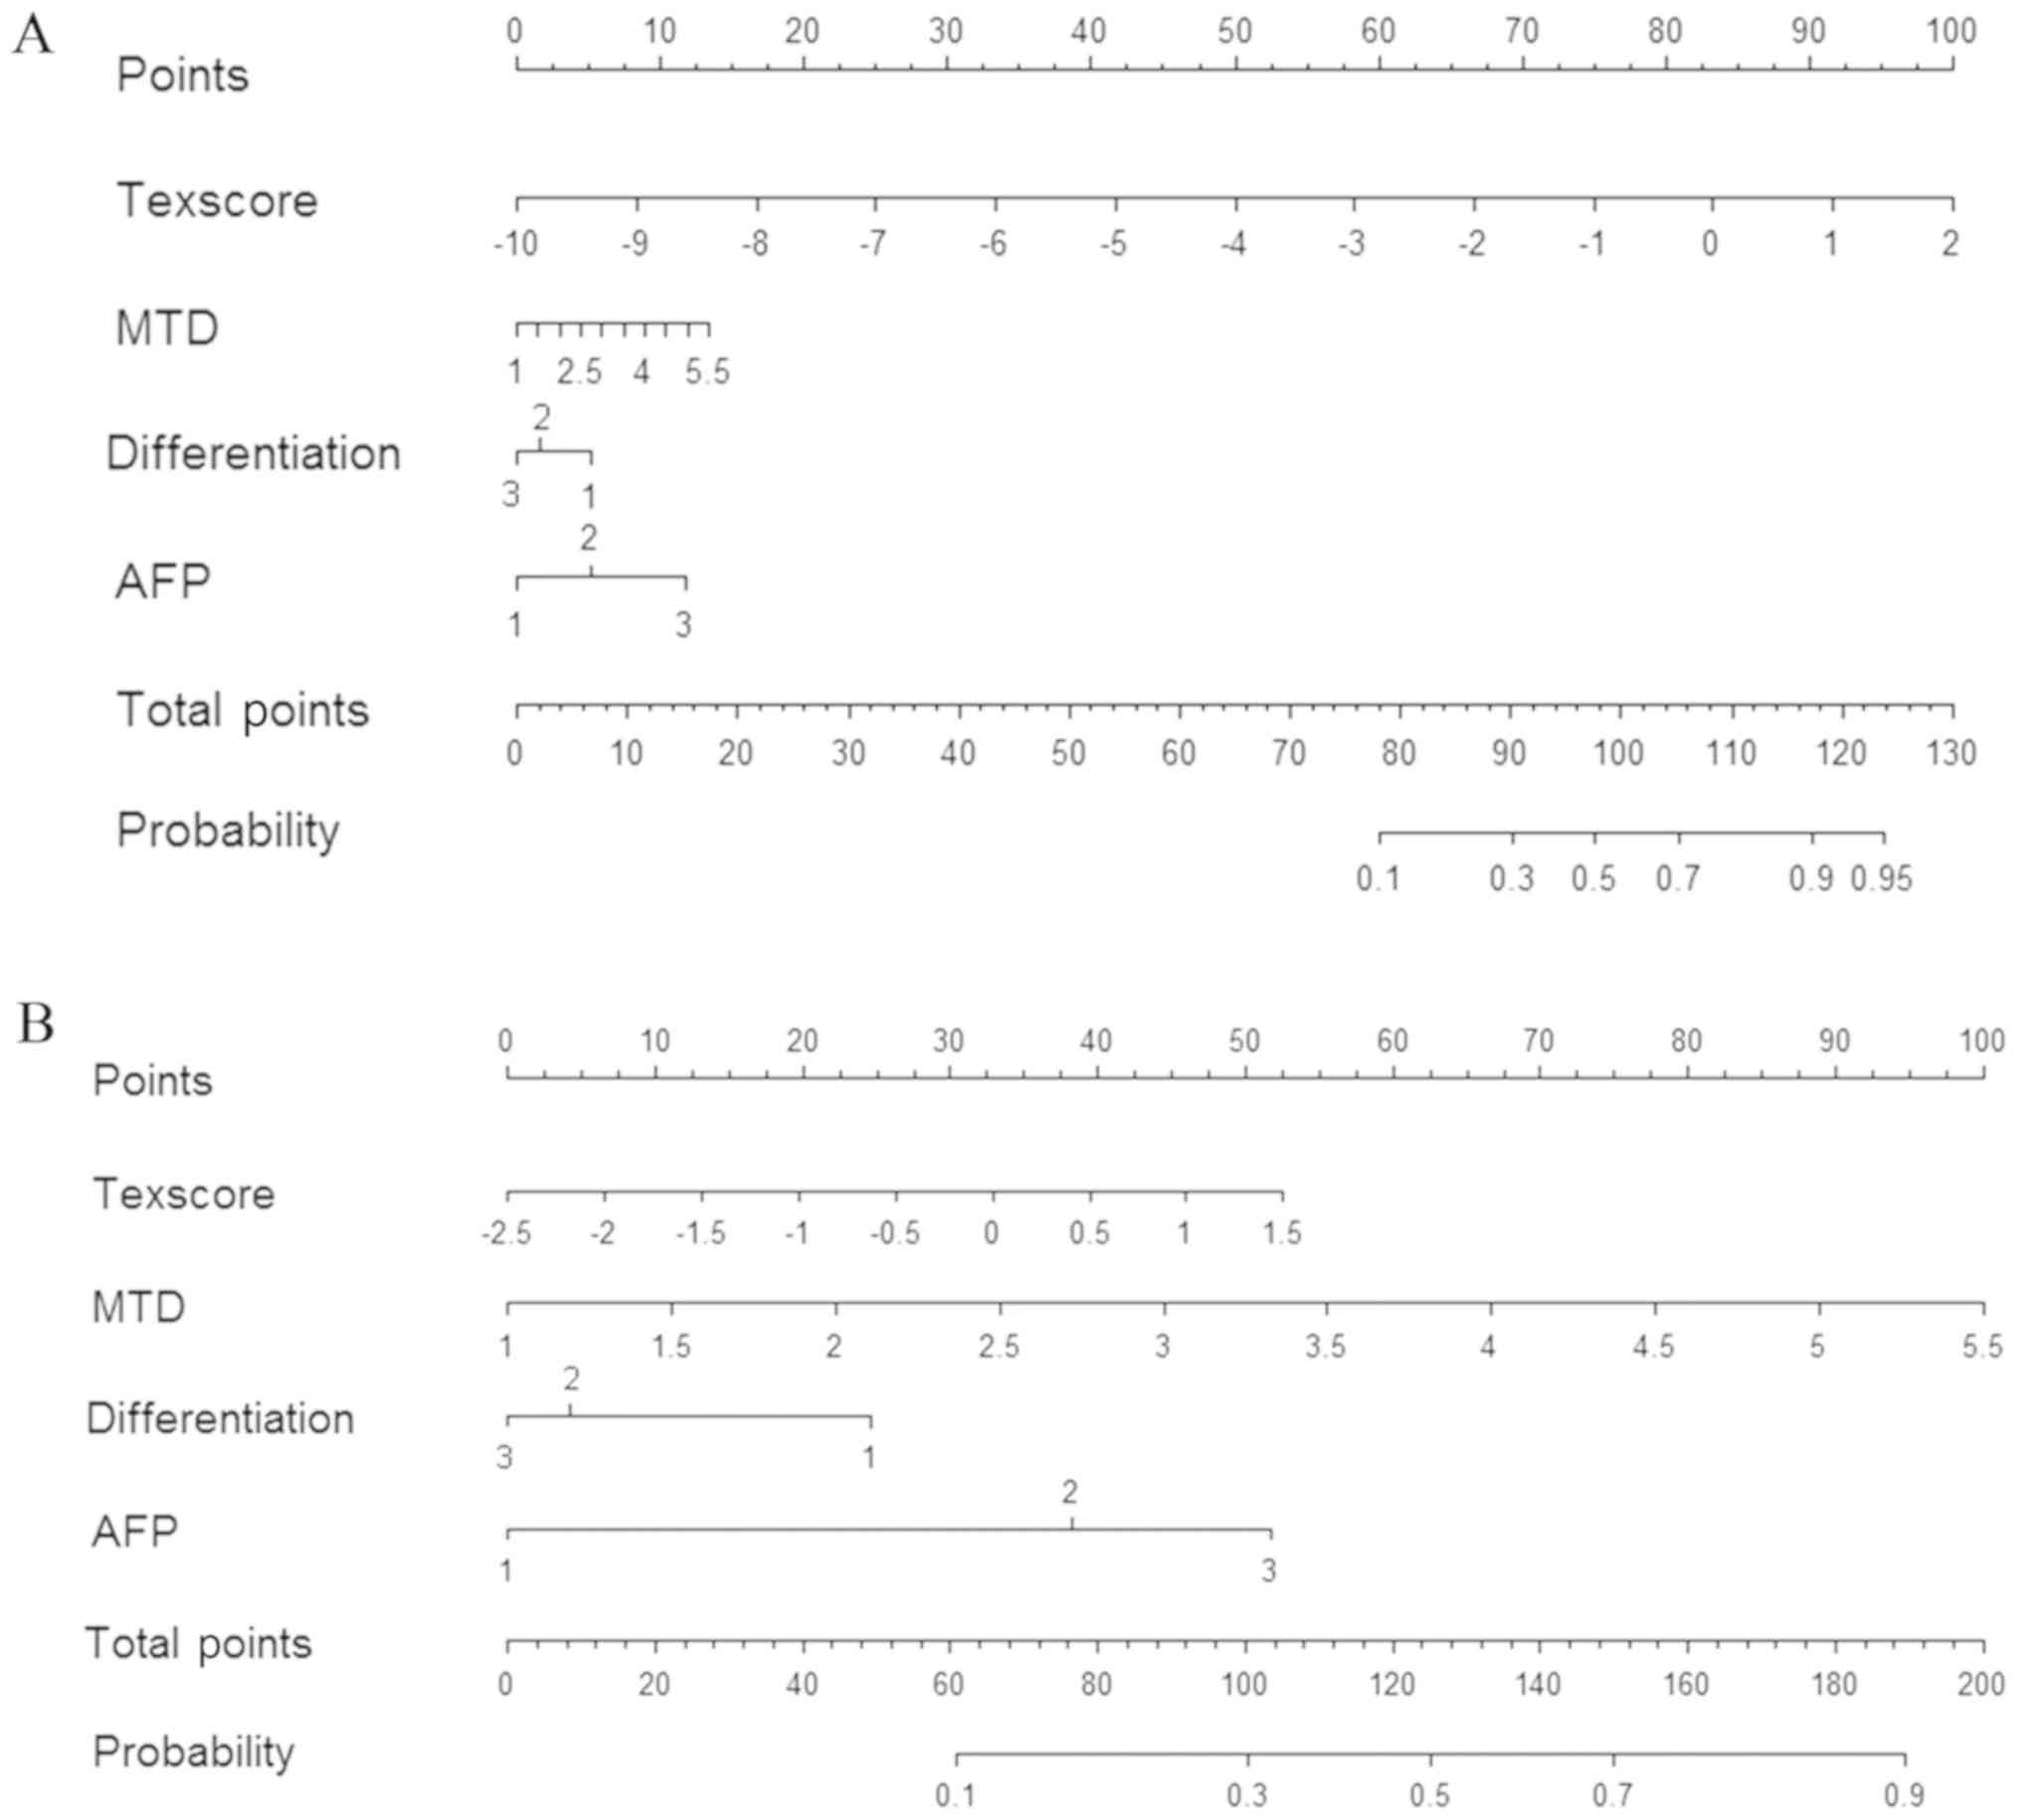
Nomograms in AP and PP
The nomograms integrating the features included in
the multivariate logistic regression analysis are displayed in
Fig. 4, which could visualize the
weight of different features in combined model. The concordance
indexes of the nomograms for MVI predictions in AP and PP were
0.810 [95% confidence interval (CI), 0.718–0.902] and 0.799 (95%
CI, 0.710–0.889), respectively.
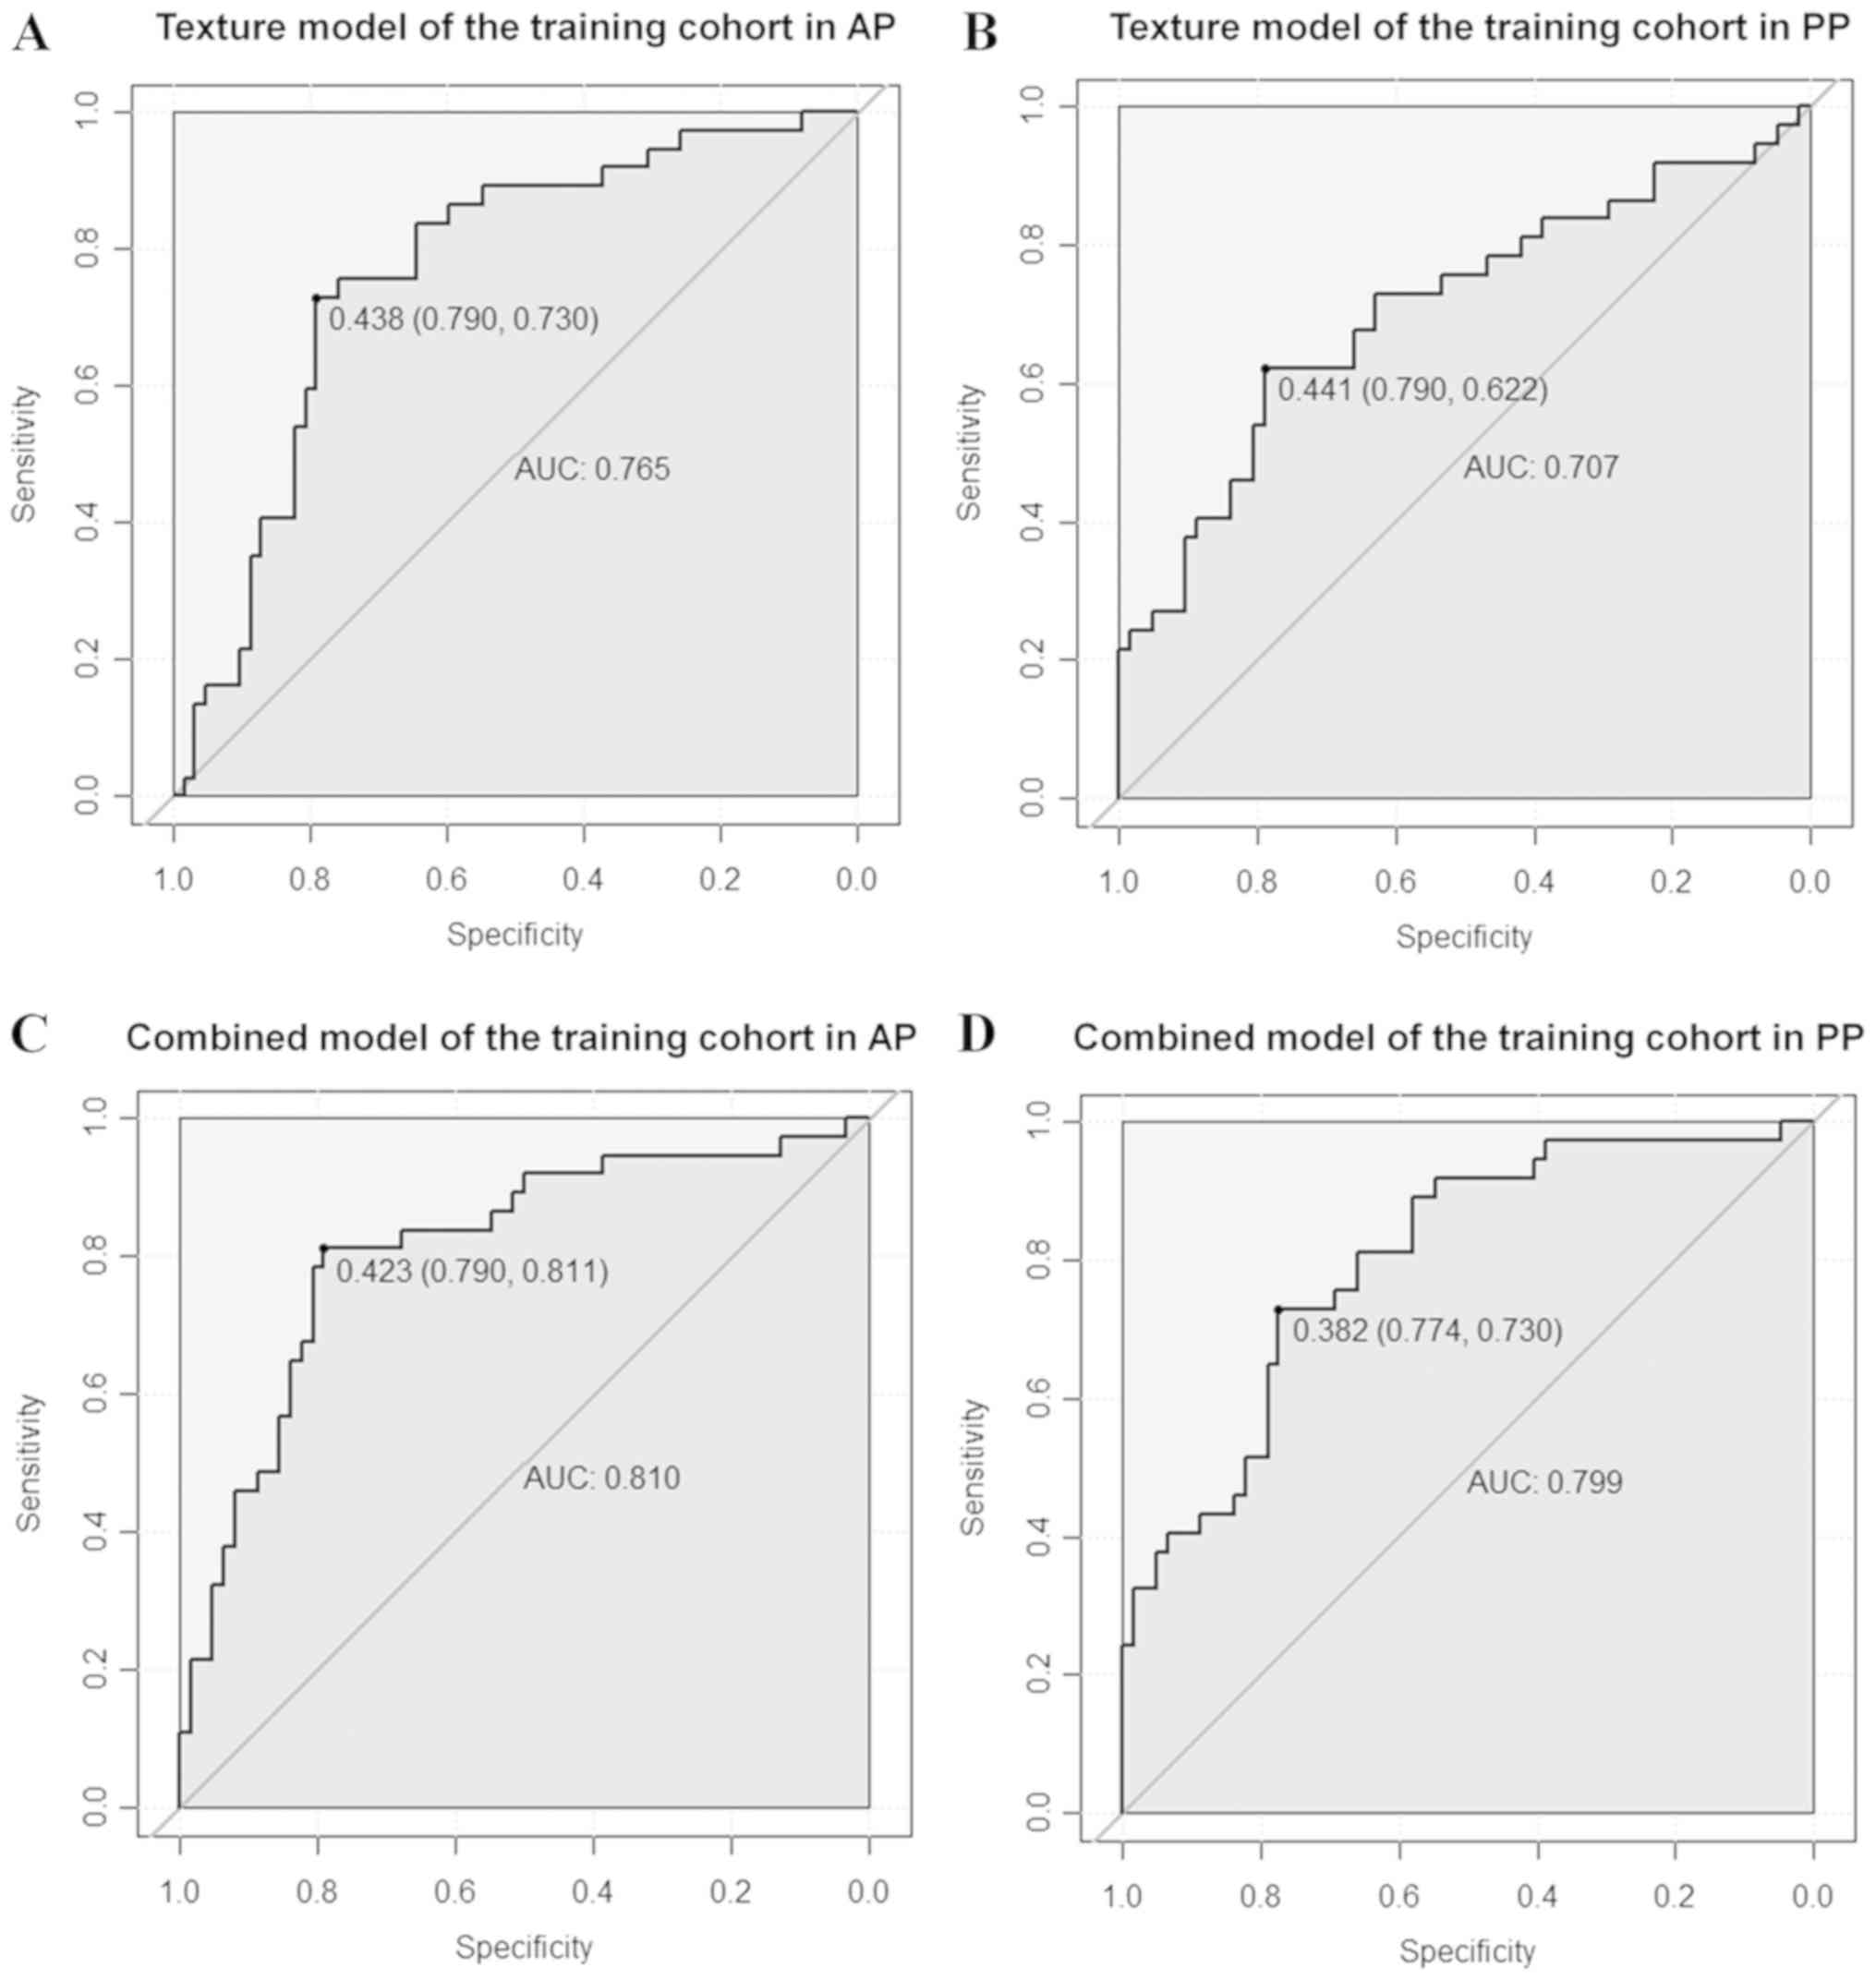
Predictive performance of MVI
For the training cohort, the ROC curves illustrating
the predictive performance of the texture and combined models in
predicting the MVI status are provided in Fig. 5. The AUC of the texture model was
0.765 vs. 0.707 in AP and PP, respectively. The AUC of the combined
model was 0.810 vs. 0.799 in AP and PP, respectively. The AUC, ACC,
sensitivity and specificity for each model are summarized in
Table VI.
| Table VI.Predictive performance of the texture
and combined models in predicting the microvascular invasion status
in the training and validation cohorts. |
Table VI.
Predictive performance of the texture
and combined models in predicting the microvascular invasion status
in the training and validation cohorts.
|
|
| Training cohort
(n=99) | Validation cohort
(n=43) |
|---|
|
|
|
|
|
|---|
| Model | Phase | AUC | ACC | SEN | SPE | AUC | ACC | SEN | SPE |
|---|
| Texture | AP | 0.765 | 0.768 | 0.730 | 0.790 | 0.773 | 0.791 | 0.750 | 0.815 |
|
| PP | 0.707 | 0.727 | 0.622 | 0.790 | 0.623 | 0.767 | 0.500 | 0.926 |
| Combined | AP | 0.810 | 0.798 | 0.811 | 0.790 | 0.794 | 0.837 | 0.812 | 0.852 |
|
| PP | 0.799 | 0.758 | 0.730 | 0.774 | 0.706 | 0.721 | 0.750 | 0.704 |
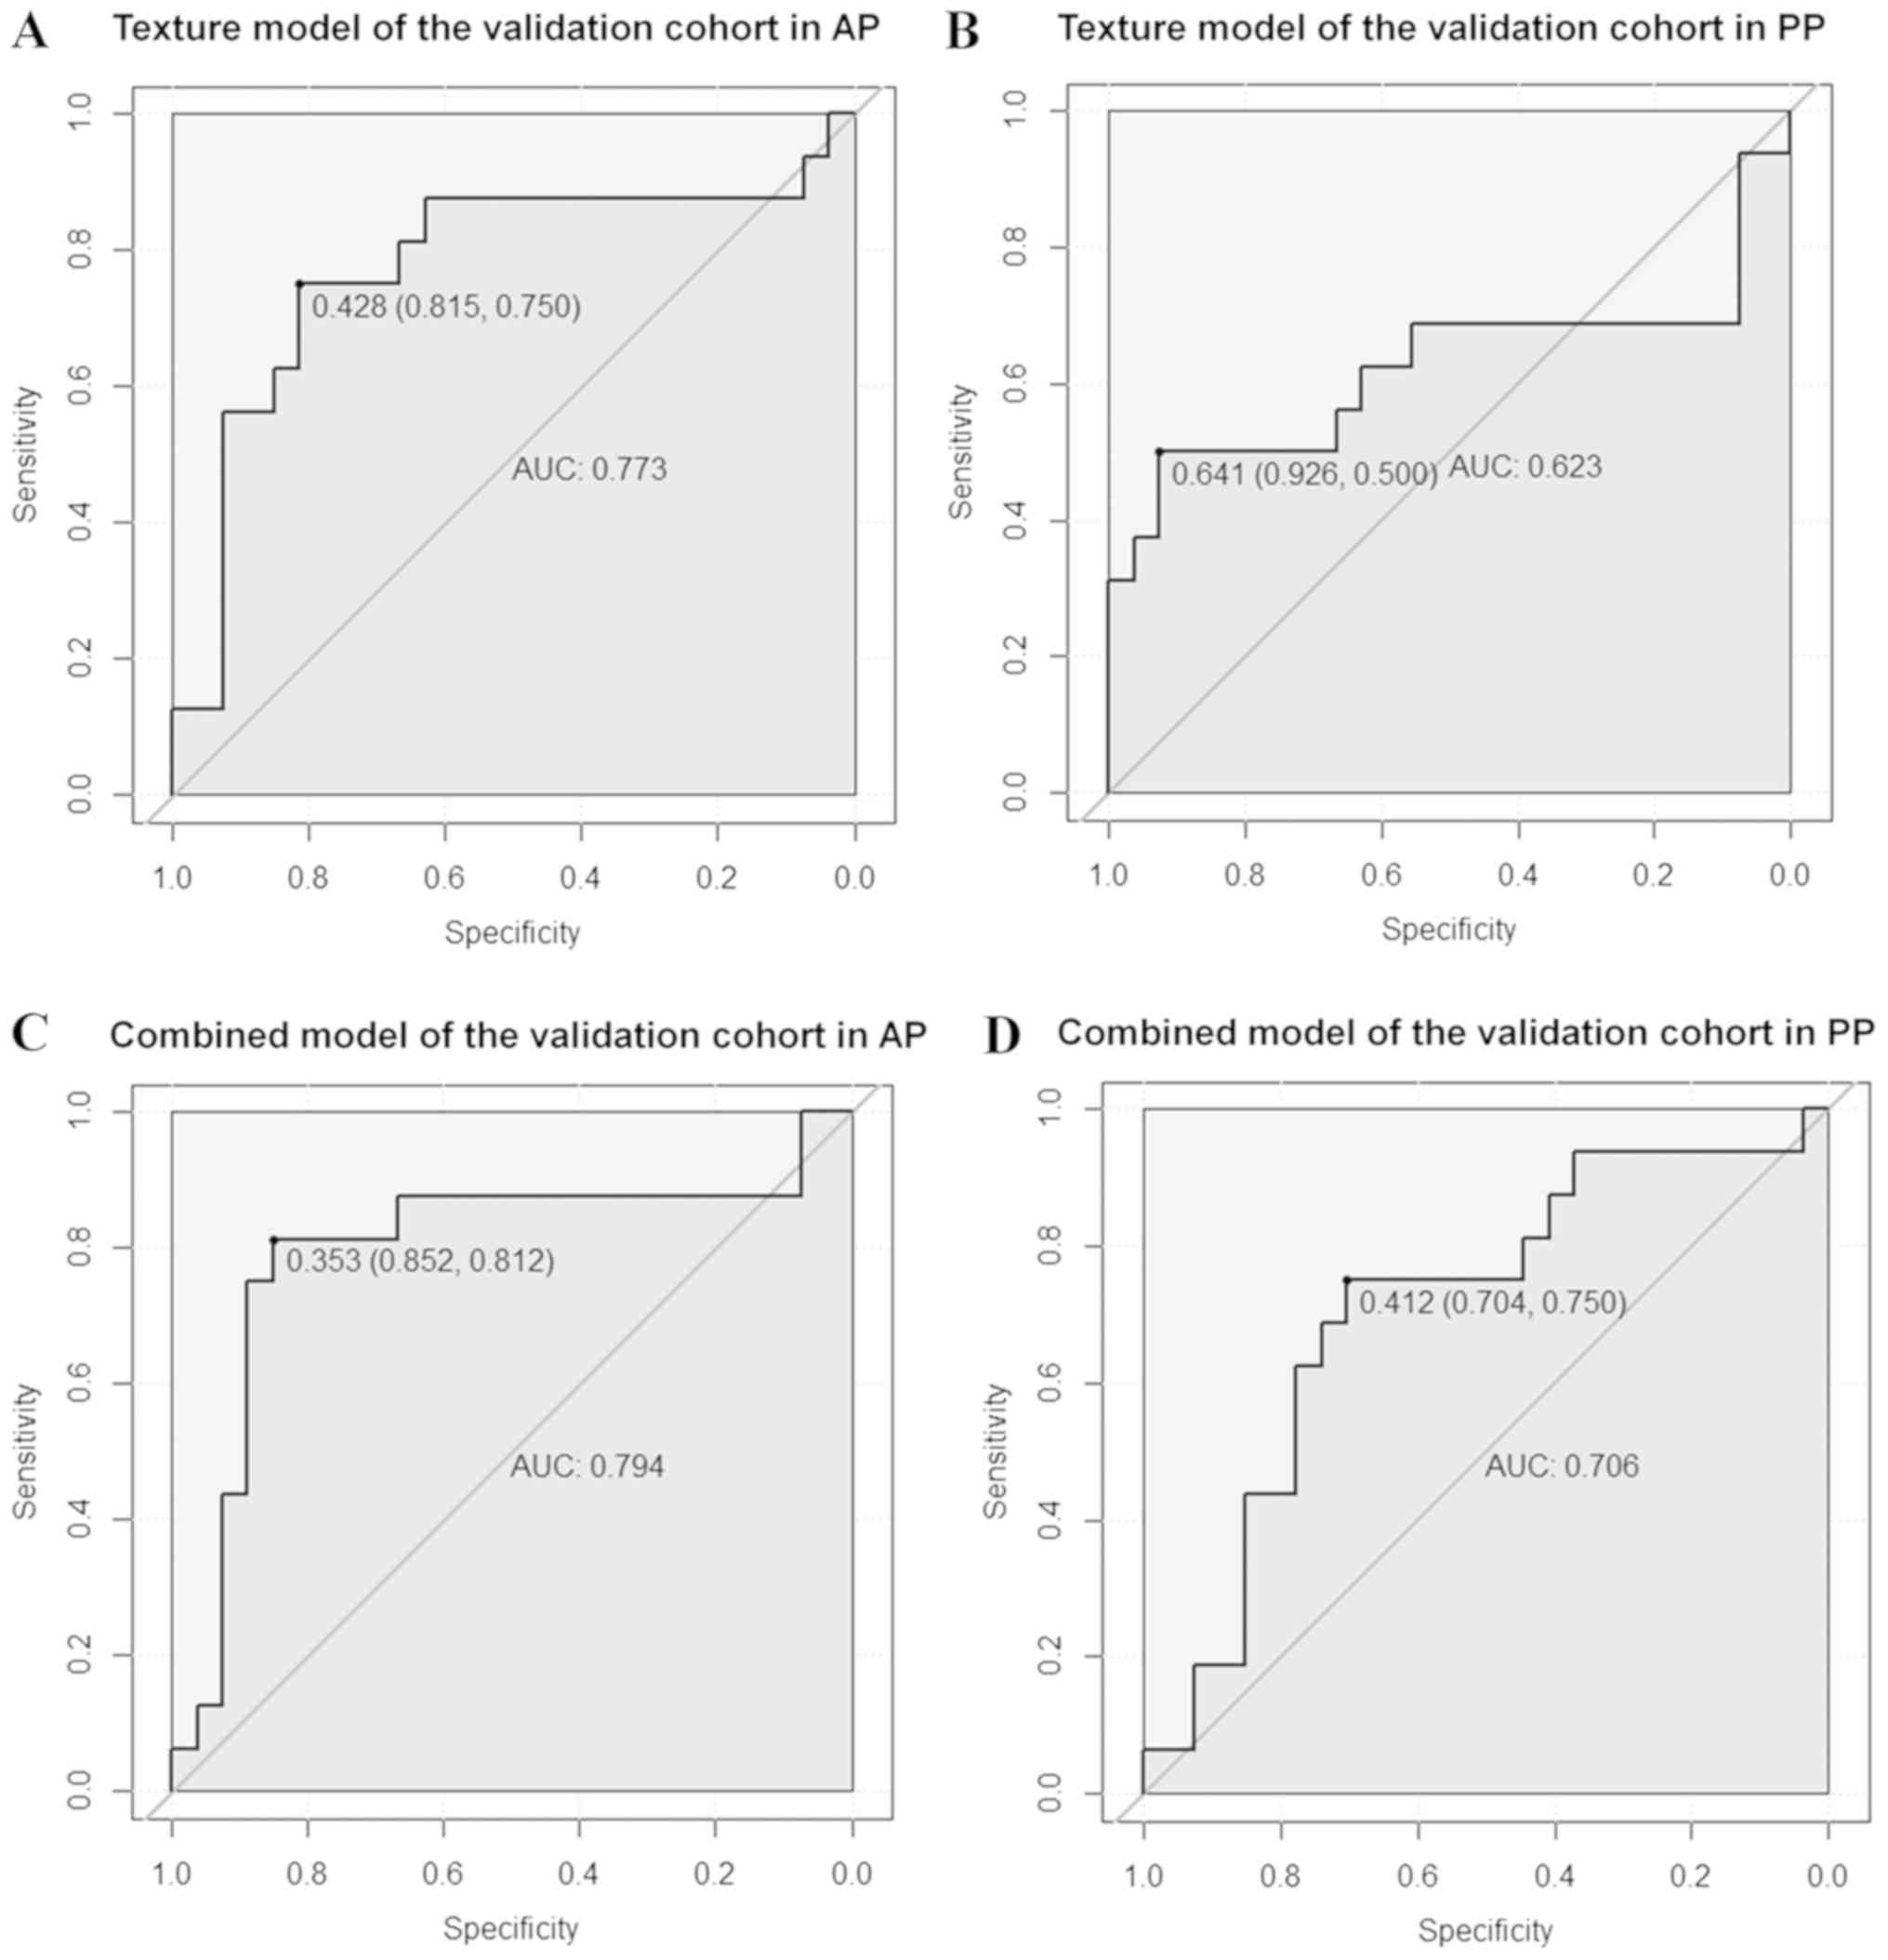
The validation cohort was used to verify the
accuracy of the model built in the training cohort. The ROC curves
of the texture and combined models for predicting the MVI status
are shown in Fig. 6. The AUC of the
texture model was 0.773 vs. 0.623 in AP and PP, respectively. The
AUC of the combined model was 0.794 vs. 0.706 in AP and PP,
respectively. The AUC, ACC, sensitivity and specificity for each
model are summarized in Table
VI.
Discussion
In the present study, a combined model was developed
based on preoperative 3D CE-MRI texture and clinical-radiological
features to predict MVI with a satisfactory discriminatory
performance. The results indicated that texture analysis is a
potentially useful adjunct for predicting MVI, and adding
clinical-radiological data could slightly improve the predictive
ability. In addition, the AP texture features performed better than
the PP texture features in MVI prediction.
The present study involved a total of 142 patients,
53 of which were MVI-positive patients and 89 MVI-negative. The
MVI-positive rate was consistent with the reported rate in the
literature (8), which was
approximately 30.0%. Previous studies have reported that the tumor
size of HCC was one of the most important predictive factors for
MVI (26,27). This is consistent with the results of
the current study. In the training cohort, MTD in the MP group
(3.82±0.88 cm) was significantly greater than that in the MN group
(3.21±0.94 cm) (P=0.002), since tumor size is an important feature
of tumor burden. Moreover, patients with poorer tumor histological
differentiation were observed in the MP group (P=0.026), and this
feature has been reported to be a predictor of MVI in previous
studies (28,29), possibly due to the high invasiveness
of poorly differentiated tumors. In the present study, the result
showed that the MP group tended to have higher AFP levels
(P=0.025). Serum AFP level is considered a marker of HCC, which has
also been reported to correlate with MVI (30). Nevertheless, the mechanism needs to
be further clarified. In the validation cohort, the above results
were confirmed again.
CE-MRI texture analysis of the AP and PP images was
used to build models for predicting the MVI status, and the AP
images showed better predictive ability than did the PP images.
Four texture features in AP (uniformity, ClusterProminence,
ClusterShade and LRLGLE) and five in PP (MinIntensity, GlcmEntropy,
sumAverage, sumEntropy and RLN) were entered into the multivariate
logistic regression analysis. These features frequently appeared in
texture or radiomics research and showed noteworthy diagnostic and
predictive efficiency, which could be explained by their
definitions (31,32). All these features reflect the
heterogeneity in an image from a different aspect, and were thus
related to tumor heterogeneity from a clinical point of view.
Previous studies have shown that tumor heterogeneity is related to
tumor differentiation, angiogenesis and prognosis (33,34). On
the basis of the current results, tumor heterogeneity may be
associated with the occurrence of MVI.
In the multivariate logistic regression analysis,
the directly enter mode was used to build the predictive model, but
the P-values of the texture features in the texture model were not
significant. The possible explanation was that all parameters were
equally important, and hence, no significant texture features were
observed in the regression. The combined model was also built by
adding the clinical-radiological features to the multivariate
logistic regression. The nomogram was used to visualize the
combined model and to reveal the weight of the
clinical-radiological and texture features. For clinical use of the
model, the total scores of each patient could be calculated based
on the nomogram. High scores corresponded to a high probability of
MVI occurrence. The nomogram showed that the texture signature
accounted for a higher proportion in the total points than did the
clinical-radiological features in AP.
In the ROC analysis, the combined model showed a
little better predictive performance than did the texture model in
the validation cohort both in AP (AUC, 0.794 vs. 0.773;
specificity, 0.852 vs. 0.815; sensitivity, 0.812 vs. 0.750) and in
PP (AUC, 0.706 vs. 0.623; specificity, 0.704 vs. 0.926;
sensitivity, 0.750 vs. 0.500). The predictive ability was better in
AP than in PP. The possible explanations might be that the blood
supply to the HCC is mainly dependent on the hepatic artery, and
that the AP image could more clearly reflect the changes in small
blood vessels in the HCC. Moreover, when MVI occurs, the local
hemodynamics of the liver tissue around the tumor changes.
Therefore, the changes in MRI texture features in AP were more
obvious than those in PP.
From a clinical perspective, the results of the
present study suggest that CE-MRI texture analysis may be an option
for preoperatively predicting MVI in HCC. This could alert
pathologists to conduct more detailed pathological examinations,
particularly when preoperative texture analysis suggests a high
possibility of MVI occurrence. Meanwhile, predicting the
possibility of MVI occurrence could also help clinicians select
more suitable surgical procedures for HCC patients. A number of
studies have shown that anatomic resection (35,36) and
wide resection SM (10) may provide
radical treatment in HCC patients with MVI. Intrahepatic metastases
resulting from MVI could also be reduced, thereby improving the
prognosis.
The present study had the following advantages.
First, to our knowledge, this was the first study to use 3D MRI
texture features to build a model for predicting the MVI status
preoperatively and noninvasively. The 3D VOI may have a better
predictive performance since MVI could occur in every slice, and 3D
feature analysis considers all of the available slices with
abundant information. Previous studies have also shown that 3D
features improved the diagnostic accuracy than did two-dimensional
features (37,38). Second, both the AP and PP images were
analyzed to compare their predictive performance. Third, training
and validation cohorts were used, making the model more objective.
Therefore, the process and method established in the present study
provide a basis for further computer-aided and
artificial-intelligence analyses for predicting MVI in HCC.
The current study also had several limitations.
First, this was a retrospective study with a single-center design;
therefore, selection bias was unavoidable. Second, the sample size
was small for texture analysis. More cases are needed to verify the
results. Third, the manual segmentation of tumors may have
introduced a certain amount of subjectivity. The MVI grade in the
positive group was not taken into account. Forth, the present study
did not include des-γ-carboxy-prothrombin (DCP) as it was not
tested routinely in our hospital, although a study has reported
that DCP was useful for prediction of MVI (39). At last, no follow-up and survival
analysis were performed, and hence, the relationship between
prognosis and texture features could not be further clarified.
In conclusion, model-based texture analysis of
CE-MRI could predict MVI in HCC preoperatively and noninvasively.
The AP image shows better predictive efficiency than PP image. The
combined model of AP with clinical-radiological features could
improve MVI prediction ability. It may be of value to clinicians in
objectively selecting appropriate treatment strategies and as an
individualized predictive tool for improving clinical outcomes.
Acknowledgements
Not applicable.
Funding
This study was supported by the Peking Union Medical
College Youth Fund and the Fundamental Research Funds for the
Central Universities (grant no. 2017320010), the Chinese Academy of
Medical Sciences (CAMS) Research Fund (grant no. ZZ2016B01) and the
CAMS Innovation Fund for Medical Sciences (grant no.
2016-I2M-1-001).
Availability of data and materials
The datasets used and/or analyzed during the current
study are available from the corresponding author on reasonable
request.
Authors' contributions
YJZ, SW, LMW, XHM and XMZ designed this study. YJZ,
BF and LMW acquired the patients and searched the database. YJZ and
BF participated in the process of texture analysis, including
segmentation and features extraction. JFW contributed to the
analysis and interpretation of data, including statistical
analysis, biostatistics and computational analysis. YJZ and XHM
were major contributors in writing the manuscript. All authors read
and approved the final manuscript.
Ethics approval and consent to
participate
The independent ethics committee of the Cancer
Hospital, Chinese Academy of Medical Sciences approved this
retrospective study and waived the requirement for informed patient
consent.
Patient consent for publication
Not applicable.
Competing interests
The authors declare that they have no competing
interests.
Glossary
Abbreviations
Abbreviations:
|
CE-MRI
|
contrast-enhanced magnetic resonance
imaging
|
|
MVI
|
microvascular invasion
|
|
HCC
|
hepatocellular carcinoma
|
|
3D
|
three-dimensional
|
|
AP
|
arterial phase
|
|
PP
|
portal-venous phase
|
|
ROC
|
receiver operating characteristic
|
|
AUC
|
area under the curve
|
|
SM
|
surgical margin
|
|
PET-CT
|
positron emission tomography-computed
tomography
|
|
MP
|
MVI-positive
|
|
MN
|
MVI-negative
|
|
AFP
|
α-fetoprotein
|
|
LAVA
|
liver acceleration volume
acquisition
|
|
MTD
|
maximum tumor diameter
|
|
VOI
|
volume of interest
|
|
GLCM
|
gray-level co-occurrence matrix
|
|
Texscore
|
texture signature score
|
|
ACC
|
overall accuracy
|
|
LRLGLE
|
LongRunLowGreyLevelEmphasis
|
|
RLN
|
RunLengthNonuniformity
|
|
CI
|
confidence interval
|
References
|
1
|
McGlynn KA, Petrick JL and London WT:
Global epidemiology of hepatocellular carcinoma: An emphasis on
demographic and regional variability. Clin Liver Dis. 19:223–238.
2015. View Article : Google Scholar : PubMed/NCBI
|
|
2
|
Torre LA, Bray F, Siegel RL, Ferlay J,
Lortet-Tieulent J and Jemal A: Global cancer statistics, 2012. CA
Cancer J Clin. 65:87–108. 2015. View Article : Google Scholar : PubMed/NCBI
|
|
3
|
Chen W, Zheng R, Baade PD, Zhang S, Zeng
H, Bray F, Jemal A, Yu XQ and He J: Cancer statistics in China,
2015. CA Cancer J Clin. 66:115–132. 2016. View Article : Google Scholar : PubMed/NCBI
|
|
4
|
Dhir M, Melin AA, Douaiher J, Lin C, Zhen
WK, Hussain SM, Geschwind JF, Doyle MB, Abou-Alfa GK and Are C: A
review and update of treatment options and controversies in the
management of hepatocellular carcinoma. Ann Surg. 263:1112–1125.
2016. View Article : Google Scholar : PubMed/NCBI
|
|
5
|
Forner A, Llovet JM and Bruix J:
Hepatocellular carcinoma. Lancet. 379:1245–1255. 2012. View Article : Google Scholar : PubMed/NCBI
|
|
6
|
Lim KC, Chow PK, Allen JC, Chia GS, Lim M,
Cheow PC, Chung AY, Ooi LL and Tan SB: Microvascular invasion is a
better predictor of tumor recurrence and overall survival following
surgical resection for hepatocellular carcinoma compared to the
Milan criteria. Ann Surg. 254:108–113. 2011. View Article : Google Scholar : PubMed/NCBI
|
|
7
|
Du M, Chen L, Zhao J, Tian F, Zeng H, Tan
Y, Sun H, Zhou J and Ji Y: Microvascular invasion (MVI) is a poorer
prognostic predictor for small hepatocellular carcinoma. BMC
Cancer. 14:382014. View Article : Google Scholar : PubMed/NCBI
|
|
8
|
Rodríguez-Perálvarez M, Luong TV, Andreana
L, Meyer T, Dhillon AP and Burroughs AK: A systematic review of
microvascular invasion in hepatocellular carcinoma: Diagnostic and
prognostic variability. Ann Surg Oncol. 20:325–339. 2013.
View Article : Google Scholar : PubMed/NCBI
|
|
9
|
Roayaie S, Blume IN, Thung SN, Guido M,
Fiel MI, Hiotis S, Labow DM, Llovet JM and Schwartz ME: A system of
classifying microvascular invasion to predict outcome after
resection in patients with hepatocellular carcinoma.
Gastroenterology. 137:850–855. 2009. View Article : Google Scholar : PubMed/NCBI
|
|
10
|
Hirokawa F, Hayashi M, Miyamoto Y, Asakuma
M, Shimizu T, Komeda K, Inoue Y and Uchiyama K: Outcomes and
predictors of microvascular invasion of solitary hepatocellular
carcinoma. Hepatol Res. 44:846–853. 2014. View Article : Google Scholar : PubMed/NCBI
|
|
11
|
Chou CT, Chen RC, Lin WC, Ko CJ, Chen CB
and Chen YL: Prediction of microvascular invasion of hepatocellular
carcinoma: Preoperative CT and histopathologic correlation. AJR Am
J Roentgenol. 203:W253–W259. 2014. View Article : Google Scholar : PubMed/NCBI
|
|
12
|
Lee S, Kim SH, Lee JE, Sinn DH and Park
CK: Preoperative gadoxetic acid-enhanced MRI for predicting
microvascular invasion in patients with single hepatocellular
carcinoma. J Hepatol. 67:526–534. 2017. View Article : Google Scholar : PubMed/NCBI
|
|
13
|
Xu P, Zeng M, Liu K, Shan Y, Xu C and Lin
J: Microvascular invasion in small hepatocellular carcinoma: Is it
predictable with preoperative diffusion-weighted imaging? J
Gastroenterol Hepatol. 29:330–336. 2014. View Article : Google Scholar : PubMed/NCBI
|
|
14
|
Ahn SY, Lee JM, Joo I, Lee ES, Lee SJ,
Cheon GJ, Han JK and Choi BI: Prediction of microvascular invasion
of hepatocellular carcinoma using gadoxetic acid-enhanced MR and
(18)F-FDG PET/CT. Abdom Imaging. 40:843–851. 2015. View Article : Google Scholar : PubMed/NCBI
|
|
15
|
Castellano G, Bonilha L, Li LM and Cendes
F: Texture analysis of medical images. Clin Radiol. 59:1061–1069.
2004. View Article : Google Scholar : PubMed/NCBI
|
|
16
|
Scalco E and Rizzo G: Texture analysis of
medical images for radiotherapy applications. Br J Radiol.
90:201606422017. View Article : Google Scholar : PubMed/NCBI
|
|
17
|
Canellas R, Burk KS, Parakh A and Sahani
DV: Prediction of pancreatic neuroendocrine tumor grade based on CT
features and texture analysis. AJR Am J Roentgenol. 210:341–346.
2018. View Article : Google Scholar : PubMed/NCBI
|
|
18
|
Bashir U, Siddique MM, Mclean E, Goh V and
Cook GJ: Imaging heterogeneity in lung cancer: Techniques,
applications, and challenges. AJR Am J Roentgenol. 207:534–543.
2016. View Article : Google Scholar : PubMed/NCBI
|
|
19
|
Giganti F, Antunes S, Salerno A, Ambrosi
A, Marra P, Nicoletti R, Orsenigo E, Chiari D, Albarello L,
Staudacher C, et al: Gastric cancer: Texture analysis from
multidetector computed tomography as a potential preoperative
prognostic biomarker. Eur Radiol. 27:1831–1839. 2017. View Article : Google Scholar : PubMed/NCBI
|
|
20
|
Chamming's F, Ueno Y, Ferré R, Kao E,
Jannot AS, Chong J, Omeroglu A, Mesurolle B, Reinhold C and Gallix
B: Features from computerized texture analysis of breast cancers at
pretreatment MR imaging are associated with response to neoadjuvant
chemotherapy. Radiology. 286:412–420. 2018. View Article : Google Scholar : PubMed/NCBI
|
|
21
|
Nakajo M, Jinguji M, Nakajo M, Shinaji T,
Nakabeppu Y, Fukukura Y and Yoshiura T: Texture analysis of FDG
PET/CT for differentiating between FDG-avid benign and metastatic
adrenal tumors: Efficacy of combining SUV and texture parameters.
Abdom Radiol (NY). 42:2882–2889. 2017. View Article : Google Scholar : PubMed/NCBI
|
|
22
|
Li Z, Mao Y, Huang W, Li H, Zhu J, Li W
and Li B: Texture-based classification of different single liver
lesion based on SPAIR T2W MRI images. BMC Med Imaging. 17:422017.
View Article : Google Scholar : PubMed/NCBI
|
|
23
|
Kloth C, Thaiss WM, Kärgel R, Grimmer R,
Fritz J, Ioanoviciu SD, Ketelsen D, Nikolaou K and Horger M:
Evaluation of texture analysis parameter for response prediction in
patients with hepatocellular carcinoma undergoing drug-eluting bead
transarterial chemoembolization (DEB-TACE) using biphasic
contrast-enhanced CT image data: Correlation with liver perfusion
CT. Acad Radiol. 24:1352–1363. 2017. View Article : Google Scholar : PubMed/NCBI
|
|
24
|
Gu Y, She Y, Xie D, Dai C, Ren Y, Fan Z,
Zhu H, Sun X, Xie H, Jiang G and Chen C: A texture analysis-based
prediction model for lymph node metastasis in stage IA lung
adenocarcinoma. Ann Thorac Surg. 106:214–220. 2018. View Article : Google Scholar : PubMed/NCBI
|
|
25
|
Obuchowski NA: Receiver operating
characteristic curves and their use in radiology. Radiology.
229:3–8. 2003. View Article : Google Scholar : PubMed/NCBI
|
|
26
|
Pawlik TM, Delman KA, Vauthey JN, Nagorney
DM, Ng IO, Ikai I, Yamaoka Y, Belghiti J, Lauwers GY, Poon RT and
Abdalla EK: Tumor size predicts vascular invasion and histologic
grade: Implications for selection of surgical treatment for
hepatocellular carcinoma. Liver Transpl. 11:1086–1092. 2005.
View Article : Google Scholar : PubMed/NCBI
|
|
27
|
Kim SJ, Lee KK and Kim DG: Tumor size
predicts the biological behavior and influence of operative
modalities in hepatocellular carcinoma. Hepatogastroenterology.
57:121–126. 2010.PubMed/NCBI
|
|
28
|
Kaibori M, Ishizaki M, Matsui K and Kwon
AH: Predictors of microvascular invasion before hepatectomy for
hepatocellular carcinoma. J Surg Oncol. 102:462–468. 2010.
View Article : Google Scholar : PubMed/NCBI
|
|
29
|
Shirabe K, Toshima T, Kimura K, Yamashita
Y, Ikeda T, Ikegami T, Yoshizumi T, Abe K, Aishima S and Maehara Y:
New scoring system for prediction of microvascular invasion in
patients with hepatocellular carcinoma. Liver Int. 34:937–941.
2014. View Article : Google Scholar : PubMed/NCBI
|
|
30
|
Lei Z, Li J, Wu D, Xia Y, Wang Q, Si A,
Wang K, Wan X, Lau WY, Wu M and Shen F: Nomogram for preoperative
estimation of microvascular invasion risk in hepatitis B
virus-related hepatocellular carcinoma within the Milan criteria.
JAMA Surg. 151:356–363. 2016. View Article : Google Scholar : PubMed/NCBI
|
|
31
|
Giganti F, Marra P, Ambrosi A, Salerno A,
Antunes S, Chiari D, Orsenigo E, Esposito A, Mazza E, Albarello L,
et al: Pre-treatment MDCT-based texture analysis for therapy
response prediction in gastric cancer: Comparison with tumour
regression grade at final histology. Eur J Radiol. 90:129–137.
2017. View Article : Google Scholar : PubMed/NCBI
|
|
32
|
Zhou Y, He L, Huang Y, Chen S, Wu P, Ye W,
Liu Z and Liang C: CT-based radiomics signature: A potential
biomarker for preoperative prediction of early recurrence in
hepatocellular carcinoma. Abdom Radiol (NY). 42:1695–1704. 2017.
View Article : Google Scholar : PubMed/NCBI
|
|
33
|
Liu S, Liu S, Ji C, Zheng H, Pan X, Zhang
Y, Guan W, Chen L, Guan Y, Li W, et al: Application of CT texture
analysis in predicting histopathological characteristics of gastric
cancers. Eur Radiol. 27:4951–4959. 2017. View Article : Google Scholar : PubMed/NCBI
|
|
34
|
Lubner MG, Stabo N, Abel EJ, Del Rio AM
and Pickhardt PJ: CT textural analysis of large primary renal cell
carcinomas: Pretreatment tumor heterogeneity correlates with
histologic findings and clinical outcomes. AJR Am J Roentgenol.
207:96–105. 2016. View Article : Google Scholar : PubMed/NCBI
|
|
35
|
Zhao WC, Fan LF, Yang N, Zhang HB, Chen BD
and Yang GS: Preoperative predictors of microvascular invasion in
multinodular hepatocellular carcinoma. Eur J Surg Oncol.
39:858–864. 2013. View Article : Google Scholar : PubMed/NCBI
|
|
36
|
Hasegawa K, Kokudo N, Imamura H, Matsuyama
Y, Aoki T, Minagawa M, Sano K, Sugawara Y, Takayama T and Makuuchi
M: Prognostic impact of anatomic resection for hepatocellular
carcinoma. Ann Surg. 242:252–259. 2005. View Article : Google Scholar : PubMed/NCBI
|
|
37
|
Ng F, Kozarski R, Ganeshan B and Goh V:
Assessment of tumor heterogeneity by CT texture analysis: Can the
largest cross-sectional area be used as an alternative to whole
tumor analysis? Eur J Radiol. 82:342–348. 2013. View Article : Google Scholar : PubMed/NCBI
|
|
38
|
Xu Y, van Beek EJ, Hwanjo Y, Guo J,
McLennan G and Hoffman EA: Computer-aided classification of
interstitial lung diseases via MDCT: 3D adaptive multiple feature
method (3D AMFM). Acad Radiol. 13:969–978. 2006. View Article : Google Scholar : PubMed/NCBI
|
|
39
|
Imura S, Teraoku H, Yoshikawa M, Ishikawa
D, Yamada S, Saito Y, Iwahashi S, Ikemoto T, Morine Y and Shimada
M: Potential predictive factors for microvascular invasion in
hepatocellular carcinoma classified within the Milan criteria. Int
J Clin Oncol. 23:98–103. 2018. View Article : Google Scholar : PubMed/NCBI
|