Introduction
Breast cancer (BRCA) is the most common type of
cancer in women globally (1) and is
characterized by notable heterogeneity (2). The expression levels of estrogen and
progesterone receptors (ER/PR) and human epidermal growth factor
receptor (HER2) have been investigated to further classify BRCA
into numerous subtypes: Luminal (ER+/PR+),
HER2-positive (ER−/PR−/HER2+),
basal-like or triple negative
(ER−/PR−/HER2−), claudin-low and
normal-like BRCA (3). Based on these
guidelines (4), ~70% of patients
with BRCA may be classified as the luminal subtype (5). Endocrine therapy (ET), one of the
crucial adjuvant treatments for luminal BRCA, suppresses tumor
growth by targeting the ER signaling pathways. Unfortunately,
>30% of ER-positive tumor types are intrinsically
endocrine-resistant at diagnosis; ~40% of breast tumor types that
initially respond to ET eventually acquire resistance (6). Additionally, the clinical
characteristics of BRCA may be notably heterogeneous even when
similar expression levels of ER are observed (7).
ET resistance in ER-positive tumor cells may be
ascribed to a variety of factors, including the
post-transcriptional modifications of ERs (8,9) or
activation of the ER-independent growth factor signaling pathways
(10); however, these results have
not been further investigated for the effective clinical treatment
of BRCA (11,12). Upon metastasis, surgical intervention
and present second-line therapeutic strategies have limited
effectiveness. Thus, precisely predicting the prognosis of patients
with BRCA and ET resistance is vital for generating the most
appropriate individualized treatment.
As ER status alone is inadequate for identifying
patients responsive to ET, multi-gene signatures from gene
transcripts have been obtained via analyses with Oncotype DX
(13) and MammaPrint tests (14). The expression profiles of these
biomarkers may substantially aid the prediction of therapeutic
outcomes and the selection of adjuvant therapy (3); however, transcriptional expression may
be regulated by a variety of factors and appears to be unstable.
Additionally, gene transcripts may not reflect marked changes in
regulatory mechanisms, including epigenetic alterations, which may
result in disease susceptibility. This represents a limitation of
current molecular diagnostic tools based on gene expression assays
(15).
DNA methylation is a chemical modification of DNA
that does not result in alterations in its sequence and may be
inherited during cell division. It is well established that notable
alterations to the genome-wide DNA methylation landscape may occur
in the early stages of cancer initiation and during cancer
progression, and throughout the acquisition of drug resistance
(16,17). The hypermethylation of tumor
suppressor genes or the hypomethylation of oncogenes maybe
associated with the development of BRCA (18,19). DNA
methylation is an enzymatic process and may be reversed by
epigenetic inhibitors (17).
Compared with genetic transcription (mRNA), DNA is inherently
stable and may be obtained from numerous sources, including tissue,
plasma, saliva and urine (20).
Therefore, the DNA methylation profile is promising for identifying
patients susceptible to ET. In addition, specific epigenotypes have
been identified for the characterization and molecular subtyping of
BRCA (21–23); however, few studies focusing on the
DNA methylome associated with endocrine-resistant BRCA have been
conducted. Furthermore, previous studies have revealed that
remodeling of the epigenome is associated with the
endocrine-resistant cell phenotype (24,25).
Thus, DNA methylation signatures may serve as predictive biomarkers
to identify ET-responsive patients with BRCA.
DNA methylation levels maybe simultaneously
determined via microarray analyses of numerous CpGs. An increasing
number of genome-wide DNA methylation profiles of various types of
cancer are available from public databases (26). Previous studies have revealed the
importance of methylation in genomic regions compared with that at
a single CpG island (27,28). A genome-wide bump hunting approach,
introduced by Jaffe et al (29), was originally designed to identify
differentially methylated regions (DMRs) detected on numerous
microarray platforms, including the Infinium HumanMethylation450
BeadArray (HM450 array). This approach was demonstrated to
effectively model expression profiles without measurement errors,
remove batch effects and detect regions of interest. The present
study aimed to identify a novel predictive classifier of BRCA by
applying the bump hunting method and logistic regression to The
Cancer Genome Atlas (TCGA) BRCA datasets on the basis of the DNA
methylation profile of BRCA. The results of the present study may
aid the identification of patients susceptible to endocrine
resistance.
Materials and methods
Data downloading and processing
The DNA methylation profiles associated with BRCA
were determined using an HM450 array; the corresponding RNA
sequencing data (IlluminaHiSeq_RNASeqV2 arrays; measured using RSEM
software; version 1.2.31) (30) and
detailed clinicopathological features, including ET information,
were downloaded from TCGA (accessed: January 2016; known as the
Genomic Data Common Data Portal; http://portal.gdc.cancer.gov/); there were a total of
885 and 1,213 tumor/adjacent tissues with DNA methylation and RNA
sequencing data, respectively. Among them, 787 tumor/adjacent
tissues possessed both DNA methylation and RNA sequencing data.
These samples were used to examine the association between DNA
methylation and mRNA expression for the DMRs included in the
predictive classifier. Additionally, two DNA methylation datasets
based on HM450 array analysis, namely GSE75067 (31) and GSE72251 (32) from the Gene Expression Omnibus
database (33) (http://www.ncbi.nlm.nih.gov/geo/), were used as
independent datasets to assess the predictive potential of DNA
methylation as a classifier of endocrine resistance.
Patient enrollment
In order to investigate the DNA methylation patterns
associated with sensitivity to ET, inclusion criteria for patient
enrollment were set. In the present study, all patients were: i)
Diagnosed with BRCA; ii) female and ≤75-year-old; iii) positive for
tumor types of tumor, node and metastasis (TNM) stage <4
(34,35) and ERα expression; and iv) treated
with ET. Consequently, of the 1,097 patients with BRCA, 404
patients were selected. Of these patients, those with disease free
survival (DFS) ≤30 months were regarded to resist ET and were
defined as the resistant to ET (RTE) group. Those with DFS >100
months were classified as the sensitive to ET (STE) group; patients
without DNA methylation data were excluded. Furthermore, there were
11 and 21 patients in the RTE and STE groups, respectively; the
data of these patients were included for the predictive classifier
building. Either a Fisher's exact test or a Student's t-test were
conducted to determine differences of clinicopathological features
between these two groups.
Model construction and selection
The level 3 DNA methylation β-value of BRCA from
TCGA was defined as the percentage of DNA methylation in the tissue
samples at each CpG probe; the methylation ranged from 0.0
(unmethylated) to 1.0 (fully methylated). In the present study, the
M-value [logit(β)] was used instead of the β-value to calculate the
test statistics; however, for ease of interpretation, the β-value
was employed to report differences in methylation levels between
the groups. The association between M- and β-values were determined
as follows: M-value=Log2[β-value/(1-β-value)].
For the identification of DMRs, CpG sites that did
not target specific genes and sites without data in any patients
were excluded. Additionally, differential expression analysis was
conducted to reveal the DMRs between the RTE and SET groups with
the R-package ‘bumphunter’ (version 1.10.0) (29). This package was used to determine
regions of methylation that deviated from the baseline values. DMRs
were defined as genomic regions of differential methylation between
two populations with a P-value <0.001 and covering ≥3 CpG sites.
The diagnostic potential of these DMRs was further investigated by
producing receiver operating characteristic curves (ROCs) and
calculating the area under the curve (AUC). The median β-value
across the CpG sites in each DMR (mS) was
calculated and the difference of mS between the
two groups (d) was determined. Finally, DMRs with an AUC
≥0.6 and |d|>0.2 were included to build the predictive
classifier, and were ranked in an ascending order of P-values
obtained from the bumphunter analysis.
In the first step of the classifier building, 3 DMRs
per analysis were added into the predictive classifier. The mean
mS of each DMR across all patients in the STE
group, representing relatively normal DNA methylation, was
calculated as mR. In the second step, a Pearson's
correlation coefficient was calculated between the
mR and mS of each patient,
labeled as the rP value (−1 to 1). A positive
rP value represented the expression profile,
indicating an association with patients in the STE group;
otherwise, the expression profile of patients was considered to be
less associated with the STE group. In step three, the effect of
rP values on the prediction of patients with
ER-positive BRCA resistant to ET was evaluated via the logistic
regression analysis; the predictive classifier was then generated.
Simultaneously, ROCs in addition to the AUC were used to assess the
diagnostic potential of the predictive classifier. A 95% confidence
interval (CI) of the AUC was calculated according to the order of
the observed AUC values among 1,000 permutations. Finally, for the
model selection, the Akaike information criterion (AIC) was used to
determine the goodness of fit and the simplicity of the classifier.
As aforementioned, 3 DMRs were included each time and the process
(steps 1–3) was repeated until all 80 DMRs were included. A risk
score (RS) was then able to be calculated based on the final
classifier.
Model validation
As public datasets with both DNA methylation
(determined via an HM450 array) and treatment information were
unavailable, patients with ER-positive BRCA without explicit
information regarding ET were used. The independent datasets,
GSE75067 and GSE72251, which determined DNA methylation in 87 and
70 patients with ER-positive BRCA, respectively, were used as
external validations of the predictive classifier. An RS was
assigned to each patient; Kaplan-Meier (KM) survival analysis was
then performed to investigate the association between RS and
cumulative rates of overall survival (OS) and invasive disease-free
survival (IDFS). As for GSE75067, univariate and multivariate
analyses using Cox regressions were also performed to screen out
the independent factors affecting OS.
Identification of the function of
genes included in DMRs
Functional enrichment analysis was performed using
the R-package ‘clusterProfiler’ (version 3.6.0) (36) to investigate the well-known database,
Gene Ontology (GO; http://geneontology.org/) (37,38). The
specific genes, which were mapped by DMR analysis, were annotated
with GO ‘biological process’ (BP), ‘molecular function’ (MF) and
‘cellular component’ (CC) terms. GO terms of P<0.01 and
Pa<0.05 obtained via the Benjamini and Hochberg
method (39) were considered to be
statistically enriched.
Correlation between DNA methylation
and mRNA transcripts
Pearson's correlation coefficients were further
calculated to reveal the correlation between DNA methylation and
mRNA expression. Since the sample sizes of the groups were limited,
the data of 787 tumor/adjacent tissues in the TCGA dataset were
employed for the correlation analysis. Since one DMR could contain
several CpG sites mapped to one specific gene, several Pearson's
correlation analyses were conducted separately to examine the
associations between these CpG sites and the mRNA level of the
gene. The CpG site in a specific DMR with the lowest P-value was
demonstrated to exhibit the strongest correlation with the mRNA
expression, and presented.
Effects of numerous specific genes on
relapse-free survival (RFS)
KM Plotter (http://kmplot.com/analysis/) (40,41), a
tool containing the gene expression and survival data of >4,000
patients with BRCA, was used to perform KM survival analyses to
further assess the association between mRNA expression and RFS.
Patients with ER-positive BRCA and ET were selected, and divided
into the high and low expression groups based on the median
expression levels of each specific gene. Subsequently, survival
curves were created and log-rank tests were conducted.
Results
Identification of DMRs associated with
the response to ET in patients with ER-positive BRCA
As presented in Fig.
1A, patients with BRCA meeting the inclusion criteria were
divided into two groups according to their DFS, namely the RTE and
STE groups. Detailed clinicopathological and treatment information
of these 32 patients were presented in Table I. Of them, five patients had received
tamoxifen, while 14 patients had been treated with aromatase
inhibitors (anastrozole, letrozole and aromasin). The remaining
patients were treated with one type of these drugs for a period of
time, and subsequently treated with another type. A Fisher's exact
test and a Student's t-test were conducted to determine differences
between these two groups. No statistically significant differences
in TNM stage and receptors status were observed between the two
groups. In the RTE group, the tumor types of eight patients (8/11,
72.7%) were TNM stage II and three (3/11, 27.3%) were TNM stage
III; however, in the STE group, five (5/21, 23.8%), 12 (12/21,
57.1%) and four (4/21, 19.0%) tumor types were classified as TNM I,
II and III stages (P=0.205), respectively. As for receptor status,
nine tumor types (9/11, 81.8%) from the RTE group and 16 (16/21,
76.2%) tumor types from the STE group were PR-positive (P=1.000).
In addition, only two tumor types (2/11, 18.2%) from the RTE group
and two tumor types (2/21, 9.5%) from the STE group expressed HER-2
(P=0.738). The mean age of the patients in the RTE groups was
slightly higher compared with that of the patients in the STE
group; no statistical significance was observed (P=0.235). Based on
the aforementioned results, the clinicopathological data of these
two groups were comparable.
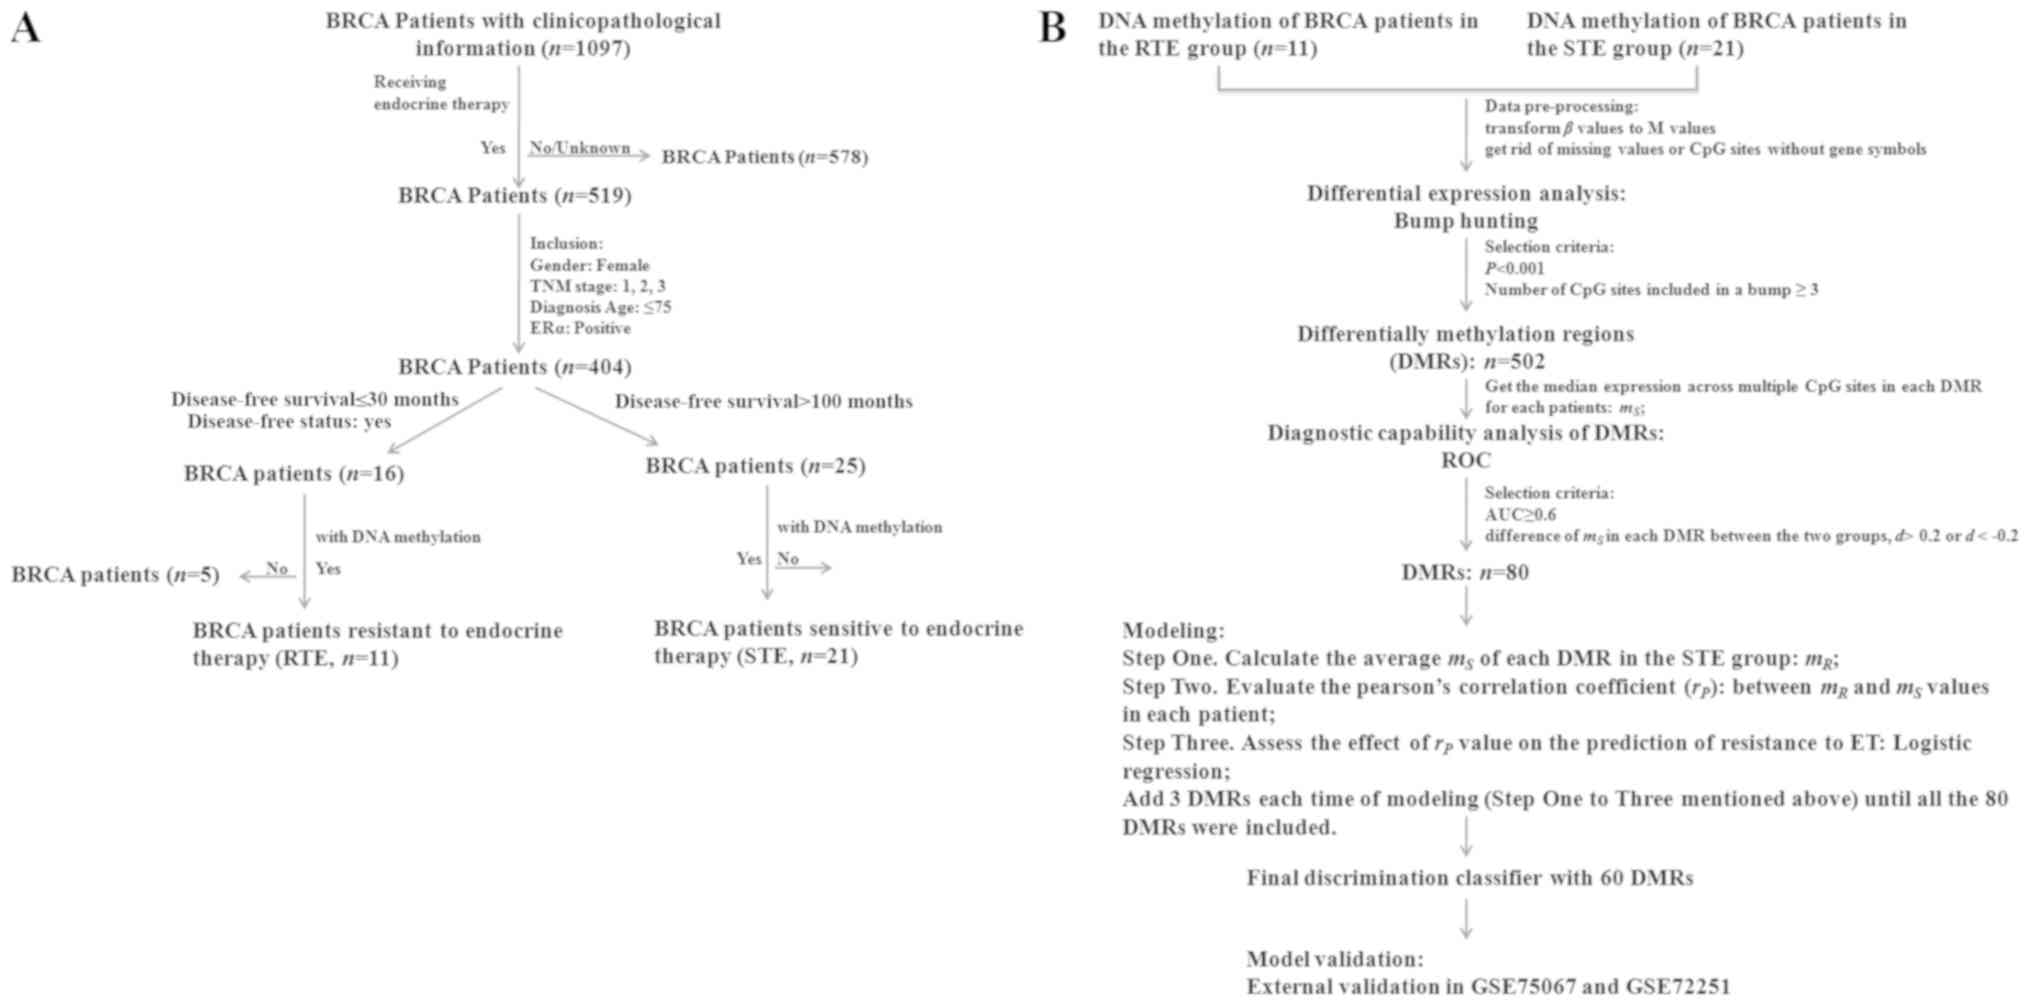 | Figure 1.Flow chart of patient selection and
model construction. (A) Publicly available DNA methylation, RNA
sequence and clinicopathological features of BRCA were downloaded
from The Cancer Genome Atlas. Stringent criteria were set to select
and classify patients into two groups, namely the RTE (n=11) group
and the STE (n=21) group. (B) Bump hunting was used to identify
DMRs, which was used to construct a predictive classifier. The
final classifier had 60 DMRs and was validated in an independent
dataset (GSE75067). BRCA, breast cancer; TNM, Tumor Node
Metastasis; ERα, estrogen receptor α; RTE, resistant to endocrine
therapy; STE, sensitive to endocrine therapy; ROC, receiver
operating characteristic; AUC, area under the curve; DMR,
differentially methylated regions; ET, endocrine therapy. |
 | Table I.Clinicopathological features of
patients with breast cancer from The Cancer Genome Atlas included
in the present study. |
Table I.
Clinicopathological features of
patients with breast cancer from The Cancer Genome Atlas included
in the present study.
| Patient ID | Age (year) | TNM stage | DFS (month) | Relapse/death | ER | PR | HER2 | Group | Drug name | Regimen
indication | Radiation
therapy | History of
neoadjuvant treatment |
|---|
| TCGA-A2-A0YC | 59 | 2 | 26.2 | Yes | Pos | Pos | Neg | RTE | Arimidex | Adjuvant | – | No |
| TCGA-A7-A13E | 62 | 2 | 18.3 | Yes | Pos | Neg | Neg | RTE | Arimidex,
Anastrozole | Adjuvant | – | No |
| TCGA-A7-A13H | 61 | 2 | 26.1 | Yes | Pos | Pos | Neg | RTE | Anastrozole | – | – | No |
| TCGA-A7-A26H | 72 | 2 | 10.2 | Yes | Pos | Neg | Pos | RTE | Anastrozole | Adjuvant | – | No |
| TCGA-A7-A425 | 70 | 3 | 14.6 | Yes | Pos | Pos | Neg | RTE | Arimidex | – | Yes | No |
| TCGA-AO-A0JA | 36 | 3 | 4.7 | Yes | Pos | Pos | Neg | RTE | Tamoxifen | Recurrence | – | No |
| TCGA-AO-A126 | 39 | 2 | 8.8 | Yes | Pos | Pos | Neg | RTE | Tamoxifen | Recurrence | – | No |
| TCGA-E2-A10B | 67 | 2 | 6.4 | Yes | Pos | Pos | Neg | RTE | Arimidex | Adjuvant | – | No |
| TCGA-E9-A1N6 | 52 | 2 | 22.1 | Yes | Pos | Pos | Pos | RTE | Tamoxifen,
Letrozole | – | – | No |
| TCGA-E9-A1NF | 60 | 2 | 3.0 | Yes | Pos | Pos | Neg | RTE | Tamoxifen | – | – | No |
| TCGA-LQ-A4E4 | 73 | 3 | 22.4 | Yes | Pos | Pos | Neg | RTE | Anastrozole | – | Yes | No |
| TCGA-A2-A04R | 36 | 1 | 121.9 | No | Pos | Pos | Neg | STE | Tamoxifen,
Anastrozole | Adjuvant | – | No |
| TCGA-A2-A0CR | 54 | 2 | 107.9 | No | Pos | Pos | Neg | STE | Tamoxifen,
Anastrazole | – | – | No |
| TCGA-A2-A0EN | 70 | 2 | 134.3 | No | Pos | Pos | Neg | STE | Anastrozole,
Tamoxifen | Adjuvant | – | No |
| TCGA-A2-A0EP | 56 | 1 | 118.4 | No | Pos | Neg | Neg | STE | Arimidex | – | No | No |
| TCGA-A2-A25A | 44 | 2 | 107.6 | No | Pos | Pos | Neg | STE | Femara | Adjuvant | – | No |
| TCGA-AO-A125 | 72 | 2 | 113.5 | No | Pos | Pos | Neg | STE | Tamoxifen,
Aromasin | Adjuvant | – | No |
| TCGA-AQ-A04L | 48 | 2 | 130.0 | No | Pos | Neg | Pos | STE | Tamoxifen | Adjuvant | – | No |
| TCGA-AR-A0TT | 53 | 3 | 108.9 | No | Pos | Neg | Neg | STE | Tamoxifen,
Anastrozole | Adjuvant | – | No |
| TCGA-AR-A0U3 | 59 | 2 | 134.0 | No | Pos | Pos | Neg | STE | Anastrozole | Adjuvant | – | No |
| TCGA-AR-A1AK | 70 | 1 | 103.8 | No | Pos | Pos | Neg | STE | Anastrozole | Adjuvant | – | No |
| TCGA-AR-A24H | 65 | 2 | 160.8 | No | Pos | Pos | Neg | STE | Anastrozole,
Tamoxifen | Adjuvant | – | No |
| TCGA-AR-A24M | 38 | 3 | 120.2 | No | Pos | Pos | Neg | STE | Letrozole,
Tamoxifen | Adjuvant | – | No |
| TCGA-AR-A24Q | 49 | 2 | 104.2 | No | Pos | Neg | Neg | STE | Anastrozole | Adjuvant | – | No |
| TCGA-AR-A24R | 45 | 3 | 112.7 | No | Pos | Pos | Neg | STE | Letrozole,
Tamoxifen | Adjuvant | – | No |
| TCGA-AR-A24T | 46 | 3 | 105.2 | No | Pos | Pos | Neg | STE | Letrozole,
Tamoxifen | Adjuvant | – | No |
| TCGA-AR-A24V | 52 | 2 | 105.2 | No | Pos | Pos | Neg | STE | Tamoxifen,
Anastrozole | – | – | No |
| TCGA-AR-A2LE | 69 | 1 | 138.1 | Yes | Pos | Neg | – | STE | Tamoxifen | – | – | No |
| TCGA-GM-A2DA | 46 | 2 | 214.7 | Yes | Pos | Pos | Pos | STE | Tamoxifen,
Aromasin, Letrozole | – | – | No |
| TCGA-GM-A2DL | 50 | 1 | 115.6 | No | Pos | Pos | Neg | STE | Tamoxifen,
Arimidex | – | – | No |
| TCGA-GM-A2DM | 57 | 2 | 106.0 | No | Pos | Pos | Neg | STE | Arimidex | – | – | No |
| TCGA-GM-A2DN | 58 | 2 | 101.5 | No | Pos | Pos | Neg | STE | Arimidex | – | – | No |
Aberrant methylation profiles of DMRs were
identified between the RTE and STE groups (Fig. 1B). Genomic locations were grouped
into clusters (regions) based on a maximum distance of 500 base
pairs (bp); of the 135,418 genomic regions, 502 regions, including
5,252 CpG sites were significantly differently methylated
(P<0.001) and had ≥3 individual CpG sites (Fig. 2A). Due to the limited sample sizes of
these two groups, multiple testing correction was not conducted. Of
the 502 DMRs, the median size was 803 bp, with a range of 41–3,509
bp; the median number of CpGs in each DMR was 10, with a range of
3–32. According to the annotation files, the majority of the 5,252
CpG sites were mapped to the promoter region (TSS1500 and TSS200),
the gene body and the 5′-untranslated region (UTR) and 3′-UTR, in
addition to the first exon (Fig.
2B). Of note, each CpG site may simultaneously be detected in
the promoter and other regions due to the various transcripts of a
specific gene. These 502 DMRs encompassed 562 specific genes, and
genes in the top ranked 20 DMRs were calcium release activated
channel regulator 2A (EFCAB4B), paraoxonase 3, homeobox C4 (HOXC4),
podoplanin (PDPN), major histocompatibility complex, class II, DQ
β2, helt bHLH transcription factor, major histocompatibility
complex, class I, J (pseudogene)/zinc ribbon domain containing 1
antisense, pseudogene, proline rich transmembrane protein
1/palmitoyl-protein thioesterase 2, family with sequence similarity
24 member B/chromosome 10 open reading frame 88 pseudogene,
achaete-scute family bHLH transcription factor 2, histone cluster 1
H4 family member L/histone cluster 1 H3 family member I, tenascin
XB, EYA transcriptional coactivator and phosphatase 4, lymphotoxin
α, epithelial stromal interaction 1 (EPSTI1), dimethylarginine
dimethylaminohydrolase 2, GATA binding protein 5, heparan
sulfate-glucosamine 3-sulfotransferase 1, major histocompatibility
complex, class II, DOα and homeobox C8 (HOXC8) (genes in the top
ranked 50 DMRs were listed in Table
II). Functional enrichment analysis was performed on these
genes. Consequently, 48 BP, 8 MF and only one CC GO terms were
significantly enriched with a P-value <0.01 and a false
discovery rate q-value <0.05 (Fig.
2C-E). The top-ranked representative 10 BP GO terms were
‘skeletal system development’ (P=6.24×10⁻⁷), ‘cell-cell
adhesion via plasma-membrane adhesion molecules’
(P=1.64×10⁻¹⁵), ‘homophilic cell adhesion via plasma
membrane adhesion molecules’ (P=9.51×10⁻²¹), ‘pattern
specification process’ (P=7.88×10⁻⁷), ‘embryonic organ
morphogenesis’ (P=1.86×10⁻⁶), ‘gland development’
(P=6.45×10⁻⁷), ‘forebrain development’
(P=9.95×10⁻⁸), ‘regulation of hormone levels’
(P=5.88×10⁻⁵), ‘cell fate commitment’
(P=4.35×10⁻¹¹) and ‘muscle organ development’
(P=2.19×10⁻⁵). The associated genes are listed in
Table III, including the HOX
family of genes, such as HOXC4 and HOXC8, the protocadherin (PCDH)
α gene cluster, such as PCDHA4, PCDHA7, PCDHA10, PCDH8 and PCDHGA1,
and other genes known to affect the tumor growth and metastasis
[including C-X-C motif chemokine ligand 12, SRY-box 2, E74 like ETS
transcription factor 5 (ELF5), epidermal growth factor receptor,
tumor necrosis factor and fibroblast growth factor receptor 1,
etc.]. Additionally, these genes were significantly associated with
the MF GO terms of ‘protein heterodimerization activity’
(P=1.34×10⁻⁴), ‘transcription factor activity, RNA
polymerase II core promoter proximal region sequence-specific
binding’ (P=1.10×10⁻⁶), ‘transcriptional activator
activity, RNA polymerase II transcription regulatory region
sequence-specific binding’ (P=5.79×10⁻⁷),
‘transcriptional activator activity, RNA polymerase II core
promoter proximal region sequence-specific binding’
(P=3.85×10⁻⁵), ‘glucuronosyltransferase activity’
(P=1.38×10⁻⁷), ‘retinoid binding’
(P=1.21×10⁻⁴), ‘retinoic acid binding’
(P=2.77×10⁻⁶) and ‘oxidoreductase activity and acting on
NAD(P)H, oxygen as acceptor’ (P=3.85×10⁻⁵). The only
significant CC GO term was ‘transcription factor complex’
(P=1.31×10⁻⁵).
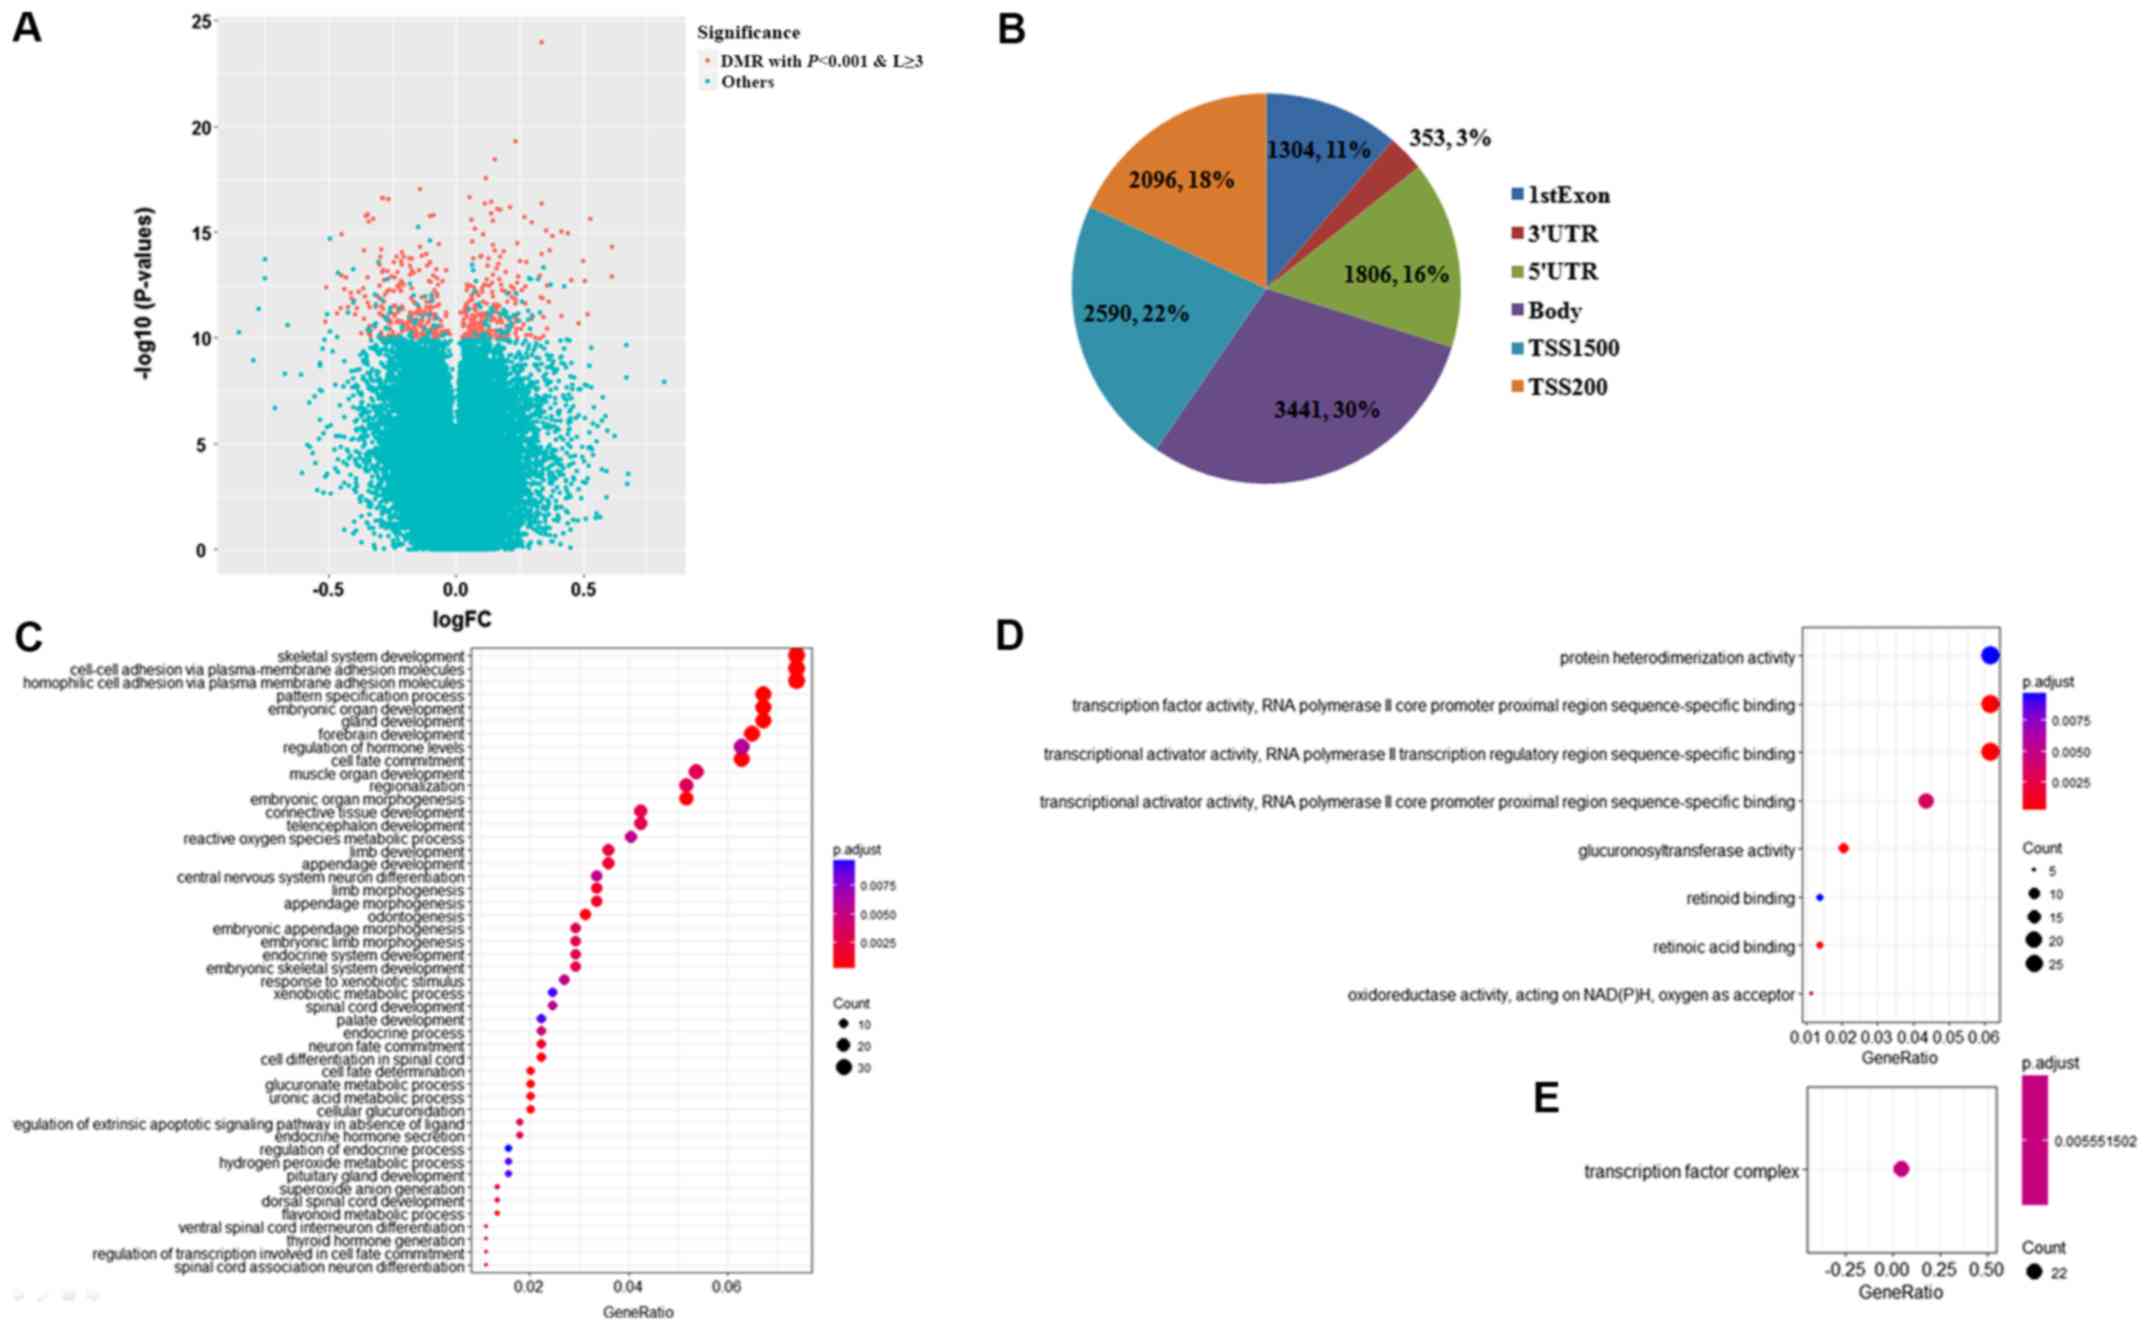 | Figure 2.Identification of DMRs by bump
hunting. (A) DMRs were defined as the genomic regions
differentially methylated between two populations at a P-value
<0.001 (retained from bump hunting) and covering ≥3 CpG sites.
In total, 502 out of 135,418 genomic regions were regarded as DMRs
and represented as red points in the volcano plot, while other
genomic regions were indicated as blue points. The x-axis
represented the log-transformed FC of the β-value between the
resistant to endocrine therapy group and the sensitive to endocrine
therapy group, and the y-axis represented the log-transformed
P-value retained from bump hunting. (B) Pie chart indicating the
location of 5,252 CpG sites enclosed in these DMRs. As observed,
the majority of the CpG sites mapped into the promoter region
(TSS1500 and TSS200), and then the gene body, followed by the 5′UTR
and 3′UTR and 1st Exon. Gene Ontology (C) Biological Process, (D)
Molecular Function and (E) Cellular Component terms were enriched
by 562 specific genes encompassed by DMRs. FC, fold change; DMR,
differentially methylated regions; UTR, untranslated region. |
| Table II.DMRs between patients resistant and
sensitive to endocrine therapy. |
Table II.
DMRs between patients resistant and
sensitive to endocrine therapy.
| Bumps (no.) | Chr | Start coordinate of
DMR | End coordinate of
DMR | Gene(s) | Number of CpGs in
DMR | DMR P-value |
|---|
| 23474 | 12 | 3862221 | 3862597 | EFCAB4B | 12 |
1.28×10⁻⁵ |
| 95719 | 7 | 95025194 | 95026937 | PON3 | 25 |
1.46×10⁻⁵ |
| 25363 | 12 | 54446100 | 54448913 | HOXC4 | 26 |
2.21×10⁻⁵ |
| 2013 | 1 | 13909161 | 13910796 | PDPN | 17 |
2.35×10⁻⁵ |
| 88062 | 6 | 32729174 | 32730299 | HLA-DQB2 | 31 |
3.60×10⁻⁵ |
| 81042 | 4 | 185938933 | 185941625 | HELT | 23 |
4.27×10⁻⁵ |
| 87538 | 6 | 29974022 | 29975078 |
HLA-J;NCRNA00171 | 32 |
4.52×10⁻⁵ |
| 87958 | 6 | 32119616 | 32121249 | PRRT1;PPT2 | 32 |
4.96×10⁻⁵ |
| 15619 | 10 | 124638756 | 124639892 |
FAM24B;LOC399815 | 19 |
5.27×10⁻⁵ |
| 16983 | 11 | 2291347 | 2292905 | ASCL2 | 22 |
6.87×10⁻⁵ |
| 87359 | 6 | 27840957 | 27842098 |
HIST1H4L;HIST1H3I | 16 |
8.00×10⁻⁵ |
| 87946 | 6 | 32063774 | 32064749 | TNXB | 31 |
8.77×10⁻⁵ |
| 90707 | 6 | 133561614 | 133562196 | EYA4 | 19 |
9.02×10⁻⁵ |
| 87773 | 6 | 31539601 | 31540750 | LTA | 18 |
9.29×10⁻⁵ |
| 29316 | 13 | 43565901 | 43566902 | EPSTI1 | 14 |
9.85×10⁻⁵ |
| 87830 | 6 | 31695903 | 31697276 | DDAH2 | 32 |
9.90×10⁻⁵ |
| 66889 | 20 | 61050560 | 61051561 | GATA5 | 15 |
1.00×10⁻⁴ |
| 77952 | 4 | 11430022 | 11431359 | HS3ST1 | 12 |
1.03×10⁻⁴ |
| 88100 | 6 | 32975875 | 32978129 | HLA-DOA | 24 |
1.27×10⁻⁴ |
| 25345 | 12 | 54402431 | 54403314 | HOXC8 | 12 |
1.42×10⁻⁴ |
| 12810 | 10 | 50969997 | 50970591 | OGDHL | 11 |
1.71×10⁻⁴ |
| 17099 | 11 | 2890019 | 2891118 | KCNQ1DN | 30 |
1.74×10⁻⁴ |
| 84428 | 5 | 140305713 | 140306458 | PCDHAC1; PCDHA7;
PCDHAC1; PCDHA12; PCDHA6; PCDHA10; PCDHA4; PCDHA11; PCDHA8;
PCDHAC1; PCDHA6; PCDHA1; PCDHA2; PCDHA9; PCDHA1; PCDHAC1; PCDHA13;
PCDHA5; PCDHA3; PCDHA10 | 11 |
1.80×10⁻⁴ |
| 16989 | 11 | 2397201 | 2397977 | CD81 | 16 |
1.80×10⁻⁴ |
| 36576 | 15 | 72667883 | 72669149 | HEXA; C15orf34 | 15 |
1.99×10⁻⁴ |
| 84434 | 5 | 140345966 | 140346403 | PCDHAC2; PCDHA7;
PCDHA12; PCDHA6; PCDHA10; PCDHA4; PCDHA11; PCDHA8; PCDHA6; PCDHA1;
PCDHA2; PCDHA1; PCDHA9; PCDHA13; PCDHA5; PCDHAC1; PCDHA3; PCDHAC2;
PCDHA10 | 10 |
2.01×10⁻⁴ |
| 23388 | 12 | 2800055 | 2801584 | CACNA1C | 14 |
2.03×10⁻⁴ |
| 16985 | 11 | 2321770 | 2323059 |
C11orf21;TSPAN32 | 26 |
2.09×10⁻⁴ |
| 46839 | 17 | 46655164 | 46656543 | HOXB4 | 19 |
2.52×10⁻⁴ |
| 5778 | 1 | 92951355 | 92952268 | GFI1 | 12 |
2.56×10⁻⁴ |
| 83500 | 5 | 112073348 | 112073769 | APC | 15 |
2.70×10⁻⁴ |
| 26639 | 12 | 103351180 | 103352454 | ASCL1 | 13 |
2.76×10⁻⁴ |
| 109271 | X | 153236083 | 153238579 | HCFC1; TMEM187 | 19 |
2.81×10⁻⁴ |
| 78985 | 4 | 76555547 | 76556042 | CDKL2 | 11 |
2.94×10⁻⁴ |
| 42578 | 16 | 88717134 | 88717989 | CYBA | 13 |
3.13×10⁻⁴ |
| 107070 | X | 16729564 | 16731095 | CTPS2 | 15 |
3.16×10⁻⁴ |
| 80825 | 4 | 174449827 | 174451468 | HAND2;
NBLA00301 | 14 |
3.34×10⁻⁴ |
| 59778 | 2 | 75425832 | 75428132 | TACR1 | 21 |
3.35×10⁻⁴ |
| 61130 | 2 | 127413363 | 127414883 | GYPC | 12 |
3.47×10⁻⁴ |
| 86294 | 6 | 291687 | 293285 | DUSP22 | 10 |
3.65×10⁻⁴ |
| 93730 | 7 | 27280914 | 27282444 | EVX1 | 22 |
3.75×10⁻⁴ |
| 15319 | 10 | 118030848 | 118034357 | GFRA1 | 30 |
3.76×10⁻⁴ |
| 67499 | 21 | 34442160 | 34443672 | OLIG1 | 14 |
3.93×10⁻⁴ |
| 100809 | 8 | 54163622 | 54164442 | OPRK1 | 10 |
4.01×10⁻⁴ |
| 62324 | 2 | 177052486 | 177053496 | HOXD1 | 12 |
4.35×10⁻⁴ |
| 87226 | 6 | 25652381 | 25652815 | SCGN | 10 |
4.38×10⁻⁴ |
| 11057 | 1 | 248020350 | 248021163 | TRIM58 | 10 |
4.42×10⁻⁴ |
| 13473 | 10 | 75118103 | 75118887 | TTC18 | 12 |
4.48×10⁻⁴ |
| 47489 | 17 | 59476505 | 59478068 | TBX2 | 17 |
4.92×10⁻⁴ |
| 97172 | 7 | 130125511 | 130126871 | MEST | 16 |
4.98×10⁻⁴ |
| Table III.Top-ranked 10 biological process
terms enriched by genes included in differentially methylated
regions determined through the functional enrichment analysis. |
Table III.
Top-ranked 10 biological process
terms enriched by genes included in differentially methylated
regions determined through the functional enrichment analysis.
| Description | Gene ratio | Gene ID | P-value |
|---|
| Homophilic cell
adhesion via plasma membrane adhesion molecules | 33/446 |
PCDHA7/PCDHAC1/PCDHA12/PCDHA6/PCDHA10/PCDHA4/PCDHA11/PCDHA8/PCDHA1/PCDHA2/PCDHA9/PCDHA13/PCDHA5/PCDHA3/PCDHAC2/GYPC/FAT1/SDK1/IGSF9B/PCDH8/CDH7/PCDHGA4/PCDHGA6/PCDHGA1/PCDHGA5/PCDHGB1/PCDHGB4/PCDHGA3/PCDHGA8/PCDHGA2/PCDHGA7/PCDHGB2/PCDHGB3 |
9.51×10⁻²¹ |
| Cell-cell adhesion
via plasma-membrane adhesion molecules | 33/446 |
PCDHA7/PCDHAC1/PCDHA12/PCDHA6/PCDHA10/PCDHA4/PCDHA11/PCDHA8/PCDHA1/PCDHA2/PCDHA9/PCDHA13/PCDHA5/PCDHA3/PCDHAC2/GYPC/FAT1/SDK1/IGSF9B/PCDH8/CDH7/PCDHGA4/PCDHGA6/PCDHGA1/PCDHGA5/PCDHGB1/PCDHGB4/PCDHGA3/PCDHGA8/PCDHGA2/PCDHGA7/PCDHGB2/PCDHGB3 |
1.64×10⁻¹⁵ |
| Cell fate
commitment | 28/446 |
ASCL1/EVX1/OLIG1/TBX2/ELF5/TRIM15/SOX2/NKX6-2/NOTCH4/FGFR1/GDF7/FGF10/PROX1/WT1/SOX8/BCL11B/EBF2/PITX1/GSX1/GLI3/FGF13/PAX7/NKX2-5/LBX1/GATA3/NR2F2/TGFB1I1/GATA2 |
4.35×10⁻¹¹ |
| Forebrain
development | 29/446 |
ASCL1/CXCL12/SOX2/KCNA1/FGFR1/GDF7/FGF10/NPY/SRD5A2/PROX1/ALK/BCL11B/PITX1/GSX1/GLI3/FGF13/DLX5/AQP1/DAB2IP/EGFR/NR2F2/RARB/TACC2/DUOX2/TRAPPC9/GATA2/PITX2/HTR5A/INHBA |
9.95×10⁻⁸ |
| Skeletal system
development | 33/446 |
HOXC4/HOXC8/HOXB4/HAND2/HOXD1/HOXB5/HOXD9/HAPLN3/HOXD4/FGFR1/TBX15/SRD5A2/COL11A2/PITX1/HOXC6/HOXC5/GLI3/DLX5/COL1A2/PAX7/GNAS/CDX1/TLL1/ALPL/RUNX3/RARB/CDKN1C/PITX2/SHOX2/BARX2/BMP8B/COL2A1/MEIS1 |
6.24×10⁻⁷ |
| Gland
development | 30/446 |
ASCL1/HAND2/TBX2/ELF5/GPX1/HOXD9/SOX2/KALRN/TNF/NOTCH4/FGFR1/GDF7/FGF10/PROX1/WT1/BCL11B/PITX1/GSX1/GLI3/BSX/LIMS2/NKX2-5/GATA3/EGFR/CDKN1C/DUOX2/GATA2/PITX2/UGT1A1/IRS2 |
6.45×10⁻⁷ |
| Embryonic organ
development | 30/446 |
HOXC4/ASCL2/HOXB4/HAND2/TBX2/HOXB5/HOXD9/TNF/HOXD4/FGFR1/CITED1/TBX15/FGF10/VANGL2/PROX1/EN2/GLI3/DLX5/GNAS/NKX2-5/LBX1/GATA3/EGFR/NR2F2/RARB/CDKN1C/GATA2/PITX2/SHOX2/COL2A1 |
7.50×10⁻⁷ |
| Pattern
specification process | 30/446 |
HOXC4/HOXC8/HOXB4/ASCL1/HAND2/EVX1/TBX2/HOXB5/HOXD9/NKX6-2/HOXD4/FGFR1/CITED1/IRX4/FGF10/VANGL2/GDNF/WT1/HOXC6/HOXC5/GLI3/PAX7/CDX1/SYNGAP1/NKX2-5/LBX1/PCDH8/NR2F2/PITX2/BCOR |
7.88×10⁻⁷ |
| Embryonic organ
morphogenesis | 23/446 |
HOXC4/HOXB4/HAND2/TBX2/HOXB5/HOXD9/HOXD4/FGFR1/TBX15/FGF10/VANGL2/PROX1/GLI3/DLX5/GNAS/NKX2-5/LBX1/GATA3/RARB/GATA2/PITX2/SHOX2/COL2A1 |
1.86×10⁻⁶ |
| Regulation of
hormone levels | 28/446 |
CACNA1C/TACR1/OPRK1/TRH/KALRN/TNF/FGFR1/DUOX1/DUOXA1/SRD5A2/SOX8/GALR1/P2RY1/GNAS/KCNS3/GATA3/EGFR/DUOX2/DUOXA2/UCN/RAB11FIP3/UGT1A1/UGT1A8/UGT1A3/UGT1A9/UGT1A7/IRS2/INHBA |
5.88×10⁻⁵ |
Classifier building for predicting the
response to ET in patients with ER-positive BRCA based on DMR
patterns
Following the process presented in Fig. 1B, 502 DMRs were identified, of which
457 DMRs had an AUC ≥0.6. Finally, 80 DMRs remained to build the
predictive classifier set (with a difference of
mS between the RTE and STE groups >0.2).
As presented in Fig.
3A, the logistic regression, including 60 DMRs, had the highest
AUC to distinguish the RTE group from the STE group, and a
relatively low AIC to indicate the goodness of fit and the
simplicity of the classifier. Therefore, these 60 DMRs listed in
Table IV were included. Among them,
31 DMRs, including EFCAB4B, secretoglobin family 3A member 1
(SCGB3A1) and dual oxidase maturation factor 1 (DUOXA1), were
hypermethylated in the RTE group, and the remaining DMRs, including
tripartite motif containing 58 and ELF5, were hypomethylated in the
RTE group. Unsupervised hierarchical clustering analysis of these
patients in the RTE and STE groups was performed based on these 60
DMRs. As presented in Fig. 3B,
patients were divided into two classes, as follows: Class 1 was
mainly enriched for patients in the STE group (20/21), while class
2 comprised 10 patients in the RTE group and one in the STE group.
In total, only two samples (2/32, 6.25%) were incorrectly sorted
into the wrong group.
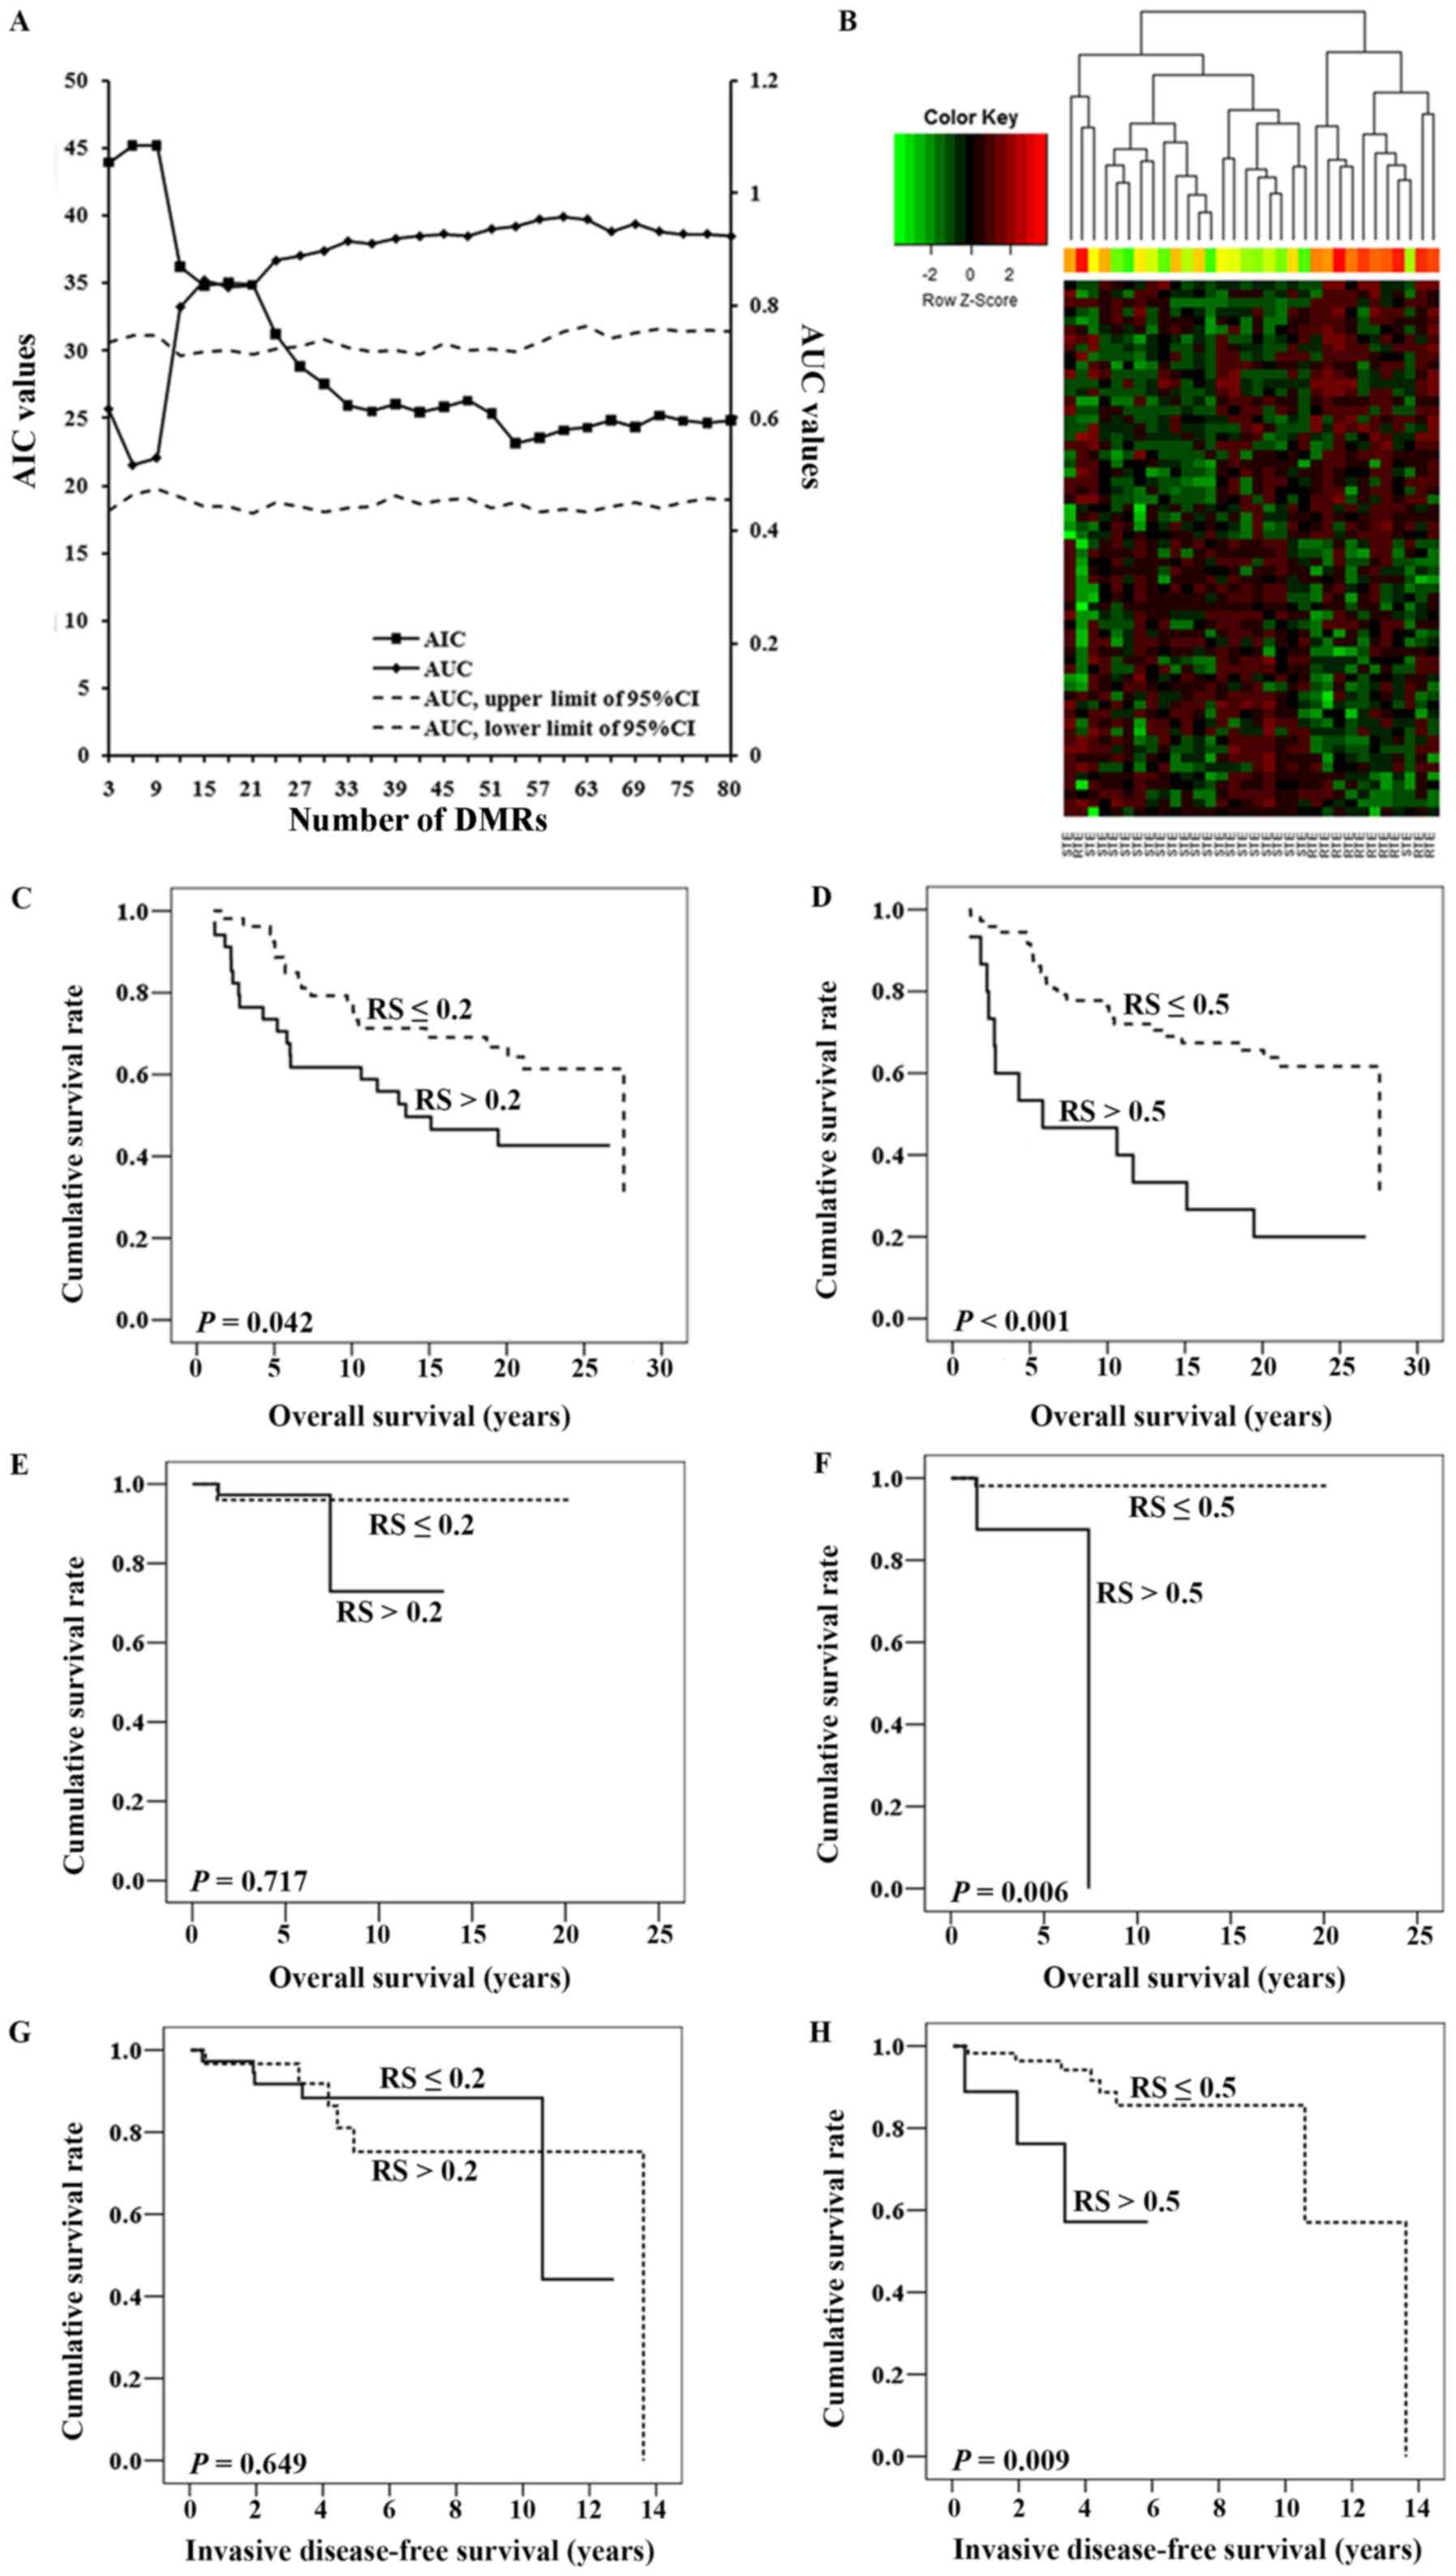 | Figure 3.Construction and validation of the
predictive classifier. (A) When modeling, 3 DMRs were included into
the prediction classifier each time, followed by an assessment of
the mR in the STE group and the calculation of
the r-value. The effect of the r-values was evaluated using the
logistic regression, and AUC and AIC were simultaneously created to
assess its diagnostic capacity, the goodness of fit and the
simplicity of the classifier. The 95% CI of the AUC were calculated
following 1,000 permutations. The left y-axis represented the AIC
values, and the right y-axis represented the AUC values. The x-axis
indicated the number of DMRs included in the logistic regression.
(B) Hierarchical clustering was conducted on the DMRs. Each row of
the heat map represented one of the DMRs with each column
representing a different sample belonging to the RTE or STE group.
RS was retained from each patient in the independent dataset
GSE75067 on the basis of the predictive classifier. Kaplan-Meier
analyses with log-rank tests were used to assess the effect of RS
on OS time. The cutoff value of RS was set to be either (C) 0.2 or
(D) 0.5. Similarly, for GSE72251, RS was assigned to each patient
and Kaplan-Meier analyses were also used to assess the association
between RS and OS, when the cutoff value was set to be (E) 0.2 or
(F) 0.5. In addition, survival curves were also created by
Kaplan-Meier analyses for invasive disease-free survival time, and
the cutoff of RS was set to (G) 0.2 or (H) 0.5. AIC, Akaike
information criterion; AUC, area under the curve; CI, confidence
interval; RS, risk score; DMR, differentially methylated regions;
RTE, resistant to endocrine therapy; STE, sensitive to endocrine
therapy; OS, overall survival. |
| Table IV.Differentially methylated regions for
predicting patients who are resistant to endocrine therapy. |
Table IV.
Differentially methylated regions for
predicting patients who are resistant to endocrine therapy.
| Bumps (no.) | Gene symbol |
r-valuea |
P-valueb | DNA methylation
(resistant/sensitive to endocrine therapy) | Chr | No. of CpG
sites |
P-valuesc |
|---|
| 23474 | EFCAB4B | −0.358 |
3.20×10⁻²⁵ | Up | 12 | 12 |
1.28×10⁻⁵ |
| 2013 | PDPN | −0.210 |
2.94×10⁻⁹ | Up | 1 | 17 |
2.35×10⁻⁵ |
| 87359 | HIST1H4L,
HIST1H3I | −0.233, −0.270 |
3.41×10⁻¹¹,
1.26×10⁻¹⁴ | Up | 6 | 16 |
8.00×10⁻⁵ |
| 29316 | EPSTI1 | −0.581 |
2.89×10−72 | Up | 13 | 14 |
9.85×10⁻⁵ |
| 23388 | CACNA1C | 0.305 |
1.86×10⁻¹⁸ | Up | 12 | 14 |
2.03×10⁻⁴ |
| 83500 | APC | 0.075 |
3.57×10⁻² | Up | 5 | 15 |
2.70×10⁻⁴ |
| 109271 | HCFC1, TMEM187 | 0.072, −0.076 |
4.37×10⁻²,
3.27×10⁻² | Down | X | 19 |
2.81×10⁻⁴ |
| 87226 | SCGN | −0.194 |
3.83×10⁻⁸ | Down | 6 | 10 |
4.38×10⁻⁴ |
| 11057 | TRIM58 | −0.619 |
1.39×10−84 | Down | 1 | 10 |
4.42×10⁻⁴ |
| 93160 | MIR589, FBXL18 | -, −0.255 | -,
4.23×10⁻¹³ | Down | 7 | 12 |
5.07×10⁻⁴ |
| 18397 | ELF5 | −0.594 |
2.53×10−76 | Down | 11 | 13 |
5.32×10⁻⁴ |
| 45490 | SLFN12 | −0.553 |
3.98×10−64 | Up | 17 | 9 |
5.33×10⁻⁴ |
| 72514 | C3orf18 | −0.567 |
3.93×10−68 | Up | 3 | 7 |
5.53×10⁻⁴ |
| 86221 | SCGB3A1 | −0.309 |
7.02×10⁻¹⁹ | Up | 5 | 14 |
5.56×10⁻⁴ |
| 19965 | SIPA1 | −0.260 |
1.13×10⁻¹³ | Up | 11 | 12 |
6.43×10⁻⁴ |
| 53071 | ACP5 | −0.222 |
3.18×10⁻¹⁰ | Up | 19 | 11 |
6.58×10⁻⁴ |
| 67311 | MIR155HG | −0.424 |
1.01×10⁻³⁵ | Up | 21 | 7 |
7.44×10⁻⁴ |
| 16291 | NKX6-2 | −0.048 |
1.76×10⁻¹ | Down | 10 | 12 |
8.42×10⁻⁴ |
| 56468 | ZNF880 | −0.464 |
3.35×10−43 | Up | 19 | 9 |
9.37×10⁻⁴ |
| 78770 | IGFBP7 | 0.084 |
1.82×10⁻² | Down | 4 | 8 |
1.01×10⁻³ |
| 12633 | ALOX5 | −0.189 |
8.55×10⁻⁸ | Up | 10 | 7 |
1.06×10⁻³ |
| 20753 | PHOX2A | −0.225 |
1.79×10⁻¹⁰ | Down | 11 | 7 |
1.09×10⁻³ |
| 33797 | PPP2R5C | 0.068 |
5.51×10⁻² | Up | 14 | 5 |
1.13×10⁻³ |
| 51880 | NFIC | 0.140 |
8.11×10⁻⁵ | Up | 19 | 5 |
1.17×10⁻³ |
| 87280 | HIST1H4F | −0.228 |
1.14×10⁻¹⁰ | Up | 6 | 7 |
1.25×10⁻³ |
| 94632 | IKZF1 | −0.265 |
4.47×10⁻¹⁴ | Down | 7 | 6 |
1.25×10⁻³ |
| 67598 | CBR1 | −0.621 |
3.20×10−85 | Up | 21 | 6 |
1.27×10⁻³ |
| 102219 | ZNF572 | −0.645 |
1.22×10−93 | Up | 8 | 8 |
1.30×10⁻³ |
| 35402 | DUOX1, DUOXA1 | −0.456, −0.485 |
1.08×10−41,
1.03×10−47 | Up | 15 | 9 |
1.36×10⁻³ |
| 108507 | CHRDL1 | 0.120 |
7.29×10⁻⁴ | Down | X | 9 |
1.61×10⁻³ |
| 69212 | PLA2G3 | −0.581 |
3.43×10−72 | Down | 22 | 6 |
1.63×10⁻³ |
| 23113 | GLB1L3 | −0.175 |
8.25×10⁻⁷ | Down | 11 | 7 |
1.89×10⁻³ |
| 98905 | VIPR2 | −0.433 |
2.76×10−37 | Down | 7 | 6 |
1.92×10⁻³ |
| 28896 | GSX1 | −0.094 |
8.09×10⁻³ | Down | 13 | 9 |
1.98×10⁻³ |
| 88104 | HLA-DPB1 | −0.300 |
8.83×10⁻¹⁸ | Up | 6 | 9 |
2.26×10⁻³ |
| 86545 | CDYL | −0.073 |
4.05×10⁻² | Up | 6 | 6 |
2.30×10⁻³ |
| 11209 | DIP2C | −0.194 |
3.95×10⁻⁸ | Down | 10 | 15 |
2.50×10⁻³ |
| 97788 | FAM115A | 0.061 |
8.98×10⁻² | Up | 7 | 4 |
2.54×10⁻³ |
| 84265 | LOC389333 | −0.165 |
3.14×10⁻⁶ | Up | 5 | 8 |
2.58×10⁻³ |
| 17233 | TRIM68 | −0.573 |
5.39×10−70 | Up | 11 | 8 |
2.63×10⁻³ |
| 57826 | KCNS3 | −0.227 |
1.13×10⁻¹⁰ | Up | 2 | 8 |
2.65×10⁻³ |
| 30133 | DOCK9 | −0.119 |
7.89×10⁻⁴ | Down | 13 | 6 |
2.74×10⁻³ |
| 108522 | ALG13 | −0.122 |
6.13×10⁻⁴ | Down | X | 5 |
2.92×10⁻³ |
| 7843 | SLAMF1 | −0.270 |
1.33×10⁻¹⁴ | Up | 1 | 6 |
3.20×10⁻³ |
| 99079 | ARHGEF10 | −0.030 |
4.00×10⁻¹ | Down | 8 | 4 |
3.47×10⁻³ |
| 40848 | MT1G | −0.536 |
7.32×10−60 | Down | 16 | 6 |
3.70×10⁻³ |
| 26270 | LIN7A | −0.291 |
7.61×10⁻¹⁷ | Up | 12 | 4 |
4.08×10⁻³ |
| 57453 | TTC15 | 0.195 |
3.45×10⁻⁸ | Down | 2 | 5 |
4.13×10⁻³ |
| 77073 | CTBP1 | −0.175 |
7.47×10⁻⁷ | Down | 4 | 6 |
4.15×10⁻³ |
| 42328 | FBXO31 | −0.075 |
3.59×10⁻² | Up | 16 | 3 |
4.28×10⁻³ |
| 85239 | EBF1 | 0.035 |
3.28×10⁻¹ | Down | 5 | 4 |
4.31×10⁻³ |
| 19658 | FERMT3 | 0.102 |
4.24×10⁻³ | Down | 11 | 4 |
4.32×10⁻³ |
| 7847 | CD48 | −0.143 |
5.38×10⁻⁵ | Up | 1 | 4 |
4.56×10⁻³ |
| 102571 | TRAPPC9 | 0.060 |
9.15×10⁻² | Down | 8 | 3 |
5.43×10⁻³ |
| 49506 | HEXDC | 0.078 |
2.90×10⁻² | Down | 17 | 3 |
5.80×10⁻³ |
| 81036 | ACSL1 | 0.060 |
9.37×10⁻² | Down | 4 | 3 |
5.89×10⁻³ |
| 8503 | RASAL2 | −0.279 |
1.67×10⁻¹⁵ | Down | 1 | 3 |
5.93×10⁻³ |
| 40647 | ZNF423 | 0.384 |
4.02×10⁻²⁹ | Up | 16 | 4 |
6.19×10⁻³ |
| 393 | PRKCZ | −0.065 |
6.77×10⁻² | Down | 1 | 3 |
6.31×10⁻³ |
| 11176 | DIP2C | −0.194 |
3.95×10⁻⁸ | Down | 10 | 4 |
6.67×10⁻³ |
Based on the aforementioned 60 DMRs, an equation
based on the aforementioned logistic regression,
ln(p/1-p)=7.207–12.610x, was generated to evaluate the
probability of resistance to ET in patients with ER-positive BRCA.
The denoting of letters in the equation is as follows: p, the
probability of resistance to ET, and x, rP values
between mR and mS across 60
DMRs in each patient. Thus, the RS was generated and described as
follows: RS=e7.207–12.610×/(1+
e7.207–12.610×).
Application of RS on the prognosis of
patients with ER-positive BRCA in two additional independent test
datasets
The GSE75067 dataset containing the data of 87
patients with ER-positive BRCA was used instead to externally
analyze the prognostic power of the RS on BRCA. The RS of each
ER-positive patient was calculated; the median RS among these
patients was 0.161, with a range of 0.051–0.982. As observed in
Fig. 3C and D, whether the cutoff
value of RS was 0.2 or 0.5, patients with higher RS values tended
to exhibit significantly shorter OS times compared with those with
lower RS values (log-rank test, P=0.042 and P<0.001,
respectively). Furthermore, Cox regression analysis indicated that,
following the adjustment for age, tumor type, lymph node status and
PR expression, RS was an independent predictor for OS in patients
with ER-positive BRCA (hazard ratio: 2.551; 95% confidence
interval, 1.048–6.206; P=0.039; Table
V).
| Table V.Univariate and multivariate Cox
regressions in the dataset GSE75067. |
Table V.
Univariate and multivariate Cox
regressions in the dataset GSE75067.
|
| Univariate | Multivariate |
|---|
|
|
|
|
|---|
| Clinical
features | HR (95%CI) | P-value | HR (95%CI) | P-value |
|---|
| Age (years,
>50/≤50) | 1.286 (0.677,
2.442) | 0.442 | 1.688 (0.800,
3.563) | 0.170 |
| Tumor types
(non-ductal/ductal) | 0.613 (0.290,
1.294) | 0.199 | 0.528 (0.224,
1.245) | 0.145 |
| Lymph node status
(positive/negative) | 4.199 (2.096,
8.411) | <0.001 | 5.319 (2.440,
11.596) | <0.001 |
| Progesterone
receptor expression (positive/negative) | 0.472 (0.215,
1.036) | 0.061 | 1.282 (0.429,
3.835) | 0.656 |
| Risk Score
(>0.5/≤0.5) | 3.463 (1.742,
6.887) | <0.001 | 2.551 (1.048,
6.206) | 0.039 |
Additionally, the GSE72251 dataset containing the
data of 70 patients with tumor types expressing ER was used for
further validation; the median RS among these patients was 0.227,
with a range of 0.053–0.957. As presented in Fig. 3E, patients with RS≤0.2 tended to have
a better OS times, but statistical significance was not observed
(log-rank test, P=0.717); however, the OS times of patients with RS
≤0.5 were significantly longer compared with that of their
counterparts with RS >0.5 (log-rank test, P=0.006; Fig. 3F). IDFS data were available in this
dataset and were also analyzed. As presented in Fig. 3G, no significant differences in IDFS
were observed between the two groups (patients with BRCA and RS
>0.2 compared with those with RS ≤0.2); however, patients
assigned a higher RS exhibited a significantly longer IDFS compared
with those with a lower RS when the cutoff of RS was set as 0.5
(P=0.009; Fig. 3H).
Correlation between DNA methylation
and mRNA expression in DMRs included in the predictive
classifier
Of the 60 DMRs, 63 specific genes were encompassed,
and Pearson's correlation coefficients were determined to reveal
the effects of epigenetic regulation. The CpG site in one specific
DMR exhibiting the strongest correlation with mRNA expression was
identified. The majority of the genes (55/63) had a statistically
significant correlation between DNA methylation and mRNA expression
with a P-value <0.05; 17 genes had an r-value ≤-0.3 (Table IV). Numerous representative DMRs and
their correlation with mRNA expression in specific genes were
presented in Fig. 4. Of these genes,
EFCAB4B (P=1.28×10⁻⁵), Schlafen family member 12
(SLFN12; P=5.33×10⁻⁴), chromosome 3 open reading frame
18 (C3orf18; P=5.53×10⁻⁴), zinc finger protein 880
(ZNF880; P=9.37×10⁻⁴), dual oxidase 1 (DUOX1;
P=1.08×10−41) and major histocompatibility complex,
class II, DPβ1 (HLA-DPB1; P=2.27×10⁻³) were
hypermethylated in patients in the RTE group, while ELF5
(P=5.32×10⁻⁴), phospholipase A2 group III (PLA2G3;
P=1.63×10⁻³), metallothionein 1G (MT1G;
P=3.70×10⁻³), C-terminal binding protein 1 (CTBP1;
P=4.15×10⁻³), ALG13 UDP-N-acetylglucosaminyltransferase
subunit (ALG13; P=2.92×10⁻³) and RAS protein activator
like 1 (RASAL1; P=5.93×10⁻³) were hypomethylated in
patients in the RTE group compared with that in the STE group.
Among them, ELF5 (r=−0.594, P=2.53×10−76) exhibited the
strongest negative correlation with mRNA expression, followed by
PLA2G3 (r=−0.581, P=3.43×10−72), C3orf18 (r=−0.567,
P=3.93×10−68), MT1G (r=−0.536, P=7.32×10−60),
SLFN12 (r=−0.533, P=3.98×10−64), ZNF880 (r=−0.464,
P=3.35×10−43), DUOX1 (r=−0.456,
P=1.08×10−41), EFCAB4B (r=−0.358,
P=3.20×10⁻²⁵), HLA-DPB1 (r=−0.300,
P=8.83×10⁻¹⁸), RASAL2 (r=−0.279,
P=1.67×10⁻¹⁵), CTBP1 (r=−0.175, P=7.47×10⁻⁷)
and ALG13 (r=−0.122, P=6.13×10⁻⁴).
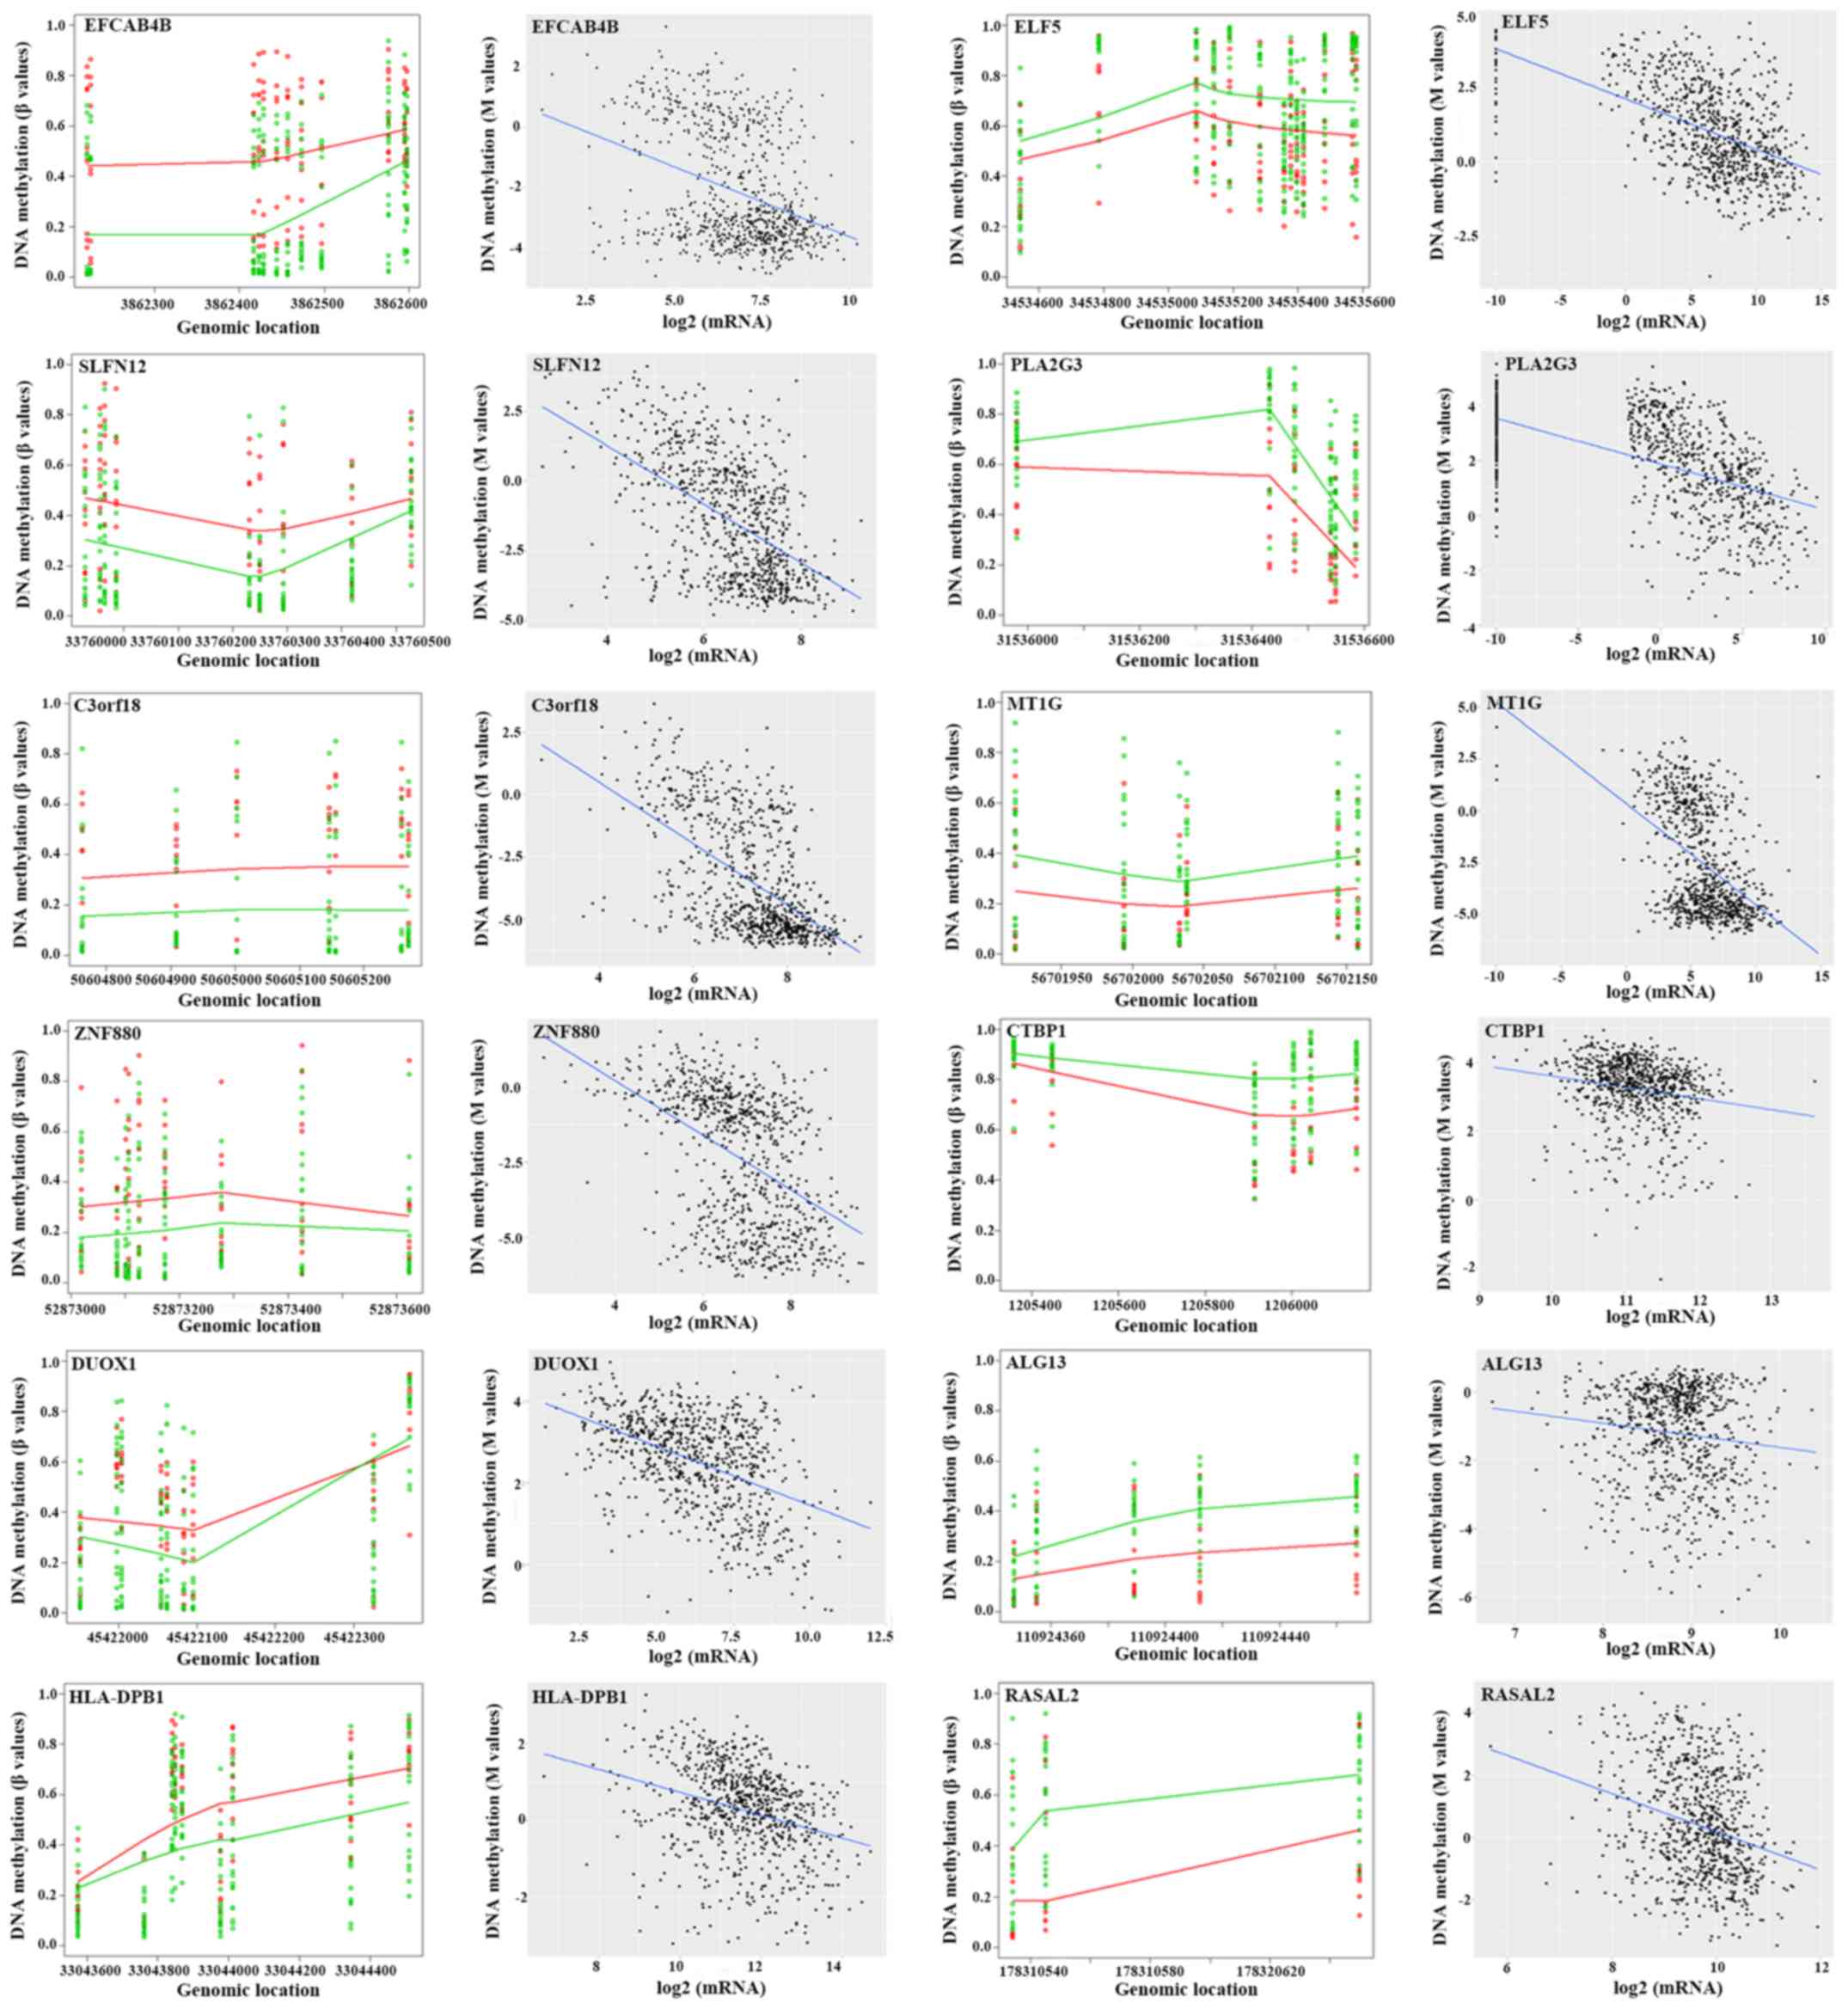 | Figure 4.DMRs of a number of specific genes
between the RTE and STE groups and their association with mRNA
expression levels. Left: The points exhibited methylation
measurements against genomic location. A total of 11 RTE and 21 STE
samples were presented and represented by red points and green
points, respectively, at each genomic location. The curves
represent the smooth estimate of the population-level methylation
profiles for RTE (red) and STE (green) samples. Right: Methylation
measurements (M values) of a number of DMRs were plotted against
the log-transformed mRNA expression. Each point represented an
individual sample from 787 tumor/adjacent tissues measured using
DNA methylation and RNA sequencing data. The specific gene covering
the DMRs is presented in the top left. DMR, differentially
methylated regions; RTE, resistant to endocrine therapy; STE,
sensitive to endocrine therapy; EFCAB4B, calcium release activated
channel regulator 2A; ELF5, E74 like ETS transcription factor 5;
SLFN12, Schlafen family member 12; PLA2G3, phospholipase A2 group
III; C3orf18, chromosome 3 open reading frame 18; MT1G,
metallothionein 1G; ZNF880, zinc finger protein 880; CTBP1,
C-terminal binding protein 1; DUOX1, dual oxidase 1; ALG13, ALG13
UDP-N-acetylglucosaminyltransferase subunit; HLA-DPB1, major
histocompatibility complex, class II, DPβ1; RASAL2, RAS protein
activator like 2. |
Effects of the mRNA expression levels
of numerous genes on the prognosis of patients with ER-positive
BRCA and ET
Considering the association between DNA methylation
and mRNA expression levels in the majority of the DMRs included in
the prediction model, the effects of the mRNA expression levels of
numerous genes on the prognosis of patients with ER-positive BRCA
and ET were investigated using independent datasets in the KM
Plotter tool. The cutoff value of the mRNA expression level for
each gene was set as the median. A number of representative genes
are presented in Fig. 5. Patients
with higher mRNA expression levels of C3orf18 (log-rank P=0.003),
ZNF880 (P=0.035), DUOX1 (P=0.013) and HLA-DPB1 (P=0.033) exhibited
significantly longer RFS times compared with those with lower mRNA
expression levels. Conversely, patients with lower expression
levels of RASAL2 exhibited a significantly longer RFS (P=0.006)
compared with those with increased expression levels. Additionally,
separate survival curves associated with EFCAB4B (P=0.170), SLFN12
(P=0.063), CTBP1 (P=0.170) and ALG13 (P=0.092) expression were
generated; however, statistical significance was not observed.
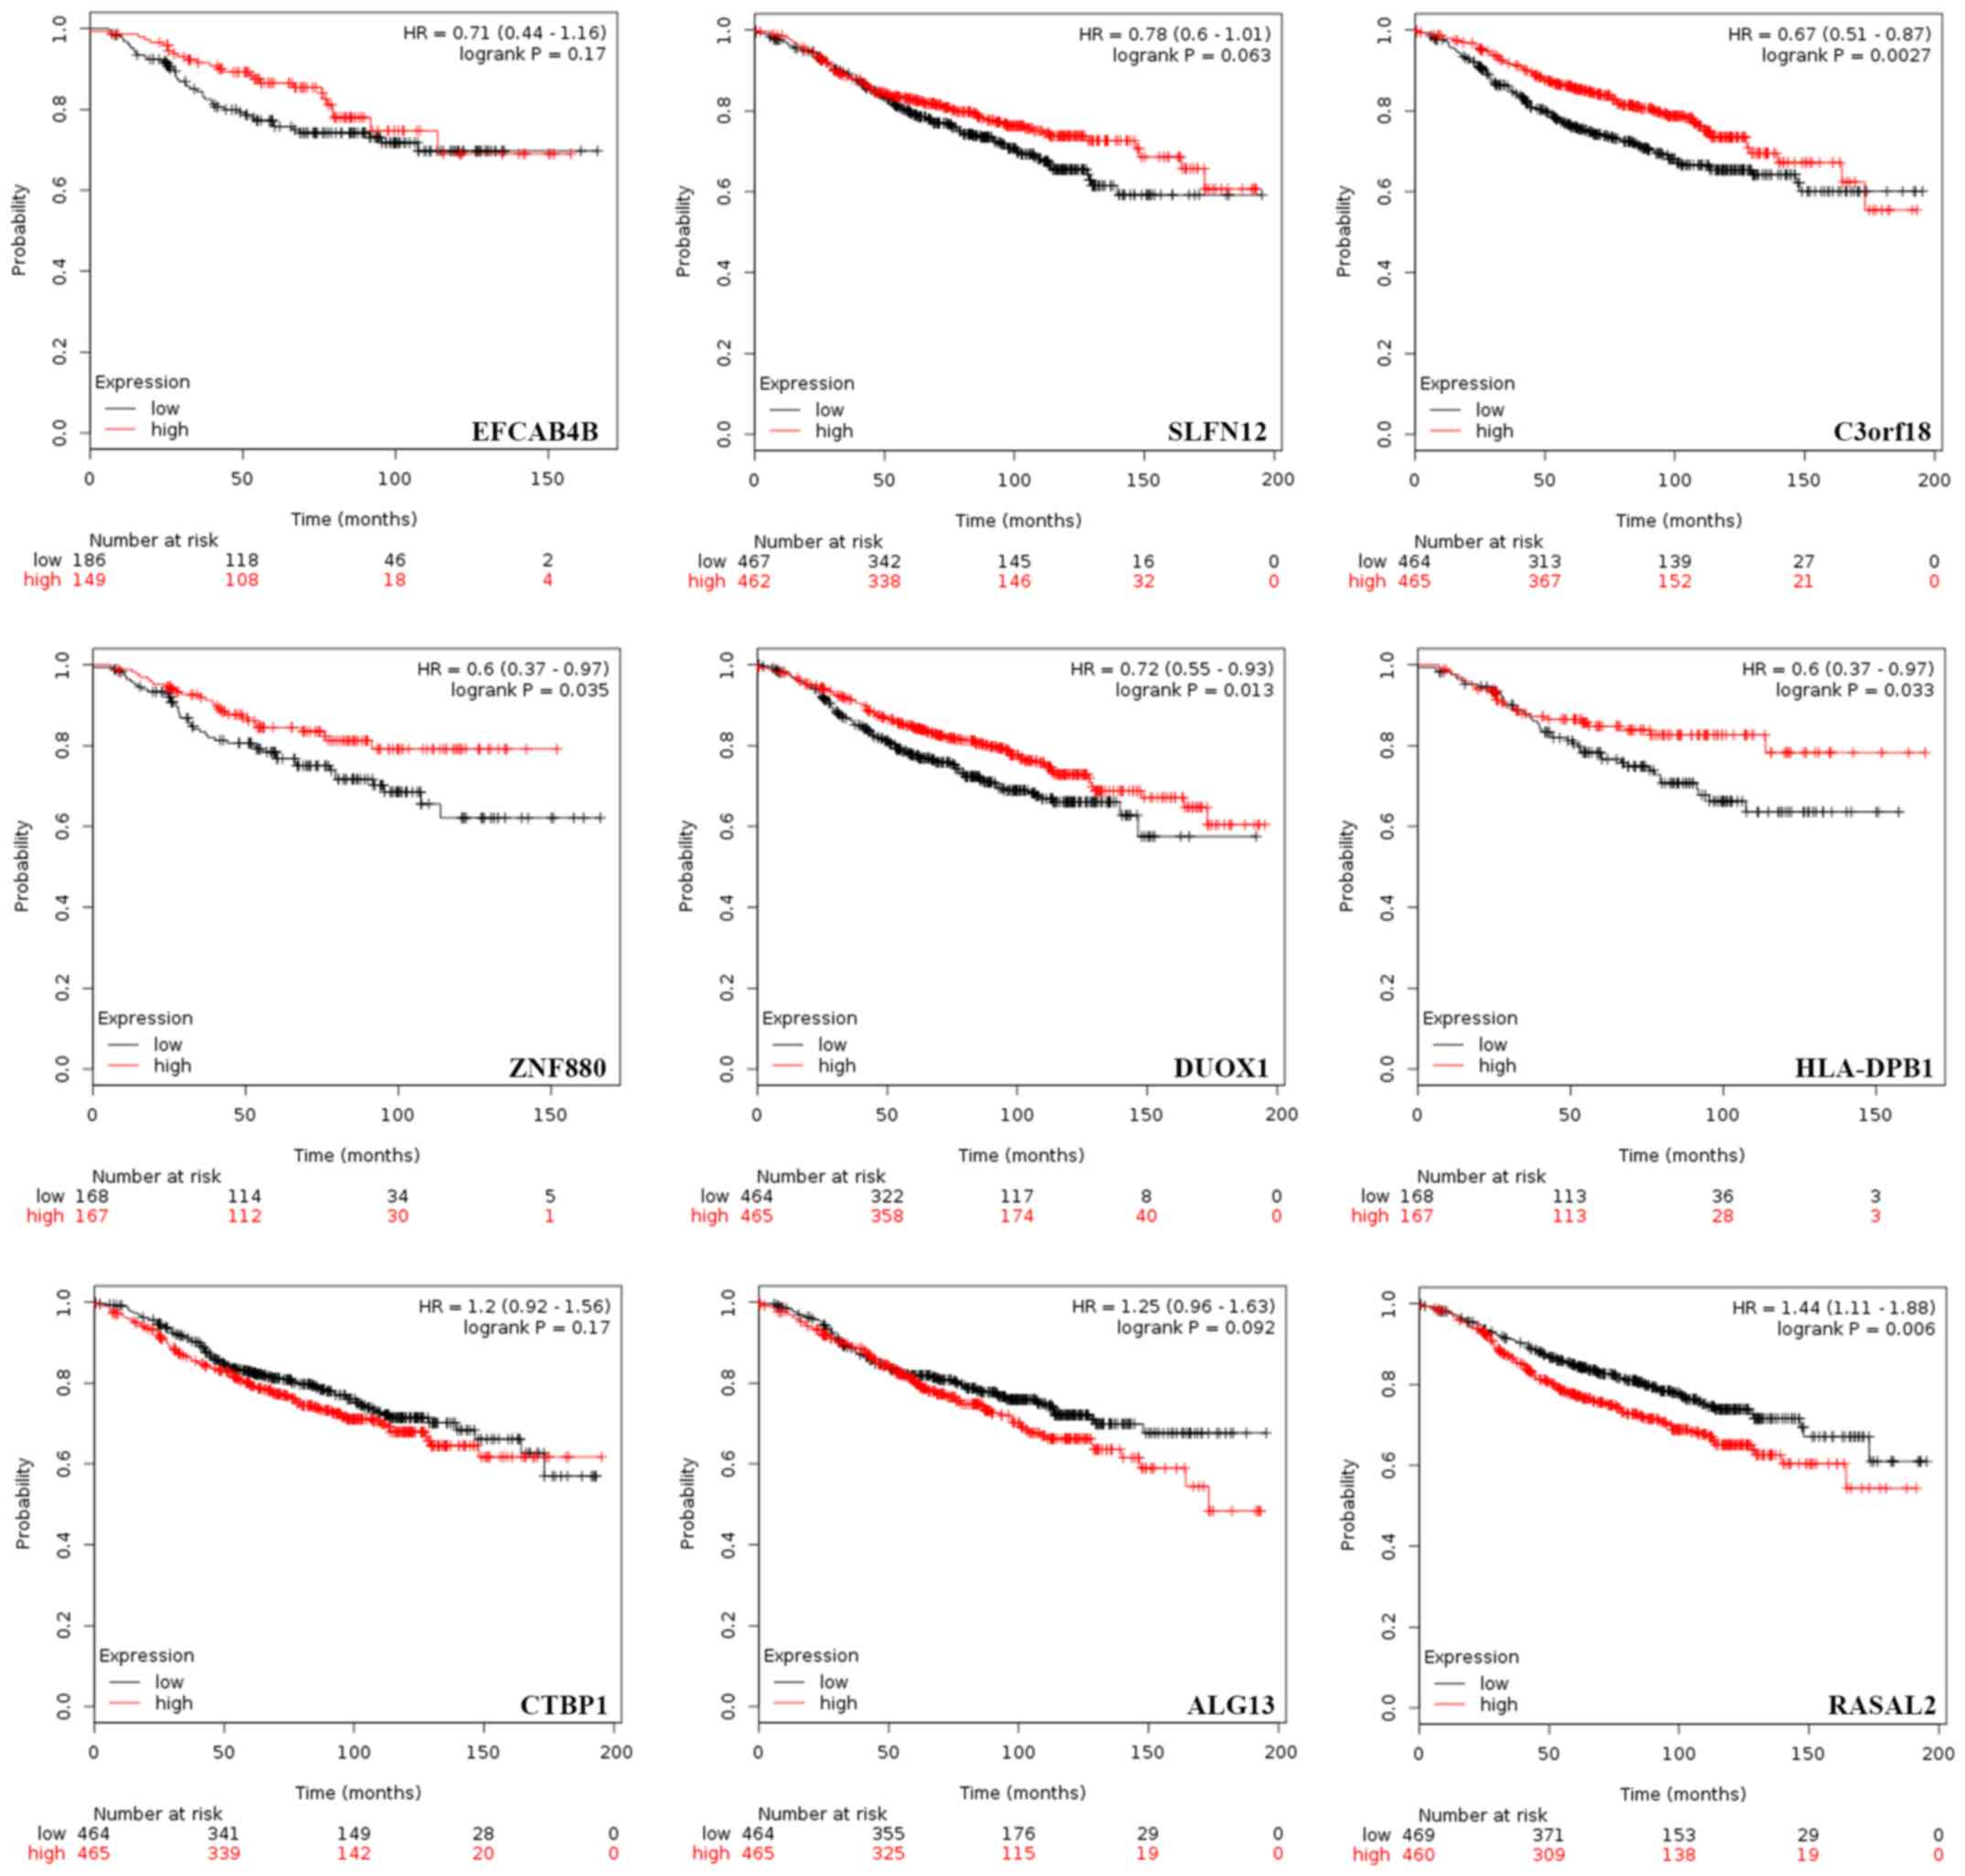 | Figure 5.Prognostic significance of mRNA
expression of a number of specific genes in estrogen
receptor-positive patients with BRCA receiving ET. Effect of mRNA
expression on the relapse-free survival time of patients with BRCA
receiving ET was assessed using the Kaplan Meier plotter. P-values
were obtained from Kaplan Meier analysis with a log-rank test. ET,
endocrine therapy; BRCA, breast cancer; EFCAB4B, calcium release
activated channel regulator 2A; SLFN12, Schlafen family member 12;
C3orf18, chromosome 3 open reading frame 18; ZNF880, zinc finger
protein 880; DUOX1, dual oxidase 1; HLA-DPB1, major
histocompatibility complex, class II, DPβ1; CTBP1, C-terminal
binding protein 1; ALG13, ALG13 UDP-N-acetylglucosaminyltransferase
subunit; RASAL2, RAS protein activator like 2. |
Discussion
Previous studies have indicated that dysregulated
DNA methylation is associated with carcinogenesis and therapeutic
effectiveness (16,17,42). In
the present study, DMRs were identified via the bumphunting
analysis, followed by the building of a predictive classifier to
identify ET-responsive patients with ER-positive BRCA. The RS was
then calculated, which served as an indicator to classify patients
with ER-positive BRCA into two groups with distinct survival
outcomes in two additional independent datasets.
Functional enrichment analyses demonstrated that
genes with DMRs associated with ET sensitivity were associated
organ morphogenesis and development and cell-cell adhesion. The
present study mainly reported on two groups of genes, namely the
PCDH family and homeobox genes. PCDHs, as part of the cadherin
superfamily, were originally identified in the rat brain via
polymerase chain reaction analysis and were associated with certain
types of neurological disease (43,44).
Previously, aberrant PCDH expression was observed in a variety of
human malignant tumor types, potentially due to post-translational
regulatory mechanisms, including DNA methylation (45). In the present study, it was reported
that the methylation status of numerous PCDHs, including PCDHA4,
PCDHA7, PCDHA10, PCDH8 and PCDHGA1 may be associated with the
resistance to ET. In addition, the tumor suppressor and oncogenic
functions of PCDHs have been reported in BRCA (46,47). The
effects of certain PCDHs, including PCDH10, have been
associated with fulvestrant resistance in BRCA (48). The function of PCDHs is associated
with numerous signaling pathways, including the Wnt/β-catenin
(49) and receptor tyrosine kinase
(50) pathways, which have been
proposed to be associated with tamoxifen resistance. The results of
the present study suggested a potential association between PCDHs
and resistance to ET; however, further investigation is
required.
Additionally, the HOX genes encode a family of
highly conserved homeodomain-containing transcription factors that
serve crucial functions during embryogenesis (51). In BRCA, the expression of numerous
HOX genes has been reported to be up- or downregulated, which may
be associated with carcinogenesis, metastasis and tamoxifen
resistance (52,53). It was proposed that HOX genes
contribute to a major part of DNA methylation profiles in BRCA
subtypes (54). In the present
study, the methylation patterns of numerous HOX genes, including
HOXB4, HOXB5, HOXC4, HOXC8, HOXD1 and HOXD4, were observed to be
associated with resistance to ET.
DNA methylation of gene promoters may downregulate
transcriptional expression, affecting tumorigenesis or the
progression of tumor types (52).
Therefore, gene promoters have become the focus of research to
investigate DNA methylation. Li et al (55) reported that 3.3% inter-tumor gene
expression maybe attributed to DNA methylation in gene promoters.
The present study revealed that the locations of DMRs were
primarily in the gene promoter, namely TSS200 and TSS1500; however,
other regions, including the gene body, additionally exhibited a
large proportion of methylation, which indicated that other regions
containing CpG sites may regulate gene expression, contributing to
ET resistance. Li et al (55)
revealed that in addition to the gene promoter, other regions may
substantially affect inter-tumor gene expression. For instance,
enhancer methylation was associated with 4.0% of inter-tumor gene
expression variation (56). Compared
with a single CpG site, the varied methylation of genomic regions
containing a number of CpG sites was more stable. Integrating the
bumphunting method and logistic regression, 60 DMRs were reported
to have the potential to identify patients with ER-positive BRCA
and ET resistance. Due to the inadequate treatment information of
the data from TCGA and the stringent criteria set, sample sizes in
the present study were limited. Therefore, 11 patients with BRCA
possessing a DFS ≤30 months were regarded as exhibiting ET
resistance, while 21 patients exhibiting a DFS >100 months were
regarded as sensitive to ET (57,58). The
limited sample sizes may reduce the comparative power of the
identification of DMRs. Therefore, multiple test adjustment was not
applied to retain potentially genuine biomarkers. Furthermore, the
GSE75067 and GSE72251 datasets lacking treatment information were
included to externally validate the model proposed in the present
study. The survival curves, particularly when the cutoff value of
RS was set as 0.5, demonstrated notable curve separation in
patients with ER-positive BRCA. These survival analyses indicated
the potential application of RS in the prediction of the prognosis
of patients with ER-positive BRCA and suggested its potential for
identifying patients resistant to ET; however, cohorts with a large
sample size are required to further support this predictive
classifier.
Pearson's correlation analyses revealed that the
majority of DMRs (46/60) in the predictive model of the present
study exhibited a negative correlation with the transcript
expression. Numerous genes in this model, including ELF5 (59), CTBP1 (60) and zinc finger protein 423 (ZNF423)
(61), have previously been reported
to be involved in anti-estrogen resistance. Elevated expression
levels of ELF5 were detected in luminal BRCA cells that had
acquired resistance to tamoxifen (59). In addition, ELF5 may be a key
transcriptional determinant of BRCA molecular subtypes by
suppressing estrogen sensitivity in luminal BRCA cells (59). Furthermore, as a corepressor, CTBP1
was reported to be associated with the silencing of
ubiquitin-conjugating enzyme E2 D1 and simultaneously elevated
cyclin D1 expression levels, which may underlie the mechanism of
acquired resistance to 4-hydroxytamoxifen (60). It was demonstrated that ZNF423 may be
an estrogen-inducible BRCA1 transcription factor, and may
contribute to variations in selective ER modulators in the
prevention of BRCA (61).
Additionally, a number of other genes, namely APC regulator of WNT
signaling pathway, PDPN, EPSTI1, SCGB3A1, signal-induced
proliferation-associated 1, acid phosphatase 5, tartrate resistant,
MIR155 host gene, insulin like growth factor binding protein 7,
arachidonate 5-lipoxygenase, protein phosphatase 2 regulatory
subunit B′γ, nuclear factor I C, IKAROS family zinc finger 1,
carbonyl reductase 1, DUOXA1, chordin like 1, disco interacting
protein 2 homolog C, signaling lymphocytic activation molecule
family member 1, Rho guanine nucleotide exchange factor 10, MT1G,
lin-7 homolog A, crumbs cell polarity complex component, F-box
protein 31, EBF transcription factor 1, trafficking protein
particle complex 9, acyl-CoA synthetase long chain family member 1,
RASAL2, ZNF423, protein kinase CΖ, PLA2G3 and ALG13 have been
reported to be involved in the development of cancer (62–65),
including BRCA; however, their association with ET resistance
remains unknown. For instance, previous studies have identified the
increased methylation of SCGB3A1 in metastases compared with that
in primary breast tumor types (62,63). In
non-invasive MCF7 cells, DUOXA1 expression was upregulated compared
with that in highly metastatic cells; DUOXA1 overexpression
sensitized cells to doxorubicin (64). In the present study, the increased
DNA methylation of SCGB3A1 and DUOXA1 were observed in the RTE
group, indicating their potential function in resistance to
anti-estrogenic treatment. Additionally, a significant difference
in the methylation frequencies and expression levels of MT1G was
reported between BRCA subtypes (65). MT1G hypomethylation in patients who
were resistant to ET was detected in the present study, indicating
its association with antiestrogen therapy. The present study also
reported numerous genes that have been rarely investigated in
cancer research, including EFCAB4B. EFCAB4B is a
Ca2+-binding protein that serves a key function in
store-operated calcium entry in T-cells (66). A previous study demonstrated EFCAB4B
hypermethylation in a twin with rheumatoid arthritis compared with
their healthy co-twin (67). The
results of the present study indicate a putative function of
EFCAB4B in ET or potential immune/inflammatory alterations in the
tumor microenvironment; however, further investigation is
required.
Generally, the targeting of numerous genes has been
reported to be superior to targeting an individual target, and DNA
methylation patterns have become a promising diagnostic tool in
addition to gene transcripts in BRCA. In the present study, a
number of DMRs were detected between patients with ET resistance
and those sensitive to ET; DMRs were used to build a predictive
classifier. Furthermore, an RS was generated based on the
classifier, which may determine the distinct outcomes of patients
with ER-positive BRCA, suggesting a beneficial function in the
identification of patients who are resistant to ET. Additionally, a
potential function underlying the development of BRCA and
resistance to ET was indicated for a number of genes (EFCAB4B and
SLFN12); however, further investigation using a larger cohort is
required. The present study primarily proposed a useful tool for
assessing patient responses to ET and a number of potential
therapeutic targets to promote the sensitivity of patients to ET
with ER-positive BRCA.
Acknowledgements
Not applicable.
Funding
The present study was supported by the Medical
Scientific Research Foundation of Guangdong Province, China (grant
no. A2017425), the Youth Research Grant from Shantou University
Medical College Cancer Hospital [grant no. 2018A001, (2018)36] and
the Key Project of Science and Technology of Shantou [grant no.
(2018)37] to Mrs. Fan Zhang; and National Natural Science
Foundation of China (grant nos. 81872147 and 81572588), the Running
Open Grant of Guangdong Provincial Key Laboratory for Breast Cancer
Diagnosis and Treatment (grant no. 2017B030314116), and Guangdong
Provincial Special Fund of Science Innovation Stratege (grant no.
180918104960680) to Professor Yukun Cui.
Availability of data and materials
The datasets analyzed during the present study are
available from The Cancer Genome Atlas (https://portal.gdc.cancer.gov/) and the Gene
Expression Omnibus (https://www.ncbi.nlm.nih.gov/gds/) databases.
Authors' contributions
FZ and YC participated in the conception and design
of the study. FZ downloaded, analyzed the data and drafted the
manuscript. YC revised the manuscript prior to submission. Both
authors have read and approved the final version of the
manuscript.
Ethics approval and consent to
participate
Not applicable.
Patient consent for publication
Not applicable.
Competing interests
The authors declare that they have no competing
interests.
References
|
1
|
Jiang X, Tang H and Chen T: Epidemiology
of gynecologic cancers in China. J Gynecol Oncol. 29:e72018.
View Article : Google Scholar : PubMed/NCBI
|
|
2
|
Campbell LL and Polyak K: Breast tumor
heterogeneity: Cancer stem cells or clonal evolution? Cell Cycle.
6:2332–2338. 2007. View Article : Google Scholar : PubMed/NCBI
|
|
3
|
Nicolini A, Ferrari P and Duffy MJ:
Prognostic and predictive biomarkers in breast cancer: Past,
present and future. Semin Cancer Biol. 52:56–73. 2018. View Article : Google Scholar : PubMed/NCBI
|
|
4
|
Hammond ME, Hayes DF, Dowsett M, Allred
DC, Hagerty KL, Badve S, Fitzgibbons PL, Francis G, Goldstein NS,
Hayes M, et al: American Society of Clinical Oncology/College of
American Pathologists guideline recommendations for
immunohistochemical testing of estrogen and progesterone receptors
in breast cancer (unabridged version). Arch Pathol Lab Med.
134:e48–e72. 2010.PubMed/NCBI
|
|
5
|
Mendes TF, Kluskens LD and Rodrigues LR:
Triple negative breast cancer: Nanosolutions for a big challenge.
Adv Sci (Weinh). 2:15000532015. View Article : Google Scholar : PubMed/NCBI
|
|
6
|
Badia E, Oliva J, Balaguer P and Cavaillès
V: Tamoxifen resistance and epigenetic modifications in breast
cancer cell lines. Curr Med Chem. 14:3035–3045. 2007. View Article : Google Scholar : PubMed/NCBI
|
|
7
|
Abdel-Hafiz HA: Epigenetic mechanisms of
tamoxifen resistance in luminal breast cancer. Diseases. 5(pii):
E162017. View Article : Google Scholar : PubMed/NCBI
|
|
8
|
Harbeck N and Rody A: Lost in translation?
Estrogen receptor status and endocrine responsiveness in breast
cancer. J Clin Oncol. 30:686–689. 2012. View Article : Google Scholar : PubMed/NCBI
|
|
9
|
Gururaj AE, Rayala SK, Vadlamudi RK and
Kumar R: Novel mechanisms of resistance to endocrine therapy:
Genomic and nongenomic considerations. Clin Cancer Res.
12:1001s–1007s. 2006. View Article : Google Scholar : PubMed/NCBI
|
|
10
|
Ali S and Coombes RC: Endocrine-responsive
breast cancer and strategies for combating resistance. Nat Rev
Cancer. 2:101–112. 2002. View
Article : Google Scholar : PubMed/NCBI
|
|
11
|
Smith IE, Walsh G, Skene A, Llombart A,
Mayordomo JI, Detre S, Salter J, Clark E, Magill P and Dowsett M: A
phase II placebo-controlled trial of neoadjuvant anastrozole alone
or with gefitinib in early breast cancer. J Clin Oncol.
25:3816–3822. 2007. View Article : Google Scholar : PubMed/NCBI
|
|
12
|
Johnston SR, Martin LA, Leary A, Head J
and Dowsett M: Clinical strategies for rationale combinations of
aromatase inhibitors with novel therapies for breast cancer. J
Steroid Biochem Mol Biol. 106:180–186. 2007. View Article : Google Scholar : PubMed/NCBI
|
|
13
|
Paik S, Shak S, Tang G, Kim C, Baker J,
Cronin M, Baehner FL, Walker MG, Watson D, Park T, et al: A
multigene assay to predict recurrence of tamoxifen-treated,
node-negative breast cancer. N Engl J Med. 351:2817–2826. 2004.
View Article : Google Scholar : PubMed/NCBI
|
|
14
|
Cardoso F, van't Veer LJ, Bogaerts J,
Slaets L, Viale G, Delaloge S, Pierga JY, Brain E, Causeret S,
DeLorenzi M, et al: 70-Gene signature as an aid to treatment
decisions in early-stage breast cancer. N Engl J Med. 375:717–729.
2016. View Article : Google Scholar : PubMed/NCBI
|
|
15
|
Stone A, Valdes-Mora F and Clark SJ:
Exploring and exploiting the aberrant DNA methylation profile of
endocrine-resistant breast cancer. Epigenomics. 5:595–598. 2013.
View Article : Google Scholar : PubMed/NCBI
|
|
16
|
Jones PA and Baylin SB: The epigenomics of
cancer. Cell. 128:683–692. 2007. View Article : Google Scholar : PubMed/NCBI
|
|
17
|
Glasspool RM, Teodoridis JM and Brown R:
Epigenetics as a mechanism driving polygenic clinical drug
resistance. Br J Cancer. 94:1087–1092. 2006. View Article : Google Scholar : PubMed/NCBI
|
|
18
|
Ward AK, Mellor P, Smith SE, Kendall S,
Just NA, Vizeacoumar FS, Sarker S, Phillips Z, Alvi R, Saxena A, et
al: Epigenetic silencing of CREB3L1 by DNA methylation is
associated with high-grade metastatic breast cancers with poor
prognosis and is prevalent in triple negative breast cancers.
Breast Cancer Res. 18:122016. View Article : Google Scholar : PubMed/NCBI
|
|
19
|
Lubecka K, Kurzava L, Flower K, Buvala H,
Zhang H, Teegarden D, Camarillo I, Suderman M, Kuang S, Andrisani
O, et al: Stilbenoids remodel the DNA methylation patterns in
breast cancer cells and inhibit oncogenic NOTCH signaling through
epigenetic regulation of MAML2 transcriptional activity.
Carcinogenesis. 37:656–668. 2016. View Article : Google Scholar : PubMed/NCBI
|
|
20
|
Looi ML, Zakaria H, Osman J and Jamal R:
Quantity and quality assessment of DNA extracted from saliva and
blood. Clin Lab. 58:307–312. 2012.PubMed/NCBI
|
|
21
|
Bediaga NG, Acha-Sagredo A, Guerra I,
Viguri A, Albaina C, Ruiz Diaz I, Rezola R, Alberdi MJ, Dopazo J,
Montaner D, et al: DNA methylation epigenotypes in breast cancer
molecular subtypes. Breast Cancer Res. 12:R772010. View Article : Google Scholar : PubMed/NCBI
|
|
22
|
Feng W, Shen L, Wen S, Rosen DG, Jelinek
J, Hu X, Huan S, Huang M, Liu J, Sahin AA, et al: Correlation
between CpG methylation profiles and hormone receptor status in
breast cancers. Breast Cancer Res. 9:R572007. View Article : Google Scholar : PubMed/NCBI
|
|
23
|
Holm K, Hegardt C, Staaf J,
Vallon-Christersson J, Jonsson G, Olsson H, Borg A and Ringnér M:
Molecular subtypes of breast cancer are associated with
characteristic DNA methylation patterns. Breast Cancer Res.
12:R362010. View Article : Google Scholar : PubMed/NCBI
|
|
24
|
Stone A, Valdés-Mora F, Gee JM, Farrow L,
McClelland RA, Fiegl H, Dutkowski C, McCloy RA, Sutherland RL,
Musgrove EA and Nicholson RI: Tamoxifen-induced epigenetic
silencing of oestrogen-regulated genes in anti-hormone resistant
breast cancer. PLoS One. 7:e404662012. View Article : Google Scholar : PubMed/NCBI
|
|
25
|
Magnani L, Stoeck A, Zhang X, Lanczky A,
Mirabella AC, Wang TL, Gyorffy B and Lupien M: Genome-wide
reprogramming of the chromatin landscape underlies endocrine
therapy resistance in breast cancer. Proc Natl Acad Sci USA.
110:E1490–E1499. 2013. View Article : Google Scholar : PubMed/NCBI
|
|
26
|
Aran D and Hellman A: DNA methylation of
transcriptional enhancers and cancer predisposition. Cell.
154:11–13. 2013. View Article : Google Scholar : PubMed/NCBI
|
|
27
|
Jaenisch R and Bird A: Epigenetic
regulation of gene expression: How the genome integrates intrinsic
and environmental signals. Nat Genet. 33 (Suppl):S245–S254. 2003.
View Article : Google Scholar
|
|
28
|
Irizarry RA, Ladd-Acosta C, Wen B, Wu Z,
Montano C, Onyango P, Cui H, Gabo K, Rongione M, Webster M, et al:
The human colon cancer methylome shows similar hypo- and
hypermethylation at conserved tissue-specific CpG island shores.
Nat Genet. 41:178–186. 2009. View
Article : Google Scholar : PubMed/NCBI
|
|
29
|
Jaffe AE, Murakami P, Lee H, Leek JT,
Fallin MD, Feinberg AP and Irizarry RA: Bump hunting to identify
differentially methylated regions in epigenetic epidemiology
studies. Int J Epidemiol. 41:200–209. 2012. View Article : Google Scholar : PubMed/NCBI
|
|
30
|
Li B and Dewey CN: RSEM: Accurate
transcript quantification from RNA-Seq data with or without a
reference genome. BMC Bioinformatics. 12:3232011. View Article : Google Scholar : PubMed/NCBI
|
|
31
|
Holm K, Staaf J, Lauss M, Aine M, Lindgren
D, Bendahl PO, Vallon-Christersson J, Barkardottir RB, Höglund M,
Borg Å, et al: An integrated genomics analysis of epigenetic
subtypes in human breast tumors links DNA methylation patterns to
chromatin states in normal mammary cells. Breast Cancer Res.
18:272016. View Article : Google Scholar : PubMed/NCBI
|
|
32
|
Jeschke J, Bizet M, Desmedt C, Calonne E,
Dedeurwaerder S, Garaud S, Koch A, Larsimont D, Salgado R, Van den
Eynden G, et al: DNA methylation-based immune response signature
improves patient diagnosis in multiple cancers. J Clin Invest.
127:3090–3102. 2017. View Article : Google Scholar : PubMed/NCBI
|
|
33
|
Edgar R, Domrachev M and Lash AE: Gene
expression omnibus: NCBI gene expression and hybridization array
data repository. Nucleic Acids Res. 30:207–210. 2002. View Article : Google Scholar : PubMed/NCBI
|
|
34
|
Edge SB and Compton CC: The American joint
committee on cancer: The 7th edition of the AJCC cancer staging
manual and the future of TNM. Ann Surg Oncol. 17:1471–1474. 2010.
View Article : Google Scholar : PubMed/NCBI
|
|
35
|
Kim SI, Park BW and Lee KS: Comparison of
stage-specific outcome of breast cancer based on 5th and 6th AJCC
staging system. J Surg Oncol. 93:221–227. 2006. View Article : Google Scholar : PubMed/NCBI
|
|
36
|
Yu G, Wang LG, Han Y and He QY:
clusterProfiler: An R package for comparing biological themes among
gene clusters. OMICS. 16:284–287. 2012. View Article : Google Scholar : PubMed/NCBI
|
|
37
|
Ashburner M, Ball CA, Blake JA, Botstein
D, Butler H, Cherry JM, Davis AP, Dolinski K, Dwight SS, Eppig JT,
et al: Gene ontology: Tool for the unification of biology. The Gene
Ontology Consortium. Nat Genet. 25:25–29. 2000. View Article : Google Scholar : PubMed/NCBI
|
|
38
|
The Gene Ontology Consortium: The gene
ontology resource: 20 years and still GOing strong. Nucleic Acids
Res. 47:D330–D338. 2019. View Article : Google Scholar : PubMed/NCBI
|
|
39
|
Benjamini Y and Hochberg Y: Controlling
the false discovery rate: A practical and powerful approach to
multiple testing. J R Statist Soc B. 57:289–300. 1995.
|
|
40
|
Lánczky A, Nagy Á, Bottai G, Munkácsy G,
Szabó A, Santarpia L and Győrffy B: miRpower: A web-tool to
validate survival- associated miRNAs utilizing expression data from
2178 breast cancer patients. Breast Cancer Res Treat. 160:439–446.
2016. View Article : Google Scholar : PubMed/NCBI
|
|
41
|
Györffy B, Lanczky A, Eklund AC, Denkert
C, Budczies J, Li Q and Szallasi Z: An online survival analysis
tool to rapidly assess the effect of 22,277 genes on breast cancer
prognosis using microarray data of 1,809 patients. Breast Cancer
Res Treat. 123:725–731. 2010. View Article : Google Scholar : PubMed/NCBI
|
|
42
|
Tuo YL and Ye YF: MGP is downregulated due
to promoter methylation in chemoresistant ER+ breast cancer and
high MGP expression predicts better survival outcomes. Eur Rev Med
Pharmacol Sci. 21:3871–3878. 2017.PubMed/NCBI
|
|
43
|
Sano K, Tanihara H, Heimark RL, Obata S,
Davidson M, St John T, Taketani S and Suzuki S: Protocadherins: A
large family of cadherin-related molecules in central nervous
system. EMBO J. 12:2249–2256. 1993. View Article : Google Scholar : PubMed/NCBI
|
|
44
|
Yagi T and Takeichi M: Cadherin
superfamily genes: Functions, genomic organization, and neurologic
diversity. Genes Dev. 14:1169–1180. 2000.PubMed/NCBI
|
|
45
|
Kawaguchi M, Toyama T, Kaneko R, Hirayama
T, Kawamura Y and Yagi T: Relationship between DNA methylation
states and transcription of individual isoforms encoded by the
protocadherin-alpha gene cluster. J Biol Chem. 283:12064–12075.
2008. View Article : Google Scholar : PubMed/NCBI
|
|
46
|
Yu JS, Koujak S, Nagase S, Li CM, Su T,
Wang X, Keniry M, Memeo L, Rojtman A, Mansukhani M, et al: PCDH8,
the human homolog of PAPC, is a candidate tumor suppressor of
breast cancer. Oncogene. 27:4657–4665. 2008. View Article : Google Scholar : PubMed/NCBI
|
|
47
|
Li AM, Tian AX, Zhang RX, Ge J, Sun X and
Cao XC: Protocadherin-7 induces bone metastasis of breast cancer.
Biochem Biophys Res Commun. 436:486–490. 2013. View Article : Google Scholar : PubMed/NCBI
|
|
48
|
Liu P, Sun M, Jiang W, Zhao J, Liang C and
Zhang H: Identification of targets of miRNA-221 and miRNA-222 in
fulvestrant-resistant breast cancer. Oncol Lett. 12:3882–3888.
2016. View Article : Google Scholar : PubMed/NCBI
|
|
49
|
Liu H, Wang G, Yang L, Qu J, Yang Z and
Zhou X: Knockdown of long non-coding RNA UCA1 increases the
tamoxifen sensitivity of breast cancer cells through inhibition of
Wnt/β-catenin pathway. PLoS One. 11:e01684062016. View Article : Google Scholar : PubMed/NCBI
|
|
50
|
Mansouri S, Naghavi-Al-Hosseini F,
Farahmand L and Majidzadeh AK: MED1 may explain the interaction
between receptor tyrosine kinases and ERα66 in the complicated
network of Tamoxifen resistance. Eur J Pharmacol. 804:78–81. 2017.
View Article : Google Scholar : PubMed/NCBI
|
|
51
|
Bhatlekar S, Fields JZ and Boman BM: Role
of HOX genes in stem cell differentiation and cancer. Stem Cells
Int 2018. 35694932018.
|
|
52
|
Shah M, Cardenas R, Wang B, Persson J,
Mongan NP, Grabowska A and Allegrucci C: HOXC8 regulates
self-renewal, differentiation and transformation of breast cancer
stem cells. Mol Cancer. 16:382017. View Article : Google Scholar : PubMed/NCBI
|
|
53
|
Lee JY, Hur H, Yun HJ, Kim Y, Yang S, Kim
SI and Kim MH: HOXB5 promotes the proliferation and invasion of
breast cancer cells. Int J Biol Sci. 11:701–711. 2015. View Article : Google Scholar : PubMed/NCBI
|
|
54
|
Kamalakaran S, Varadan V, Giercksky
Russnes HE, Levy D, Kendall J, Janevski A, Riggs M, Banerjee N,
Synnestvedt M, Schlichting E, et al: DNA methylation patterns in
luminal breast cancers differ from non-luminal subtypes and can
identify relapse risk independent of other clinical variables. Mol
Oncol. 5:77–92. 2011. View Article : Google Scholar : PubMed/NCBI
|
|
55
|
Li Q, Seo JH, Stranger B, McKenna A, Pe'er
I, Laframboise T, Brown M, Tyekucheva S and Freedman ML:
Integrative eQTL-based analyses reveal the biology of breast cancer
risk loci. Cell. 152:633–641. 2013. View Article : Google Scholar : PubMed/NCBI
|
|
56
|
Maston GA, Evans SK and Green MR:
Transcriptional regulatory elements in the human genome. Annu Rev
Genomics Hum Genet. 7:29–59. 2006. View Article : Google Scholar : PubMed/NCBI
|
|
57
|
Cardoso F, Costa A, Norton L, Senkus E,
Aapro M, André F, Barrios CH, Bergh J, Biganzoli L, Blackwell KL,
et al: ESO-ESMO 2nd international consensus guidelines for advanced
breast cancer (ABC2)†. Ann Oncol. 25:1871–1888. 2014. View Article : Google Scholar : PubMed/NCBI
|
|
58
|
Ali S, Rasool M, Chaoudhry H, N Pushparaj
P, Jha P, Hafiz A, Mahfooz M, Abdus Sami G, Azhar Kamal M, Bashir
S, et al: Molecular mechanisms and mode of tamoxifen resistance in
breast cancer. Bioinformation. 12:135–139. 2016. View Article : Google Scholar : PubMed/NCBI
|
|
59
|
Kalyuga M, Gallego-Ortega D, Lee HJ, Roden
DL, Cowley MJ, Caldon CE, Stone A, Allerdice SL, Valdes-Mora F,
Launchbury R, et al: ELF5 suppresses estrogen sensitivity and
underpins the acquisition of antiestrogen resistance in luminal
breast cancer. PLoS Biol. 10:e10014612012. View Article : Google Scholar : PubMed/NCBI
|
|
60
|
Mittal MK, Singh K, Misra S and Chaudhuri
G: SLUG-induced elevation of D1 cyclin in breast cancer cells
through the inhibition of its ubiquitination. J Biol Chem.
286:469–479. 2011. View Article : Google Scholar : PubMed/NCBI
|
|
61
|
Ingle JN, Liu M, Wickerham DL, Schaid DJ,
Wang L, Mushiroda T, Kubo M, Costantino JP, Vogel VG, Paik S, et
al: Selective estrogen receptor modulators and pharmacogenomic
variation in ZNF423 regulation of BRCA1 expression: Individualized
breast cancer prevention. Cancer Discov. 3:812–825. 2013.
View Article : Google Scholar : PubMed/NCBI
|
|
62
|
Marino N, Woditschka S, Reed LT, Nakayama
J, Mayer M, Wetzel M and Steeg PS: Breast cancer metastasis: Issues
for the personalization of its prevention and treatment. Am J
Pathol. 183:1084–1095. 2013. View Article : Google Scholar : PubMed/NCBI
|
|
63
|
Mehrotra J, Vali M, McVeigh M, Kominsky
SL, Fackler MJ, Lahti-Domenici J, Polyak K, Sacchi N, Garrett-Mayer
E, Argani P and Sukumar S: Very high frequency of hypermethylated
genes in breast cancer metastasis to the bone, brain, and lung.
Clin Cancer Res. 10:3104–3109. 2004. View Article : Google Scholar : PubMed/NCBI
|
|
64
|
Ostrakhovitch EA and Li SS: NIP1/DUOXA1
expression in epithelial breast cancer cells: Regulation of cell
adhesion and actin dynamics. Breast Cancer Res Treat. 119:773–786.
2010. View Article : Google Scholar : PubMed/NCBI
|
|
65
|
Park SY, Kwon HJ, Choi Y, Lee HE, Kim SW,
Kim JH, Kim IA, Jung N, Cho NY and Kang GH: Distinct patterns of
promoter CpG island methylation of breast cancer subtypes are
associated with stem cell phenotypes. Mod Pathol. 25:185–196. 2012.
View Article : Google Scholar : PubMed/NCBI
|
|
66
|
Feske S: Calcium signalling in lymphocyte
activation and disease. Nat Rev Immunol. 7:690–702. 2007.
View Article : Google Scholar : PubMed/NCBI
|
|
67
|
Svendsen AJ, Gervin K, Lyle R,
Christiansen L, Kyvik K, Junker P, Nielsen C, Houen G and Tan Q:
Differentially methylated DNA regions in monozygotic twin pairs
discordant for rheumatoid arthritis: An epigenome-wide study. Front
Immunol. 7:5102016. View Article : Google Scholar : PubMed/NCBI
|


