Introduction
Lung cancer was reported to have the world's leading
cancer-associated mortality in 2008 (1). It is classified into two main
histological subtypes: Non-small cell lung cancer (NSCLC), which
accounts for ~85% of cases, and small cell lung cancer (SCLC)
(2). NSCLC is further subdivided
into lung squamous cell carcinoma (LUSC) and lung adenocarcinomas
(LUAD), which generally affect the epithelial cells lining the
larger airways and the peripheral smaller airways, respectively
(3). The majority of patients with
lung cancer are diagnosed at advanced stages and consequently the
five-year survival rate is 16.8% (4). The identification of new diagnostic
strategies is therefore required to reduce lung cancer-associated
mortality (5).
MicroRNAs (miRNAs/miRs) are small, stable,
single-stranded non-coding RNAs which are present in tissues and
body fluids (6). These molecules
have been revealed to serve roles in the mechanisms underlying
cancer initiation and progression (7–9).
Previous studies have demonstrated the potential use of miRNAs in
the non-invasive detection of LOAD (2) as well as in the classification of
diverse histological subtypes and identification of the source
tissue in cases of poorly differentiated tumors (10).
Machine learning may be used as an alternative
approach to statistical methods including differential expression
analysis (11). There are two main
types of machine learning algorithms: Supervised, where the
algorithm is given some prior knowledge, and unsupervised, where it
is not given any prior information. The most common applications of
unsupervised and supervised learning are clustering and
discriminant analysis, respectively. A decision tree is a type of
supervised machine learning algorithm used for discriminant
analysis, which is simple to understand and interpret. It allows
the extraction of knowledge from data by generating understandable
knowledge structures in the form of hierarchical trees or sets of
rules and presenting them in a graphically intuitive way.
Attributes which are important for prediction or classification are
subsequently selected with a low computational cost. A decision
tree is a greedy algorithm constructed by a step-by-step process
called recursive partitioning which is also known as hierarchical
classification. The dataset is divided into training and testing
data and the training data are subsequently used to create the
decision tree model and test its performance (12). Several studies have used decision
trees to solve biological problems, including predicting the
expression status using chromatin modifications in the Encyclopedia
of DNA Elements pilot project (13)
and identifying cancer tissue origin using microRNAs (14,15).
Decision trees have also been used to identify biomarkers in
cancer, including defining a set of prognostic biomarkers for lung
cancer using nuclear receptor expression (16). Although less widely used compared
with differential analysis methods, the decision tree method is
applicable in cancer classification using gene expression data
(17).
The present study aimed to identify lung cancer
diagnostic and subtyping biomarkers by applying the decision tree
method to the largest publicly available repository of miRNA
expression in lung cancer collected by The Cancer Genome Atlas
(https://portal.gdc.cancer.gov/).
Materials and methods
All calculations and plotting associated with data
retrieval, preprocessing, filtering, differential expression,
normalization, handling class imbalance, and applying and
evaluating machine learning algorithms were performed in R (version
3.5.0; The R Foundation for Statistical Computing; http://www.r-project.org/foundation) using
bioconductor packages (18). The
biomarker discovery pipeline used in the current study is the same
as previously described (19).
Data retrieval and exploratory data
analysis
Level three miRNA sequencing data as well as the
clinical dataset were obtained from 1,068 samples from two lung
cancer projects (LUAD and LUSC) in TCGA (https://portal.gdc.cancer.gov/). The sequencing data
were retrieved and prepared using the TCGAbiolinks package
(20). The LUAD project included 499
solid tumor and 46 normal control samples from tissues adjacent to
the tumor site, and the LUSC project included 478 solid tumors and
45 normal control samples (21,22).
Filtering features, samples and
partitioning datasets
Non-specific filtering was performed by removing
miRNAs with expressions of <100 reads over at least 10 samples
to exclude uninteresting features without regard to the phenotype
data and to reduce the number of features that were included in
further analysis (19). The
genefilter package (23) reduced
1,208 features to 310 features in LUAD and 301 in LUSC. Samples
that did not have clinical information in the database were also
excluded.
Data were partitioned into training (70%) and
testing (30%) datasets using the caret package (24) and all subsequent exploratory data
analysis and model training were performed only on training
datasets. Exploratory data analysis and principal component
analysis (PCA) were performed using the EDAseq package (25). PCA plots were drawn in logarithmic
scales (Fig. 1).
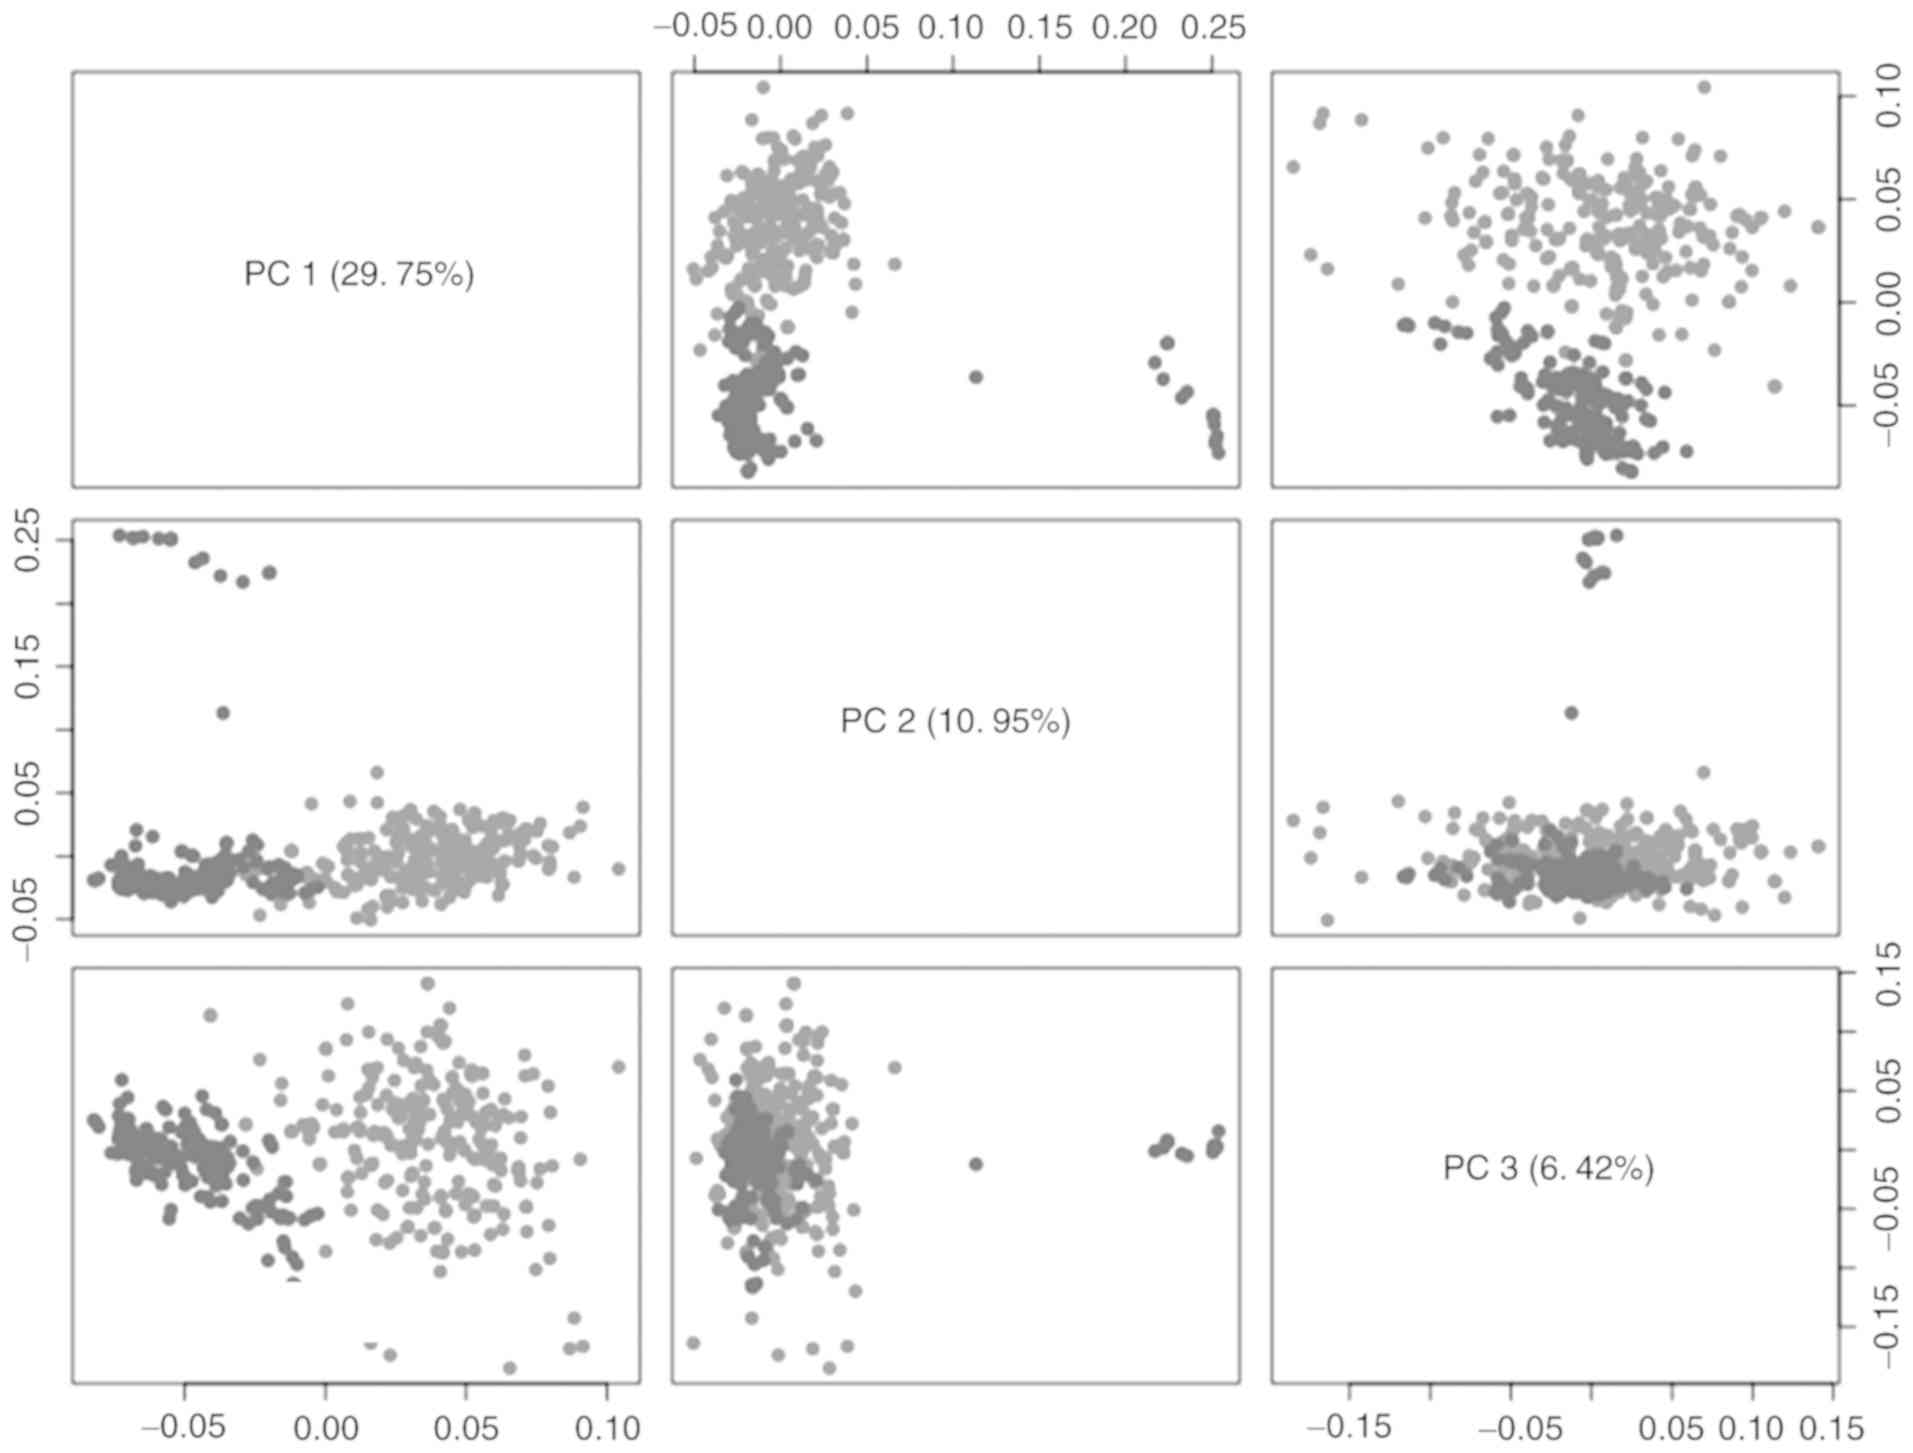 | Figure 1.PCA matrix plot of miRNA expression
in samples obtained from patients with lung cancer in TCGA
database. Three main PCs, including PC1, PC2 and PC3, of miRNA
expression in LUAD and LUSC from TCGA database were plotted and
colored according to their cancer status (light and dark gray
represent cancer and normal, respectively). Each PC is a linear
combination of normalized miRNA sequencing counts. In this plot,
the diagonal cells specify the axes (PC1, PC2 and PC3) of the
remaining cells of the plot. The samples were projected into a
lower dimensional space and clustered by their cancer status. LUAD,
lung adenocarcinoma; LUSC, lung squamous cell carcinoma; TCGA, The
Cancer Genome Atlas; PCA, principal component analysis; PC,
principal component. |
Normalization and differential
expression
The TCGA miRNA expression data were generated
through a large collaborative project involving a number of
sequencing centers and the data therefore included different
batches (19). In order to account
for this, the TCGA gene expression data set was normalized using
the remove unwanted variation (RUV) normalization method. A set of
miRNAs whose expression did not vary across samples, referred to as
‘negative controls’, were used for the normalization procedure. In
order to obtain in silico empirical negative control miRNAs,
the P- and P-adjusted values for all miRNAs were calculated between
lung cancer status (normal and tumor) or between its two subtypes
(LUAD and LUSC). miRNAs with P>0.5 were selected for further
study. These sets of empirical controls were used to remove the
factors of unwanted variation and to normalize the data sets for
classification. Unwanted variation of raw miRNA sequencing data was
removed using the RUVseq package (26), with miRNAs obtained from differential
analysis as the internal controls. Least significantly
differentially expressed miRNAs obtained using the DESeq2 package
were used as internal negative controls (27). A total of 13 miRNAs in LUSC, 32
miRNAs in LUAD, and 17 and 15 miRNAs in LUAD and LUSC,
respectively, were used as internal controls for classification of
cancer status and subtypes. Factors of unwanted variation, k=1,
were considered in all calculations.
Combating imbalance, tree model
training, evaluation and plotting
Class imbalance in training and testing datasets
were addressed separately using the Synthetic Minority Oversampling
Technique (SMOTE) (28) in the DMwR
package (29). Supervised
classification was performed using Recursive Partitioning and
Regression Trees (RPART), and was implemented using the RPART
package (version 4.1–13). Decision trees from the RPART model were
plotted using the rattle package version 5.1.0 (30,31).
This was followed by adjusted pruning which improves decision tree
accuracy by avoiding over-fitting to the training set and reducing
its size. The complexity parameter by which the RPART objects
trimmed was 0.001.
ROC curve analyses
ROC curve analyses were performed in R version 3.5.0
(The R Foundation for Statistical Computing, http://www.r-project.org/foundation) using procedures
from the pROC (32) package.
Results
Least significantly differentially
expressed miRNAs are used for normalization and removal of
technical variability
Correction of unwanted variation in data was
required in order to fulfill the assumption that the biological
variation of interest was the main source of variation in the
current study. Since miRNA sequencing expression data obtained from
TCGA involved multiple laboratories, unwanted variation dominated
the data. The RUV method using in silico empirical controls
obtained by differential expression analysis was used for
normalization of the data in the present study. The RUV allows the
removal of laboratory-specific effects to allow the combined
analysis of miRNA sequencing expression changes (26).
Four sets of empirical negative controls based on
differential expression analysis were used in the current study.
First-pass differential expression analysis was performed in LUAD,
LUSC and in combined subtypes separately. Cancer status and cancer
subtype were used to obtain least significantly differentially
expressed miRNAs. miRNAs with P>0.5 were selected as
negative controls. Two sets of empirical negative controls were
obtained in combined subtypes (LUAD and LUSC) under two sets of
conditions: Cancer status and cancer subtype (Table I).
 | Table I.Least significantly differentially
expressed miRNAs in lung cancer considering status of cancer or its
subtypes. |
Table I.
Least significantly differentially
expressed miRNAs in lung cancer considering status of cancer or its
subtypes.
| A, Cancer status
control miRs |
|---|
|
|---|
| miR | Lfc | Adjusted
P-value |
|---|
| hsa-mir-6718 | −0.155 | 0.546 |
| hsa-mir-23a | −0.047 | 0.573 |
| hsa-mir-330 | 0.067 | 0.573 |
| hsa-mir-6720 | −0.136 | 0.573 |
| hsa-mir-181b-2 | −0.066 | 0.606 |
| hsa-mir-5683 | −0.117 | 0.709 |
| hsa-mir-363 | 0.076 | 0.711 |
| hsa-mir-3074 | −0.056 | 0.732 |
| hsa-mir-132 | −0.034 | 0.756 |
| hsa-mir-30e | 0.024 | 0.764 |
| hsa-mir-25 | 0.018 | 0.854 |
| hsa-mir-181b-1 | −0.017 | 0.893 |
| hsa-mir-27b | −0.010 | 0.915 |
| hsa-mir-151a | 0.010 | 0.927 |
| hsa-mir-92b | 0.011 | 0.943 |
| hsa-mir-3130-1 | 0.010 | 0.954 |
| hsa-mir-181d | 0.003 | 0.981 |
|
| B,
Subtype-specific control miRs |
|
| miR | Lfc | Adjusted
P-value |
|
| hsa-mir-145 | 0.040 | 0.538 |
| hsa-mir-200a | −0.044 | 0.577 |
| hsa-mir-1468 | −0.049 | 0.578 |
| hsa-mir-374a | 0.022 | 0.696 |
| hsa-mir-187 | 0.058 | 0.709 |
| hsa-mir-34b | 0.050 | 0.755 |
| hsa-mir-889 | −0.035 | 0.771 |
| hsa-let-7c | −0.024 | 0.773 |
| hsa-mir-369 | 0.023 | 0.846 |
| hsa-mir-3677 | 0.016 | 0.869 |
| hsa-mir-15a | −0.007 | 0.893 |
| hsa-mir-522 | 0.034 | 0.904 |
| hsa-mir-3613 | −0.006 | 0.932 |
| hsa-mir-2355 | −0.005 | 0.939 |
| hsa-mir-485 | 0.002 | 0.988 |
Exploratory data analysis ensures
proper clustering of samples following RUV normalization
PCA was performed following data normalization. PCA
plots are an established method of visualizing the sources of
variation in genome-wide studies. PCA plots identify the principal
components of data by reducing its dimensions. The first principal
component (PC1) explains the highest amount of variance across all
samples (26). The clustering of
samples by the biological factor of interest such as cancer status
in the space of main principal components indicated that the data
in the present study had clear separation values based on the
cancer status prior to classification. Plotting the miRNA
expression in first principal component and coloring by the
biological factor, cancer status indicated that this was the main
driver of clustering in PC1 which avoids false positives and false
negatives in the current results (Fig.
1). The first principle component (PC) with highest variation
(29.75%) separated normal lung tissues from cancerous lung tissues.
The second and third PCs account for 10.95 and 6.42% of variation
respectively.
Modeling lung cancer miRNA sequencing
data with decision tree algorithms identifies complementary
diagnostic and subtyping miRNA markers in lung cancer
Due to the predominance of tumor samples over
non-tumor samples in TCGA data, the data in the current study were
imbalanced. Imbalanced data may affect model training and its
subsequent performance (24).
Therefore, TCGA data are not suitable for machine learning
algorithms to classify cancer status. The imbalance of TCGA data
was addressed by SMOTE before training the models to classify
cancer status. Using SMOTE, the minority class (normal cases in
tumor-normal classification) is over-sampled by creating synthetic
samples. Training and testing datasets for classification as tumor
or normal were subjected to this approach separately. The PCA plot
method was used to ensure the retention of separation of samples
with different cancer status.
To classify lung cancer status and its subtypes, two
simple models were obtained by applying the RPART algorithm to the
balanced miRNA sequencing training datasets. Each model consisted
of two essential miRNAs as the primary aim of the current study was
to identify the minimal number of biomarkers that can be used to
classify lung cancer status and its subtypes.
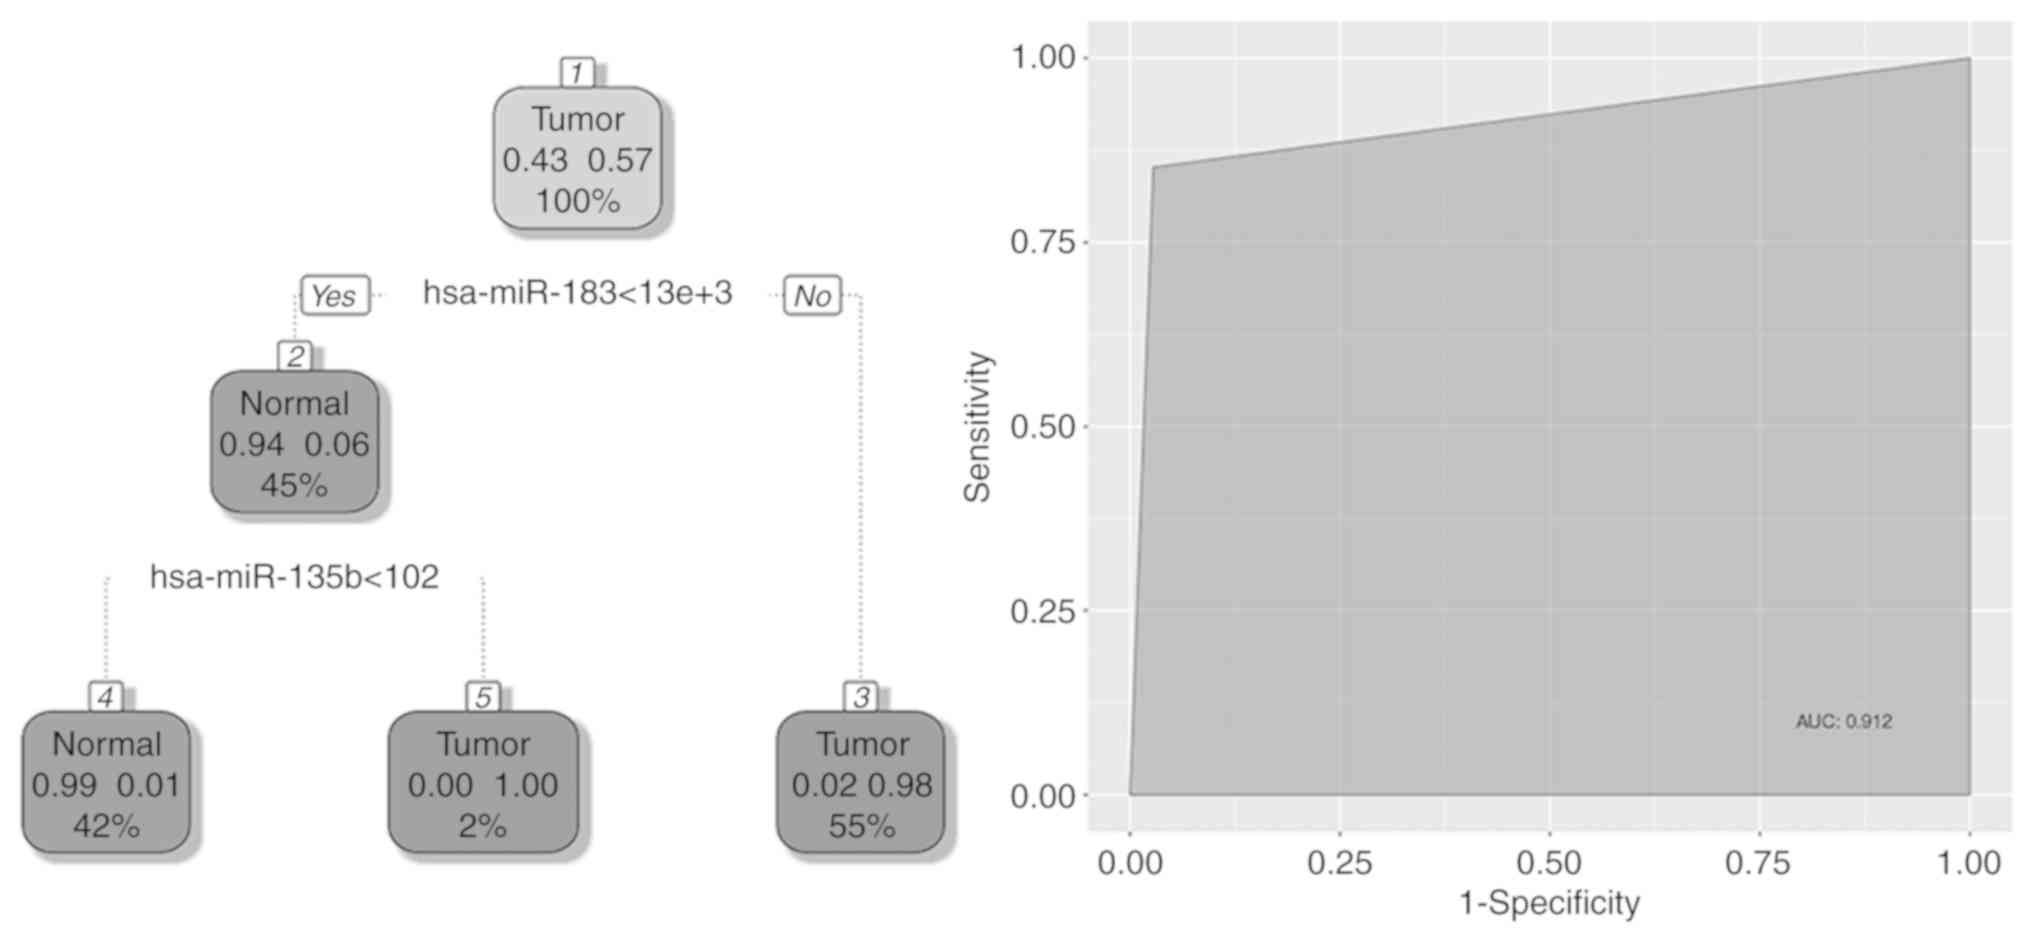
The main resulting cancer classifier structures were
two trained two-step decision trees. The first classification tree
distinguished tumor from non-tumor samples in both subtypes of lung
cancer (LUAD and LUSC) from TCGA database. Two decision nodes of
this classifier are hsa-miR-183 and hsa-miR-135b (Fig. 2). Performances of all classification
trees were measured using testing datasets (30% of total data).
Discriminative power of this classifier was then measured by the
area under the curve (91.2%).
More specific classification trees were also trained
in each subtype. The classification tree in the LUAD subtype used
simple rules to classify tumor status. hsa-miR-183 and hsa-let-7a
were two nodes of this decision tree. LUAD samples were classified
as normal if hsa-miR-183 and hsa-let-7a expression levels were
<12×103 and ≥68×103, respectively. Area
under the curve for this classifier was 95.1%. The classification
tree in the LUSC subtype used hsa-miR-30a and hsa-miR-1269a to
classify tumors from non-tumors. Samples were classified as normal
if the expression levels of hsa-miR-30a and hsa-miR-1269a were
>134×103 and <48, respectively. The discriminative
power of this classification tree was measured after testing this
model on the testing dataset (data not shown). The area under the
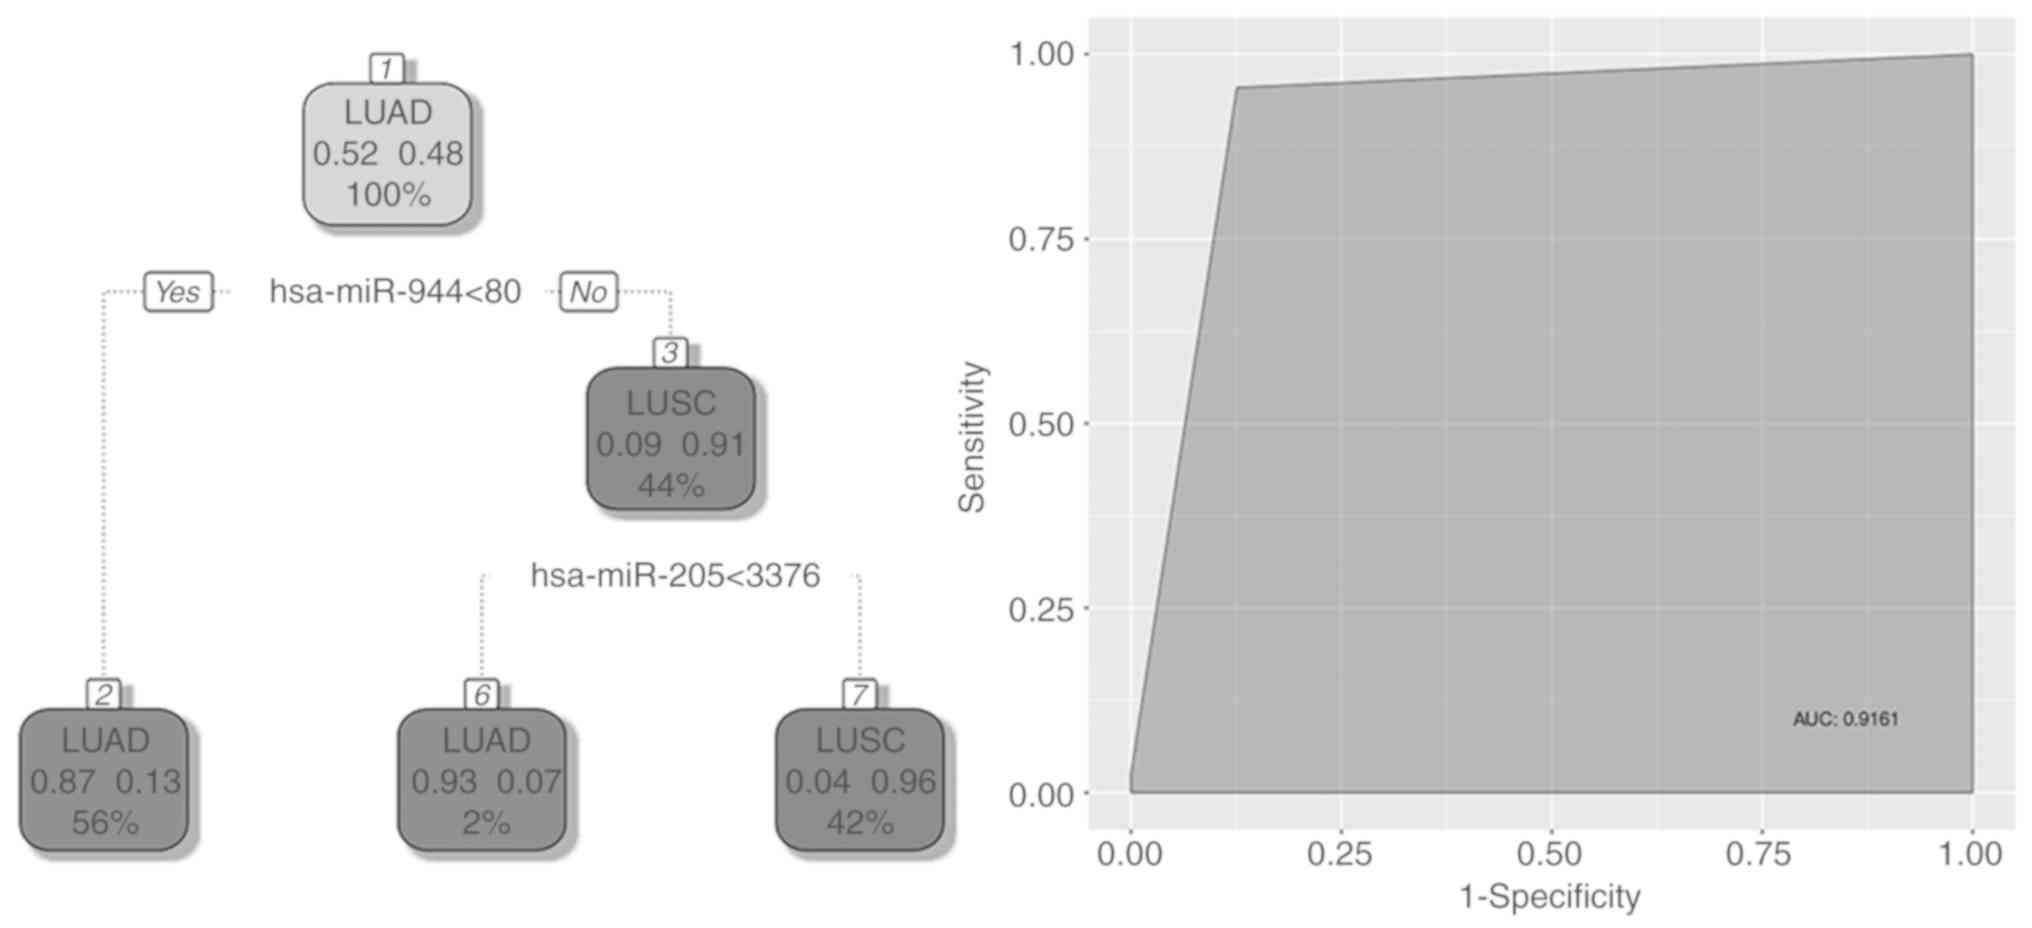
curve was 95.2%. A further tree distinguished lung cancer subtypes
(LUAD from LUSC) using two miRNAs, hsa-miR-944 and hsa-miR-205. A
sample was classified as LUSC if the expression levels of
hsa-miR-944 and hsa-miR-205 were <80 and <3,376,
respectively. Area under the curve for this classifier was 91.6%
(Fig. 3). The four miRNAs used to
classify lung cancer status and its subtypes in the current study
were: hsa-miR-183, hsa-miR-135b, hsa-miR-944 and hsa-miR-205.
Discussion
The current study used 5 miRNAs in the diagnosis of
lung cancer for three separate classifications: miR-183 and let-7a
in the LUAD subtype, miR-30a and miR-1296a in the LUSC subtype and
miR-183 and miR-135b in both subtypes. Let-7a, one of the two
biomarkers used in the LUAD model of cancer diagnosis in the
present study, is a member of the let-7 family and one of the first
miRNAs implicated in of lung cancer. Takamizawa et al
(7) reported that let-7 expression
was lower in lung cancer compared with healthy control tissue and
that lower expression of let-7 was associated with poor prognosis.
Furthermore, the overexpression of let-7 in the A549 lung
adenocarcinoma cell line inhibited cell growth, and was revealed to
act as a tumor suppressor by decreasing cell proliferation and
regulating oncogenes including tumor protein p53, RAS type GTPase
family (RAS) and MYC proto-oncogene bHLH transcription factor
(5,33). High expression of let-7 and
downregulation of its target oncogenes (high mobility group AT-hook
2 and RAS) in well-differentiated lung tumors suggested that let-7
may be a biomarker for poorly differentiated tumors (33). Landi et al (3) analyzed 440 human miRNAs and identified
a signature consisting of five miRNAs, including hsa-let-7b, that
differentiated LUAD from LUSC and had prognostic value.
The miR-183 family members, including miR-182,
miR-183 and miR-96, exhibit oncogenic and tumor suppressor
functions in different types of cancer. miR-183 inhibited lung
tumor invasion and metastasis by targeting ezrin. Overexpression of
miR-183 was reported as a risk factor for lung cancer by Feng et
al (34). Sun et al
(35) reported that the
overexpression of miR-126 in non-small cell lung cancer cells
resulted in decreased cell proliferation in vitro and tumor
growth in vivo. Zhong et al (36) revealed dose-dependent inhibition of
lung cancer cell growth by miR-107, miR-126 and let-7a in
vivo, suggesting that the overexpression of these miRNAs may
suppress cancer.
Leidinger et al (4) analyzed 74 individual whole blood
samples and revealed that miR-20b-5p, miR-20a-5p, miR-17-5p and
miR-106a-5p accurately differentiated patients with NSCLC from
unaffected controls with a specificity and sensitivity of 98 and
91%, respectively. Su et al (37) analyzed sputum samples from 103
patients with NSCLC and 528 cancer-free smokers. The authors
identified a panel of three sputum miRNA biomarkers (miRs-21, −31
and −210) with 83% sensitivity and 88% specificity for the early
detection of lung cancer. Võsa et al (38) performed a meta-analysis of 20
published miRNA expression studies in lung cancer and identified
seven upregulated (miR-21, miR-31, miR-182, miR-183, miR-200b,
miR-210 and miR-205) and eight downregulated (miR-30a, miR-30d,
miR-126-3p, miR-126-5p, miR-143, miR-145, miR-486-5p and miR-451a)
miRNAs as a statistically significant meta-signature of lung
cancer.
miR-205 and miR-944 were used as subtyping
biomarkers of lung cancer in the current study. miR-205 and miR-21
were previously reported to accurately distinguish LUAD from LUSC
subtypes (39). However, miR-205 was
subsequently revealed to be useful as an adjunctive diagnostic
criterion in selected cases but should not be used as a substitute
of accurate morphological and immunophenotypical characterization
of lung tumors (10). Lebanony et
al (40) reported decreased
expression of miR-205 in LUAD compared with LUSC subtypes and
suggested that the expression level of miR-205 may be used to
predict and diagnose LUSC. Lu et al (41) revealed that the expression of miR-205
in NSCLC may be used to distinguish patients with LUAD from those
with LUSC.
Zhang et al (42) assessed the application of miRNA for
lung cancer screening and demonstrated that the expression profile
of sputum miR-21, miR-486, miR-37 and miR-200b yielded 81%
sensitivity and 92% specificity in distinguishing patients with
NSCLC from healthy individuals. Hamamoto et al (43) revealed that the expression profile of
miR-205, miR-196b and miR-375 yielded 85% sensitivity and 83%
specificity in the distinction between patients with LUSC and
LUAD.
The miR-200 family and miR-205 have been implicated
in the epithelial-mesenchymal transition in a number of breast
cancer cell lines by targeting zinc finger E-box-binding protein
transcription factors to alter the gene expression of vimentin and
E-cadherin (44). Duan et al
(45) demonstrated that miR-205 was
significantly higher in NSCLC patients. miR-205 had a positive
correlation with protein kinase B gene expression in NSCLC cancer
tissues. Increased expression levels of protein kinase B enhanced
the invasion abilities of cancer cells.
Acknowledgements
The authors acknowledge Professor Seyed Javad Mowla
(Tarbiat Modares University, Tehran, Iran) for his encouragement
and Dr Javad Zahiri (Tarbiat Modares University) for his insights
into the manuscript.
Funding
No funding was received.
Availability of data and materials
The datasets analyzed during the present study are
available in the TCGA repository, (https://portal.gdc.cancer.gov/).
Authors' contributions
FA was responsible for the literature review and
writing the discussion and introduction of the paper. MS was
responsible for the bioinformatics analysis, material and methods
and results sections of the manuscript.
Ethics approval and consent to
participate
Not applicable.
Patient consent for publication
Not applicable
Competing interests
The authors declare that they have no competing
interests.
References
|
1
|
Ridge CA, McErlean AM and Ginsberg MS:
Epidemiology of lung cancer. Semin Intervent Radiol. 30:93–98.
2013. View Article : Google Scholar : PubMed/NCBI
|
|
2
|
MacDonagh L, Gray SG, Finn SP, Cuffe S,
O'Byrne KJ and Barr MP: The emerging role of microRNAs in
resistance to lung cancer treatments. Cancer Trea Rev. 41:160–169.
2015. View Article : Google Scholar
|
|
3
|
Landi MT, Zhao Y, Rotunno M, Koshiol J,
Liu H, Bergen AW, Rubagotti M, Goldstein AM, Linnoila I, Marincola
FM, et al: MicroRNA expression differentiates histology and
predicts survival of lung cancer. Clin Cancer Res. 16:430–441.
2010. View Article : Google Scholar : PubMed/NCBI
|
|
4
|
Leidinger P, Brefort T, Backes C, Krapp M,
Galata V, Beier M, Kohlhaas J, Huwer H, Meese E and Keller A:
High-throughput qRT-PCR validation of blood microRNAs in non-small
cell lung cancer. Oncotarget. 26:4611–4616. 2016.
|
|
5
|
Inamura K and Ishikawa Y: MicroRNA in lung
cancer: Novel biomarkers and potential tools for treatment. J Clin
Med. 5:E362016. View Article : Google Scholar : PubMed/NCBI
|
|
6
|
Anglicheau D, Muthukumar T and
Suthanthiran M: MicroRNAs: Small RNAs with big effects.
Transplantation. 90:105–112. 2010. View Article : Google Scholar : PubMed/NCBI
|
|
7
|
Takamizawa J, Konishi H, Yanagisawa K,
Tomida S, Osada H, Endoh H, Harano T, Yatabe Y, Nagino M, Nimura Y,
et al: Reduced expression of the let-7 microRNAs in human lung
cancers in association with shortened postoperative survival.
Cancer Res. 64:3753–3756. 2004. View Article : Google Scholar : PubMed/NCBI
|
|
8
|
Iorio MV and Croce CM: MicroRNA
dysregulation in cancer: Diagnostics, monitoring and therapeutics.
A comprehensive review. EMBO Mol Med. 4:143–159. 2012. View Article : Google Scholar : PubMed/NCBI
|
|
9
|
Yanaihara N, Caplen N, Bowman E, Seike M,
Kumamoto K, Yi M, Stephens RM, Okamoto A, Yokota J, Tanaka T, et
al: Unique microRNA molecular profiles in lung cancer diagnosis and
prognosis. Cancer Cell. 9:189–198. 2006. View Article : Google Scholar : PubMed/NCBI
|
|
10
|
Del Vescovo V, Cantaloni C, Cucino A,
Girlando S, Silvestri M, Bragantini E, Fasanella S, Cuorvo LV,
Palma PD, Rossi G, et al: miR-205 Expression levels in nonsmall
cell lung cancerdo not always distinguish adenocarcinomas from
squamous cell carcinomas. Am J Surg Pathol. 35:268–275. 2011.
View Article : Google Scholar : PubMed/NCBI
|
|
11
|
Geurts P, Irrthum A and Wehenkel L:
Supervised learning with decision tree-based methods in
computational and systems biology. Mol Biosyst. 5:1593–1605. 2009.
View Article : Google Scholar : PubMed/NCBI
|
|
12
|
Safavian SR and Landgrebe DA: A survey of
decision tree classifier methodology. IEEE Trans Systems Man
Cybernetics. 3:660–674. 1991. View
Article : Google Scholar
|
|
13
|
ENCODE Project Consortium, Birney E,
Stamatoyannopoulos JA, Dutta A, Guigó R, Gingeras TR, Margulies EH,
Weng Z, Snyder M, Dermitzakis ET, et al: Identification and
analysis of functional elements in 1% of the human genome by the
ENCODE pilot project. Nature. 447:799–816. 2007. View Article : Google Scholar : PubMed/NCBI
|
|
14
|
Rosenfeld N, Aharonov R, Meiri E,
Rosenwald S, Spector Y, Zepeniuk M, Benjamin H, Shabes N, Tabak S,
Levy A, et al: MicroRNAs accurately identify cancer tissue origin.
Nat Biotechnol. 26:462–469. 2008. View
Article : Google Scholar : PubMed/NCBI
|
|
15
|
Rosenwald S, Gilad S, Benjamin S, Lebanony
D, Dromi N, Faerman A, Benjamin H, Tamir R, Ezagouri M, Goren E, et
al: Validation of a microRNA-based qRT-PCR test for accurate
identification of tumor tissue origin. Mod Pathol. 23:814–823.
2010. View Article : Google Scholar : PubMed/NCBI
|
|
16
|
Jeong Y, Xie Y, Xiao G, Behrens C, Girard
L, Wistuba II, Minna JD and Mangelsdorf DJ: Nuclear receptor
expression defines a set of prognostic biomarkers for lung cancer.
PLoS Med. 7:e10003782010. View Article : Google Scholar : PubMed/NCBI
|
|
17
|
Lu Y and Han J: Cancer classification
using gene expression data. Information Systems. 28:243–268. 2003.
View Article : Google Scholar
|
|
18
|
Gentleman RC, Carey VJ, Bates DM, Bolstad
B, Dettling M, Dudoit S, Ellis B, Gautier L, Ge Y, Gentry J, et al:
Bioconductor: Open software development for computational biology
and bioinformatics. Genome Biol. 5:R802004. View Article : Google Scholar : PubMed/NCBI
|
|
19
|
Sherafatian M: Tree-based machine learning
algorithms identified minimal set of miRNA biomarkers for breast
cancer diagnosis and molecular subtyping. Gene. 667:111–118. 2018.
View Article : Google Scholar
|
|
20
|
Colaprico A, Silva TC, Olsen C, Garofano
L, Cava C, Garolini D, Sabedot TS, Malta TM, Pagnotta SM,
Castiglioni I, et al: TCGAbiolinks: An R/Bioconductor package for
integrative analysis of TCGA data. Nucleic Acids Res. 44:e712015.
View Article : Google Scholar : PubMed/NCBI
|
|
21
|
Cancer Genome Atlas Research Network, .
Comprehensive molecular profiling of lung adenocarcinoma. Nature.
511:543–550. 2014. View Article : Google Scholar : PubMed/NCBI
|
|
22
|
Cancer Genome Atlas Research Network, .
Comprehensive genomic characterization of squamous cell lung
cancers. Nature. 489:519–525. 2012. View Article : Google Scholar : PubMed/NCBI
|
|
23
|
Gentleman R, Carey V, Huber W and Hahne F:
Genefilter: Methods for filtering genes from microarray
experiments. R package version 1(0) R package version
1.42.0.2011.
|
|
24
|
Kuhn M: Building predictive models in R
using the Caret package. J Stat Software. 28:1–26. 2008. View Article : Google Scholar
|
|
25
|
Risso D: EDASeq: Exploratory data analysis
and normalization for RNA-Seq. 2013.
|
|
26
|
Risso D, Ngai J, Speed TP and Dudoit S:
Normalization of RNA-seq data using factor analysis of control
genes or samples. Nat Biotechnol. 32:896–902. 2014. View Article : Google Scholar : PubMed/NCBI
|
|
27
|
Love MI, Huber W and Anders S: Moderated
estimation of fold change and dispersion for RNA-seq data with
DESeq2. Genome Biol. 15:5502014. View Article : Google Scholar : PubMed/NCBI
|
|
28
|
Hao M, Wang Y and Bryant SH: An efficient
algorithm coupled with synthetic minority over-sampling technique
to classify imbalanced PubChem BioAssay data. Anal Chim Acta.
806:117–127. 2014. View Article : Google Scholar : PubMed/NCBI
|
|
29
|
Torgo L: Data mining with R: Learning with
case studies. 2016, CRC press; Boca Raton, FL, USA:
|
|
30
|
Williams GJ: Rattle: A data mining GUI for
R. R J. 1:45–55. 2009. View Article : Google Scholar
|
|
31
|
Therneau TM, Atkinson B and Ripley MB: The
rpart package. 2010.
|
|
32
|
Robin X, Turck N, Hainard A, Tiberti N,
Lisacek F, Sanchez JC and Müller M: pROC: An open-source package
for R and S+ to analyze and compare ROC curves. BMC Bioinformatics.
12:772011. View Article : Google Scholar : PubMed/NCBI
|
|
33
|
Wang Y, Zhang X, Liu L, Li H, Yu J, Wang C
and Ren X: Clinical implication of microrna for lung cancer. Cancer
Biother Radiopharm. 28:261–267. 2013. View Article : Google Scholar : PubMed/NCBI
|
|
34
|
Feng B, Zhang K, Wang R and Chen L:
Non-small-cell lung cancer and miRNAs: Novel biomarkers and
promising tools for treatment. Clin Sci (Lond). 128:619–634. 2015.
View Article : Google Scholar : PubMed/NCBI
|
|
35
|
Sun Y, Bai Y, Zhang F, Wang Y, Guo Y and
Guo L: miR-126 inhibits non-small cell lung cancer cells
proliferation by targeting EGFL7. Biochem Biophys Res Commun.
391:1483–1489. 2010. View Article : Google Scholar : PubMed/NCBI
|
|
36
|
Zhong M, Ma X, Sun C and Chen L: MicroRNAs
reduce tumor growth and contribute to enhance cytotoxicity induced
by gefitinib in non-small cell lung cancer. Chem Biol Interact.
184:431–438. 2010. View Article : Google Scholar : PubMed/NCBI
|
|
37
|
Su Y, Guarnera MA, Fang H and Jiang F:
Small non-coding RNA biomarkers in sputum for lung cancer
diagnosis. Mol Cancer. 15:362016. View Article : Google Scholar : PubMed/NCBI
|
|
38
|
Võsa U, Vooder T, Kolde R, Vilo J,
Metspalu A and Annilo T: Meta-analysis of microRNA expression in
lung cancer. Int J Cancer. 132:2884–2893. 2013. View Article : Google Scholar : PubMed/NCBI
|
|
39
|
Boeri M, Verri C, Conte D, Roz L, Modena
P, Facchinetti F, Calabrò E, Croce CM, Pastorino U and Sozzi G:
MicroRNA signatures in tissues and plasma predict development and
prognosis of computed tomography detected lung cancer. Proc Natl
Acad Sci USA. 108:3713–3718. 2011. View Article : Google Scholar : PubMed/NCBI
|
|
40
|
Lebanony D, Benjamin H, Gilad S, Ezagouri
M, Dov A, Ashkenazi K, Gefen N, Izraeli S, Rechavi G, Pass H, et
al: Diagnostic assay based on hsa-miR-205 expression distinguishes
squamous from nonsquamous non-small-cell lung carcinoma. J Clin
Oncol. 27:2030–2037. 2009. View Article : Google Scholar : PubMed/NCBI
|
|
41
|
Lu Y, Govindan R, Wang L, Liu PY, Goodgame
B, Wen W, Sezhiyan A, Pfeifer J, Li YF, Hua X, et al: MicroRNA
profiling and prediction of recurrence/relapse-free survival in
stage I lung cancer. Carcinogenesis. 33:1046–1054. 2012. View Article : Google Scholar : PubMed/NCBI
|
|
42
|
Zhang JG, Wang JJ, Zhao F, Liu Q, Jiang K
and Yang GH: MicroRNA-21 (miR-21) represses tumor suppressor PTEN
and promotes growth and invasion in non-small cell lung cancer
(NSCLC). Clin Chim Acta. 411:846–852. 2010. View Article : Google Scholar : PubMed/NCBI
|
|
43
|
Hamamoto J, Soejima K, Yoda S, Naoki K,
Nakayama S, Satomi R, Terai H, Ikemura S, Sato T, Yasuda H, et al:
Identification of microRNAs differentially expressed between lung
squamous cell carcinoma and lung adenocarcinoma. Mol Med Rep.
8:456–462. 2013. View Article : Google Scholar : PubMed/NCBI
|
|
44
|
Gregory PA, Bert AG, Paterson EL, Barry
SC, Tsykin A, Farshid G, Vadas MA, Khew-Goodall Y and Goodall GJ:
The miR-200 family and miR-205 regulate epithelial to mesenchymal
transition by targeting ZEB1 and SIP1. Nat Cell Biol. 10:593–601.
2008. View Article : Google Scholar : PubMed/NCBI
|
|
45
|
Duan B, Guo T, Sun H, Cai R, Rui Q and Xi
Z: miR-205 as a biological marker in non-small cell lung cancer.
Biomed Pharmacother. 91:823–830. 2017. View Article : Google Scholar : PubMed/NCBI
|