Introduction
Lung cancer is one of the most common causes of
malignancy-associated mortality globally (1). Non-small cell lung cancer (NSCLC)
accounts for >80% of primary lung cancer cases (2). Despite improvements in traditional and
novel treatments, including surgical resection, chemotherapy,
radiotherapy and targeted therapy, the prognosis for patients with
lung cancer remains poor, with a 5-year overall survival (OS) rate
of <20%, due to a high frequency of metastasis (3). Therefore, the prevention and treatment
of tumor metastasis are particularly important.
Gene expression microarray technologies have been
widely used to identify the functional variation of the
transcriptome in different cell types and tissues (4). A key advantage of microarray technology
is that it can simultaneously and comprehensively detect the
expression of tens of thousands of genes. Through gene chips, genes
that may be associated with a disease can be identified in a short
period of time, which may reveal biomarkers for early diagnosis or
targeted therapy (5).
To identify novel metastasis-associated targets, our
previous study detected differentially expressed mRNAs and long
non-coding RNAs between the large-cell lung cancer high-metastatic
95D cell line and the low-metastatic 95C cell line using a
microarray assay (6). A total of 252
mRNAs were screened out according to the cut-off criteria. Among
them, 120 mRNAs were revealed to be upregulated, while 132 mRNAs
were downregulated in 95D cells compared with 95C cells.
In the present study, these differential expressed
genes (DEGs) were analyzed by a series of bioinformatics methods,
including Gene Ontology (GO) functional analysis, Kyoto
Encyclopedia of Genes and Genomes (KEGG) pathway enrichment
analysis and protein-protein interaction (PPI) network
construction. The hub genes were subsequently analyzed by Gene
Expression Profiling Interactive Analysis (GEPIA) and Kaplan-Meier
plotter (KM plotter) online databases. Furthermore, lung cancer
tissues from patients who underwent surgery were used to further
verify the results. Overall, the aim of the present study was to
identify hub genes that may be involved in the process of lung
cancer metastasis.
Materials and methods
Data preprocessing
The raw microarray data from our previous study
(6) was utilized in the present
study. The fold-changes (FCs) in the expression of individual mRNAs
between the 95D and 95C cell lines were calculated. Statistically
significant differentially expressed mRNAs were defined as
P<0.05 and log2|FC|>2.0. The genes that corresponded to these
mRNAs were identified according to the National Center for
Biotechnology Information (NCBI) database (https://www.ncbi.nlm.nih.gov/).
GO functional enrichment and KEGG
pathway analysis
GO functional enrichment analysis was performed
using the GO online database (http://www.geneontology.org) and the Database for
Annotation, Visualization and Integrated Discovery (DAVID 6.7)
online database (https://david.ncifcrf.gov/) (7). Pathway analysis was performed using the
KEGG database (http://www.genome.jp/kegg). The P-value denotes the
significance of the pathway associated with the conditions. The
lower the P-value, the more significant the pathway. P<0.05 was
considered to indicate a statistically significant result.
Construction of a PPI network and hub
gene identification
In order to detect the potential associations among
those DEGs, the STRING version 10.5 database (https://www.string-db.org/) and Cytoscape 3.6.1
software (http://www.cytoscape.org/) were used
to construct a PPI network. The cut-off criteria in the STRING
database was set as: Confidence score ≥0.4 and maximum number of
interactors=0. In addition, Cytoscape plug-ins, including Molecular
Complex Detection (MCODE) and cytoHubba, were utilized to screen
modules of the PPI network and hub genes, respectively. The
criteria in MCODE was set as: Degree cut-off=2, node score
cut-off=0.2, k-core=2 and max. depth=100. The hub genes were
defined as the top 17 nodes ranked by degree in cytoHubba.
Expression levels of the hub genes in
the cancer genome atlas (TCGA) database
GEPIA (http://gepia.cancer-pku.cn/index.html) contains the
RNA sequencing expression data of 9,736 tumors and 8,587 normal
cases from TCGA and the Genotype-Tissue Expression (GTEx) projects
(8), and was used in the current
study to compare the expression levels of the hub genes between
lung cancer tissues and normal tissues. Boxplots were subsequently
generated to visualize the associations.
Survival analysis of hub genes
In the present study, KM plotter online database
(http://kmplot.com/analysis) was used to
evaluate the prognostic value of the hub genes. KM plotter can be
used to assess the effect of 54,675 genes on survival using 10,461
cancer samples, including 5,143 patients with breast cancer, 1,816
with ovarian cancer, 2,437 with lung cancer and 1,065 with gastric
cancer, with a mean follow-up of 69, 40, 49 and 33 months,
respectively (9). The relapse-free
time and OS time information were based on GEO (Affymetrix
microarrays), European Genome-phenome Archive (https://www.ebi.ac.uk/ega/home) and TCGA
databases (https://portal.gdc.cancer.gov/). In GEO, the optimal
Affymetrix IDs were 212239_at (PIK3R1), 212486_s_at (FYN),
201110_s_at (THBS1), 215235_at (SPTAN1) and 48580_at (SPP1). The
hazard ratio (HR), 95% confidence interval (CI) and log-rank
P-value were calculated and presented on the plot.
Patients and samples
A total of eight paired NSCLC and adjacent non-tumor
lung tissue samples (within 5 cm of the tumor), including five
squamous cancer and three adenocarcinoma samples, were obtained
from patients who underwent surgery at The Second Affiliated
Hospital of Xian Jiaotong University (Xian, China) between December
2017 and March 2018. Among these patients, six were male and two
were female, and the median age was 59 years (range, 50–70 years).
The present study was approved by the Ethics Committee of the
Second Affiliated Hospital of Xian Jiaotong University (Xian,
China). Written informed consent was obtained from all
participants.
Reverse transcription-quantitative
polymerase chain reaction (RT-qPCR) validation
Total RNA was extracted from tissues using Fast1000
(Shaanxi Pioneer Biotechnology Co., Ltd.), according to the
manufacturer's protocol. A total 500 ng total RNA was reverse
transcribed in a final volume of 10 µl using the PrimeScript™ RT
reagent kit (Takara Biotechnology Co., Ltd., Dalian, China). The
incubation conditions were as follows: 37°C for 15 min and 85°C for
5 sec, according to the manufacturer's protocols. TB
Green® Premix Ex Taq™ II (Takara Biotechnology Co.,
Ltd.) was used for detecting the gene amplification and qPCR was
performed on the CFX96 Touch™ Real-Time PCR Detection System
(Bio-Rad Laboratories, Inc., Hercules, CA, USA). The thermocycling
parameters were as follows: 95°C for 30 sec, followed by 40 cycles
at 95°C for 5 sec and 60°C for 30 sec. The primers for RT-qPCR are
presented in Table I. The FC was
calculated using the 2−ΔΔCq method and normalized to
GAPDH expression (10). All
experiments were performed in triplicate.
 | Table I.Primer sequences. |
Table I.
Primer sequences.
| Gene | Sequences
(5′→3′) |
|---|
| GAPDH | F:
GTCTCCTCTGACTTCAACAGCG |
|
| R:
ACCACCCTGTTGCTGTAGCCAA |
| PIK3R1 | F:
ACCACTACCGGAATGAATCTCT |
|
| R:
GGGATGTGCGGGTATATTCTTC |
| FYN | F:
GAAGCACGGACAGAAGATGACCTG |
|
| R:
CACCAATCTCCTTCCGAGCTGTTC |
| SPTAN1 | F:
TGCTTGCTGCTGGTCACTATGC |
|
| R:
GAACGCCTCCTGCTTGCTCATC |
| THBS1 | F:
GGCACCAACCGCATTCCAGAG |
|
| R:
GCACAGCATCCACCAGGTCTTG |
| SPP1 | F:
AGCGAGGAGTTGAATGGTGCATAC |
|
| R:
AATCTGGACTGCTTGTGGCTGTG |
Statistical analysis
All data were analyzed using GraphPad Prism 8.0
(GraphPad Software, Inc., San Diego, CA, USA). The results are
presented as mean ± standard deviation. Differences were analyzed
by a paired Student's t-test. Association between gene expression
and clinicopathological features was analyzed by χ2 test
using SPSS 22.0 (IBM Corp., Armonk, NY, USA). P<0.05 was
considered to indicate a statistically significant difference.
Results
Identification of DEGs in NSCLC
Using microarray data, our previous study (6) identified 252 metastasis-associated
mRNAs between the large-cell lung cancer high-metastatic 95D cell
line and the low-metastatic 95C cell line, with FC>2 and
P<0.05. According to the NCBI database, it was identified that
these mRNAs correspond to 230 genes, including 111 upregulated
genes and 119 downregulated genes (Table II).
| Table II.A total of 230 DEGs were identified
from microarray data, including 111 upregulated genes and 119
downregulated genes, in the non-small cell lung cancer
high-metastatic cell line compared with the low-metastatic cell
line. |
Table II.
A total of 230 DEGs were identified
from microarray data, including 111 upregulated genes and 119
downregulated genes, in the non-small cell lung cancer
high-metastatic cell line compared with the low-metastatic cell
line.
| Regulation | DEG |
|---|
| Upregulated | ADAMTS18, AFTPH,
AJAP1, AKNAD1, ALCAM, AMIGO2, ANGPT2, ANXA1, ANXA3, APOBEC3H, ASB5,
ATE1, BCL2A1, C4orf22, C8orf48, CDRT1, CHRM3, CLDN1, CNKSR2,
CNRIP1, COX7B2, CPNE4, CSF2RA, CTSC, CXCL3, DNER, DSC2, EPB41L4A,
EREG, ERLIN2, EYA4, FAM133A, FAM198B, FAM24B, FAS, FEZ2, FGF5,
FHIT, FRRS1, GABRQ, GNAT2, GNMT, GPRC5B, GREB1, GUCY1A2, HEATR7A,
HS3ST3B1, HSPB8, IDNK, IL13RA2, IL7, ITGAV, KCNE1L, KCNJ8,
KIAA0319, KIAA1468, KIF13A, LIN7A, LOX, LPHN2, LRCH2, LURAP1L,
LY6K, MAN1A1, MAPKAP1, MITF, MME, MYH7B, NEK5, NETO1, NTSR2, OSMR,
PALM2, PCGF6, PHF6, PKIB, PLD5, PVRL3, RAB27B, RAB39B, RASEF, RND3,
RPRM, S100A16, SETBP1, SGK1, SHC3, SLC38A1, SLC4A4, SLC7A11, SNTB1,
SOX3, SPANXA2, SPATA4, SPP1, SRPX2, ST7L, STK17A, STMN2, TAC1,
TFPI, TMEFF2, TMEM133, TPH2, TRDN, TSPAN13, TSPAN5, TTLL7, VEPH1,
VPS13A, ZNF674 |
| Downregulated | ACSS1, AMBP, ANXA6,
APOE, ARHGAP39, ARL14, ASB9, AUTS2, C11orf93, C8orf47, CA4, CA8,
CACNG6, CALR, CASP1, CCDC92, CD8B, CHST8, CLCN7, CLDN10, CLDN3,
CLIC3, CLU, CLVS1, CNGA2, COPG1, CPQ, CRIP2, CTNNA1, DCAF8L1,
DIRAS3, DMKN, ERVMER34-1, ESYT3, FADS2, FAM110B, FBXL19, FGFR2,
FOS, FOXL2, FOXS1, FYN, GDF15, GEMIN5, GPR89A, GRAMD3, HAP1, HES1,
HHIPL2, HIST1H2BF, HSP90AB1, HSPA1A, HVCN1, ID1, IER2, IFIT2, ING1,
ISYNA1, JAKMIP1, KISS1R, KLHL4, KRT77, LOXL4, LPPR5, LTBP1, LUZP6,
MAGED1, METTL13, MMD2, MMP1, MYL10, MZF1, NACAD, NADSYN1, NFE2,
NLGN4Y, NONO, NR3C1, OLFM1, OR6T1, PACRG, PCDH7, PGLYRP2, PIK3R1,
PLK2, PRAC, PTGER1, QKI, RBP1, RRP1, RTBDN, SDC2, SELV, SEPT4,
SERTAD1, SLC11A2, SMOC1, SNRNP200, SOWAHB, SPAG6, SPTAN1, STAT4,
STUB1, SUGP1, SULF2, TECRL, TFAP2A, THBS1, THBS2, THSD1, TPH1,
TSPYL5, TSSK1B, WNK4, ZBTB16, ZFYVE19, ZIK1, ZNF12, ZNF608 |
GO functional and KEGG pathway
analysis
GO is a community-based bioinformatics resource that
supplies information about gene product function using ontologies
to represent biological knowledge (11). GO is often used to describe the
biological roles of individual genomic products. GO consists of
three aspects: Biological process (BP), cellular component (CC) and
molecular function (MF) terms. BP terms refer to pathways and
larger processes made up of the activities of multiple gene
products. CC terms explain where gene products are active and MF
terms indicate the molecular activities of gene products. In order
to identify the functional changes in the process of NSCLC
metastasis, GO analysis was performed to analyze the functions of
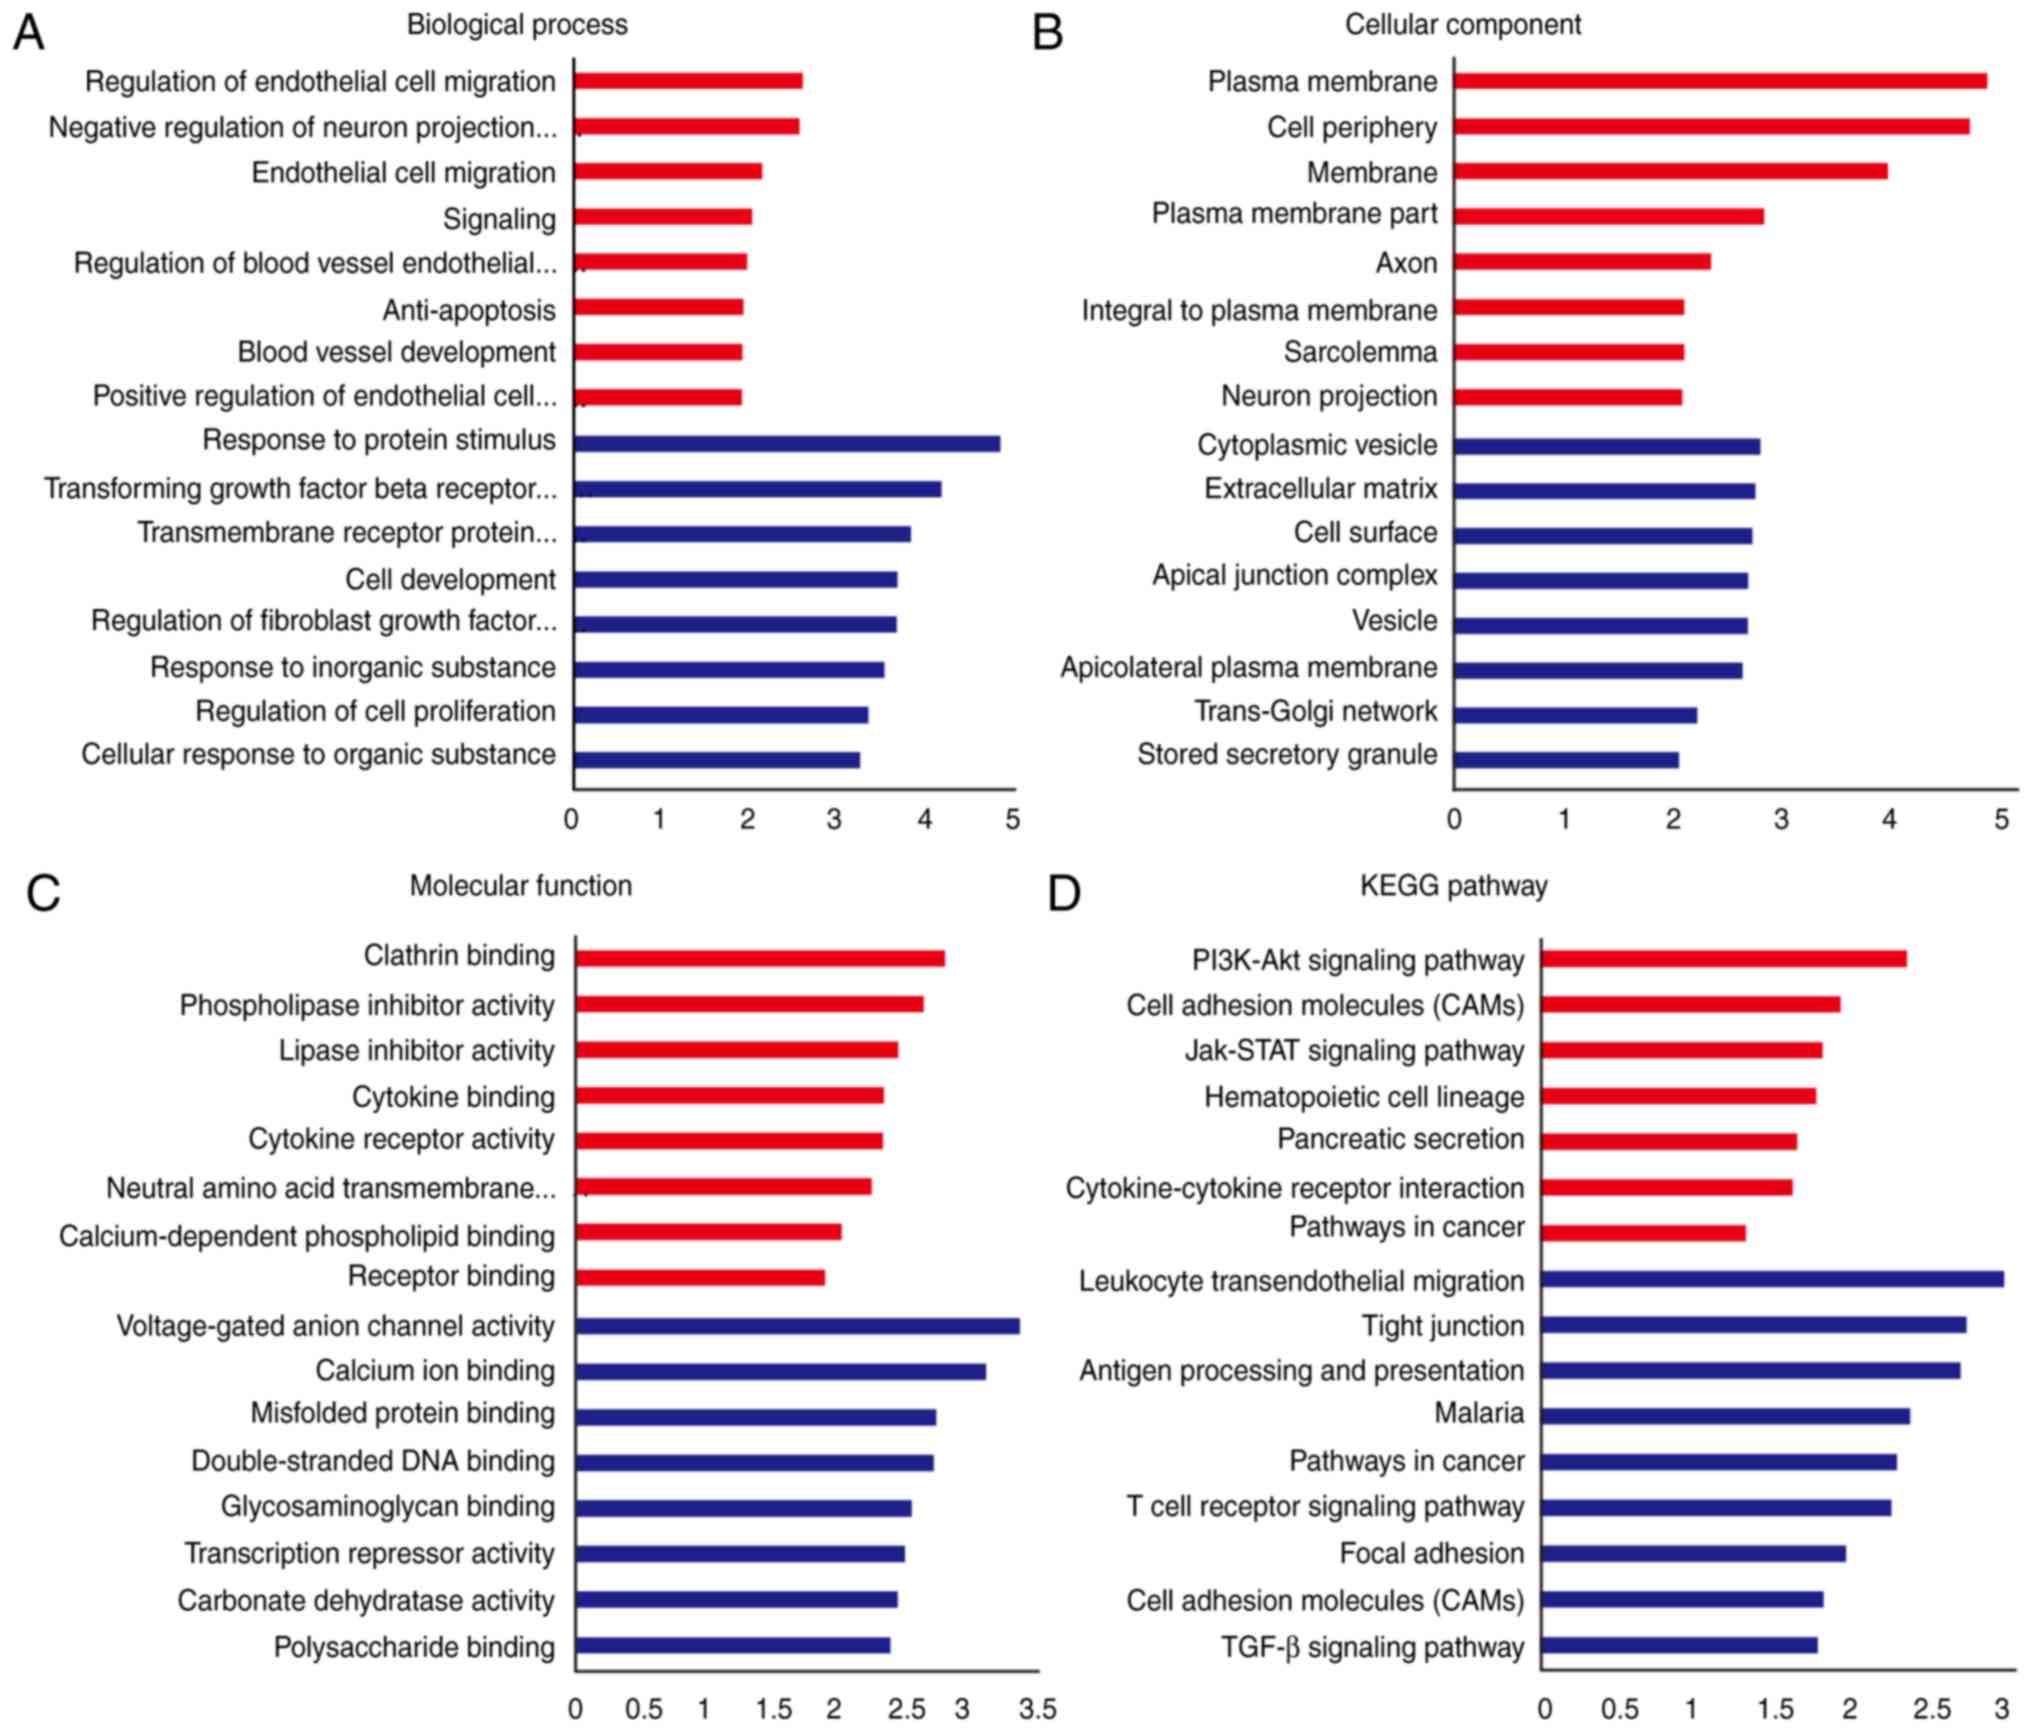
the DEGs. The results indicated that upregulated DEGs were most
enriched in the following BP terms: ‘Regulation of endothelial cell
migration’, ‘negative regulation of neuron projection development’
and ‘endothelial cell migration’. The upregulated DEGs were
enriched in the following CC terms: ‘Plasma membrane’, ‘cell
periphery’ and ‘membrane’. Furthermore, for MF terms, the
upregulated DEGS were enriched in ‘clathrin binding’,
‘phospholipase inhibitor activity’ and ‘lipase inhibitor activity’.
Downregulated DEGs were enriched in the following BP terms:
‘Response to protein stimulus’, ‘transforming growth factor beta
receptor signaling pathway’ and ‘transmembrane receptor protein
serine/threonine kinase signaling pathway’. The downregulated DEGs
were enriched in the following CC terms: ‘Cytoplasmic vesicle’,
‘extracellular matrix’ and ‘cell surface’. Finally, for MF terms,
the downregulated DEGs were enriched in ‘voltage-gated anion
channel activity’, ‘calcium ion binding’ and ‘misfolded protein
binding’ (Fig. 1A-C). KEGG pathway
enrichment analysis was also used to evaluate the possible pathways
that the DEGs may be involved in. As presented in Fig. 1D, the upregulated DEGs were enriched
in ‘PI3K-Akt signaling pathway’, ‘cell adhesion molecules (CAMs)’
and ‘Jak-STAT signaling pathway’, while the downregulated DEGs were
enriched in ‘leukocyte transendothelial migration’, ‘tight
junction’ and ‘antigen processing and presentation’.
PPI network and hub genes
The STRING database collects and integrates
knowledge of the functional interactions between expressed
proteins, while also predicting protein-protein association data
for a large number of organisms (12). In the present study, STRING online
database was used to illustrate the potential associations between
the DEGs. Data were downloaded from STRING and mapped into
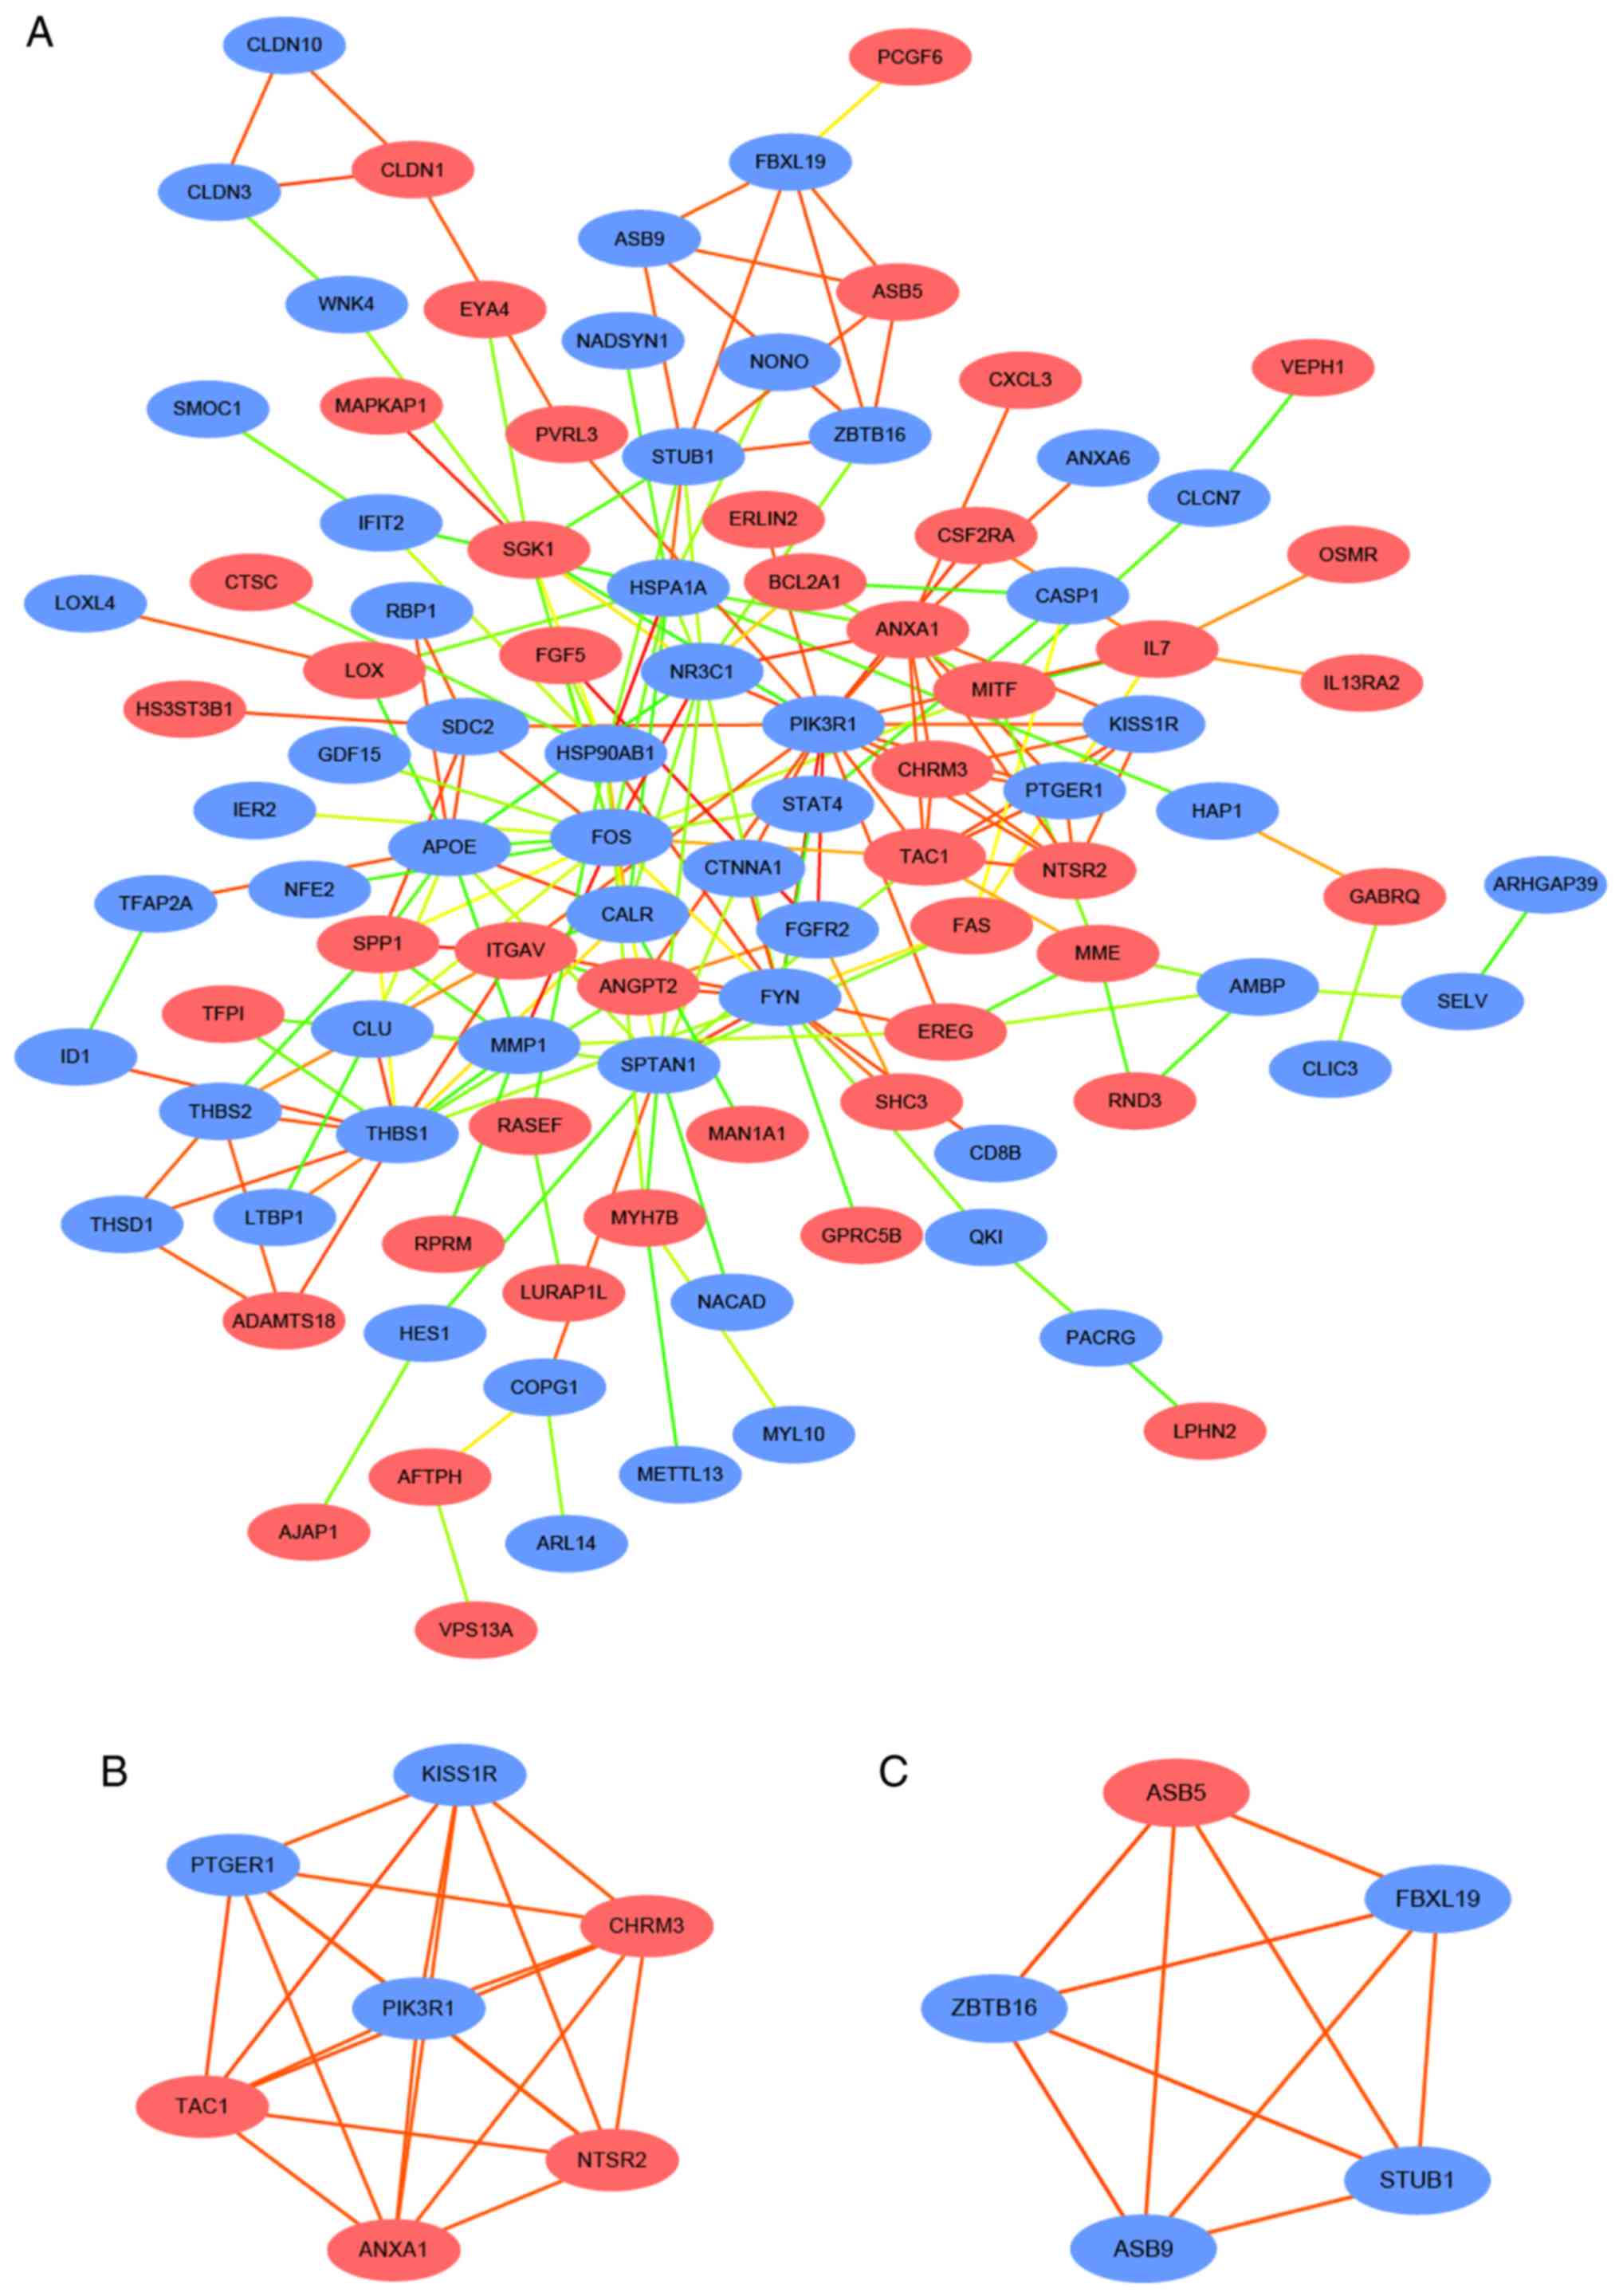
Cytoscape software. A total of 230 DEGs were filtered into the PPI
network complex, which included 101 nodes and 196 edges (Fig. 2A). The Cytoscape plug-in cytoHubba
was applied to screen out the hub genes. The results indicated that
among the 101 nodes, 17 central node genes (Table III) were identified with the
criterion: Filtering degree >7 criteria, as each node had >7
connections. These 17 central node genes were termed the hub genes.
The ten most significant node genes were phosphoinositide-3-kinase
regulatory subunit 1 (PIK3R1), FOS, FYN, thrombospondin-1 (THBS1),
nuclear receptor subfamily 3 group C member 1, nonerythrocytic
α-spectrin 1 (SPTAN1), apolipoprotein E, heat shock protein 1A,
heat shock protein 90kDa α, class B member 1 and Annexin A1.
Furthermore, two significant modules were selected from the PPI
network using MCODE. Module 1 consisted of seven nodes, including
KISS1R, PIK3R1, PTGER1, TAC1, ANXA1, NTSR2, CHRM, and 21 edges
(Fig. 2B). Module 2 consisted of
five nodes, including ASB5, ZBTB16, ASB9, STUB1 and FBXL1 (Fig. 2C). The results of Module 1 and 2 GO
term and KEGG pathway enrichment analysis are presented Tables SI and SII. In order to further analyze the hub
genes, GO and KEGG pathway analysis was performed using the DAVID
database. The results identified that the 17 hub genes
predominantly participated in the ‘response to drug’ in BP, ‘cell
surface’ in CC, ‘glycoprotein binding’ in MF. KEGG analysis
revealed that hub genes were enriched in ‘PI3K-Akt signaling
pathway’, ‘focal adhesion’ and ‘estrogen signaling pathway’.
| Table III.Top 17 hub genes with the highest
degrees of connectivity. |
Table III.
Top 17 hub genes with the highest
degrees of connectivity.
| Gene | Degree of
connectivity | Fold-change | P-value |
|---|
| PIK3R1 | 19 | −2.033 | 0.029 |
| FOS | 17 | −6.082 | 0.036 |
| FYN | 16 | −2.763 | 0.042 |
| THBS1 | 13 | −2.437 | 0.031 |
| NR3C1 | 12 | −2.709 | 0.005 |
| SPTAN1 | 12 | −2.201 | 0.011 |
| APOE | 11 | −9.232 | 0.001 |
| HSPA1A | 11 | −2.365 | 0.044 |
| HSP90AB1 | 10 | −2.382 | 0.002 |
| ANXA1 | 10 | 2.181 | 0.023 |
| TAC1 | 9 | 7.015 | 0.005 |
| SGK1 | 8 | 2.203 | 0.023 |
| STUB1 | 8 | −2.152 | 0.034 |
| SPP1 | 7 | −2.389 | 0.003 |
| MMP1 | 7 | −3.084 | 0.003 |
| ITGAV | 7 | 2.145 | <0.001 |
| CALR | 7 | −2.597 | 0.004 |
Expression levels of hub genes in
patients with lung cancer
GEPIA is a web-based tool that delivers fast and
customizable functionalities based on TCGA and GTEx data (8). GEPIA provides key interactive and
customizable functions, including differential expression analysis
(8). To verify the reliability of
the identified DEGs, the genes expression levels were compared
between patients with lung cancer and healthy individuals using
GEPIA. As presented in Fig. 3, the
expression levels of six genes, including PIK3R1, FOS, FYN, THBS1
and SPTAN1 were significantly lower in patients with lung
adenocarcinoma (LUAD) or lung squamous cell carcinoma (LUSC)
compared with healthy individuals, whereas secreted phosphoprotein
1 (SPP1) and matrix metalloproteinase-1 were significantly
overexpressed in LUAD and LUSC.
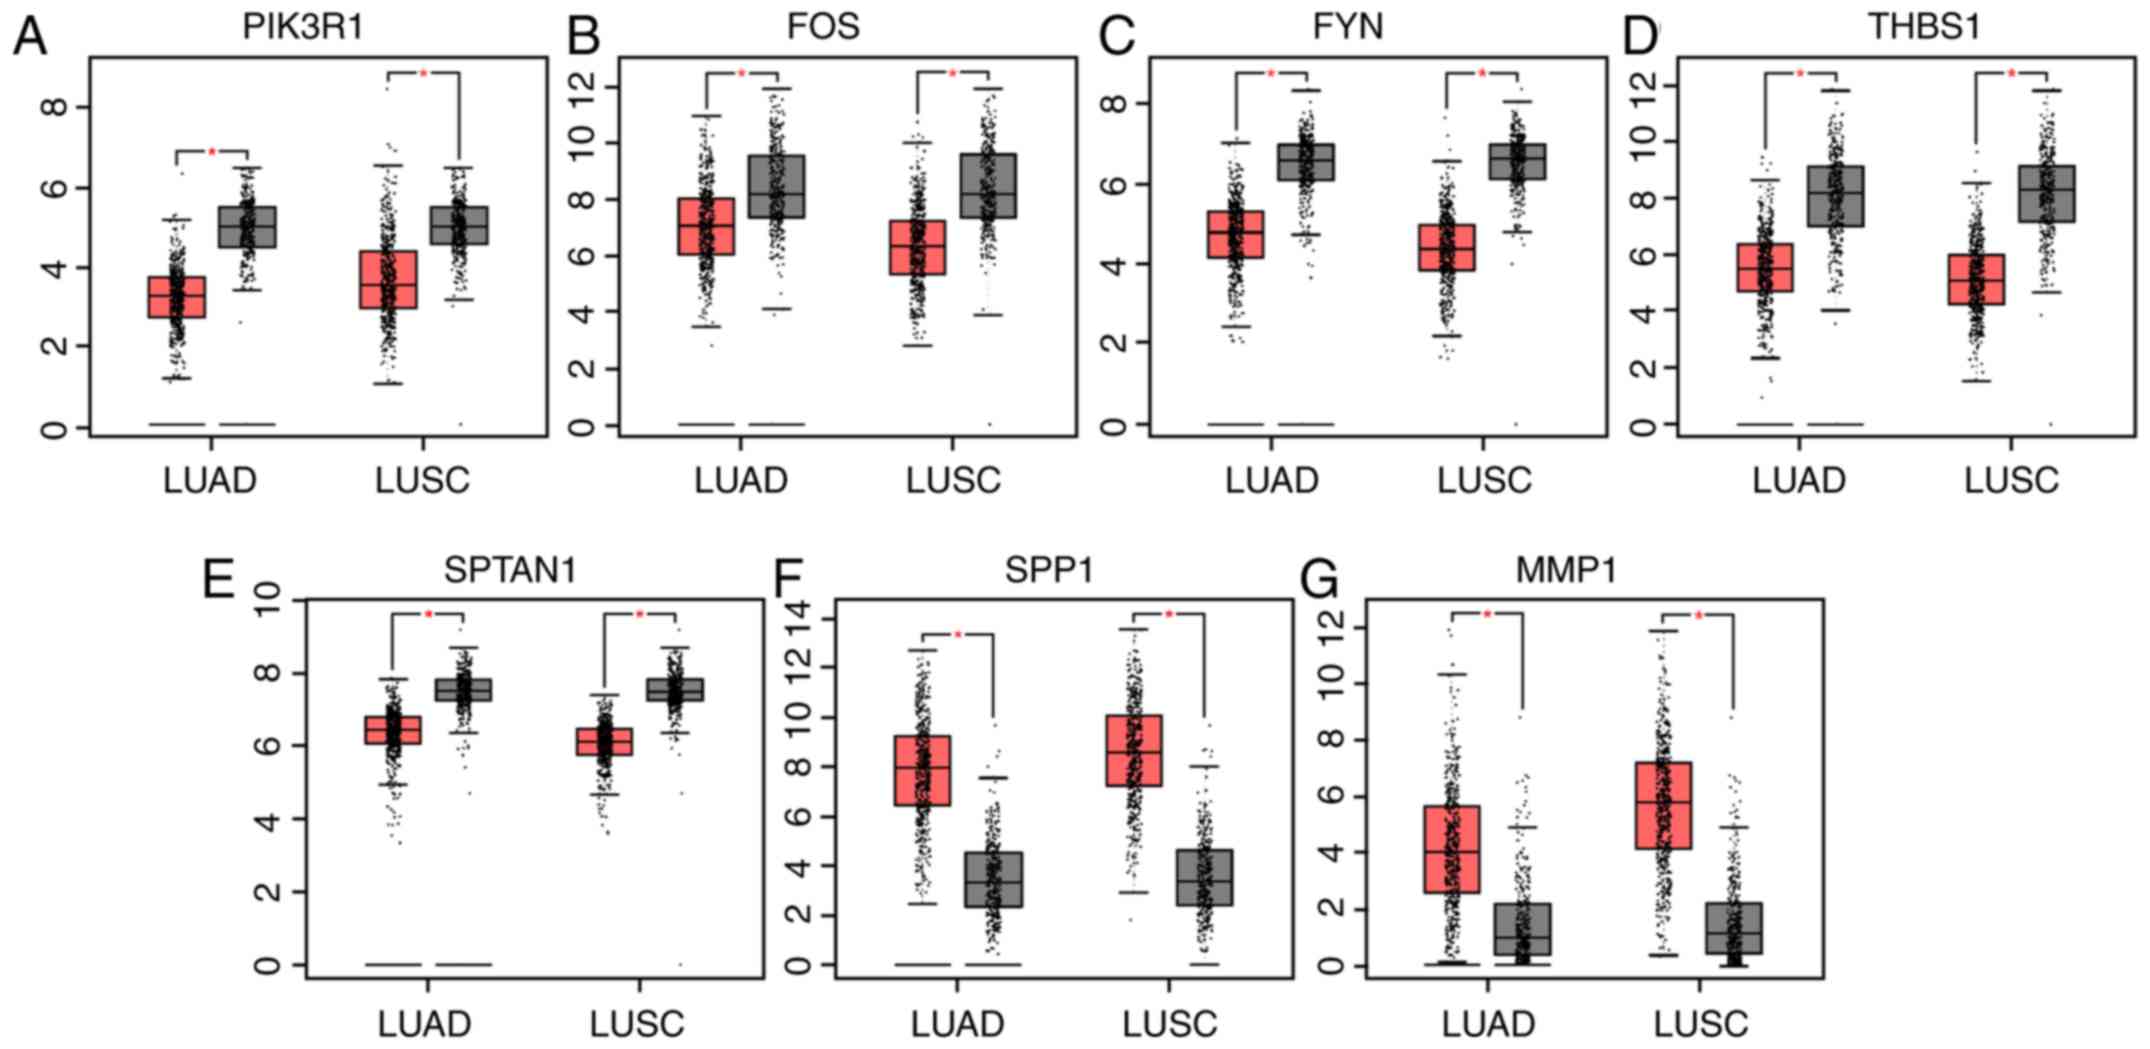 | Figure 3.Expression levels of seven genes in
patients with lung cancer and healthy individuals using data from
Gene Expression Profiling Interactive Analysis. (A) PIK3R1, (B)
FOS, (C) FYN, (D) THBS1, (E) SPTAN1, (F) SPP1 and (G) MMP1
expression levels in patients with LUAD and LUSC, and healthy
individuals. Red, patients with LUAD or LUSC; grey, healthy
individuals. *P<0.05. LUAD, lung adenocarcinoma; LUSC, lung
squamous cell carcinoma; PIK3R1, phosphoinositide-3-kinase
regulatory subunit 1; THBS1, thrombospondin-1; SPTAN1,
nonerythrocytic α-spectrin 1; SPP1, secreted phosphoprotein 1;
MMP1, matrix metalloproteinase 1. |
Associations between hub gene
expression levels and survival
The prognostic information of the 17 hub genes was
evaluated using KM plotter. It was identified that the expression
levels of PIK3R1 (HR, 0.58; 95% CI, 0.51–0.66;
P<1×10⁻¹⁶), FYN (HR, 0.71; 95% CI, 0.62–0.80;
P=5.8×10⁻⁸), SPTAN1 (HR, 0.81; 95% CI, 0.71–0.92;
P=0.0012) and THBS1 (HR, 0.88; 95% CI, 0.78–1.00; P=0.048] were
associated with increased OS time for patients with lung cancer. By
contrast, SPP1 (HR, 1.32; 95% 1.16–1.49; P=1.9×10⁻⁵) was
associated with poor OS time (Fig.
4).
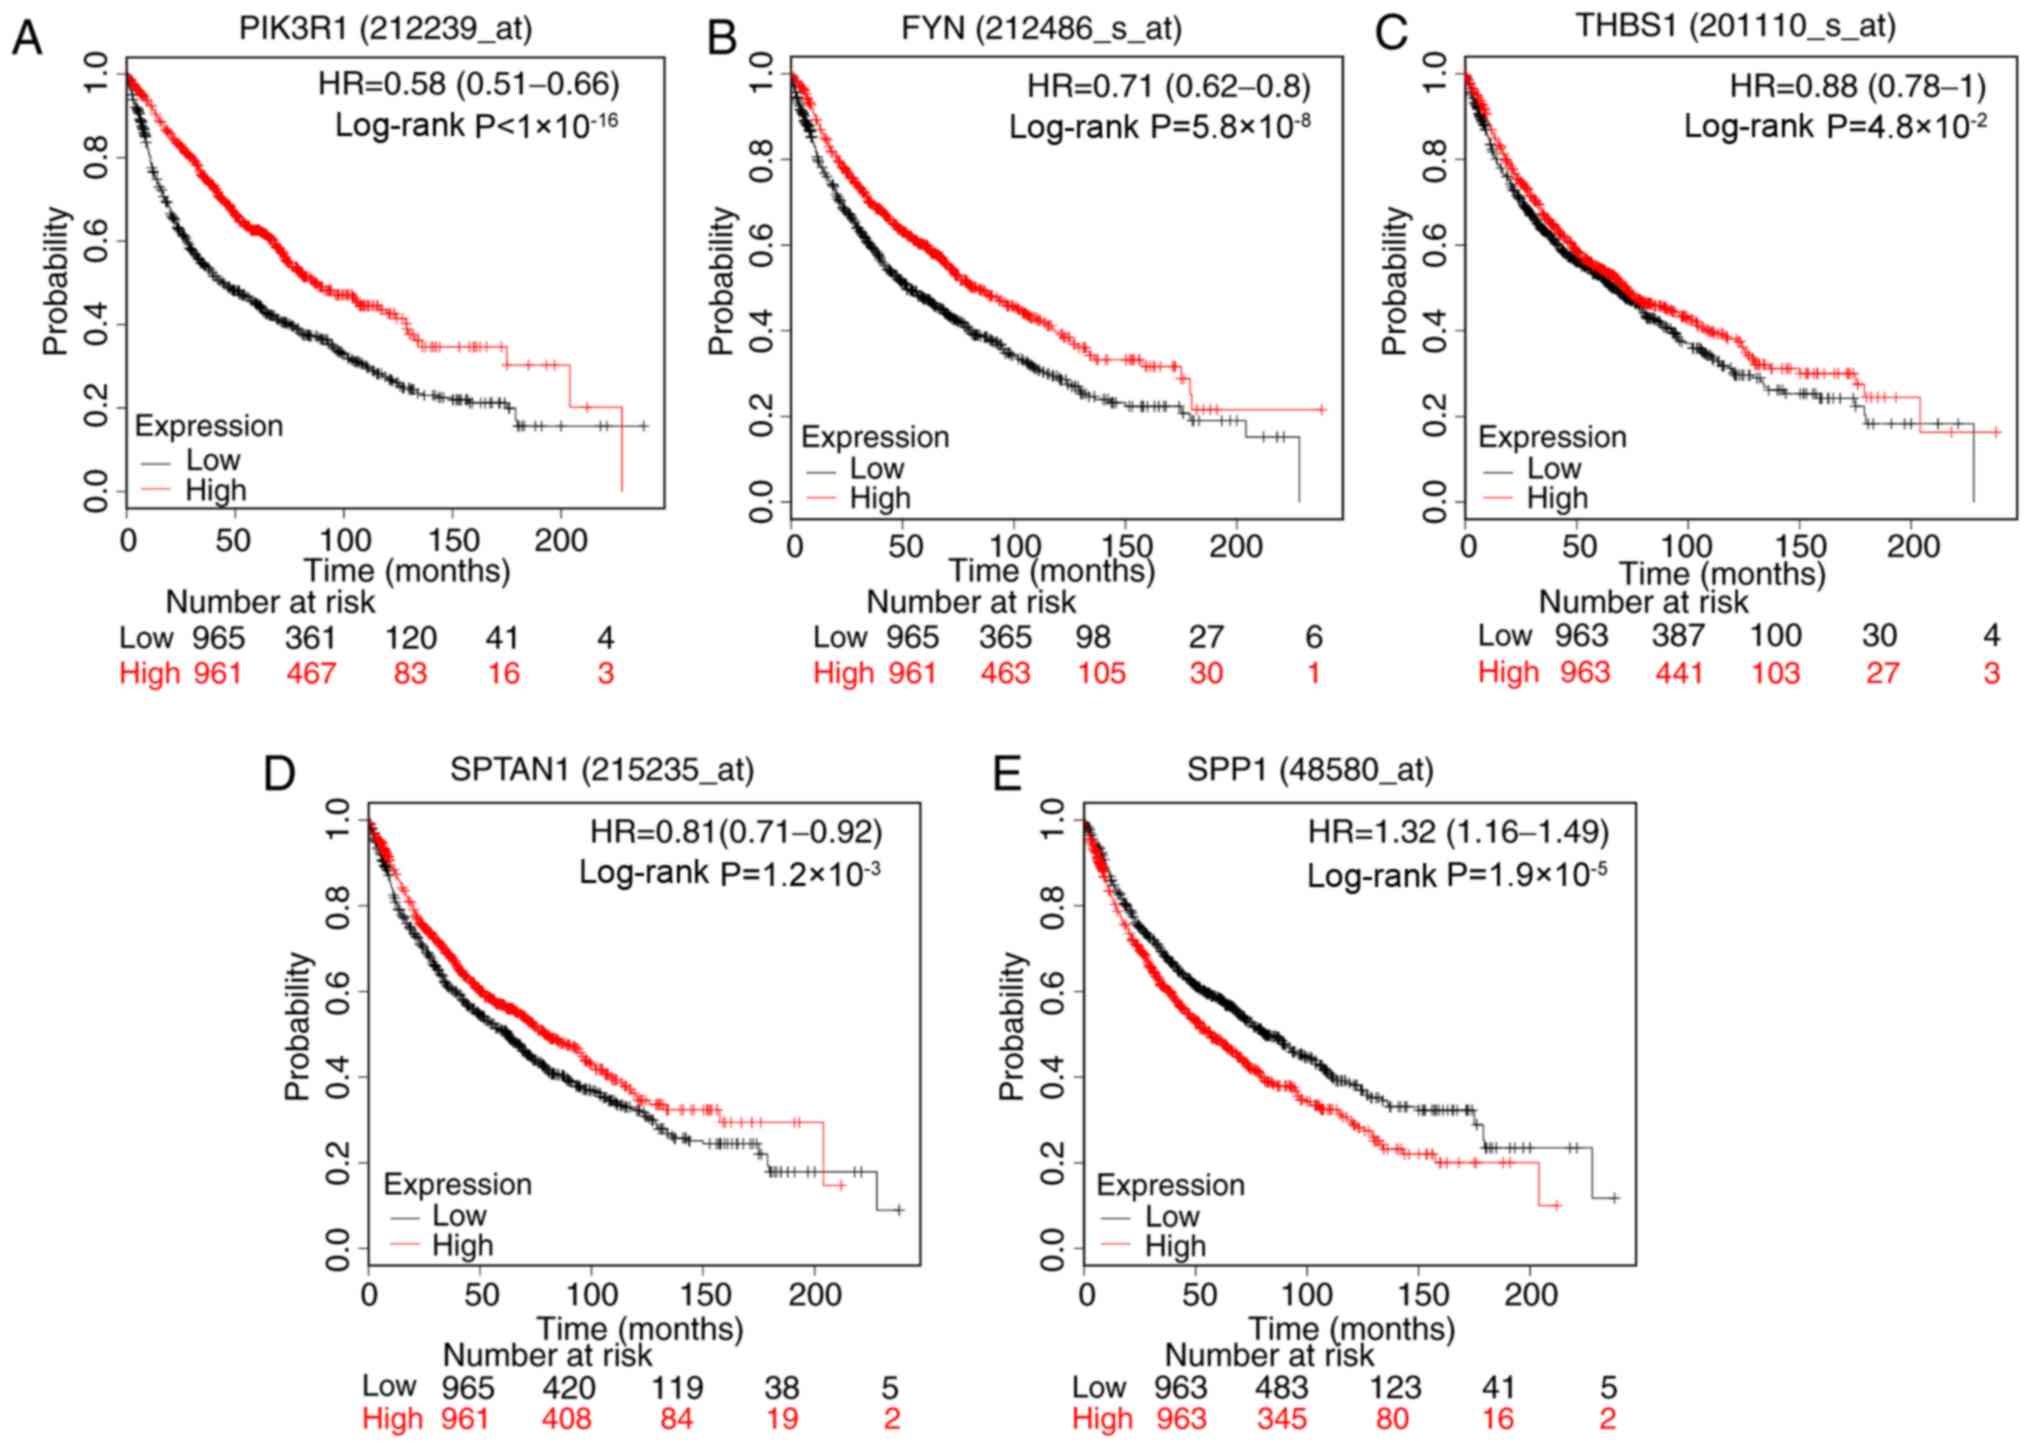 | Figure 4.Prognostic value of five genes.
Survival curves of patients with lung cancer according to the
expression level of (A) PIK3R1, (B) FYN, (C) THBS1, (D) SPTAN1 and
(E) SPP1. The valid Affymetrix IDs were as follows: 212239_at
(PIK3R1), 212486_s_at (FYN), 201110_s_at (THBS1), 215235_at
(SPTAN1), 48580_at (SPP1). HR, hazard ratio; PIK3R1,
phosphoinositide-3-kinase regulatory subunit 1; THBS1,
thrombospondin-1; SPTAN1, nonerythrocytic α-spectrin 1; SPP1,
secreted phosphoprotein 1. |
Validation of DEGs
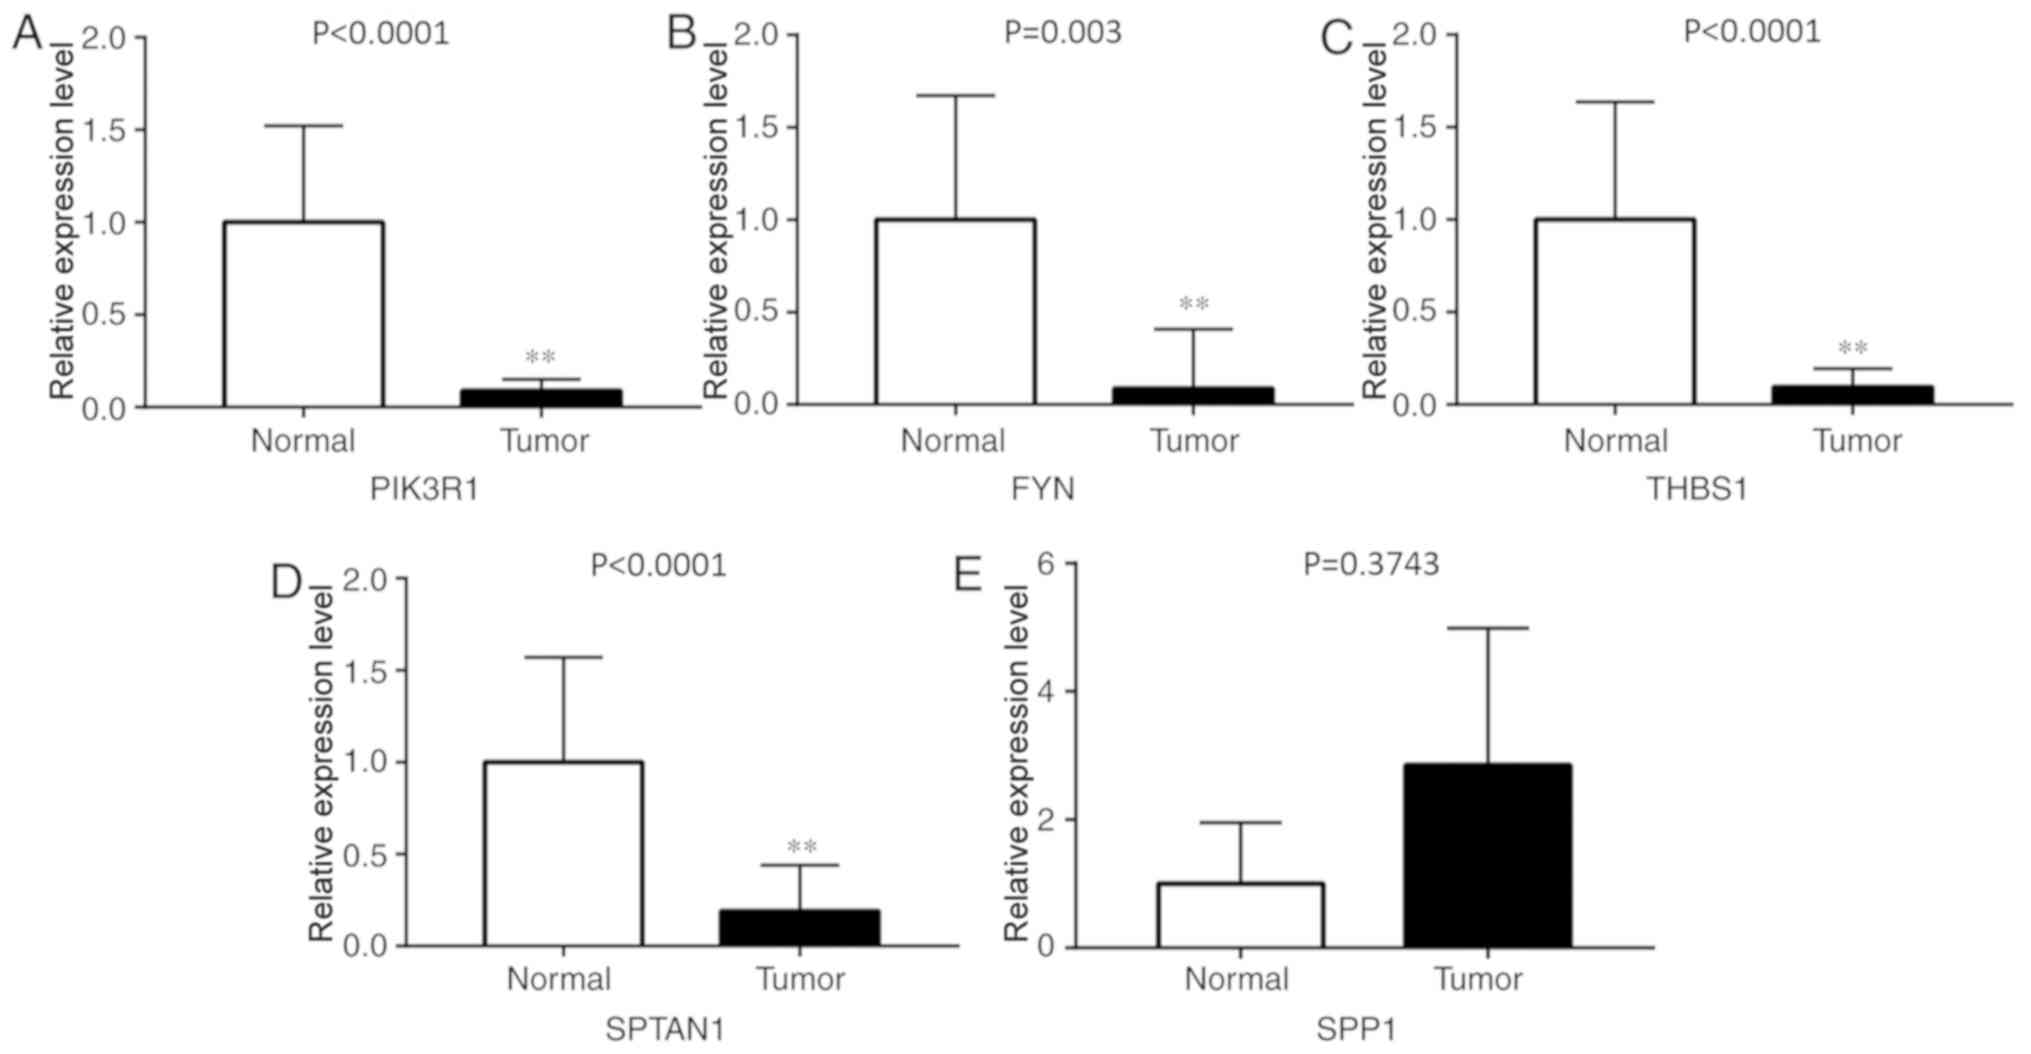
To verify whether the DEGs screened were reliable,
RT-qPCR was used to detect the expression levels of these hub genes
in eight pairs of lung cancer and adjacent tissue samples. The
results revealed that the expression levels of PIK3R1, FYN, THBS1
and SPTAN1 were significantly lower in lung cancer tissues compared
with adjacent normal lung tissues (P<0.01; Fig. 5). By contrast, SPP1 was expressed at
a slightly higher level in lung cancer tissues (P=0.3743). This
result was inconsistent with the microarray results; more clinical
tissues are needed to validate the data in further studies.
Subgroup analysis of the association between gene expression and
clinicopathological features indicated that the expression of
PIK3R1, FYN, THBS1 and SPTAN1 was lower in LUSC and LUAD,
separately, compared with normal tissues. However, no association
was observed between these genes and cancer stage, patient sex or
age.
Discussion
Lung cancer is the most common malignancy worldwide,
and the prognosis of lung cancer patients is very poor and 5-year
survival rate is <15% (13). This
is due to failure in early diagnosis and the occurrence of
metastasis (14). Therefore, the
detection of sensitive and specific biomarkers for lung cancer is
required. To the best of our knowledge, the mechanism of lung
cancer metastasis and invasion has not been fully reported. To
investigate this underlying mechanism in our previous study
(6), the gene microarray expression
profiles were examined in the large-cell lung cancer
high-metastatic 95D cell line and the low-metastatic 95C cell line.
A total of 252 differentially expressed mRNAs, including 120
upregulated mRNAs and 132 downregulated mRNAs, were identified.
These DEGs were subsequently analyzed by bioinformatics methods in
the present study. GO functional analysis indicated that the
majority of upregulated genes were involved in signaling and cell
migration. A large number of these DEGs were located at the plasma
membrane or cell periphery. Downregulated genes were mainly
involved in ‘response to protein stimulus’, ‘cytoplasmic vesicle’
and ‘voltage-gated anion channel activity’. The KEGG pathway
analysis indicated that upregulated DEGs were associated with
‘PI3K-Akt signaling pathway’ and ‘cell adhesion molecules (CAMs)’,
while the downregulated DEGs were predominantly enriched in
‘leukocyte transendothelial migration’ and ‘tight junction’.
The STRING online database and Cytoscape software
were used to construct a PPI network. According to the degree of
connectivity, 17 hub genes were filtered out. Among them, five hub
genes were closely associated with the OS of patients with lung
cancer, according to KM plotter. In addition, these genes,
including PIK3R1, FYN, THBS1, SPTAN1 and SPP1, were significantly
differentially expressed between healthy individuals and patients
with cancer based on the GEPIA database. The expression levels of
five genes were verified using eight paired lung cancer tissue and
normal lung tissue samples by RT-qPCR.
The PI3K/AKT pathway is one of the most understood
cancer-associated pathways. Class IA PI3Ks are widely studied
heterodimers that include a catalytic subunit and a regulatory
subunit. The catalytic subunit p110a is encoded by
phosphatidylinositol-4,5-bisphosphate 3-kinase catalytic subunit α,
while the regulatory subunit p85a is encoded by PIK3R1 (15). P85α not only inhibits the kinase
catalytic activity of p110α, but also binds to PTEN, preventing
PTEN ubiquitination and increasing its stability (16). Mutations in PIK3R1 are implicated in
cases of breast cancer (17).
FYN, a member of the Src family tyrosine kinases, is
associated with T cell and neuronal signaling in development and
normal cellular physiology (18).
FYN is an oncogene, which encodes a protein that is highly
expressed in various types of cancer (19–21). FYN
is associated with epithelial-mesenchymal transition (22) and also participates in a number of
cancer metastasis-associated pathways, including the TGFβ pathway
(23). In the present study, FYN was
expressed at a low level in high metastatic cancer cells, while the
database analysis indicated that high FYN expression was associated
with an improved OS time. These results are contradictory to
previous studies (19–21); further studies need to be done in the
future.
THBS1 was first identified in 1971 as a member of
the extracellular matrix protein family (24). As an angiogenesis inhibitor, THBS1
regulates diverse processes, including adhesion, invasion,
migration, proliferation and apoptosis in numerous types of cancer,
such as hepatocellular carcinoma, lung and breast cancer (25,26).
However, the precise role of THBS1 in tumor invasion and migration
remains controversial. A number of studies have suggested that
THBS1 exhibits both stimulatory and inhibitory roles in different
tumor types. On the one hand, THBS1 has been reported to stimulate
the expression of metalloproteinases partly via the integrin
signaling pathway, and enhance the invasion and migration in oral
squamous cell carcinoma cells (27).
On the other hand, THBS1 has been demonstrated to inhibit the
migration of clear cell renal carcinoma cells in response to
different stimuli (28). The present
data indicated that THBS1 may serve as a suppressor gene in lung
cancer.
Spectrin, a cytoskeletal protein, serves an
important role in maintaining the stability, structure and shape of
the cell membrane (29). It has two
α subunits and five β subunits, including αI, αII, βI, βII, βIII,
βIV and βV. SPTAN1 encodes a number of αII-spectrin isoforms that
are expressed in all nonerythroid cells (30). Recent studies have reported that a
dysregulation of SPTAN1 effects cellular behavior and promotes
tumor progression (31,32). A study reported that SPTAN1 had
recurrent mutations in 27 lung adenocarcinomas of individuals that
had never smoked, and these mutations were highly associated with
pathway dysregulation and patient survival (33).
SPP1, also termed osteopontin (OPN), is a 41–75 kDa
extracellular matrix phosphoprotein. SPP1 is a member of the small
integrin binding ligand N-linked glycoproteins family and it is
expressed in multiple tissues, particularly in bones (34). SPP1 can regulate tumor invasion and
metastasis by binding and activating matrix metalloproteinases
(35). In addition, SPP1 has been
reported to be abnormally expressed in a variety of tumor types.
For instance, SPP1 is highly expressed in liver cancer and may be a
prognostic and diagnostic marker of HCC (36). The expression of SPP1 is higher in
epithelial ovarian cancer tissues compared with that in normal
ovarian tissues, and silencing SPP1 decreased the cell
proliferation, migration, and invasion; these effects may be
dependent on the integrin β1/FAK/AKT signaling pathway (37). In lung cancer, a high expression of
SPP1 is associated with tumor stage, lymph node invasion and tumor
growth (38). A recent study
revealed that OPN-a, a splicing variant, increased A549 cell
adherent abilities to bone tissues by interacting with the cell
surface receptor αvβ3 integrin. Therefore, OPN-a may represent a
bone metastatic factor and a potential therapeutic target in human
lung cancer (39). Despite the fact
that there was no significant difference in the expression of SPP1
between lung cancer tissues and normal lung tissues in the present
study, SPP1 may still serve as a good diagnostic marker and future
studies are required to investigate this further.
In conclusion, the present study identified DEGs
that may serve a role in the invasion and metastasis of NSCLC using
bioinformatics methods. A total of 230 DEGs and 17 hub genes were
selected, and PIK3R1, FYN, THBS1, SPTAN1 and SPP1 were identified
to be potential core genes of NSCLC. In order to obtain more
accurate association results, a larger number of clinical specimens
is required to perform further verification experiments. In
summary, the current study may provide novel insights that assist
with the development of individualized treatments for NSCLC.
Supplementary Material
Supporting Data
Acknowledgements
Not applicable.
Funding
The present study was supported by National Natural
Science Foundation of China (grant no. 81672300) and Shaanxi
Science and Technology Development Research Program of China (grant
no. 2016YFJH2-11).
Availability of data and materials
The datasets used during the present study are
available from the corresponding author on reasonable request.
Authors' contributions
RS contributed to the conception of the study and
wrote the manuscript. XM, WW, BL performed the bioinformatics
analysis. JY and LZ performed reverse transcription-quantitative
PCR. XL, YC and BY analyzed the data. SY performed the
bioinformatics analysis and critically revised and checked the
manuscript. All authors read and approved the final manuscript.
Ethics approval and consent to
participate
The present study was approved by the Ethics
Committee of the Second Affiliated Hospital of Xi'an Jiaotong
University (Xi'an, China). Written informed consent was obtained
from all participants.
Patient consent for publication
Not applicable.
Competing interests
The authors declare that there are no competing
interests.
References
|
1
|
Siegel RL, Miller KD and Jemal A: Cancer
statistics, 2019. CA Cancer J Clin. 69:7–34. 2019. View Article : Google Scholar : PubMed/NCBI
|
|
2
|
Goldstraw P, Ball D, Jett JR, Le Chevalier
T, Lim E, Nicholson AG and Shepherd FA: Non-small-cell lung cancer.
Lancet. 378:1727–1740. 2011. View Article : Google Scholar : PubMed/NCBI
|
|
3
|
Brody H: Lung cancer. Nature. 513
(Suppl):S12014. View
Article : Google Scholar : PubMed/NCBI
|
|
4
|
Malone JH and Oliver B: Microarrays, deep
sequencing and the true measure of the transcriptome. BMC Biol.
9:342011. View Article : Google Scholar : PubMed/NCBI
|
|
5
|
Allison DB, Cui X, Page GP and Sabripour
M: Microarray data analysis: From disarray to consolidation and
consensus. Nat Rev Genet. 7:55–65. 2006. View Article : Google Scholar : PubMed/NCBI
|
|
6
|
Zequn N, Xuemei Z, Wei L, Zongjuan M,
Yujie Z, Yanli H, Yuping Z, Xia M, Wei W, Wenjing D, et al: The
role and potential mechanisms of LncRNA-TATDN1 on metastasis and
invasion of non-small cell lung cancer. Oncotarget. 7:18219–18228.
2016. View Article : Google Scholar : PubMed/NCBI
|
|
7
|
Huang da W, Sherman BT and Lempicki RA:
Systematic and integrative analysis of large gene lists using DAVID
bioinformatics resources. Nat Protoc. 4:44–57. 2009. View Article : Google Scholar : PubMed/NCBI
|
|
8
|
Tang Z, Li C, Kang B, Gao G, Li C and
Zhang Z: GEPIA: A web server for cancer and normal gene expression
profiling and interactive analyses. Nucleic Acids Res. 45:W98–W102.
2017. View Article : Google Scholar : PubMed/NCBI
|
|
9
|
Győrffy B, Surowiak P, Budczies J and
Lanczky A: Online survival analysis software to assess the
prognostic value of biomarkers using transcriptomic data in
non-small-cell lung cancer. PLoS One. 8:e822412013. View Article : Google Scholar : PubMed/NCBI
|
|
10
|
Livak KJ and Schmittgen TD: Analysis of
relative gene expression data using real-time quantitative PCR and
the 2(-Delta Delta C(T)) method. Methods. 25:402–408. 2001.
View Article : Google Scholar : PubMed/NCBI
|
|
11
|
Gene Ontology Consortium: Gene ontology
consortium: Going forward. Nucleic Acids Res. 43:D1049–D1056. 2015.
View Article : Google Scholar : PubMed/NCBI
|
|
12
|
Szklarczyk D, Morris JH, Cook H, Kuhn M,
Wyder S, Simonovic M, Santos A, Doncheva NT, Roth A, Bork P, et al:
The STRING database in 2017: Quality-controlled protein-protein
association networks, made broadly accessible. Nucleic Acids Res.
45:D362–D368. 2017. View Article : Google Scholar : PubMed/NCBI
|
|
13
|
Jamal-Hanjani M, Wilson GA, McGranahan N,
Birkbak NJ, Watkins TBK, Veeriah S, Shafi S, Johnson DH, Mitter R,
Rosenthal R, et al: Tracking the evolution of non-small-cell lung
cancer. N Engl J Med. 376:2109–2121. 2017. View Article : Google Scholar : PubMed/NCBI
|
|
14
|
Hamilton G and Rath B:
Mesenchymal-epithelial transition and circulating tumor cells in
small cell lung cancer. Adv Exp Med Biol. 994:229–245. 2017.
View Article : Google Scholar : PubMed/NCBI
|
|
15
|
Kriplani N, Hermida MA, Brown ER and
Leslie NR: Class I PI 3-kinases: Function and evolution. Adv Biol
Regul. 59:53–64. 2015. View Article : Google Scholar : PubMed/NCBI
|
|
16
|
Chagpar RB, Links PH, Pastor MC, Furber
LA, Hawrysh AD, Chamberlain MD and Anderson DH: Direct positive
regulation of PTEN by the p85 subunit of phosphatidylinositol
3-kinase. Proc Natl Acad Sci USA. 107:5471–5476. 2010. View Article : Google Scholar : PubMed/NCBI
|
|
17
|
Chen L, Yang L, Yao L, Kuang XY, Zuo WJ,
Li S, Qiao F, Liu YR, Cao ZG, Zhou SL, et al: Characterization of
PIK3CA and PIK3R1 somatic mutations in Chinese breast cancer
patients. Nat Commun. 9:13572018. View Article : Google Scholar : PubMed/NCBI
|
|
18
|
Saito YD, Jensen AR, Salgia R and Posadas
EM: Fyn: A novel molecular target in cancer. Cancer. 116:1629–1637.
2010. View Article : Google Scholar : PubMed/NCBI
|
|
19
|
Li X, Yang Y, Hu Y, Dang D, Regezi J,
Schmidt BL, Atakilit A, Chen B, Ellis D and Ramos DM:
Alphavbeta6-Fyn signaling promotes oral cancer progression. J Biol
Chem. 278:41646–41653. 2003. View Article : Google Scholar : PubMed/NCBI
|
|
20
|
Posadas EM, Al-Ahmadie H, Robinson VL,
Jagadeeswaran R, Otto K, Kasza KE, Tretiakov M, Siddiqui J, Pienta
KJ, Stadler WM, et al: FYN is overexpressed in human prostate
cancer. BJU Int. 103:171–177. 2009. View Article : Google Scholar : PubMed/NCBI
|
|
21
|
Zhang X, Li F and Zhu PL: Fyn-related
kinase expression predicts favorable prognosis in patients with
cervical cancer and suppresses malignant progression by regulating
migration and invasion. Biomed Pharmacother. 84:270–276. 2016.
View Article : Google Scholar : PubMed/NCBI
|
|
22
|
Lewin B, Siu A, Baker C, Dang D, Schnitt
R, Eisapooran P and Ramos DM: Expression of Fyn kinase modulates
EMT in oral cancer cells. Anticancer Res. 30:2591–2596.
2010.PubMed/NCBI
|
|
23
|
Kim AN, Jeon WK, Lim KH, Lee HY, Kim WJ
and Kim BC: Fyn mediates transforming growth factor-beta1-induced
down-regulation of E-cadherin in human A549 lung cancer cells.
Biochem Biophys Res Commun. 407:181–184. 2011. View Article : Google Scholar : PubMed/NCBI
|
|
24
|
Li Y, Turpin CP and Wang S: Role of
thrombospondin 1 in liver diseases. Hepatol Res. 47:186–193. 2017.
View Article : Google Scholar : PubMed/NCBI
|
|
25
|
Huang T, Sun L, Yuan X and Qiu H:
Thrombospondin-1 is a multifaceted player in tumor progression.
Oncotarget. 8:84546–84558. 2017.PubMed/NCBI
|
|
26
|
Jeanne A, Schneider C, Martiny L and
Dedieu S: Original insights on thrombospondin-1-related
antireceptor strategies in cancer. Front Pharmacol. 6:2522015.
View Article : Google Scholar : PubMed/NCBI
|
|
27
|
Pal SK, Nguyen CT, Morita KI, Miki Y,
Kayamori K, Yamaguchi A and Sakamoto K: THBS1 is induced by TGFB1
in the cancer stroma and promotes invasion of oral squamous cell
carcinoma. J Oral Pathol Med. 45:730–739. 2016. View Article : Google Scholar : PubMed/NCBI
|
|
28
|
Bienes-Martinez R, Ordonez A,
Feijoo-Cuaresma M, Corral-Escariz M, Mateo G, Stenina O, Jiménez B
and Calzada MJ: Autocrine stimulation of clear-cell renal carcinoma
cell migration in hypoxia via HIF-independent suppression of
thrombospondin-1. Sci Rep. 2:7882012. View Article : Google Scholar : PubMed/NCBI
|
|
29
|
Hartwig JH: Actin-binding proteins 1:
Spectrin superfamily. Protein Profile. 1:706–778. 1994.PubMed/NCBI
|
|
30
|
Cianci CD, Zhang Z, Pradhan D and Morrow
JS: Brain and muscle express a unique alternative transcript of
alphaII spectrin. Biochemistry. 38:15721–15730. 1999. View Article : Google Scholar : PubMed/NCBI
|
|
31
|
Ackermann A, Schrecker C, Bon D,
Friedrichs N, Bankov K, Wild P, Plotz G, Zeuzem S, Herrmann E,
Hansmann ML and Brieger A: Downregulation of SPTAN1 is related to
MLH1 deficiency and metastasis in colorectal cancer. PLoS One.
14:e02134112019. View Article : Google Scholar : PubMed/NCBI
|
|
32
|
Sheng G, Zhang J, Zeng Z, Pan J, Wang Q,
Wen L, Xu Y, Wu D and Chen S: Identification of a novel
CSF3R-SPTAN1 fusion gene in an atypical chronic myeloid leukemia
patient with t(1;9)(p34;q34) by RNA-Seq. Cancer Genet 216–217.
16–19. 2017. View Article : Google Scholar
|
|
33
|
Sun Z, Wang L, Eckloff BW, Deng B, Wang Y,
Wampfler JA, Jang J, Wieben ED, Jen J, You M and Yang P: Conserved
recurrent gene mutations correlate with pathway deregulation and
clinical outcomes of lung adenocarcinoma in never-smokers. BMC Med
Genomics. 7:322014. View Article : Google Scholar : PubMed/NCBI
|
|
34
|
Wei R, Wong JPC and Kwok HF: Osteopontin-a
promising biomarker for cancer therapy. J Cancer. 8:2173–2183.
2017. View Article : Google Scholar : PubMed/NCBI
|
|
35
|
Fedarko NS, Jain A, Karadag A and Fisher
LW: Three small integrin binding ligand N-linked glycoproteins
(SIBLINGs) bind and activate specific matrix metalloproteinases.
FASEB J. 18:734–736. 2004. View Article : Google Scholar : PubMed/NCBI
|
|
36
|
Cabiati M, Gaggini M, Cesare MM, Caselli
C, De Simone P, Filipponi F, Basta G, Gastaldelli A and Del Ry S:
Osteopontin in hepatocellular carcinoma: A possible biomarker for
diagnosis and follow-up. Cytokine. 99:59–65. 2017. View Article : Google Scholar : PubMed/NCBI
|
|
37
|
Zeng B, Zhou M, Wu H and Xiong Z: SPP1
promotes ovarian cancer progression via Integrin beta1/FAK/AKT
signaling pathway. Onco Targets Ther. 11:1333–1343. 2018.
View Article : Google Scholar : PubMed/NCBI
|
|
38
|
Hu Z, Lin D, Yuan J, Xiao T, Zhang H, Sun
W, Han N, Ma Y, Di X, Gao M, et al: Overexpression of osteopontin
is associated with more aggressive phenotypes in human non-small
cell lung cancer. Clin Cancer Res. 11:4646–4652. 2005. View Article : Google Scholar : PubMed/NCBI
|
|
39
|
Hao C, Cui Y, Hu MU, Zhi X, Zhang L, Li W,
Wu W, Cheng S and Jiang WG: OPN-a splicing variant expression in
non-small cell lung cancer and its effects on the bone metastatic
abilities of lung cancer cells in vitro. Anticancer Res.
37:2245–2254. 2017. View Article : Google Scholar : PubMed/NCBI
|