Introduction
Glioblastoma multiforme (GBM), which develops from
astrocytes, is the most common primary brain tumor in adults and
one of the most damaging types of human cancer. Despite aggressive
multimodal treatment with surgery, radiotherapy and chemotherapy,
the prognosis of GBM is extremely poor (1,2).
Additionally, GBM demonstrates a high potential to infiltrate the
brain parenchyma, which poses a challenge to the available
treatment strategies. Typically, GBM results in mortality at 12–15
months post-diagnosis (1).
Therefore, novel therapies for GBM are urgently required.
Identifying the mechanisms underlying the
development of GBM is important for the development of new
treatments. The genetic alterations that affect genes controlling
cell growth, apoptosis and invasion have been widely examined in
GBM (3). Epigenetic alterations have
also been identified to be involved in GBM by affecting the
expression of cancer-associated genes alone or in combination with
genetic mechanisms (4). Aberrant
methylation of gene promoters is the most widely studied epigenetic
change that occurs during oncogenesis. It is understood that
increased methylation, termed hypermethylation, in the CpG island
promotes carcinogenesis by silencing tumor suppressor genes, while
loss of methylation, termed hypomethylation, enhances the
transcriptional activation of oncogenes and induces chromosomal
instability (5,6). Decreased expression of tumor suppressor
genes, including retinoblastoma gene, phosphatase and tensin
homolog, and TP53, is associated with CpG island promoter
hypermethylation and has been reported in GBM (7–9).
Epigenetic silencing of O6-methylguanine-DNA methyltransferase, a
DNA repair gene that can protect cancer cells from chemotherapeutic
alkylating agents, has been revealed to be significantly associated
with longer survival times in patients with GBM who are treated
with alkylating agents (10,11). Such epigenetic changes may be
promising targets for epigenetic anticancer treatments. Indeed, the
DNA-demethylating agents 5-azacitidine and 5-aza-2′-deoxycitidine
have been approved by the Food and Drug Administration for the
treatment of myelogenous leukemia and myelodysplastic syndromes
(12).
Bioinformatics tools and algorithms assist the
processing and analysis of high-throughput DNA methylation data
(13,14). For example, a previous study used a
joint analysis of DNA methylation and gene expression data of GBM
to demonstrate that changes in DNA methylation can be associated
with survival outcome (15). In
addition, a recent study used a computational approach to integrate
gene expression and genomic or methylation data to investigate
biological networks in GBM (16).
The current study used bioinformatics approaches to reanalyze the
DNA methylation data deposited by Lai et al (17). The present results may improve
understanding of the epigenetic regulation mechanism of GBM and
provide potential gene methylation biomarkers for GBM, which may
contribute to the development of treatments.
Materials and methods
Microarray data
DNA methylation data from the GBM study by Lai et
al (17) were retrieved from the
National Center for Biotechnology Information Gene Expression
Omnibus (GEO) database (http://www.ncbi.nlm.nih.gov/projects/geo/) with the
accession number GSE50923. The DNA methylation profiles of 54 GBM
samples and 24 control brain samples were previously investigated
using Illumina HumanMethylation27 BeadChip. The patient details are
presented in the original study by Lai et al (17). Only data from 31 GBM and 24 control
brain samples were present in the GEO database, therefore, only
these data were analyzed in the current study.
Identification of differentially
methylated regions (DMRs)
The original methylation data were processed using
the Bioconductor lumi package version 2.18.0, which is designed to
process the Illumina microarray data (18,19).
Following quality control and background correction, these data
were scaled by quantile normalization as implemented in the lumi
package. The methyAnalysis package version 1.8.0 (20) was applied to identify DMRs between
GBM and controls. P<0.001 and a difference in methylation
levels, calculated as the M-value (19), of >1 or <-1 were considered to
indicate a statistically significant DMR. The identified DMRs were
then annotated using the methyAnalysis package and DMRs located at
gene promoter regions, within 2 kb upstream of the transcription
start site, were selected for further analysis.
Functional enrichment analysis
Functional enrichment analysis was conducted to
explore the most significant differentially methylated genes (DMGs)
with relevant biological functions. Gene Ontology (GO) is a
bioinformatics tool for annotating genes, gene products and
sequences using defined GO terms (21). The Kyoto Encyclopedia of Genes and
Genomes (KEGG) is a comprehensive database linking genomic data,
stored in the GENES database, with higher order functional
information, stored in the PATHWAY database (22). Reactome is a free online database of
biological pathways (23). The KEGG
pathway, Reactome pathway and GO functional terms for the DMGs were
identified using the following cut-off criteria: P<0.05 and
number of over-represented genes >2.
Construction of a protein-protein
interaction (PPI) network
The PPI data were retrieved from the STRING database
(http://string.embl.de/). Subsequently, the DMGs
were mapped into these interactions, and DMG pairs with an
interaction score >0.9 were selected to construct the PPI
networks, which were visualized using Cytoscape software version
3.1.0 (24).
Classification of DMGs
TSGene (25) is a
database for tumor suppressor genes (TSGs) and the TAG database
(26) provides information on
well-characterized oncogenes and TSGs. The known TSGs and oncogenes
were identified from the list of DMGs based on information
retrieved from the TSGene and TAG databases.
Identification of transcription
factors (TFs) regulating DMGs and construction of a transcriptional
regulatory network
The TF regulation data were downloaded from the
Encyclopedia of DNA Elements data portal (27,28), and
TFs that regulate the hypermethylated genes and hypomethylated
genes were identified. The hypergeometric distribution was used to
assign a P-value for the prediction of these TFs and an adjusted
P-value of <0.05 was considered significant. Furthermore,
transcriptional regulatory networks of hypermethylated genes and
hypomethylated genes were constructed using Cytoscape (version
3.6.0) (24).
Data validation
To validate the identified DMGs from GSE50923,
another relevant DNA Methylation Profiling dataset, GSE22867
(29), was downloaded from the GEO
database and used for data validation. GSE22867 included 55 GBM
samples and 3 control brain samples. The platform was GPL8490
Illumina HumanMethylation27 BeadChip
(HumanMethylation27_270596_v.1.2). The β-value was calculated based
on the methylated and unmethylated signal of the sample data, and a
t-test was implemented using the genefilter package (version
1.56.0) (30) to identify
significant differentially methylated CpGs (P<0.05). In
addition, selected CpG sites exhibited a mean methylation (β-value)
difference ≥0.05 between the disease group and the control group.
Subsequently, the genes covering the differentially methylated CpGs
were identified and compared with the identified DMGs from
GSE50923.
Results
Identification of DMGs
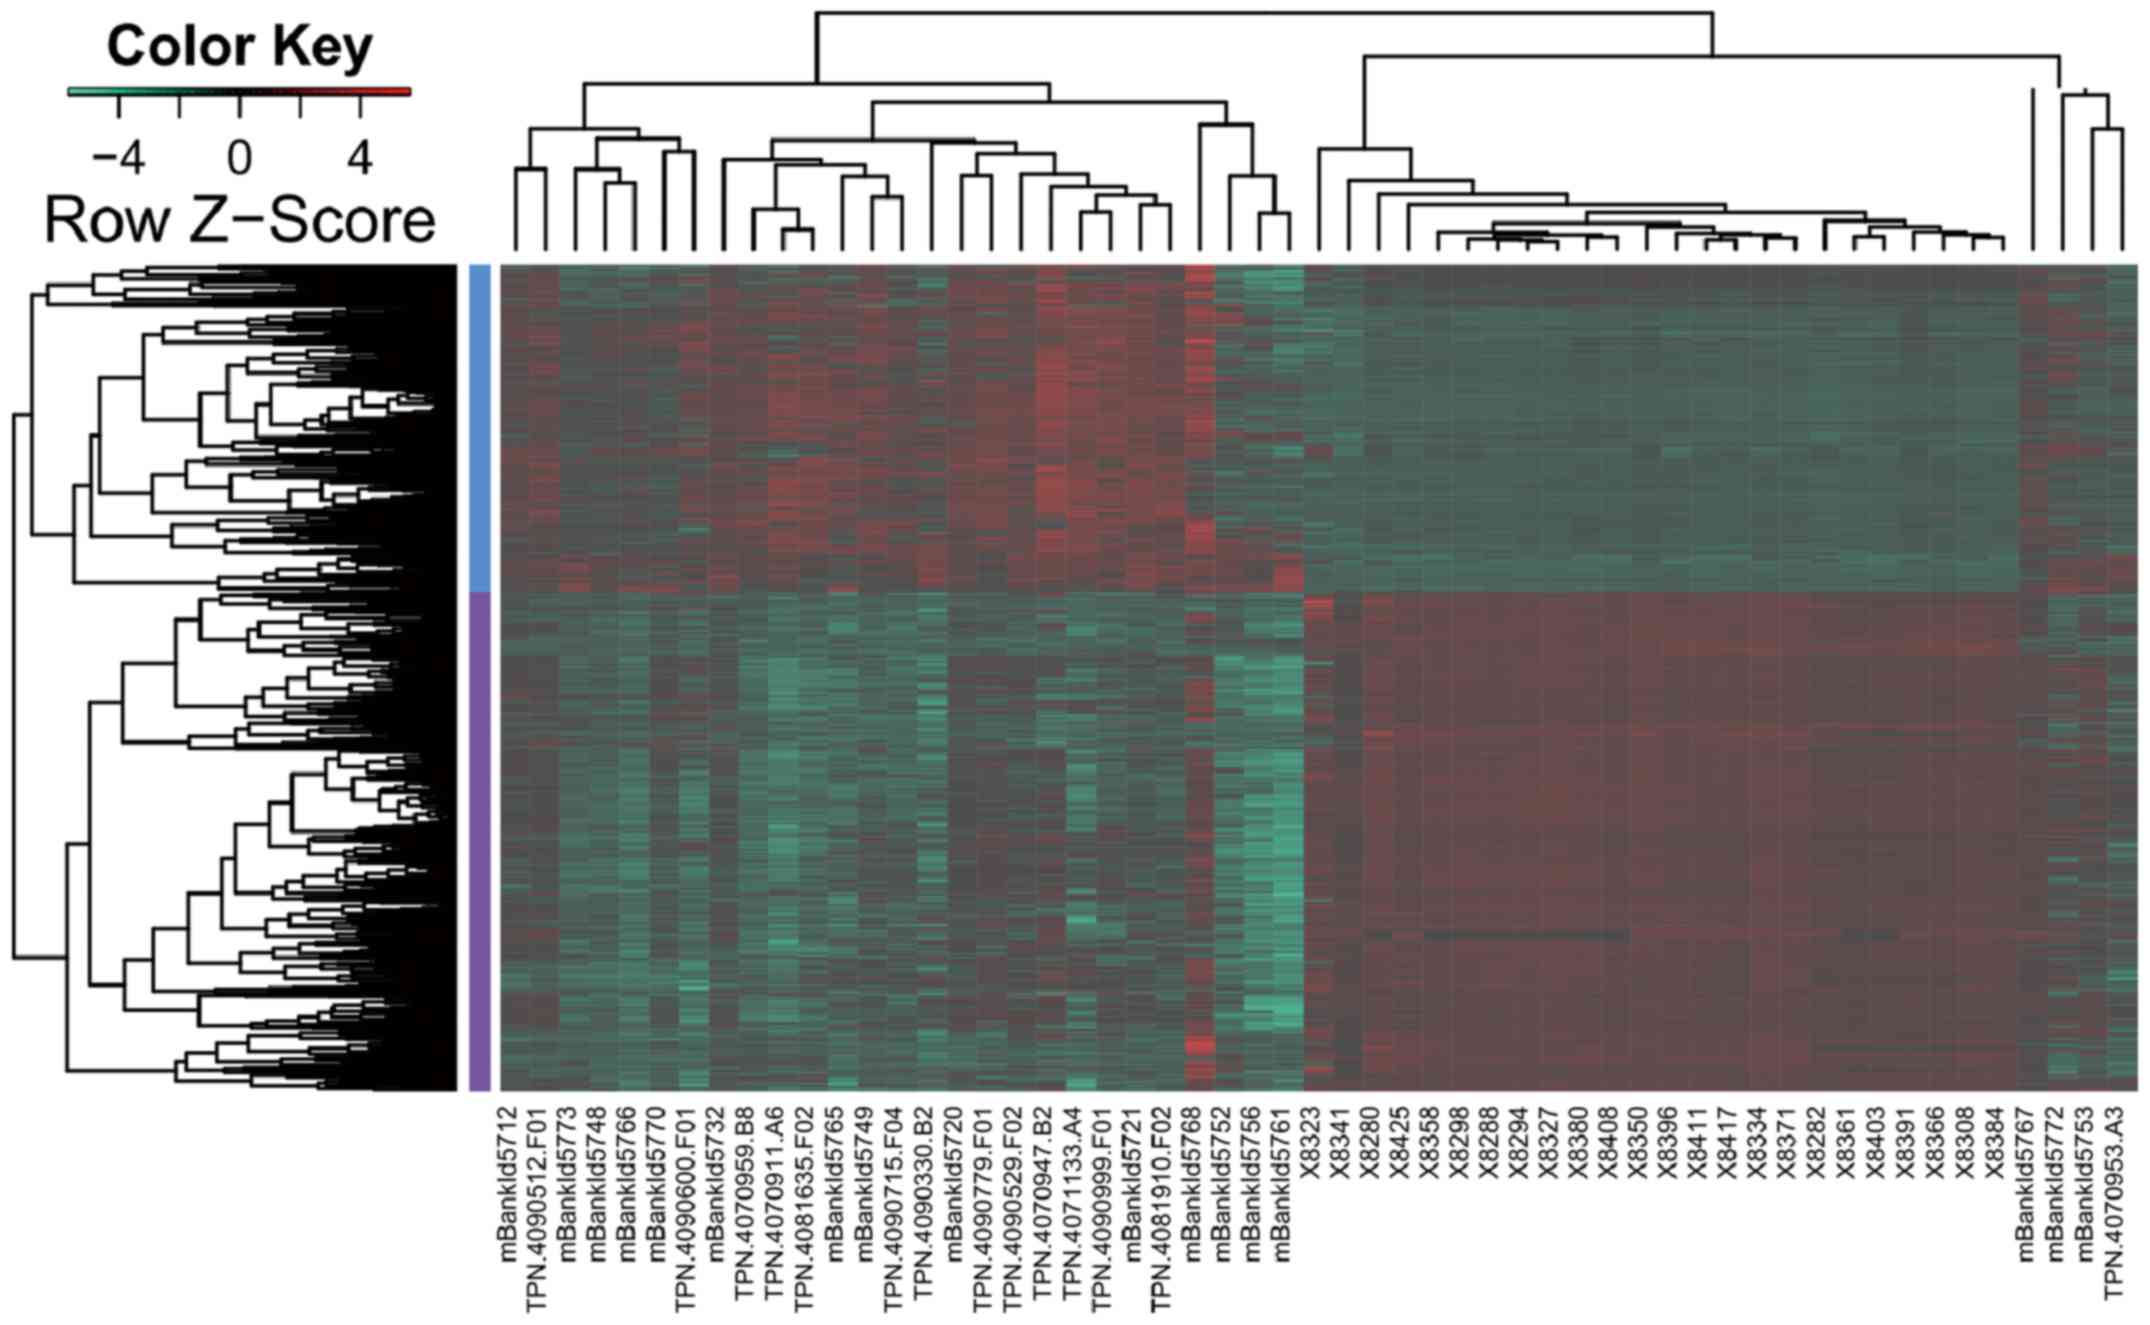
Based on the methyAnalysis package, a total of 2,407
DMRs were identified between the GBM samples and normal controls.
Among these DMRs, 476 hypermethylated and 850 hypomethylated
regions were located in gene promoters, which clearly distinguished
GBM from normal samples (Fig.
1).
Functional enrichment analysis
To gain insight into the dysregulated biological
processes induced by DMGs, separate functional enrichment analyses
were performed for the hypermethylated and hypomethylated genes.
The data indicated that certain KEGG pathways, including
‘neuroactive ligand-receptor interaction’, and ‘D-glutamine and
D-glutamate metabolism’, were enriched by hypermethylated genes,
while ‘cytokine-cytokine receptor interaction’ and ‘hematopoietic
cell lineage’ were enriched by hypomethylated genes (Table I). GO terms were grouped into the
following three categories: Biological process, molecular function
and cellular component. The most significantly enriched GO
biological process and molecular function terms were ‘anatomical
structure development’ and ‘sequence-specific DNA-binding
transcription factor activity’, respectively, while no
statistically significant enriched cellular component terms were
identified (Table II). For
hypomethylated genes, the most significant GO terms were ‘defense
response’, ‘cytokine activity’ and ‘extracellular region’ (Table II). Reactome pathway analysis
demonstrated that both hypermethylated and hypomethylated genes
were closely associated with the ‘G-protein-coupled receptor (GPCR)
ligand binding pathway’ (Table
III).
 | Table I.Top five KEGG pathways enriched by
hypermethylated genes and hypomethylated genes. |
Table I.
Top five KEGG pathways enriched by
hypermethylated genes and hypomethylated genes.
| A, Hypermethylated
genes |
|---|
|
|---|
| KEGG ID | KEGG pathway | P-value |
|---|
| 4080 | Neuroactive
ligand-receptor interaction |
1.18×10⁻³ |
| 471 | D-Glutamine and
D-glutamate metabolism |
3.62×10⁻³ |
| 4114 | Oocyte meiosis |
6.76×10⁻³ |
| 250 | Alanine, aspartate
and glutamate metabolism |
7.87×10⁻³ |
| 4971 | Gastric acid
secretion |
1.02×10⁻² |
|
| B,
Hypomethylated genes |
|
| KEGG ID | KEGG
pathway | P-value |
|
| 4060 | Cytokine-cytokine
receptor interaction |
1.22×10⁻¹⁰ |
| 4640 | Hematopoietic cell
lineage |
1.49×10⁻⁵ |
| 5150 | Staphylococcus
aureus infection |
1.35×10⁻⁴ |
| 4610 | Complement and
coagulation cascades |
2.72×10⁻⁴ |
| Table II.Top five GO terms enriched by
hypermethylated genes and hypomethylated genes. |
Table II.
Top five GO terms enriched by
hypermethylated genes and hypomethylated genes.
| A, Hypermethylated
genes |
|---|
|
|---|
| GO ID | GO term | P-value |
|---|
| Biological
process |
|
|
|
GO:0048856 | Anatomical
structure development |
3.19×10⁻⁸ |
|
GO:0032502 | Developmental
process |
4.06×10⁻⁸ |
|
GO:0044707 |
Single-multicellular organism process |
4.85×10⁻⁸ |
|
GO:0032501 | Multicellular
organismal process |
8.26×10⁻⁸ |
|
GO:0007275 | Multicellular
organismal development |
3.47×10⁻⁷ |
| Molecular
function |
|
|
|
GO:0003700 | Sequence-specific
DNA binding transcription factor activity |
5.04×10⁻⁹ |
|
GO:0001071 | Nucleic acid
binding transcription factor activity |
5.51×10⁻⁹ |
|
GO:0043565 | Sequence-specific
DNA binding |
1.76×10⁻⁸ |
|
GO:0044212 | Transcription
regulatory region DNA binding |
6.04×10⁻⁷ |
|
GO:0000975 | Regulatory region
DNA binding |
9.99×10⁻⁷ |
| Cellular
component |
|
|
|
GO:0044459 | Plasma membrane
part |
2.37×10⁻¹ |
|
GO:0019897 | Extrinsic to plasma
membrane |
2.61×10⁻¹ |
|
GO:0008076 | Voltage-gated
potassium channel complex |
4.53×10⁻¹ |
|
GO:0034705 | Potassium channel
complex |
4.53×10⁻¹ |
|
GO:0019898 | Extrinsic to
membrane |
5.85×10⁻¹ |
|
| B,
Hypomethylated genes |
|
| GO ID | GO term | P-value |
|
| Biological
process |
|
|
|
GO:0006952 | Defense
response |
8.19×10⁻¹² |
|
GO:0006954 | Inflammatory
response |
9.55×10⁻¹² |
|
GO:0050896 | Response to
stimulus |
6.68×10⁻¹¹ |
|
GO:0002376 | Immune system
process |
8.73×10⁻¹¹ |
|
GO:0009611 | Response to
wounding |
6.82×10⁻¹⁰ |
| Molecular
function |
|
|
|
GO:0005125 | Cytokine
activity |
3.13×10⁻⁷ |
|
GO:0005126 | Cytokine receptor
binding |
1.30×10⁻⁵ |
|
GO:0004872 | Receptor
activity |
6.25×10⁻⁵ |
|
GO:0005102 | Receptor
binding |
1.39×10⁻³ |
|
GO:0005506 | Iron ion
binding |
8.86×10⁻³ |
| Cellular
component |
|
|
|
GO:0005576 | Extracellular
region |
<1.00×10⁻³ |
|
GO:0005615 | Extracellular
space |
<1.00×10⁻³ |
|
GO:0044421 | Extracellular
region part |
<1.00×10⁻³ |
|
GO:0071944 | Cell periphery |
3.84×10⁻⁹ |
|
GO:0005886 | Plasma
membrane |
5.56×10⁻⁹ |
| Table III.Top five Reactome pathways enriched
by hypermethylated genes and hypomethylated genes. |
Table III.
Top five Reactome pathways enriched
by hypermethylated genes and hypomethylated genes.
| A, Hypermethylated
genes |
|---|
|
|---|
| Reactome ID | Name | P-value |
|---|
| 500792 | GPCR ligand
binding |
8.88×10⁻² |
| 112316 | Neuronal
system |
1.61×10⁻¹ |
| 373076 | Class A/1
(Rhodopsin-like receptors) |
3.55×10⁻¹ |
| 418597 | G α (z) signaling
events |
4.98×10⁻¹ |
| 1296072 | Voltage-gated
potassium channels |
9.92×10⁻¹ |
|
| B,
Hypomethylated genes |
|
| Reactome
ID | Name | P-value |
|
| 500792 | GPCR ligand
binding |
5.94×10⁻⁴ |
| 211897 | Cytochrome
P450-arranged by substrate type |
1.05×10⁻³ |
| 373076 | Class A/1
(Rhodopsin-like receptors) |
5.68×10⁻³ |
| 211945 | Phase
1-Functionalization of compounds |
6.96×10⁻³ |
Construction of PPI networks
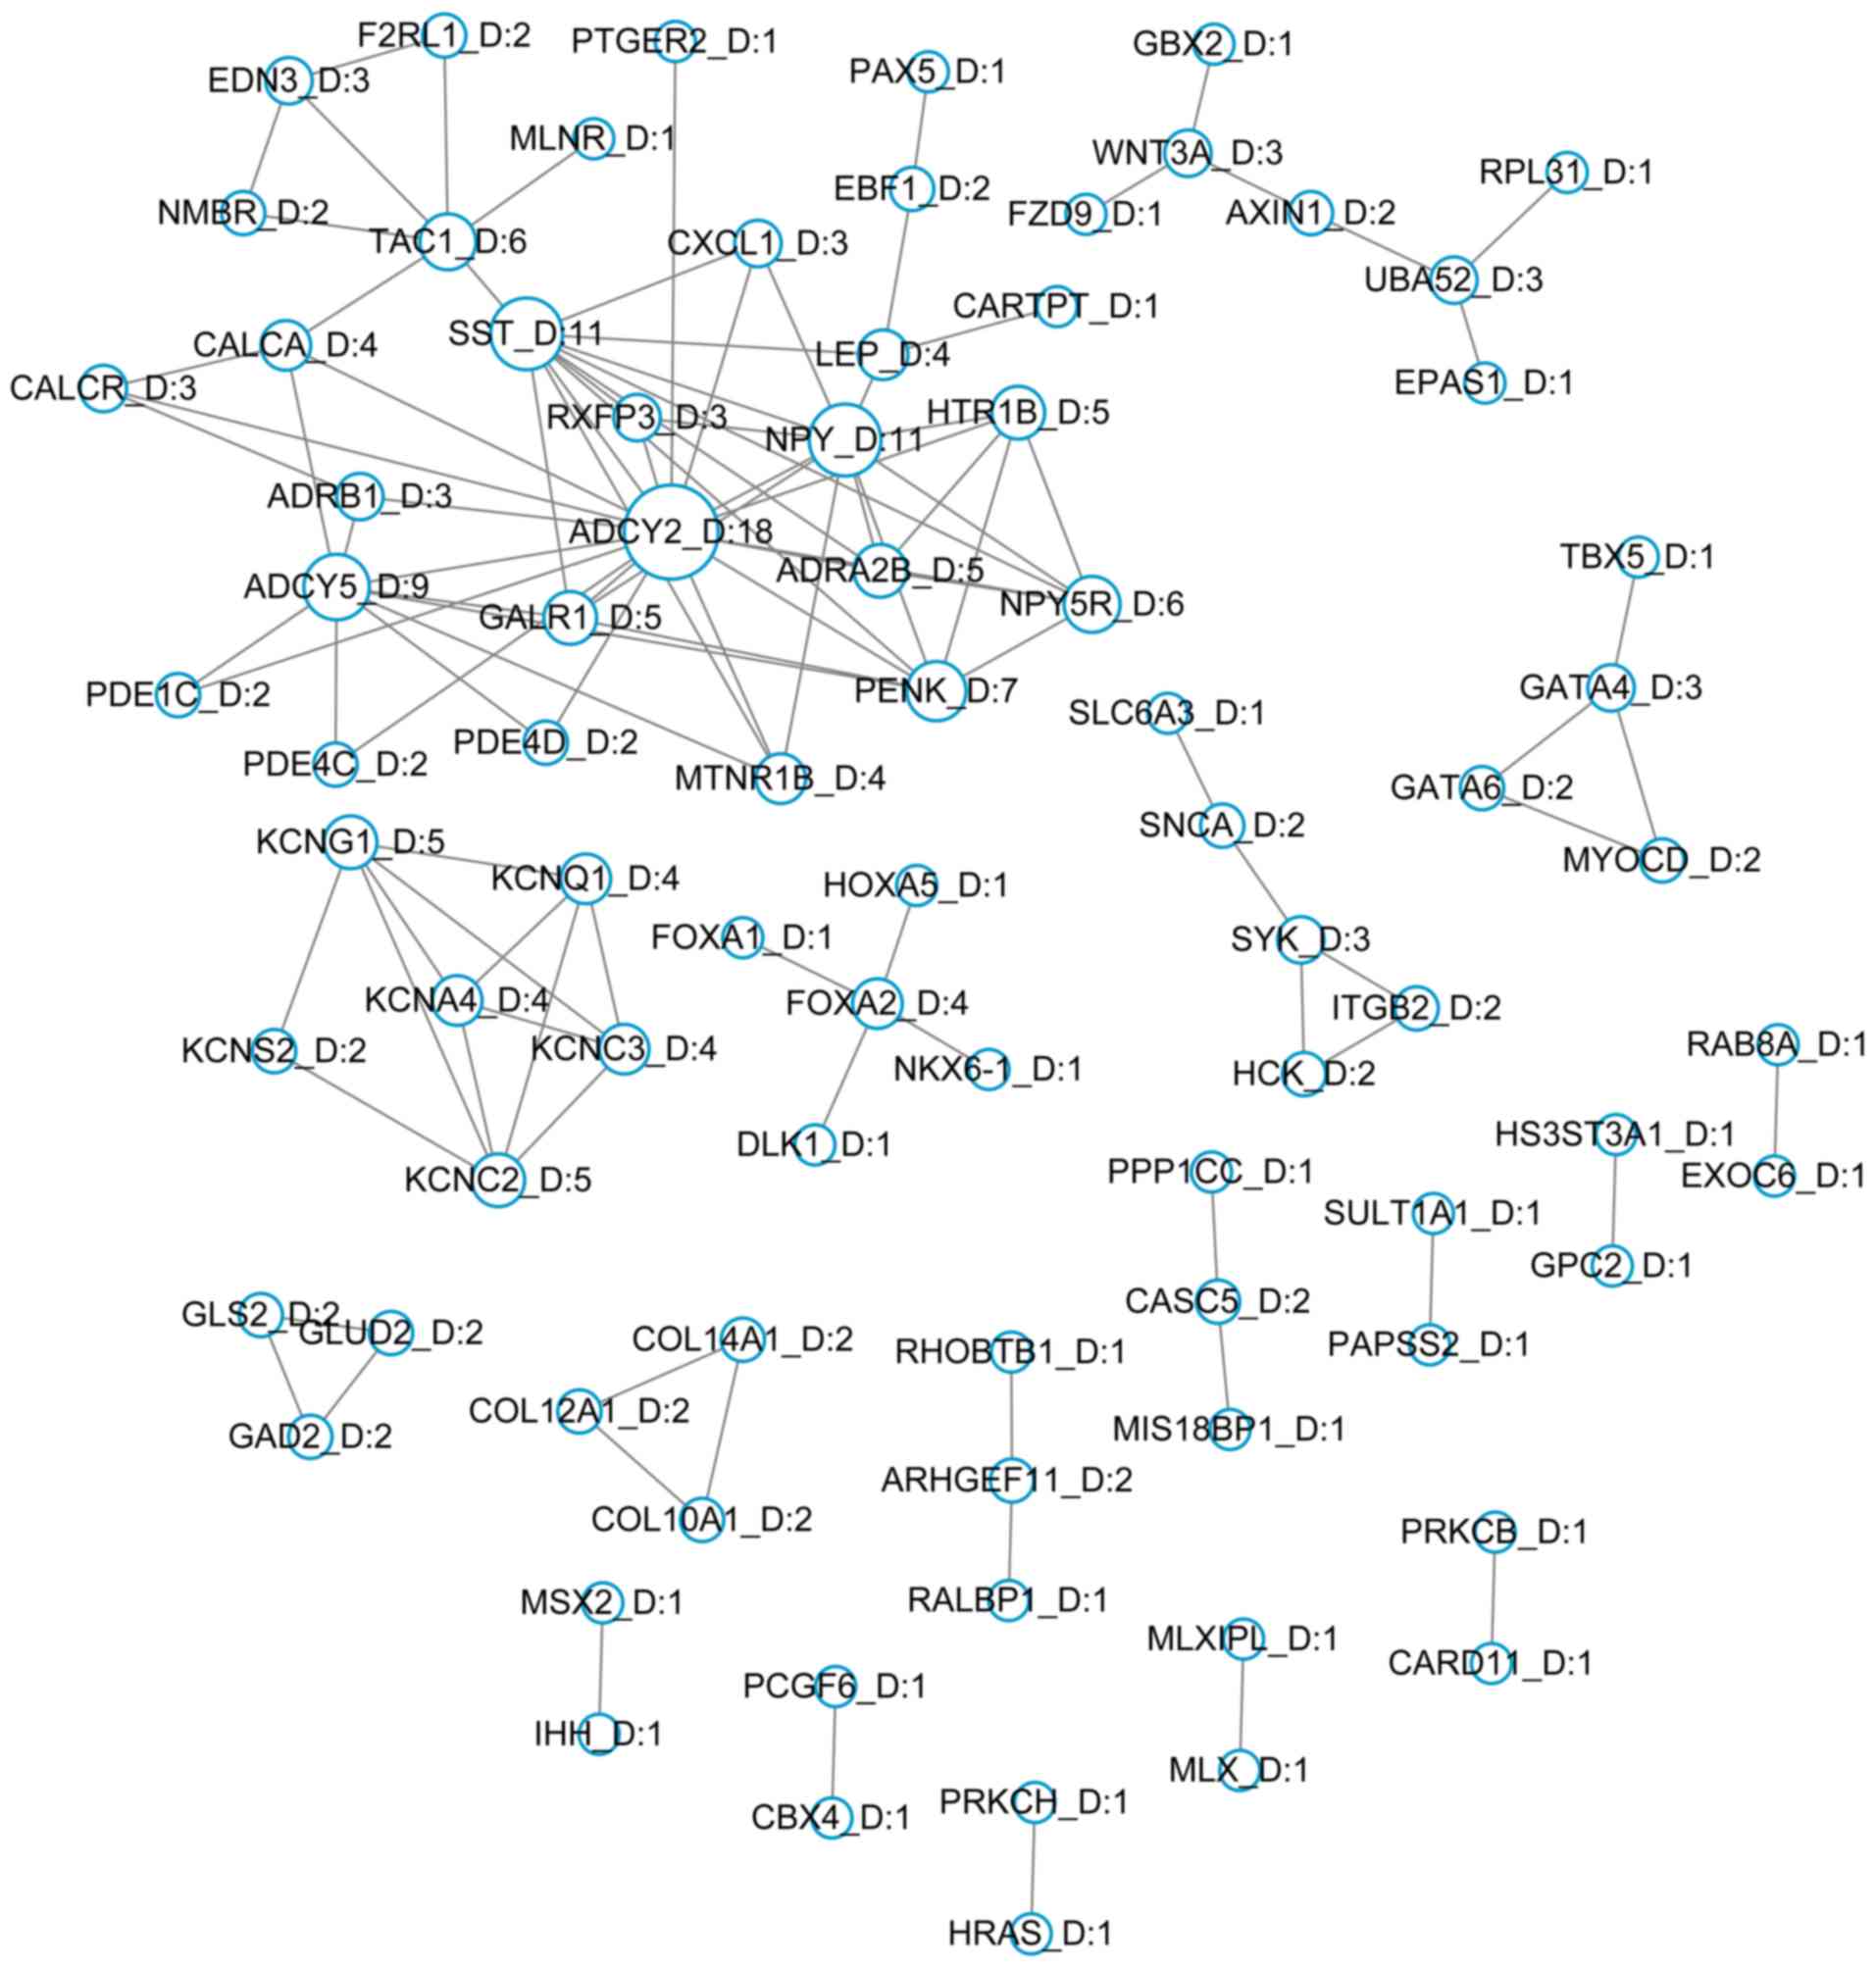
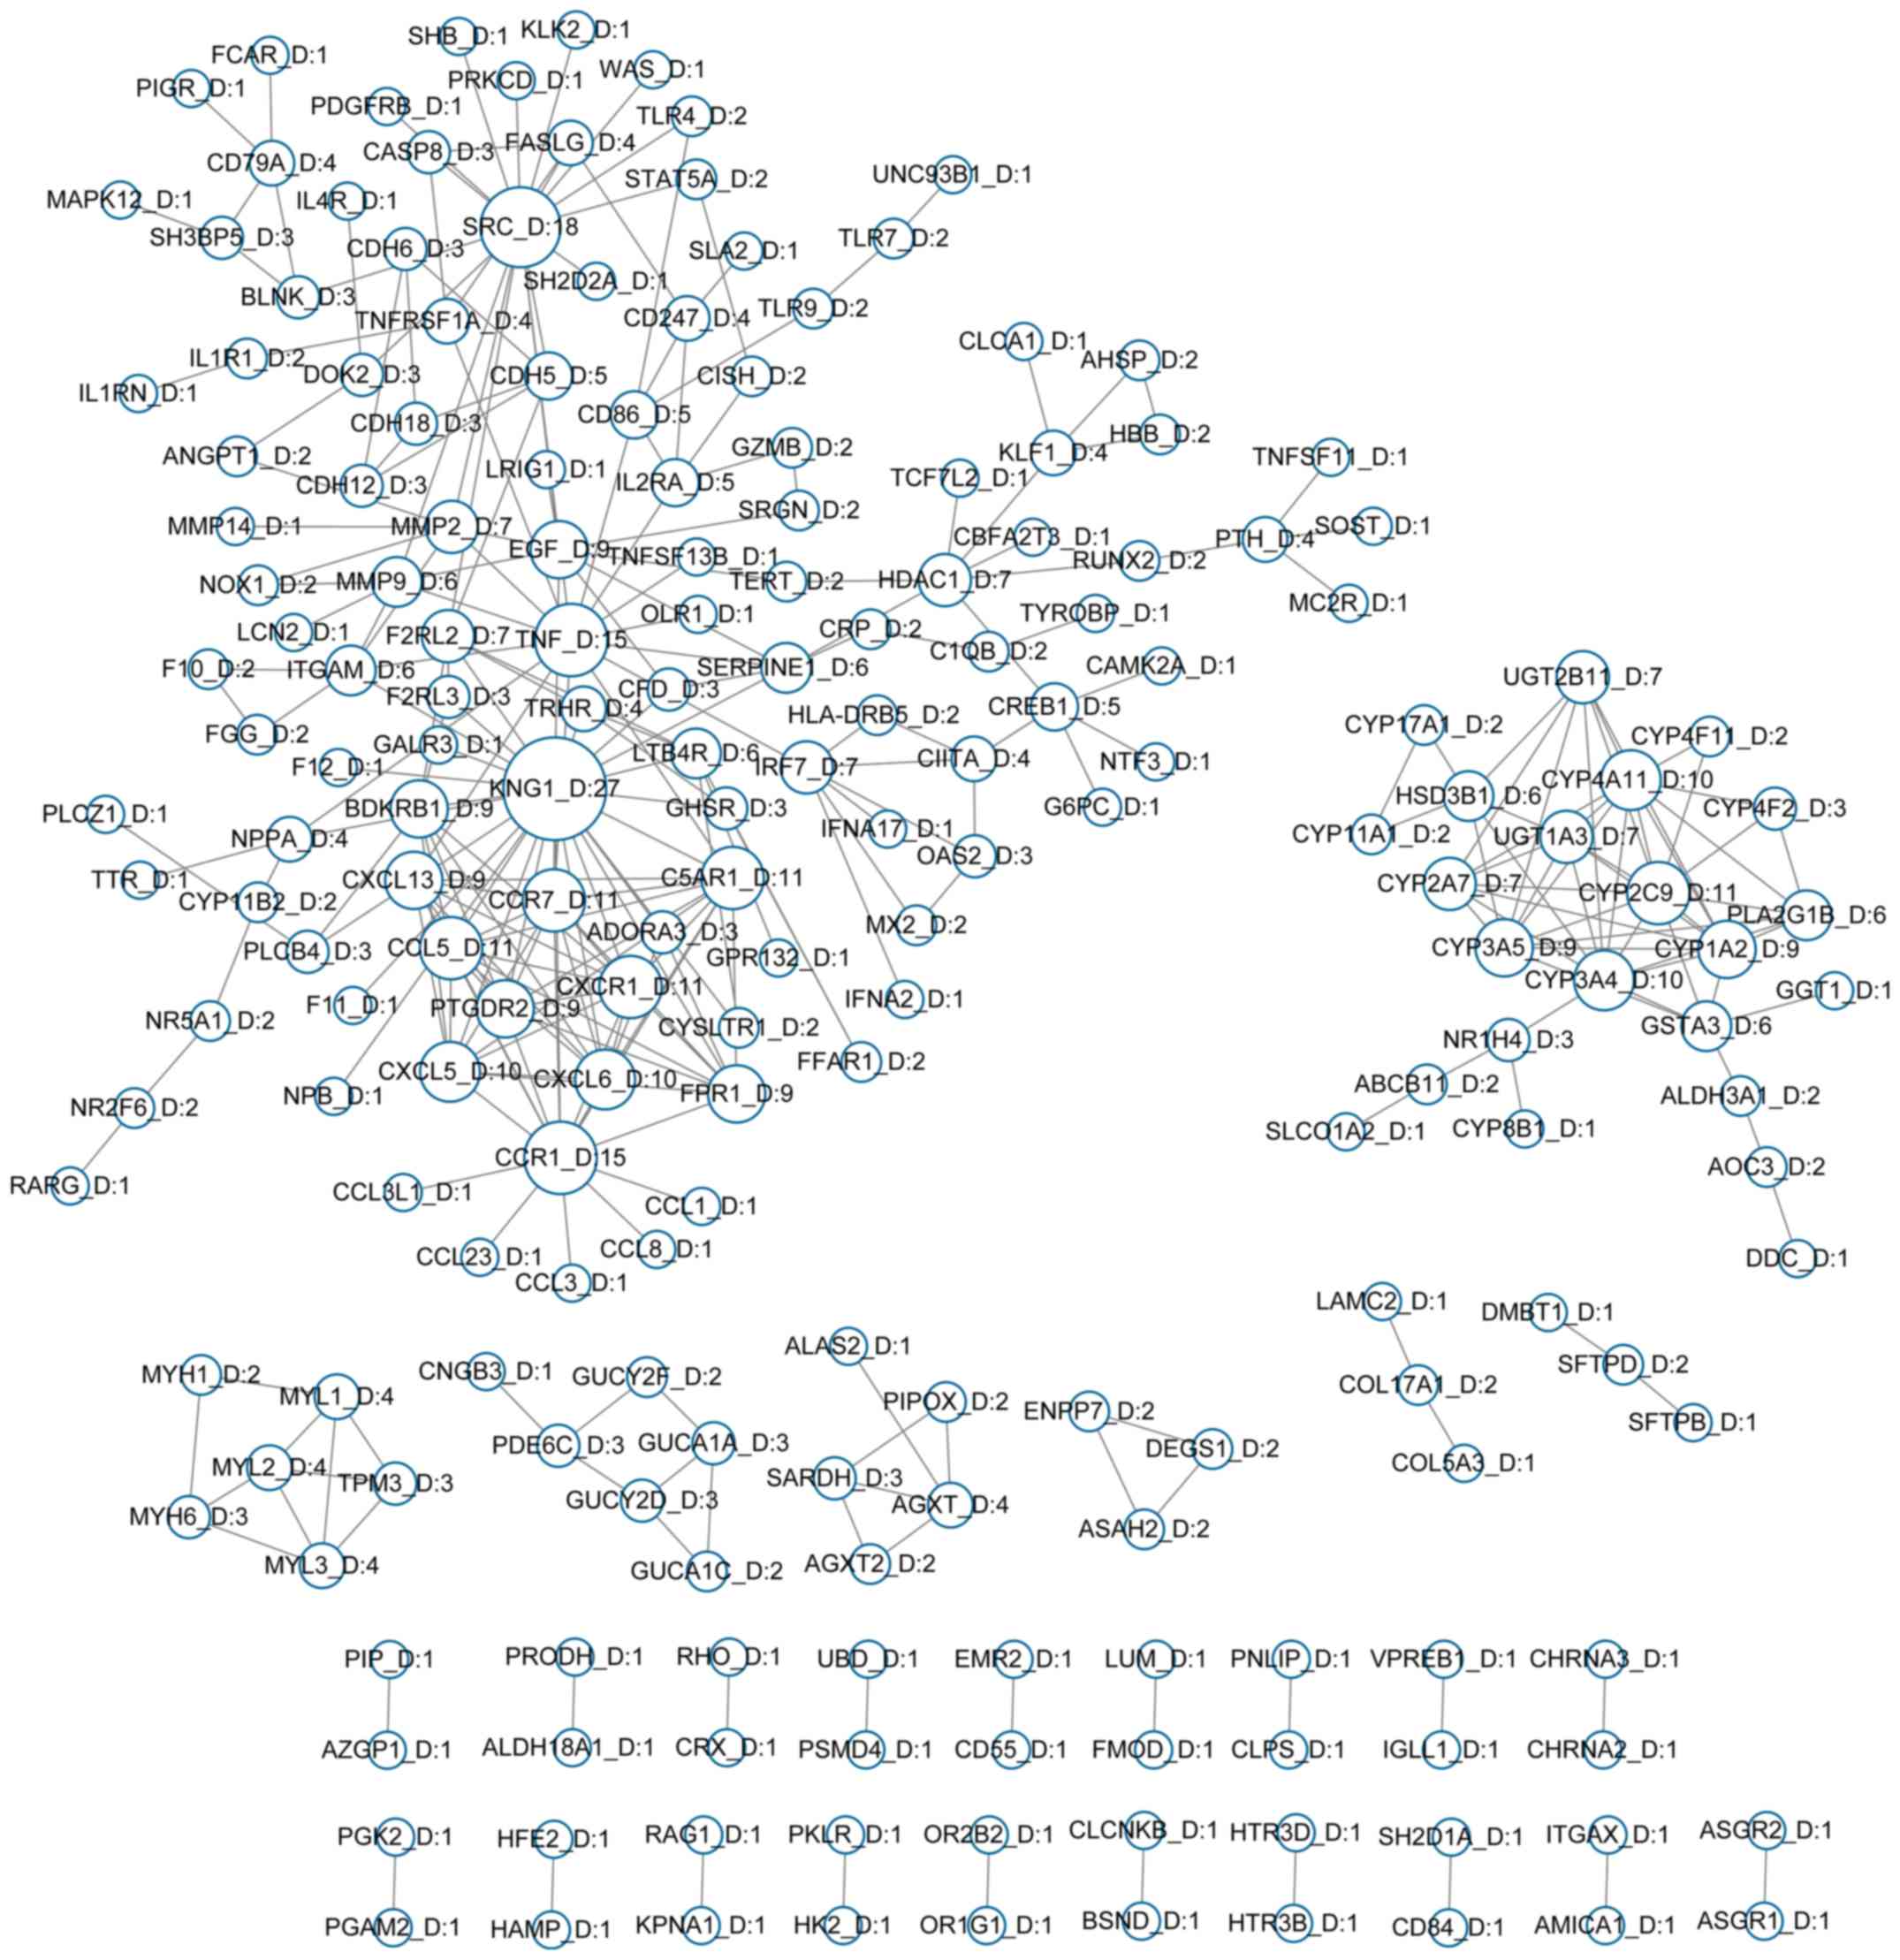
A total of 476 hypermethylated and 850
hypomethylated genes were mapped to the STRING database and
significant interactions with scores >0.9 were selected. A total
of 83 hypermethylated genes and 204 hypomethylated genes were
screened to separately construct PPI networks involving
hypermethylated genes (Fig. 2) and
hypomethylated genes (Fig. 3). The
DMGs adenylate cyclase type 2 (ADCY2; degree, 18),
neuropeptide Y (NPY; degree, 11) and somatostatin
(SST; degree, 11) demonstrated the highest degrees,
determined by the number of interactions in the hypermethylated
gene network. Kininogen 1 (KNG1; degree, 27), proto-oncogene
tyrosine protein kinase (SRC; degree, 18) and tumor necrosis
factor (TNF; degree, 15) exhibited the highest degrees in
the hypomethylated gene network.
Classification of the DMGs
A total of 43 cancer-associated genes were
identified among the hypermethylated genes, including 8 oncogenes
and 25 TSGs, while 41 hypomethylated genes were revealed to be
cancer-associated genes, including 10 oncogenes and 24 TSGs.
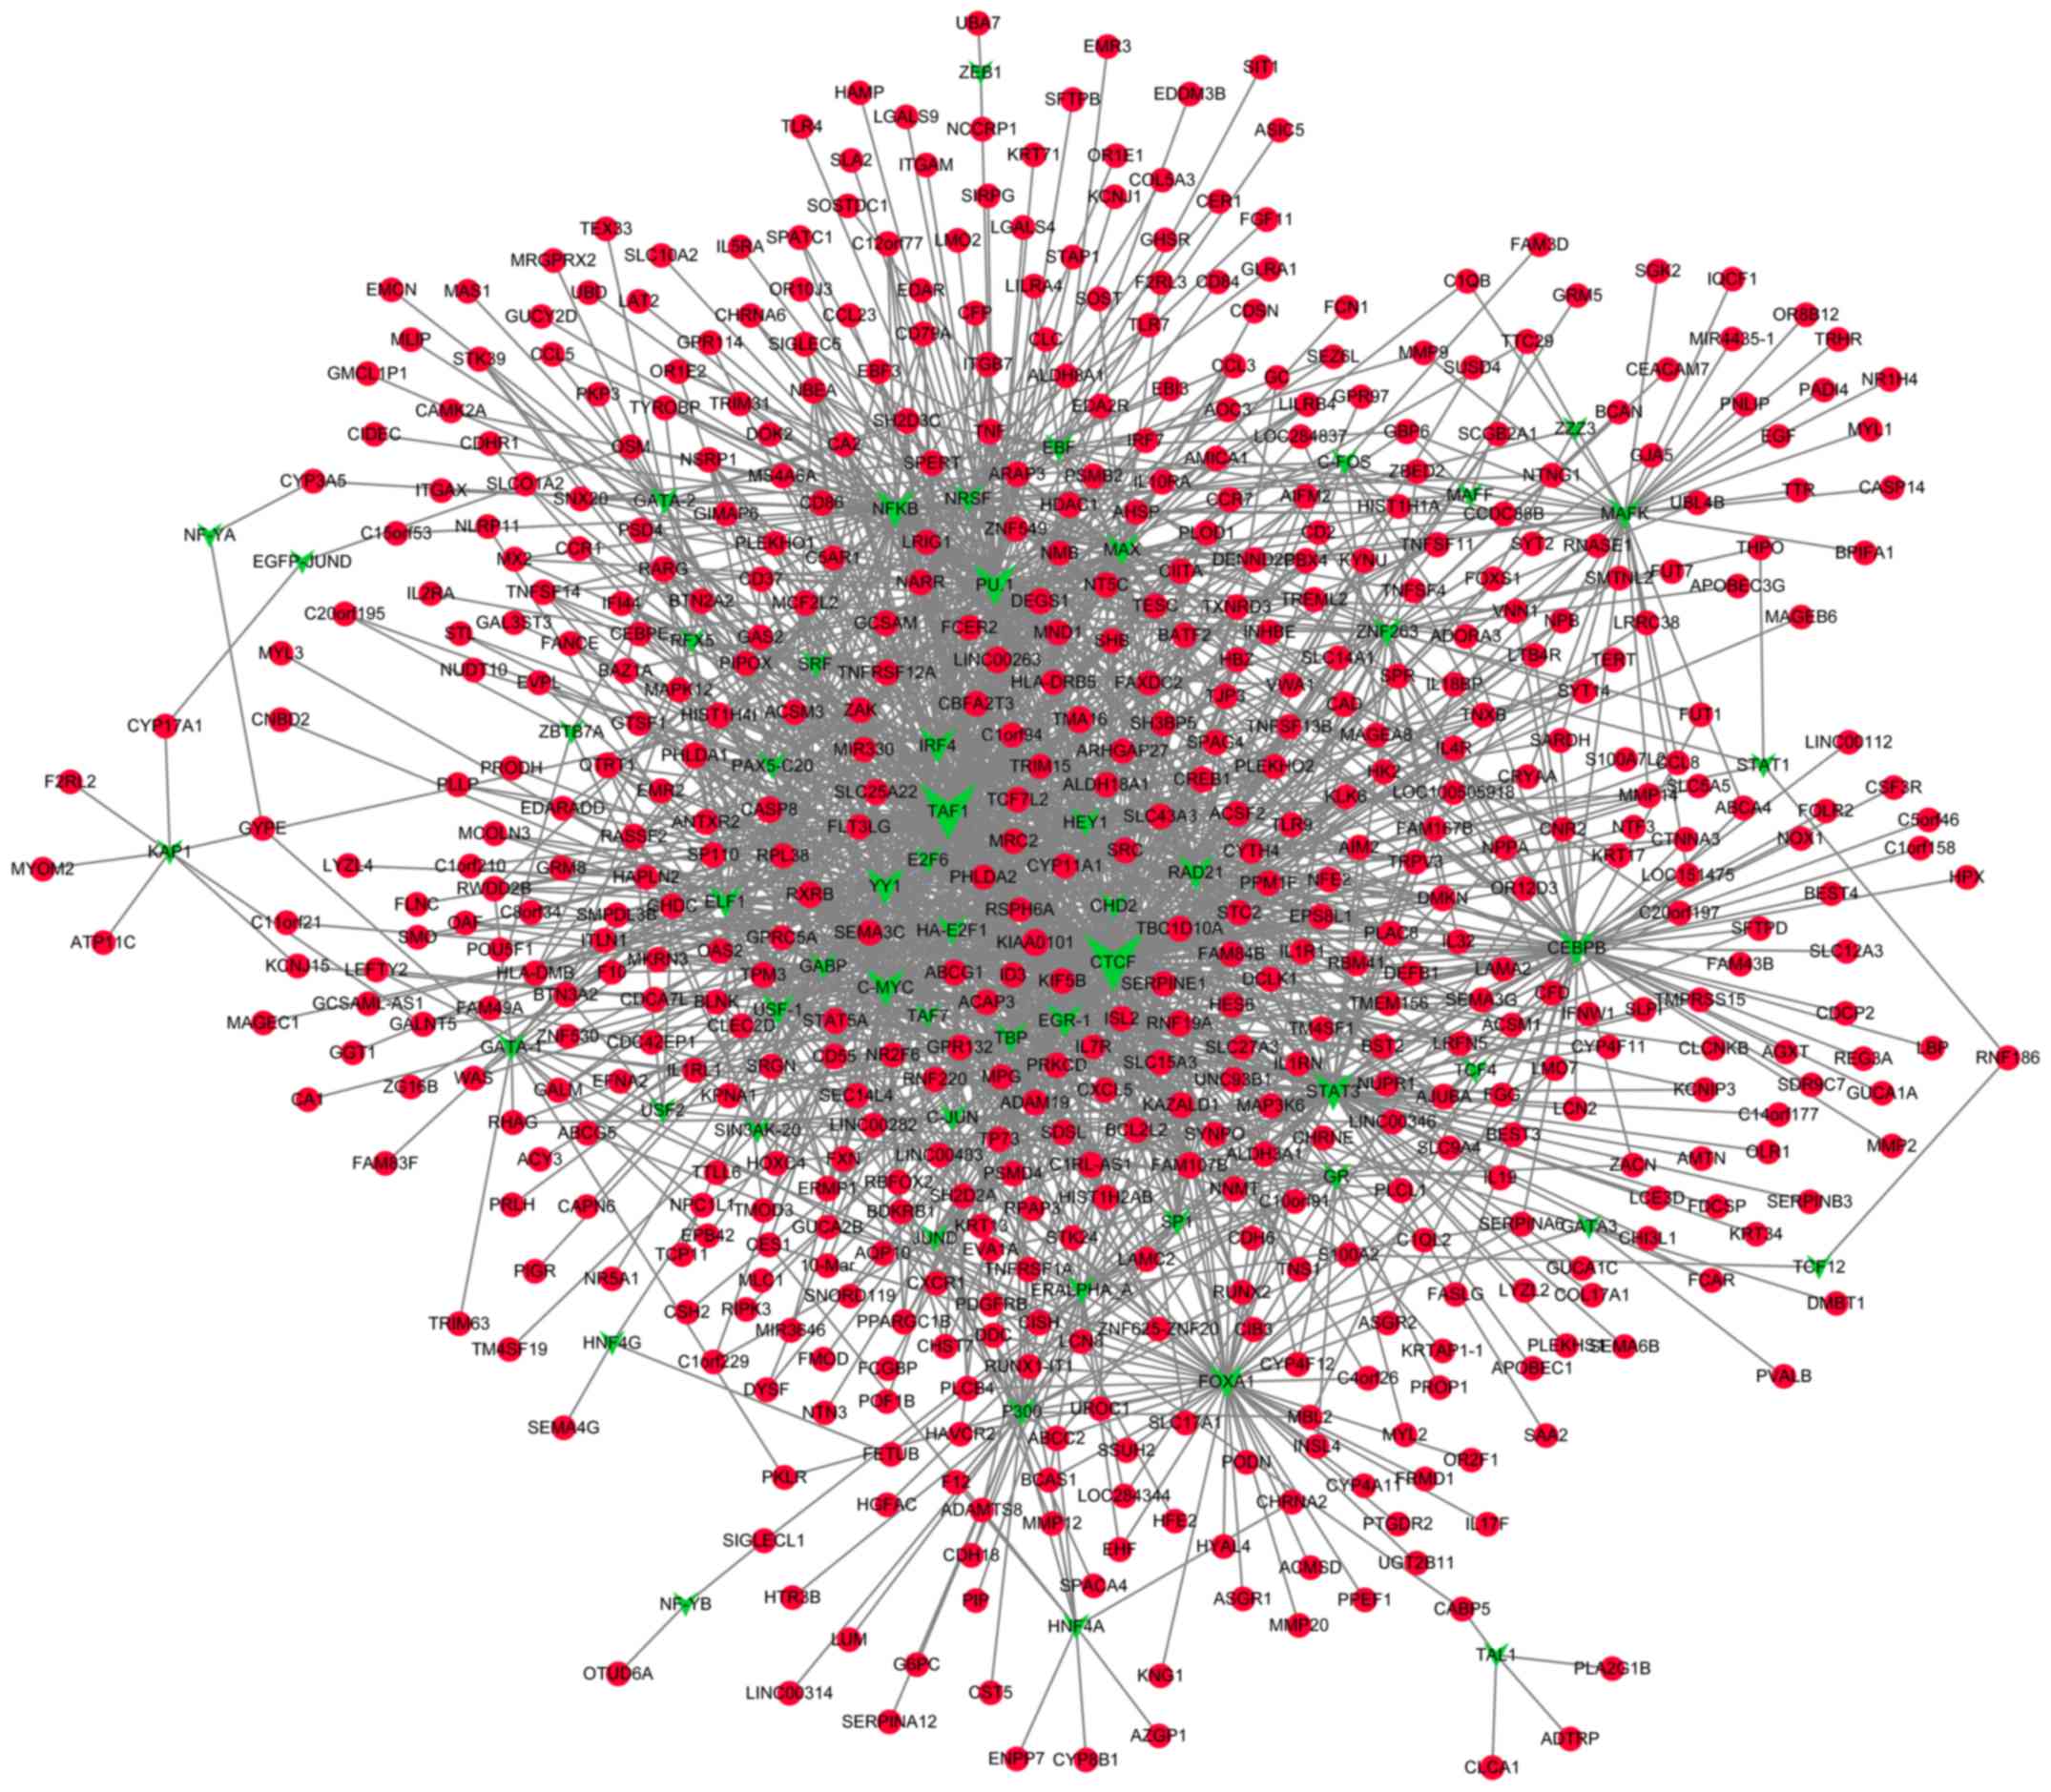
Prediction of TFs that target the DMGs
and construction of transcriptional regulatory networks
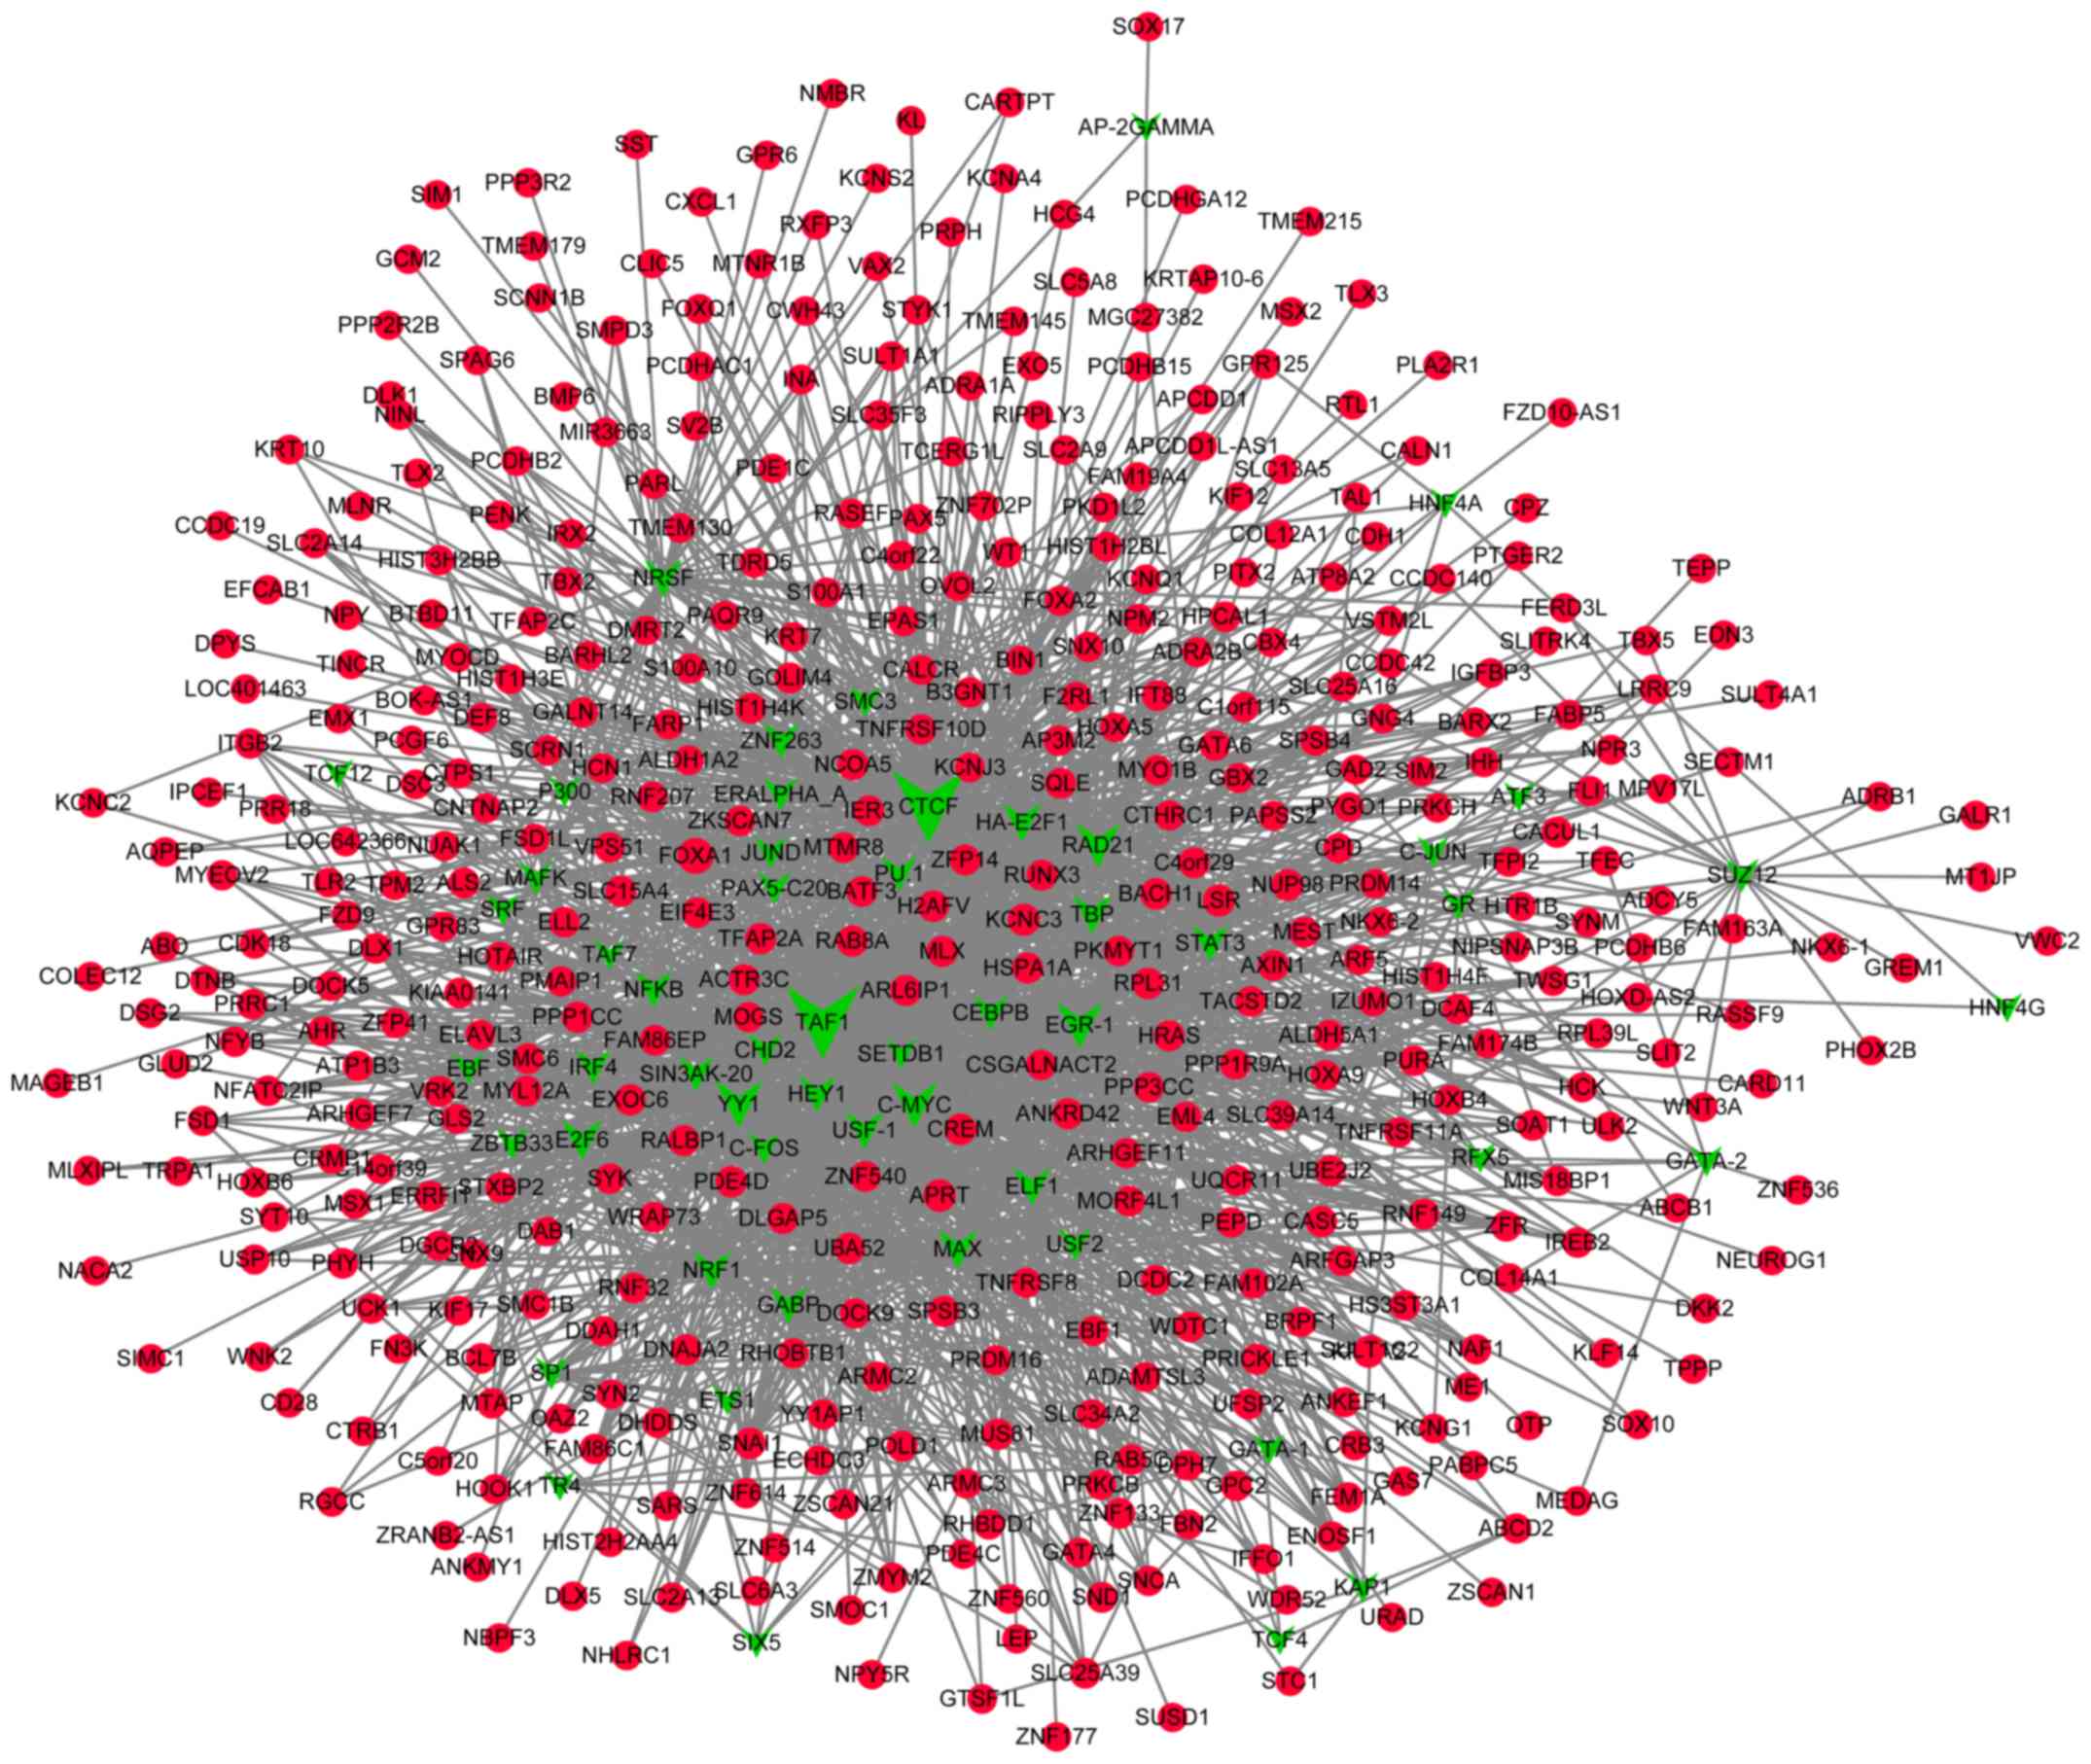
A total of 55 TFs that could regulate the
hypermethylated genes were identified, including polycomb
repressive complex 2 subunit, neuron-restrictive silencer factor
and cohesin complex component. Additionally, 55 TFs that could
regulate the hypomethylated genes were identified, including signal
transducer and activator of transcription 3, and forkhead box
protein A1 (FOXA1). Notably, FOXA1 was also revealed
to be hypermethylated. The transcriptional regulatory networks of
hypermethylated genes and hypomethylated genes are presented in
Figs. 4 and 5, respectively. The top 10 hypermethylated
genes and hypomethylated genes with high node degrees in the
regulatory networks are listed in Table
IV, including the hypermethylated genes, FOXA1 (degree,
35), adenine phosphoribosyltransferase (degree, 17) and potassium
voltage-gated channel subfamily C member 3 (KCNC3; degree,
15), and the hypomethylated genes, proliferating cell nuclear
antigen-associated factor (degree, 14) and caspase-8 (CASP8;
degree, 12).
| Table IV.Top 10 hypermethylated and
hypomethylated genes with high node degree in the transcriptional
regulatory networks. |
Table IV.
Top 10 hypermethylated and
hypomethylated genes with high node degree in the transcriptional
regulatory networks.
| Gene | Node degree |
|---|
|
Hypermethylated |
|
|
FOXA1 | 35 |
|
APRT | 17 |
|
KCNC3 | 15 |
|
LSR | 15 |
|
SNAI1 | 13 |
|
NUP98 | 13 |
|
PDE4D | 12 |
|
RPL31 | 12 |
|
RPL31 | 12 |
|
CREM | 12 |
| Hypomethylated |
|
|
KIAA0101 | 14 |
|
CASP8 | 12 |
|
TMA16 | 12 |
|
FAM107B | 11 |
|
LINC00263 | 11 |
|
RXRB | 11 |
|
PHLDA1 | 10 |
|
DEGS1 | 10 |
|
KAZALD1 | 10 |
|
C1RL-AS1 | 9 |
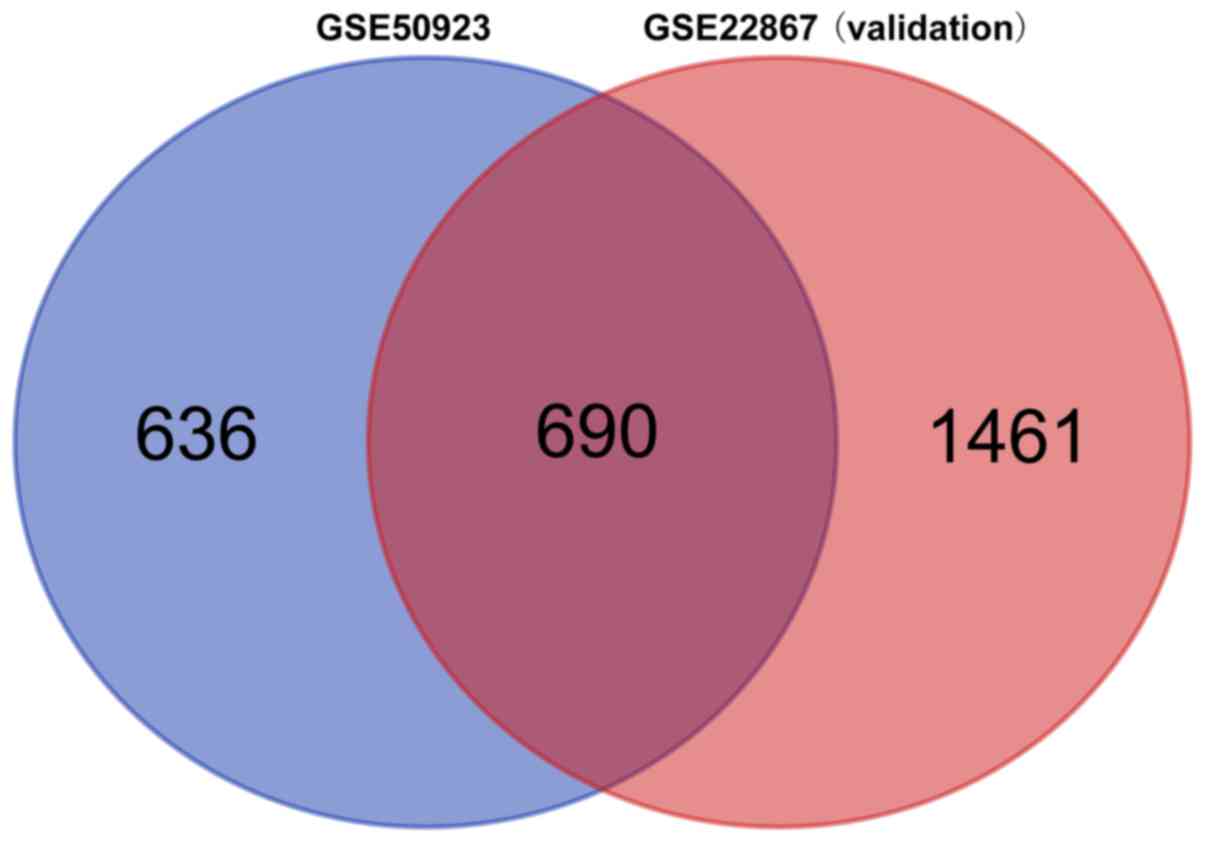
Data validation
From the GSE22867 validation dataset, 2,151 DMGs
were identified. As demonstrated in Fig.
6, a total of 690 overlapping DMGs were revealed. In
particular, the hypermethylated genes NPY, FOXA1 and
KCNC3, as well as the hypomethylated genes TNF and
CASP8, were among the overlapping DMGs.
Discussion
The current study systemically analyzed the DNA
methylation profile of GBM samples to improve our understanding of
GBM at the epigenetic level and identify potential biomarkers as
therapeutic targets for GBM.
Differential analysis revealed that the methylation
levels of 1,326 genes were altered in patients with GBM compared
with those in the controls. The biological functions most
associated with the DMGs were explored by functional enrichment
analysis. The results revealed that DMGs were closely associated
with the functions of ‘GPCR ligand binding’, ‘cytokine activity’,
‘cytokine-cytokine receptor interaction’, and ‘D-glutamine and
D-glutamate metabolism’. Both ‘cytokine activity’ and
‘cytokine-cytokine receptor interaction’ are associated with
inflammatory responses, and there is a close association between
inflammation and cancer. Unresolved inflammation resulting from a
failure in the regulation of the immune response creates a tumor
microenvironment, an important aspect of tumorigenesis
proliferation, survival and migration (31,32).
GPCR ligands bind to GPCRs and activate the downstream signaling
that regulates cellular physiology. Aberrant G-protein signaling is
closely associated with cancer development and progression
(33).
To investigate whether abnormally methylated genes
are associated with GBM, PPI networks of the screened genes were
constructed and the degrees of the nodes were analyzed in the
present study. The results demonstrated that the top three genes
with the highest node degrees were ADCY2, NPY and SST
in the hypermethylated genes network, and KNG1, SRC and
TNF in the hypomethylated genes network. Among these genes,
NPY and TNF were validated in the alternative
dataset. NPY encodes a 36-amino acid neuropeptide that acts
as a neurotransmitter in the brain and autonomic nervous system of
humans. Using bioinformatic analysis, abnormal methylation of
NPY has been observed in numerous types of cancer (34–36).
Furthermore, a previous study reported that NPY is expressed
in various types of intracranial tumor in humans and that
NPY mRNA is detectable in the temporal lobe in higher
quantities compared with that in tumors (37). In addition, the present study
identified that TNF was hypomethylated, which may lead to
upregulation of the gene. The expression of TNF-α has been
identified to be increased in GBM (38), which corresponds with the current
study. Therefore, NPY and TNF may be involved in GBM
due to their abnormal methylation and may result in the disturbance
of biological processes.
The hypermethylated genes FOXA1 and
KCNC3, as well as the hypomethylated gene CASP8,
exhibited high degrees in the transcriptional regulatory networks,
which was also confirmed by the second dataset. FOXA1 acts
as a TF and has been demonstrated to be a potential regulator of
human glioma progression (39).
KCNC3, encoding the Kv3. 3 voltage-gated potassium channel,
is expressed in various neuronal cell types that are involved in
motor function (40). Previous
studies have demonstrated an association between KCNC3
expression and the poor prognosis of patients with GBM (41). Patients with GBM with higher
KCNC3 expression exhibit improved survival times (42). Genomic loss of CASP8 by DNA
methylation may result in tumor resistance to therapies targeting
TNF-related apoptosis-inducing ligand-associated apoptosis pathways
(43). In summary, the methylation
of FOXA1, KCNC3 and CASP8 in GBM should be
investigated in future studies, as this may promote the development
of therapeutic approaches.
In conclusion, the current study comprehensively
analyzed the DNA methylation profile of GBM using bioinformatics
approaches and identified several abnormally methylated genes,
including NPY, TNF, FOXA1, KCNC3 and CASP8. The
findings of the present study improve the understanding of the
molecular mechanism underlying GBM, and provide potential
biomarkers for GBM and the development of novel treatment
strategies. However, the number of samples included in this study
was relatively small. Experimental verification and additional
studies with larger sample sizes are required to confirm the
present results.
Acknowledgements
Not applicable.
Funding
No funding was received.
Availability of data and materials
The datasets generated and/or analyzed during the
current study are available as datasets GSE50923 and GSE22867 from
the GEO database (http://www.ncbi.nlm.nih.gov/projects/geo/).
Authors contributions
SK and SC conceived and designed the study, and
drafted the manuscript. WC acquired, analyzed and interpreted the
data, and conducted the statistical analysis. BY acquired and
interpreted data, and revised the manuscript for important
intellectual content. All authors read and approved the final
manuscript.
Ethics approval and consent to
participate
Not applicable.
Patient consent for publication
Not applicable.
Competing interests
The authors declare that they have no competing
interests.
References
|
1
|
Wen PY and Kesari S: Malignant gliomas in
adults. N Engl J Med. 359:492–507. 2008. View Article : Google Scholar : PubMed/NCBI
|
|
2
|
Rock K, McArdle O, Forde P, Dunne M,
Fitzpatrick D, O'Neill B and Faul C: A clinical review of treatment
outcomes in glioblastoma multiforme - the validation in a non-trial
population of the results of a randomised phase III: Has a more
radical approach improved survival? Br J Radiol. 85:e729–e733.
2012. View Article : Google Scholar : PubMed/NCBI
|
|
3
|
Holland EC: Gliomagenesis: Genetic
alterations and mouse models. Nat Rev Genet. 2:120–129. 2001.
View Article : Google Scholar : PubMed/NCBI
|
|
4
|
Nagarajan RP and Costello JF: Epigenetic
mechanisms in glioblastoma multiforme. Semin Cancer Biol.
19:188–197. 2009. View Article : Google Scholar : PubMed/NCBI
|
|
5
|
Herman JG and Baylin SB: Gene silencing in
cancer in association with promoter hypermethylation. N Engl J Med.
349:2042–2054. 2003. View Article : Google Scholar : PubMed/NCBI
|
|
6
|
Karpf AR and Matsui SI: Genetic disruption
of cytosine DNA methyltransferase enzymes induces chromosomal
instability in human cancer cells. Cancer Res. 65:8635–8639. 2005.
View Article : Google Scholar : PubMed/NCBI
|
|
7
|
Nakamura M, Yonekawa Y, Kleihues P and
Ohgaki H: Promoter hypermethylation of the RB1 gene in
glioblastomas. Lab Invest. 81:77–82. 2001. View Article : Google Scholar : PubMed/NCBI
|
|
8
|
Amatya VJ, Naumann U, Weller M and Ohgaki
H: TP53 promoter methylation in human gliomas. Acta Neuropathol.
110:178–184. 2005. View Article : Google Scholar : PubMed/NCBI
|
|
9
|
Baeza N, Weller M, Yonekawa Y, Kleihues P
and Ohgaki H: PTEN methylation and expression in glioblastomas.
Acta Neuropathol. 106:479–485. 2003. View Article : Google Scholar : PubMed/NCBI
|
|
10
|
Kreth S, Thon N, Eigenbrod S, Lutz J,
Ledderose C, Egensperger R, Tonn JC, Kretzschmar HA, Hinske LC and
Kreth FW: O-methylguanine-DNA methyltransferase (MGMT) mRNA
expression predicts outcome in malignant glioma independent of MGMT
promoter methylation. PLoS One. 6:e171562011. View Article : Google Scholar : PubMed/NCBI
|
|
11
|
Lalezari S, Chou AP, Tran A, Solis OE,
Khanlou N, Chen W, Li S, Carrillo JA, Chowdhury R, Selfridge J, et
al: Combined analysis of O6-methylguanine-DNA methyltransferase
protein expression and promoter methylation provides optimized
prognostication of glioblastoma outcome. Neuro Oncol. 15:370–381.
2013. View Article : Google Scholar : PubMed/NCBI
|
|
12
|
Garcia-Manero G: Demethylating agents in
myeloid malignancies. Curr Opin Oncol. 20:705–710. 2008. View Article : Google Scholar : PubMed/NCBI
|
|
13
|
Li D, Xie Z, Pape ML and Dye T: An
evaluation of statistical methods for DNA methylation microarray
data analysis. BMC Bioinformatics. 16:2172015. View Article : Google Scholar : PubMed/NCBI
|
|
14
|
Xu C, Zhang JG, Lin D, Zhang L, Shen H and
Deng HW: A systemic analysis of transcriptomic and epigenomic data
to reveal regulation patterns for complex disease. G3 (Bethesda).
7:2271–2279. 2017. View Article : Google Scholar : PubMed/NCBI
|
|
15
|
Smith AA, Huang YT, Eliot M, Houseman EA,
Marsit CJ, Wiencke JK and Kelsey KT: A novel approach to the
discovery of survival biomarkers in glioblastoma using a joint
analysis of DNA methylation and gene expression. Epigenetics.
9:873–883. 2014. View Article : Google Scholar : PubMed/NCBI
|
|
16
|
Gadaleta F, Bessonov K and Van Steen K:
Integration of gene expression and methylation to unravel
biological networks in glioblastoma patients. Genet Epidemiol.
41:136–144. 2017. View Article : Google Scholar : PubMed/NCBI
|
|
17
|
Lai RK, Chen Y, Guan X, Nousome D, Sharma
C, Canoll P, Bruce J, Sloan AE, Cortes E, Vonsattel JP, et al:
Genome-wide methylation analyses in glioblastoma multiforme. PLoS
One. 9:e893762014. View Article : Google Scholar : PubMed/NCBI
|
|
18
|
Du P, Kibbe WA and Lin SM: Lumi: A
pipeline for processing Illumina microarray. Bioinformatics.
24:1547–1548. 2008. View Article : Google Scholar : PubMed/NCBI
|
|
19
|
Du P, Zhang X, Huang CC, Jafari N, Kibbe
WA, Hou L and Lin SM: Comparison of Beta-value and M-value methods
for quantifying methylation levels by microarray analysis. BMC
Bioinformatics. 11:5872010. View Article : Google Scholar : PubMed/NCBI
|
|
20
|
Du P and Bourgon R: methyAnalysis: An R
package for DNA methylation data analysis and visualization.
2013.
|
|
21
|
Harris MA, Clark J, Ireland A, Lomax J,
Ashburner M, Foulger R, Eilbeck K, Lewis S, Marshall B, Mungall C,
et al: The gene ontology (GO) database and informatics resource.
Nucleic Acids Res. 32:D258–D261. 2004. View Article : Google Scholar : PubMed/NCBI
|
|
22
|
Kanehisa M and Goto S: KEGG: Kyoto
encyclopedia of genes and genomes. Nucleic Acids Res. 28:27–30.
2000. View Article : Google Scholar : PubMed/NCBI
|
|
23
|
Joshi-Tope G, Gillespie M, Vastrik I,
D'Eustachio P, Schmidt E, de Bono B, Jassal B, Gopinath GR, Wu GR,
Matthews L, et al: Reactome: A knowledgebase of biological
pathways. Nucleic Acids Res. 33:D428–D432. 2005. View Article : Google Scholar : PubMed/NCBI
|
|
24
|
Shannon P, Markiel A, Ozier O, Baliga NS,
Wang JT, Ramage D, Amin N, Schwikowski B and Ideker T: Cytoscape: A
software environment for integrated models of biomolecular
interaction networks. Genome Res. 13:2498–2504. 2003. View Article : Google Scholar : PubMed/NCBI
|
|
25
|
Zhao M, Sun J and Zhao Z: TSGene: A web
resource for tumor suppressor genes. Nucleic Acids Res.
41:D970–D976. 2013. View Article : Google Scholar : PubMed/NCBI
|
|
26
|
Chen JS, Hung WS, Chan HH, Tsai SJ and Sun
HS: In silico identification of oncogenic potential of fyn-related
kinase in hepatocellular carcinoma. Bioinformatics. 29:420–427.
2013. View Article : Google Scholar : PubMed/NCBI
|
|
27
|
ENCODE Project Consortium: The ENCODE
(ENCyclopedia of DNA elements) project. Science. 306:636–640. 2004.
View Article : Google Scholar : PubMed/NCBI
|
|
28
|
Landt SG, Marinov GK, Kundaje A,
Kheradpour P, Pauli F, Batzoglou S, Bernstein BE, Bickel P, Brown
JB, Cayting P, et al: ChIP-seq guidelines and practices of the
ENCODE and modENCODE consortia. Genome Res. 22:1813–1831. 2012.
View Article : Google Scholar : PubMed/NCBI
|
|
29
|
Etcheverry A, Aubry M, de Tayrac M,
Vauleon E, Boniface R, Guenot F, Saikali S, Hamlat A, Riffaud L,
Menei P, et al: DNA methylation in glioblastoma: Impact on gene
expression and clinical outcome. BMC Genomics. 11:7012010.
View Article : Google Scholar : PubMed/NCBI
|
|
30
|
Gentleman R, Carey V, Huber W and Hahne F:
Genefilter: Methods for filtering genes from microarray
experiments. R Package version 1.66.0. 2011.
|
|
31
|
Eiró N and Vizoso FJ: Inflammation and
cancer. World J Gastrointest Surg. 4:62–72. 2012. View Article : Google Scholar : PubMed/NCBI
|
|
32
|
Coussens LM and Werb Z: Inflammation and
cancer. Nature. 420:860–867. 2002. View Article : Google Scholar : PubMed/NCBI
|
|
33
|
Spiegelberg BD and Hamm HE: Roles of
G-protein-coupled receptor signaling in cancer biology and gene
transcription. Curr Opin Genet Dev. 17:40–44. 2007. View Article : Google Scholar : PubMed/NCBI
|
|
34
|
Anglim PP, Alonzo TA and Laird-Offringa
IA: DNA methylation-based biomarkers for early detection of
non-small cell lung cancer: An update. Mol Cancer. 7:812008.
View Article : Google Scholar : PubMed/NCBI
|
|
35
|
Hill VK, Ricketts C, Bieche I, Vacher S,
Gentle D, Lewis C, Maher ER and Latif F: Genome-wide DNA
methylation profiling of CpG islands in breast cancer identifies
novel genes associated with tumorigenicity. Cancer Res.
71:2988–2999. 2011. View Article : Google Scholar : PubMed/NCBI
|
|
36
|
Shin SH, Kim BH, Jang JJ, Suh KS and Kang
GH: Identification of novel methylation markers in hepatocellular
carcinoma using a methylation array. J Korean Med Sci.
25:1152–1159. 2010. View Article : Google Scholar : PubMed/NCBI
|
|
37
|
Knerr I, Schuster S, Nomikos P, Buchfelder
M, Dötsch J, Schoof E, Fahlbusch R and Rascher W: Gene expression
of adrenomedullin, leptin, their receptors and neuropeptide Y in
hormone-secreting and non-functioning pituitary adenomas,
meningiomas and malignant intracranial tumours in humans.
Neuropathol Appl Neurobiol. 27:215–222. 2001. View Article : Google Scholar : PubMed/NCBI
|
|
38
|
Kore RA and Abraham EC: Inflammatory
cytokines, interleukin-1 beta and tumor necrosis factor-alpha,
upregulated in glioblastoma multiforme, raise the levels of CRYAB
in exosomes secreted by U373 glioma cells. Biochem Biophys Res
Commun. 453:326–331. 2014. View Article : Google Scholar : PubMed/NCBI
|
|
39
|
Wang L, Qin H, Li L, Feng F, Ji P, Zhang
J, Li G, Zhao Z and Gao G: Forkhead-box A1 transcription factor is
a novel adverse prognosis marker in human glioma. J Clin Neurosci.
20:654–658. 2013. View Article : Google Scholar : PubMed/NCBI
|
|
40
|
Hurlock EC, McMahon A and Joho RH:
Purkinje-cell-restricted restoration of Kv3.3 function restores
complex spikes and rescues motor coordination in Kcnc3 mutants. J
Neurosci. 28:4640–4648. 2008. View Article : Google Scholar : PubMed/NCBI
|
|
41
|
Martinez R, Stuhmer W, Martin S, Schell J,
Reichmann A, Rohde V and Pardo L: Analysis of the expression of
Kv10.1 potassium channel in patients with brain metastases and
glioblastoma multiforme: Impact on survival. BMC Cancer.
15:8392015. View Article : Google Scholar : PubMed/NCBI
|
|
42
|
Arvind S, Arivazhagan A, Santosh V and
Chandramouli BA: Differential expression of a novel voltage gated
potassium channel-Kv 1.5 in astrocytomas and its impact on
prognosis in glioblastoma. Br J Neurosurg. 26:16–20. 2012.
View Article : Google Scholar : PubMed/NCBI
|
|
43
|
Qi L, Bellail AC, Rossi MR, Zhang Z, Pang
H, Hunter S, Cohen C, Moreno CS, Olson JJ, Li S and Hao C:
Heterogeneity of primary glioblastoma cells in the expression of
caspase-8 and the response to TRAIL-induced apoptosis. Apoptosis.
16:1150–1164. 2011. View Article : Google Scholar : PubMed/NCBI
|