Introduction
Transcription factors (TFs), which switch genes on
or off, control transcriptional processes (1). By binding to specific genetic
sequences, TFs control the molecular hierarchy from DNA to mRNA
(2). Alterations in TFs can modify
the functions of molecular regulatory networks at multiple levels
and hence alter various cell behaviors, such as tumorigenesis and
tumor progression (3). For example,
the mutation of TF-associated genes can induce dysfunction of TFs
and thereby impact the fate of cells (4).
The Cancer Genome Atlas (TCGA; http://portal.gdc.cancer.gov/) has profoundly
illuminated the landscape of the molecular networks at different
levels and across many cancer types. These analyses, based on
high-throughput molecular profiling, provide unparalleled novel
insights into cancer (5–7). However, efforts in rewiring the
transcriptional regulatory networks are still limited. In
particular, it remains unclear how TFs systematically control
cancer cells.
Previous fragmentary evidence revealed that
dysfunction of TFs cause tumorigenesis and tumor progression
(4). For example, signal transducers
and activators of transcriptions can activate oncogenic tyrosine
kinases and inhibit the functions of oncosuppressors (8). Hence, TFs can serve as therapeutic
targets and prognostic molecules in patients with cancer (4). Renal cell carcinoma is the most common
type of renal malignancies, accounting for large numbers of new
cases and deaths in the United States (9). However, the potential of applying TFs
as biomarker panels in renal cell carcinoma has not been
extensively studied.
The immune system of a patient partly determines
their survival through cancer. The cellular immune system,
particularly CD8 T cells, plays a key role in fighting against
cancer. A strong immune system is associated with a better
prognosis (10). Immune checkpoint
inhibitors, a form of cancer immunotherapy, exert antitumor
activity by blocking immune checkpoints [such as cytotoxic
T-lymphocyte-associated antigen-4 (CTLA-4), programmed cell death-1
(PD-1) and programmed cell death-1 (PD-L1)] and reactivating the
immune system (11). Immune
checkpoint inhibitors are promising anticancer agents for late
stage renal cell carcinoma (11).
There is a clear need for predicting the response of
individuals with renal cell carcinoma to immune checkpoint
inhibitors. Despite the essential roles of TFs in tumorigenesis,
limited efforts have been made to generate prognostic TF panels.
Thus, the discovery of potential TF biomarkers is required. Hence,
it was compelling to investigate the TF molecular profiles and
construct an optimized prognostic model for predicting the survival
of patients with renal cell carcinoma.
The present study is the first to demonstrate that
prognostic TF panels can robustly predict the survival of patients
with cancer, with optimum performance. These findings support the
future exploration of TF biomarkers for their potential as
prognostic predictors.
Materials and methods
Data availability
The clinical and RNA sequencing (RNA-seq) data of
patients with renal cell carcinoma were downloaded from TCGA
(https://cancergenome.nih.gov) and Xena
(https://xenabrowser.net/). The differential
expression analysis between tumors and normal tissues was not
conducted, according to a recent study that reported that cancer
vs. normal differential expression analysis did not reveal any
prognostic relevance in the context of pan-cancer, and did not
identify prognostic genes (12).
Data from a total of 537 patients (female, n=245; male, n=292;
median age, 61; age range, 26–90) with renal cell carcinoma
(Project ID, TCGA-KIRC) were included in the analysis. Ethics
approval was not required as data was obtained from an open-access
database. The transcription factor regulatory impact was analyzed
using RABIT software (version 3; http://rabit.dfci.harvard.edu/download/), the data
from which can be downloaded from UCSC Xena (https://xenabrowser.net/datapages/).
Survival analysis and construction of
risk score
Multivariate and univariate Cox models, which are
widely accepted in the scientific community, were used (13). The cut-off was set at P=0.05. The
risk score model formula was constructed based on the Cox
coefficient weight: Risk score=Cox coefficient1 × TF
score1 + Cox coefficient2 × TF
score2 + … + Cox coefficientn × TF
scoren. A receiver operating characteristics (ROC) curve
and the area under the curve (AUC) were generated using R software
(version 3.5.2; http://www.r-project.org/). The target genes of the
TFs were retrieved from Cistrome Cancer (http://cistrome.org/CistromeCancer/).
Gene set enrichment analysis
(GSEA)
The enrichment analysis was conducted using mSigDB
(http://software.broadinstitute.org/gsea/msigdb/index.jsp)
(14). The plots were generated
using R software. The Canonical pathway gene sets, Kyoto
Encyclopedia of Genes and Genomes (KEGG; http://www.kegg.jp) gene sets and Gene Ontology (GO;
http://geneontology.org) gene sets (http://software.broadinstitute.org/gsea/msigdb/genesets.jsp)
were used in the present study.
Immune state computation
A precise immunogenomic pipeline was used to
characterize the immune states in low- and high-risk groups of
patients with renal cell carcinoma (15). The construction of multi-omic gene
signatures, based on mRNAs, microRNAs, DNA methylation and copy
number, are detailed in a previous study (15). The stromal fraction was computed
based on another peer-reviewed publication (16). The cut-off value for high- or
low-risk group was based on the median value of the TF score
(regulatory impact of each TF calculated by the RABIT tool).
Overall survival was used for analysis. Correlation analysis was
performed using R software with Spearman's rank test.
Statistical analysis
Comparisons of the transcription factor signatures
were performed using unpaired Wilcoxon rank sum test. One-way ANOVA
followed by Tukey's post hoc test was used for comparisons between
multiple groups. Correlation analysis between PD-L1 expression and
risk score was performed using Spearman's correlation test. Cox
regression analysis with a cut-off P-value of 0.05 was used for
survival analysis screening. P<0.05 was considered to indicate a
statistically significant difference.
Results
Screening TFs
TFs are proven to play key roles in tumorigenesis
and tumor progression (17).
Clinical and RNA-seq data from TCGA were used in the present study
to explore the clinical relevance of TFs in patients with renal
cell carcinoma. The regulatory impact of each TF on tumor-specific
gene expression patterns was computed using the RABIT tool, now a
widely used platform (18). RABIT
screened for TFs that impact the gene expression in renal cell
carcinoma and selected the most relevant ChIP-seq profile. RABIT
further optimized the model, excluding any insignificant TFs. The
expression matrix of 90 TFs was calculated and scores of their
regulatory impact were obtained.
Cox model confirms the robust
signature of TFs
Multivariate and univariate Cox models are currently
widely accepted and applied in a number of studies (13). Evidence suggests that Cox models are
reliable for identifying prognostic biomarkers in clinical practice
(13,19). Hence, the prognostic potential of the
90 TFs was calculated, based on the univariate Cox model analysis.
The cut-off was set at P=0.05. As a result, eight TF biomarker
candidates were identified, including T-cell acute lymphocytic
leukemia protein 1, transcription initiation factor TFIID subunit
7, estrogen related receptor α (ESRRA), MYC, regulatory factor X5
(RFX5), Myb-related protein B, sterol regulatory element binding
transcription factor 1 and forkhead box A2. Seven of the eight TFs
showed different expression patterns between the low- and high-risk
groups (Fig. 1).
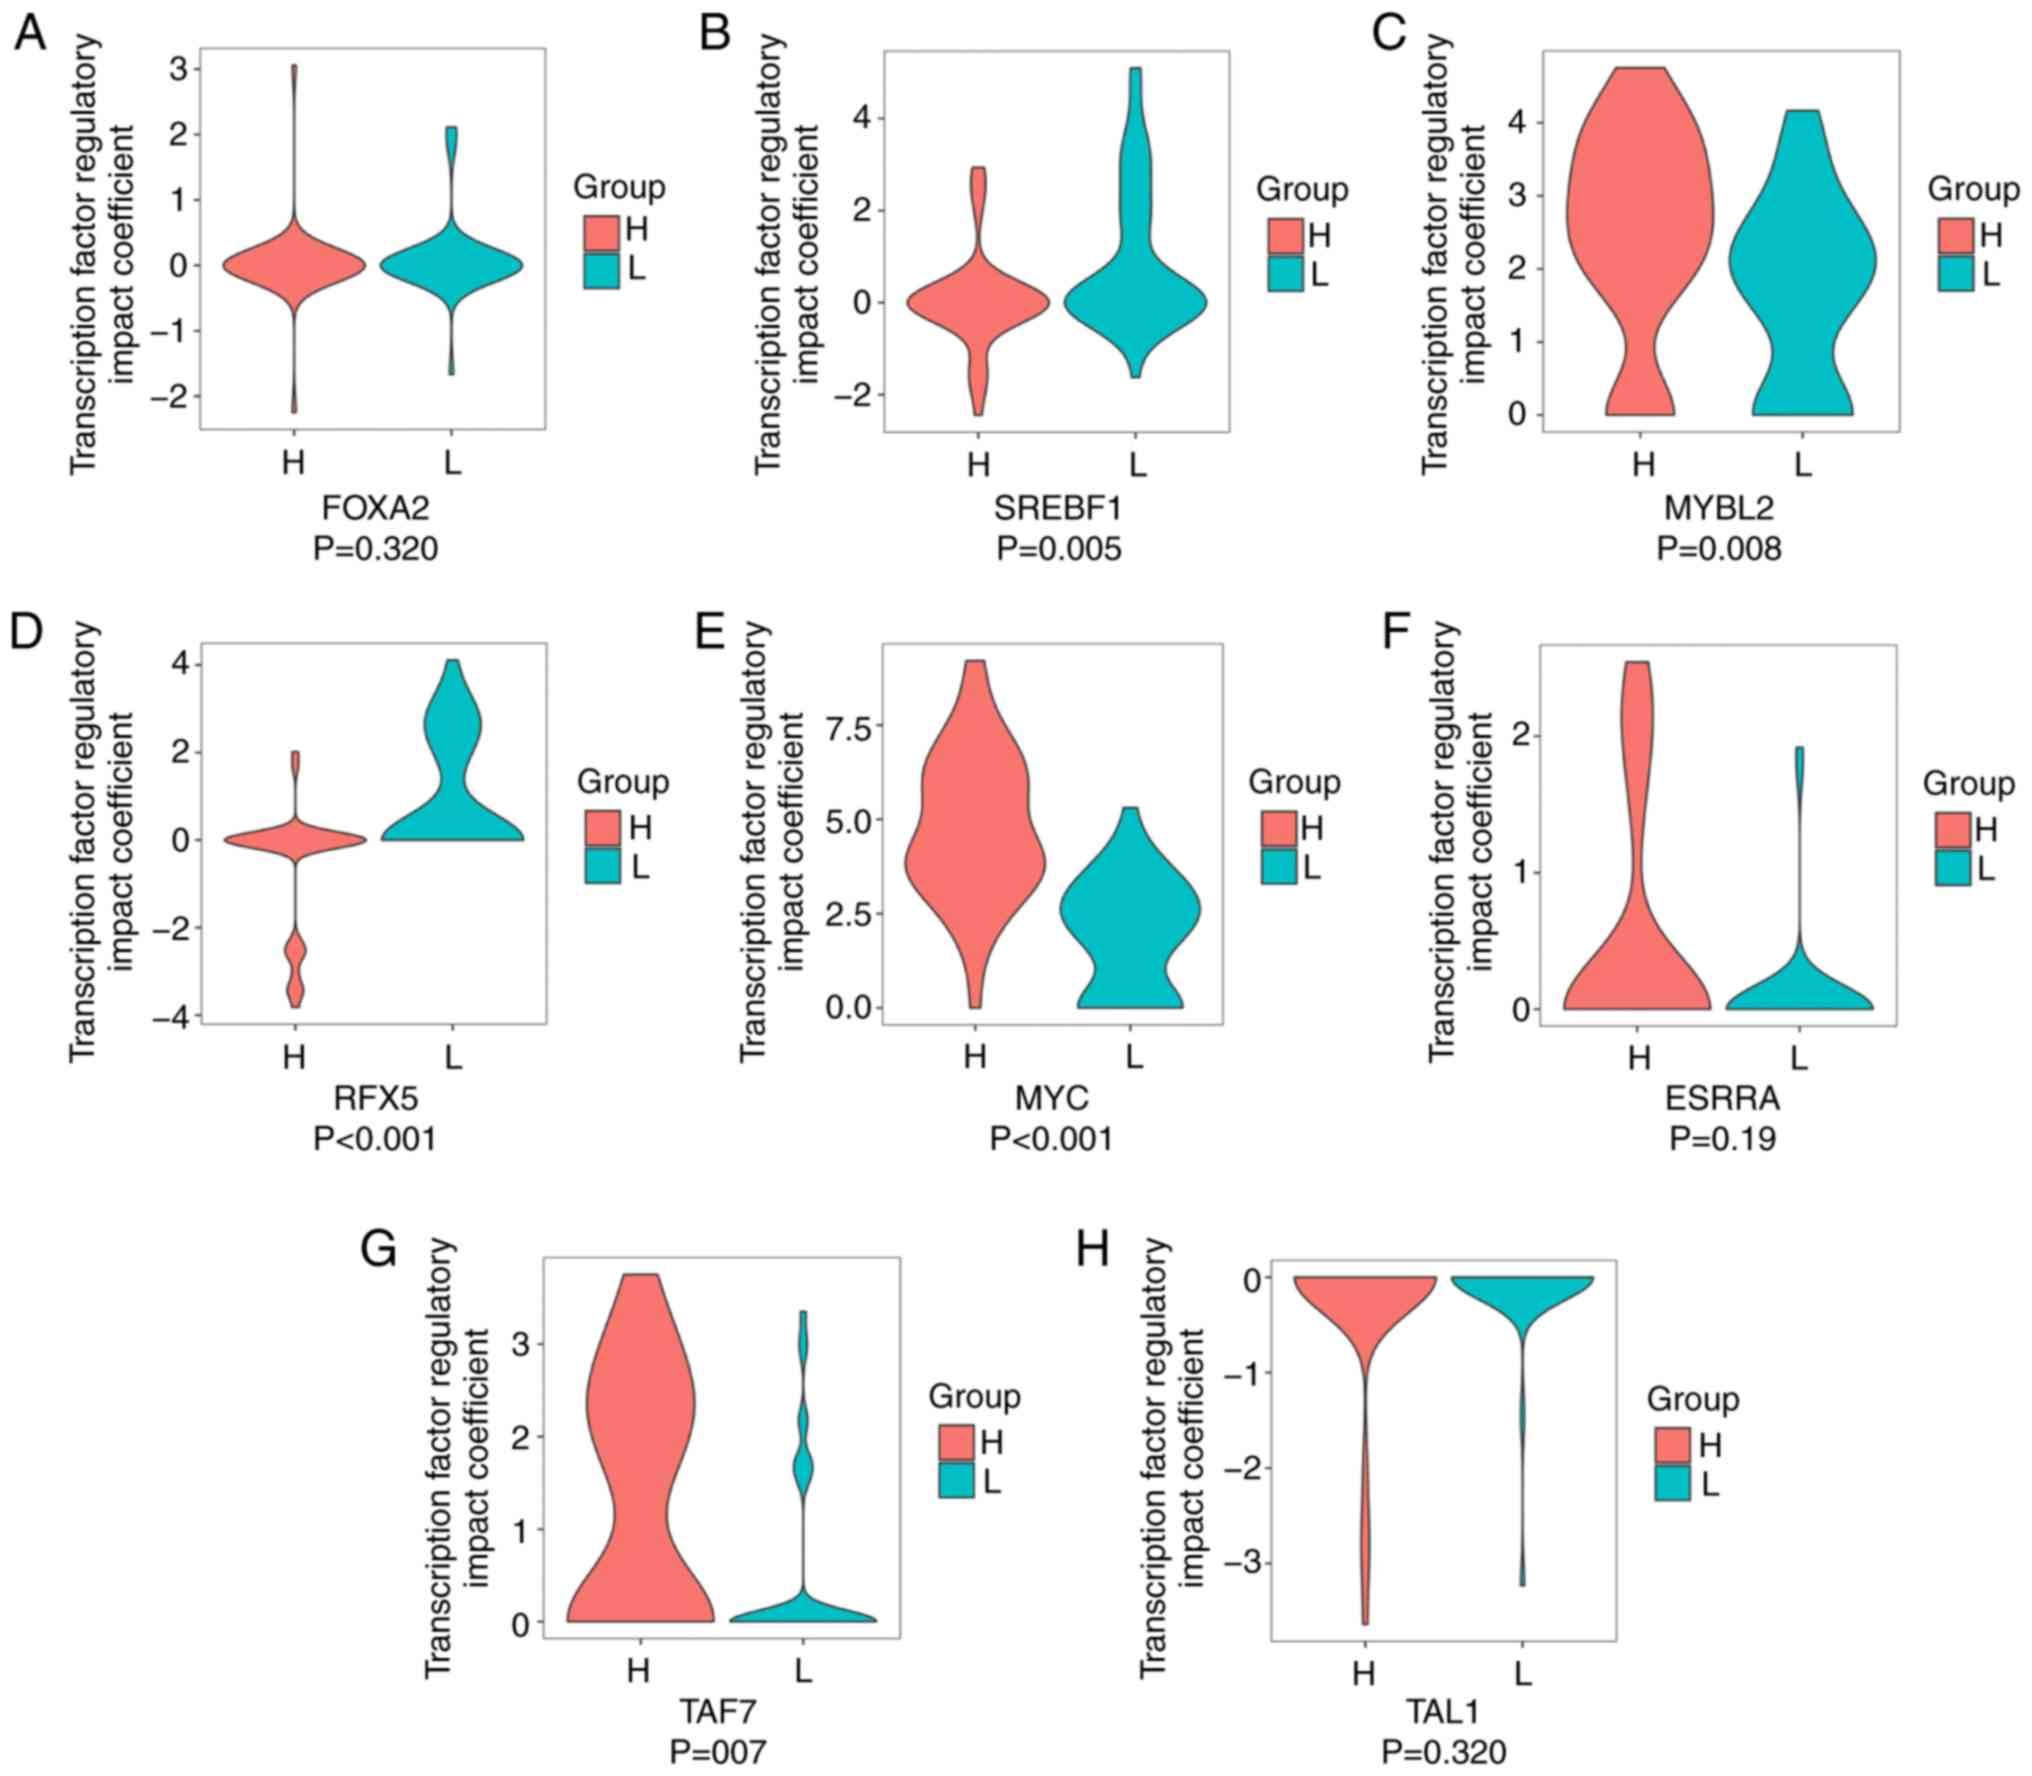 | Figure 1.Clinical relevance of the eight
candidate TF biomarkers in high- and low-risk groups. Profiles of
TF regulatory impact coefficients of (A) FOXA2, (B) SREBF1, (C)
MYBL2, (D) RFX5, (E) MYC, (F) ESRRA, (G) TAF7 and (H) TAL1 in L and
H groups. P-values were computed through un-paired Wilcoxon rank
sum test. TF, transcription factor; L, low-risk; H, high-risk;
FOXA2, forkhead box A2; SREBF1, sterol regulatory element binding
transcription factor 1; MYBL2, Myb-related protein B; RFX5,
regulatory factor X5; ESRRA, estrogen related receptor α; TAF7,
transcription initiation factor TFIID subunit 7; T-cell acute
lymphocytic leukemia protein 1. |
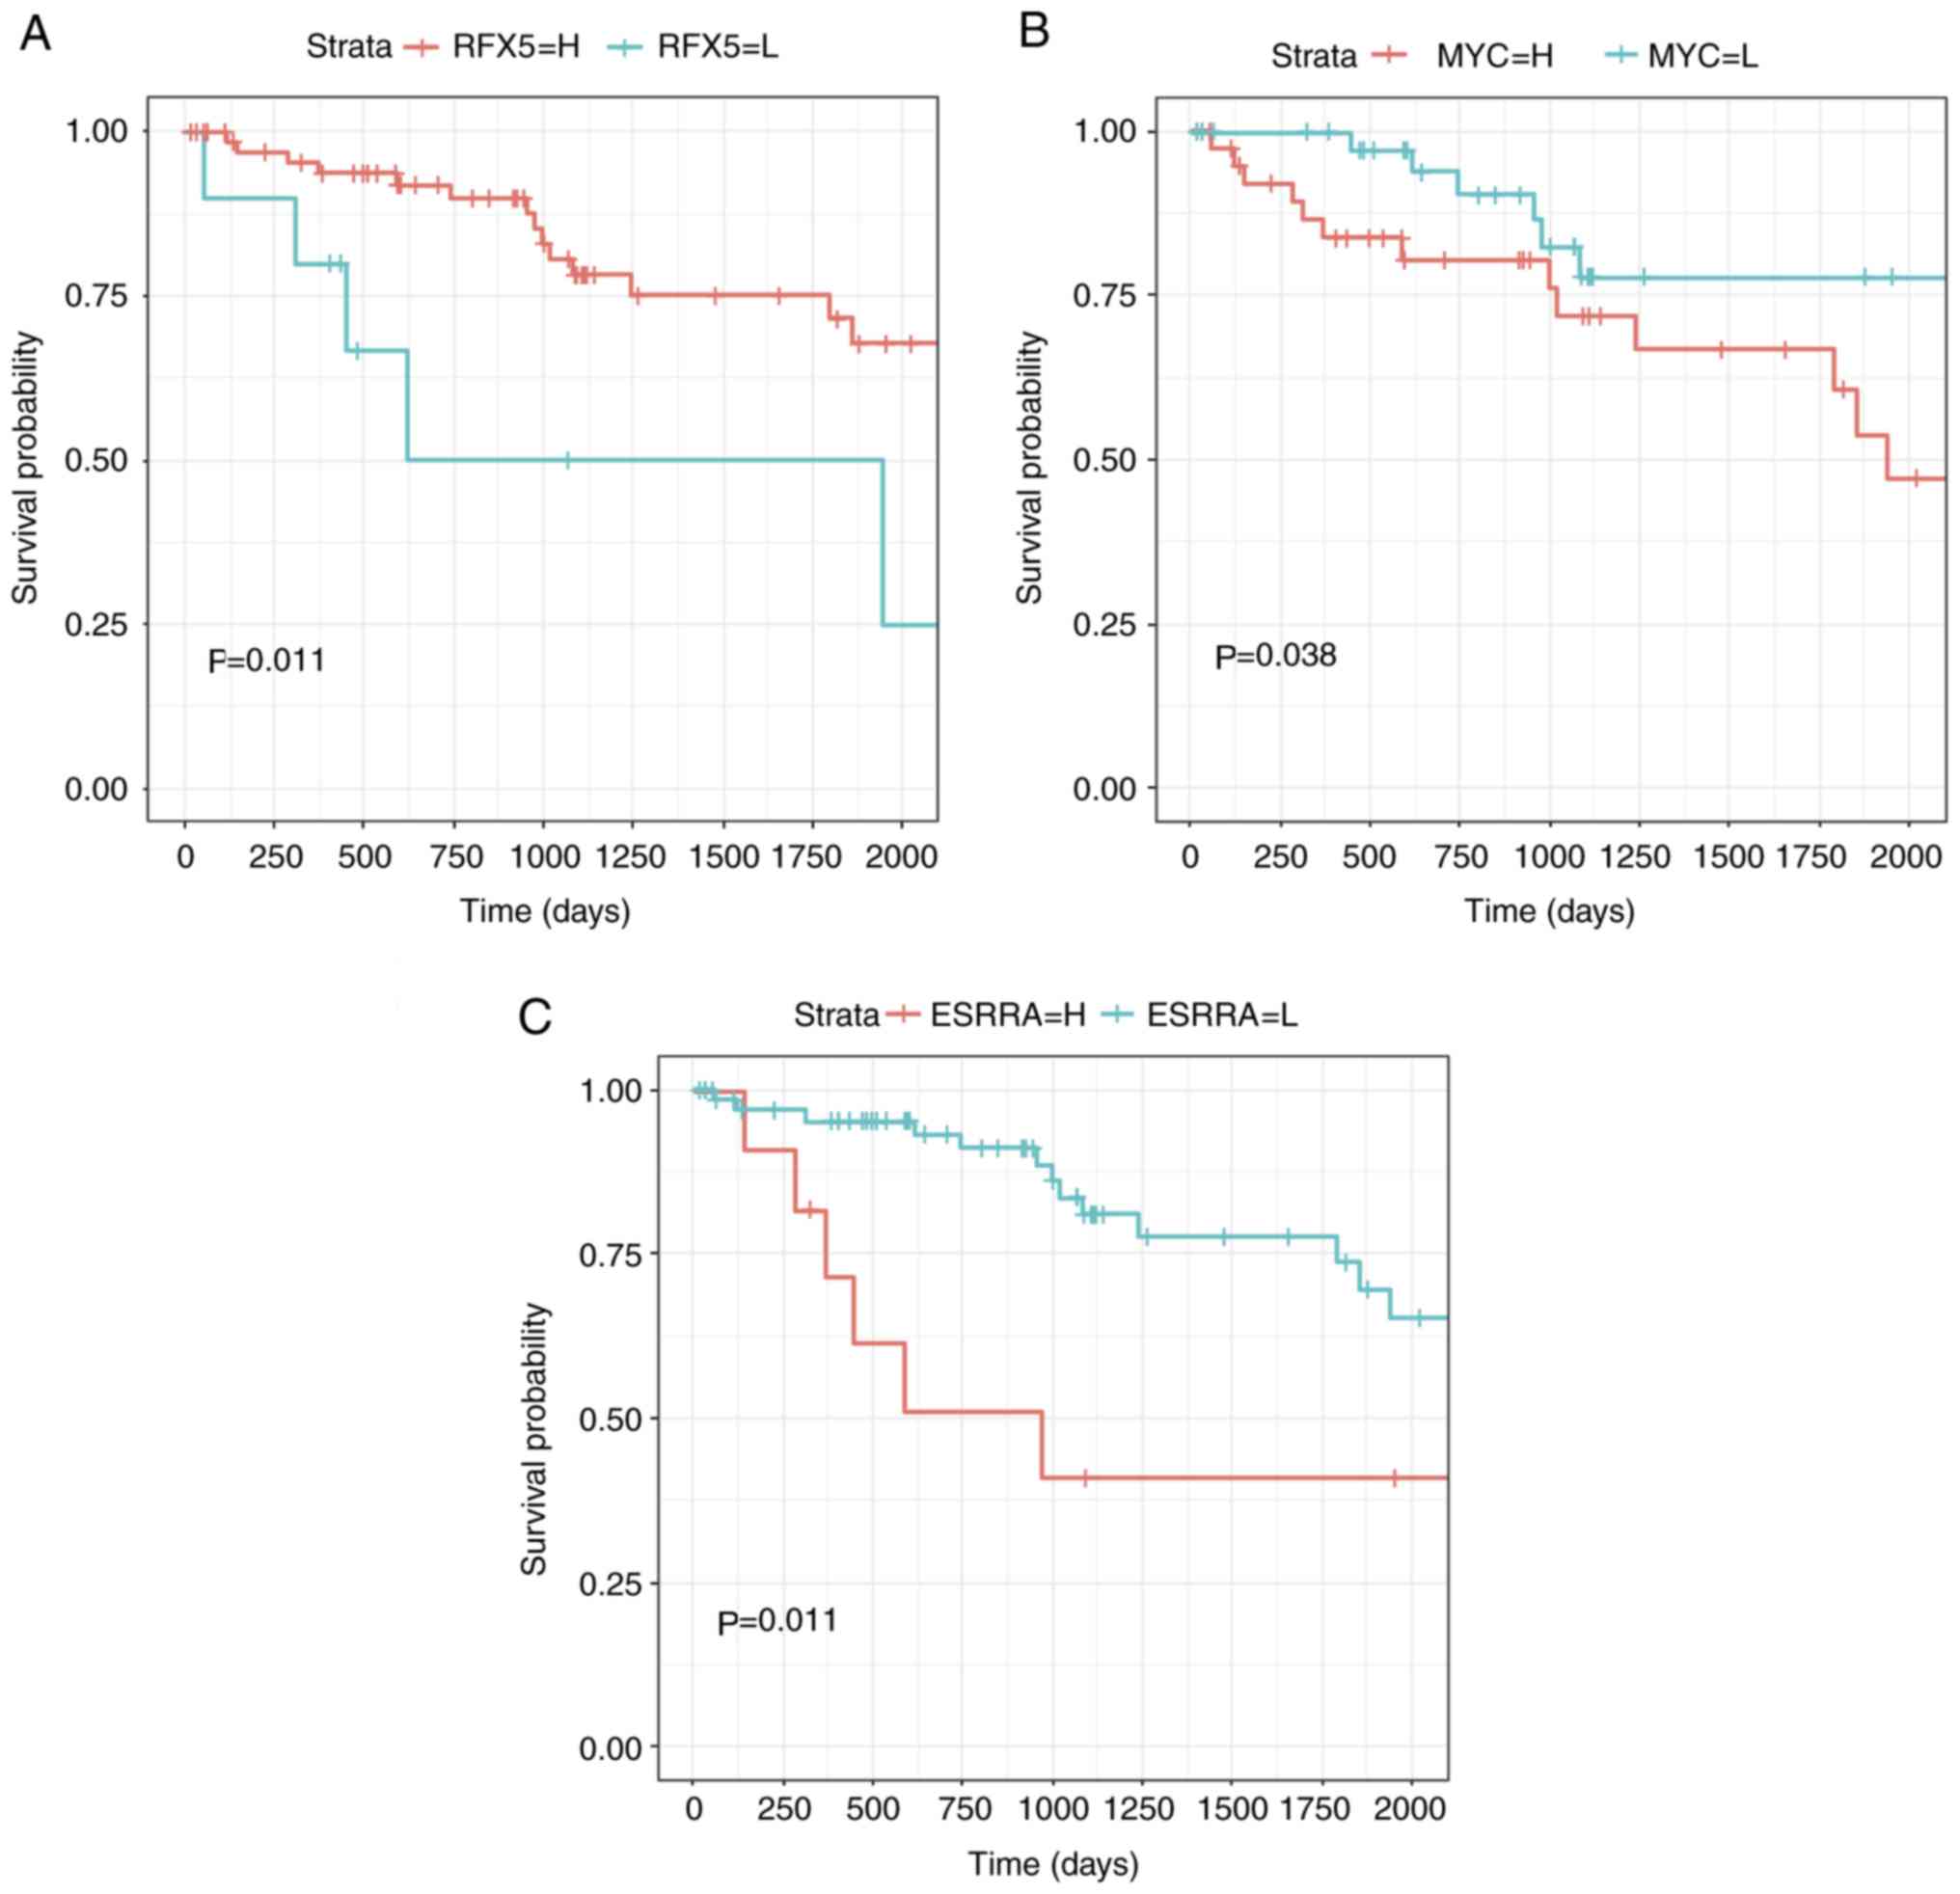
In order to validate the robustness of the
prognostic predictors, their significance as prognostic predictors
was determined using the multivariate Cox model and log-rank test.
The cut-off value was set at P=0.05, and three TFs (MYC, ESRRA and
RFX5) with significant associations with survival were identified
(Fig. 2). These three TFs may
therefore serve as independent prognosis biomarkers for patients
with renal clear cell carcinoma.
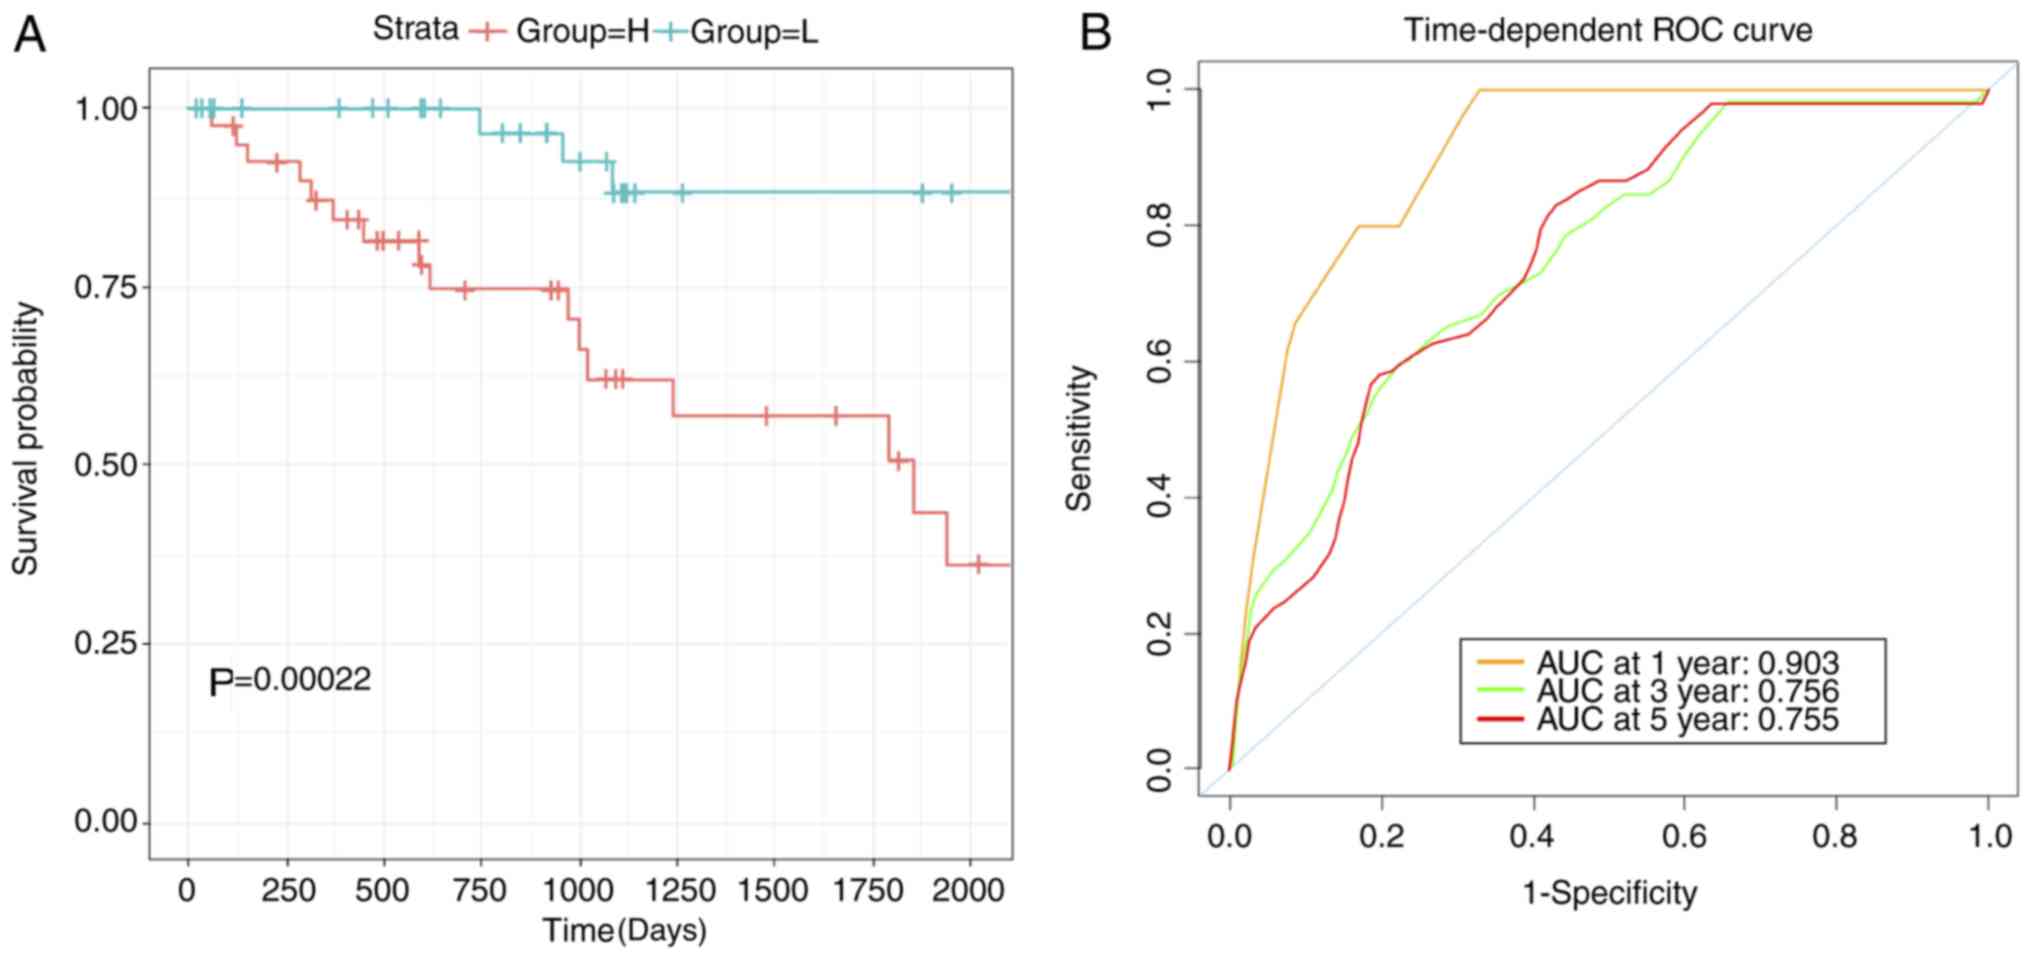
The robustness of the three biomarkers as prognostic
predictors was tested. The log-rank test was used to demonstrate
the differences in the survival between low- and high-risk groups
(P<0.001; Fig. 3A). In order to
train the model for optimized robustness, the coefficient weight of
each TFs were calculated based on cox regression coefficient. As a
result, the MYC-ESRRA-RFX5 signature was constructed (score=0.75395
× ESRRA+0.24426 × MYC-0.43121 × RFX5). The robustness of the
prognostic predictions of this signature was determined using a ROC
curve, which generated an AUC value of 0.903 when the overall
survival time reached 1 year (Fig.
3B).
Identification of target genes and
evaluation of the biological functions of the TF biomarkers
In order to assess the biological significance of
this TF signature, gene/pathway enrichment analysis was conducted,
to identify and analyze target genes. A similar approach has been
applied in investigating the biological roles of miRNAs, which can
regulate their target genes (20,21).
Thus, a screen for the target genes of the three TFs in the
signature was performed. With a focus on renal clear cell
carcinoma, the expression of target genes associated with the TFs
was analyzed based on an online resource, known as Cistrome Cancer
(22). The cut-off for the
Spearman's rank correlation test was set at coefficient 0.3 and was
applied to determine genes that are positively and negatively
correlated with the three TFs. Unexpectedly, no target genes of
ESRRA met the established criteria. A few genes with negative
correlation were identified, which were excluded from the
gene/pathway enrichment analysis due to insufficient data. All
genes, excluding ESRRA, were used to conduct the GSEA.
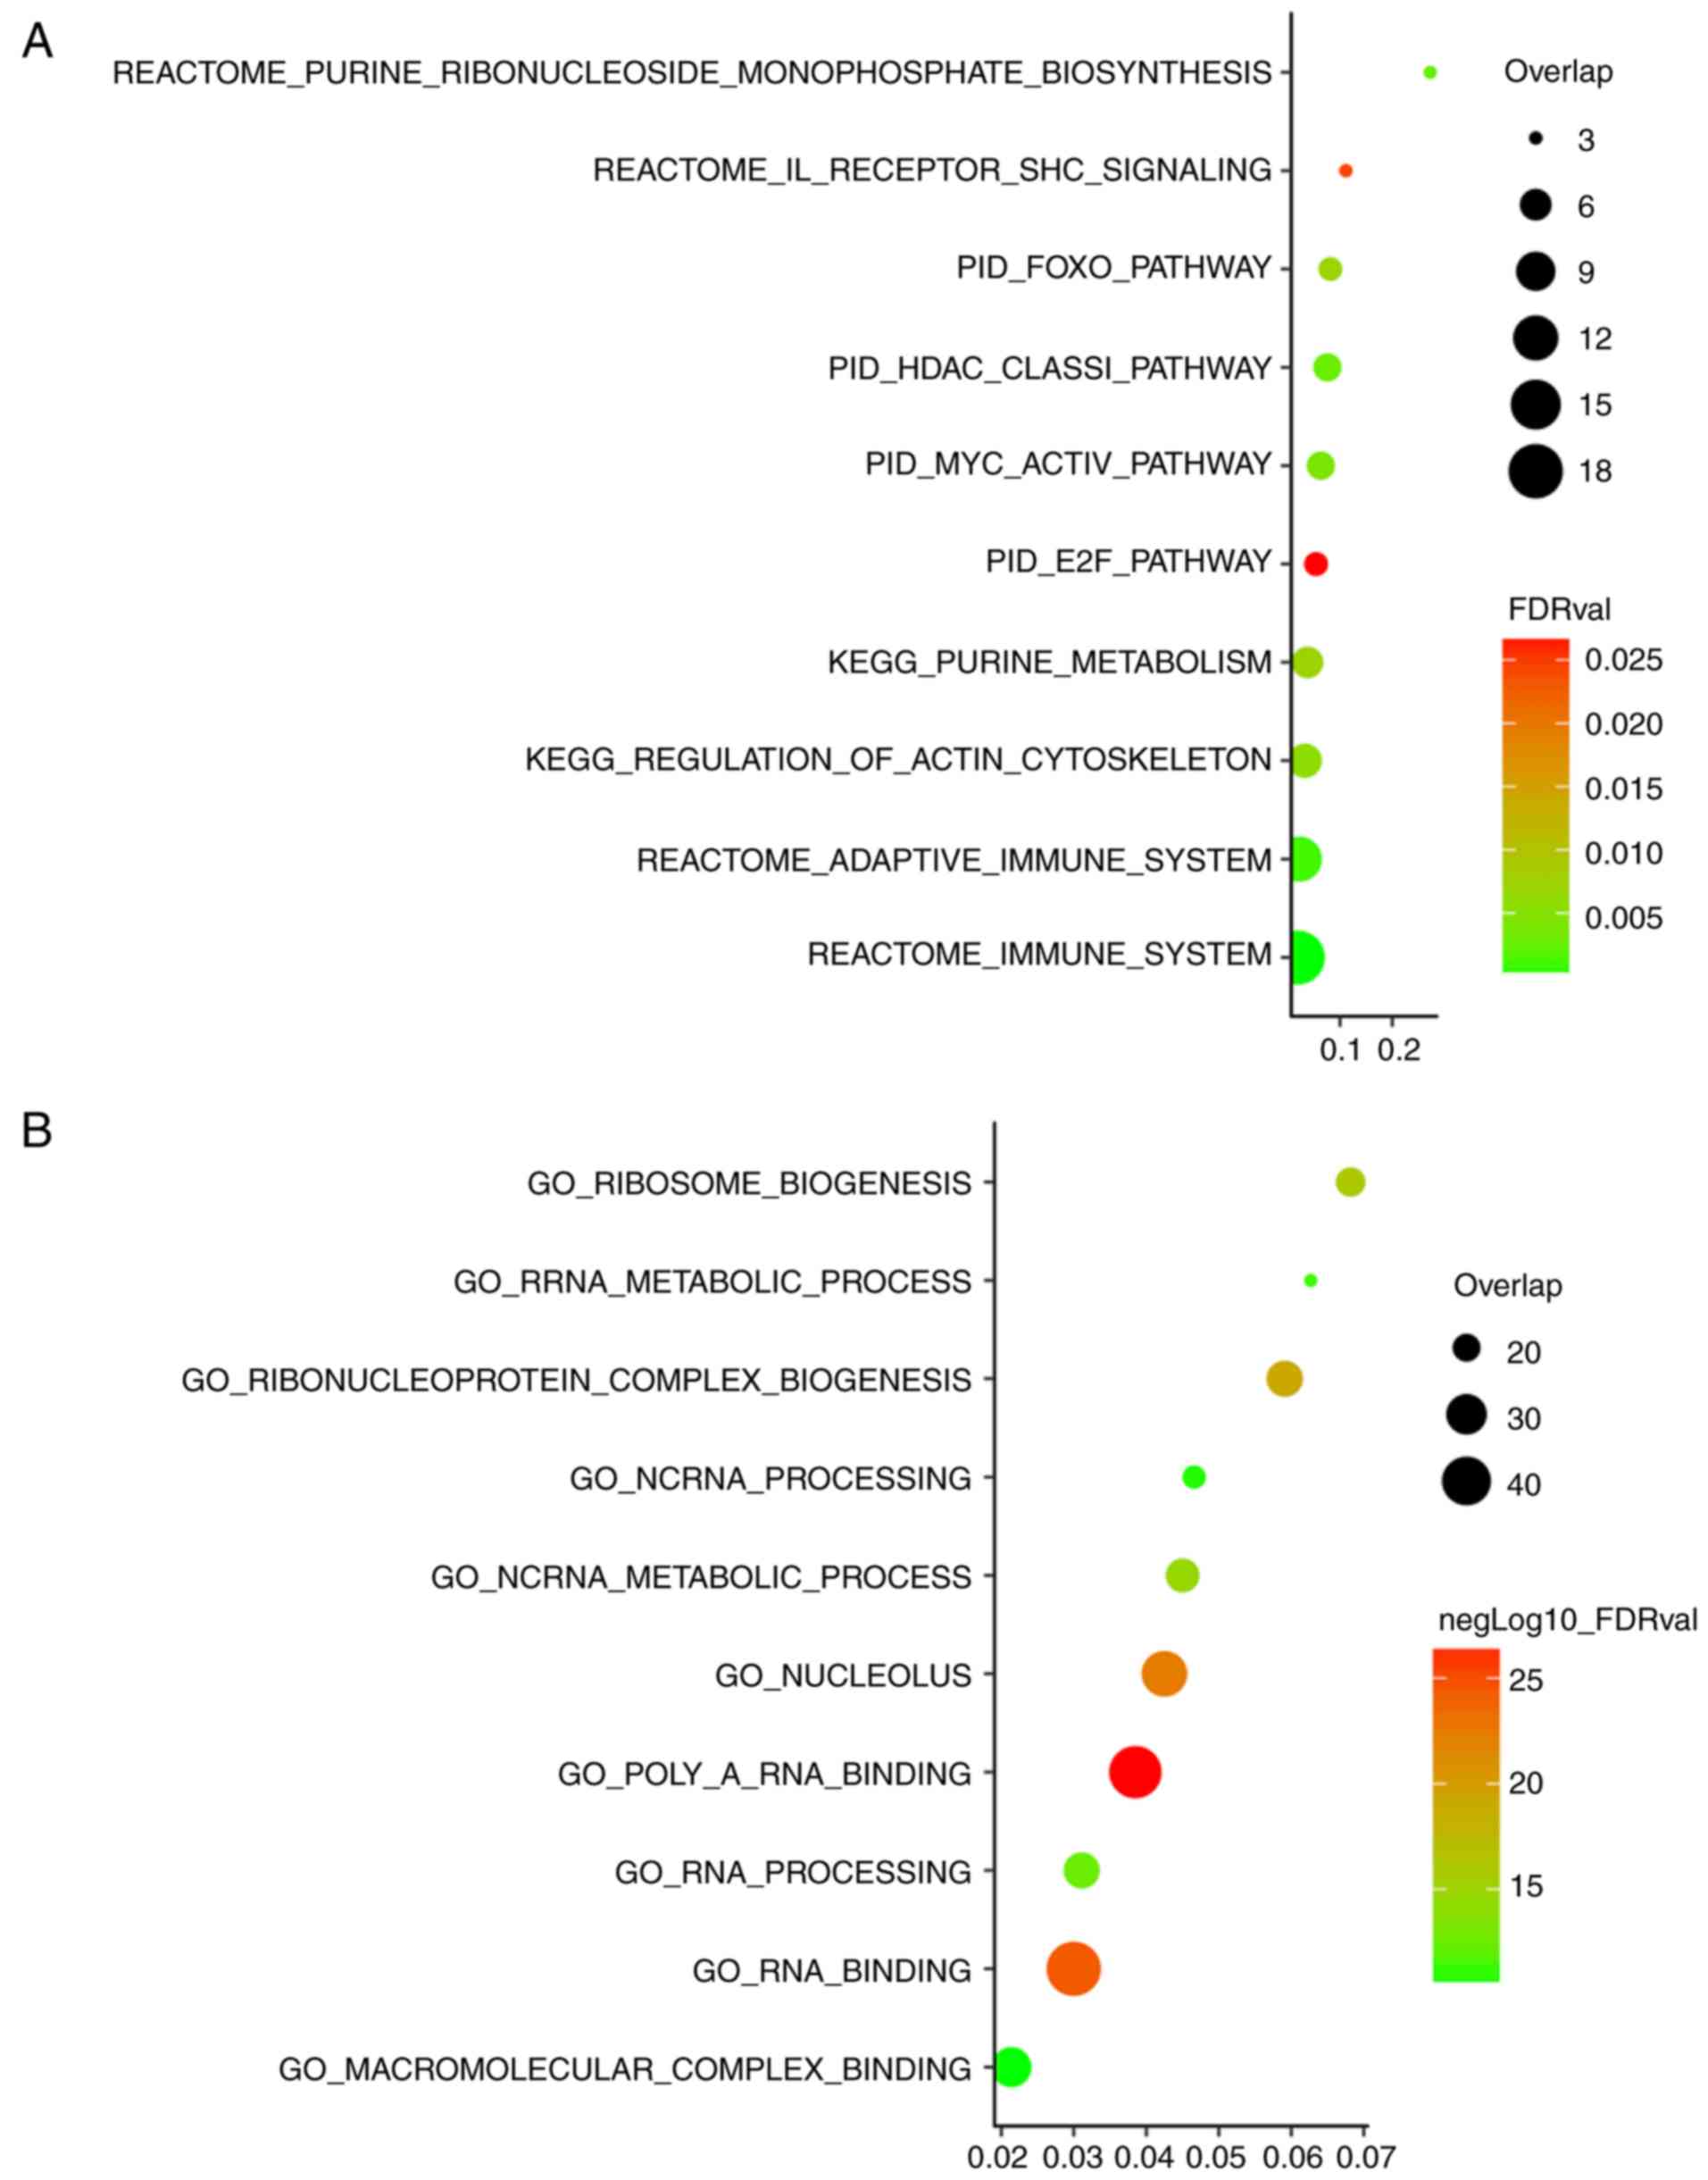
For the pathway enrichment analysis, canonical
pathway and KEGG gene sets were used (Fig. 4A; top 10 enriched pathways are
listed). Interestingly, the pathway enrichment analysis highlighted
several tumorigenesis-associated pathways. The signature-associated
pathway included interleukin, which was previously reported to
induce tumors in kidney clear cell carcinoma (23). Alteration of immune system was also
highlighted in the pathway enrichment analysis. The GO enrichment
analysis was based on the combined analysis of biological
processes, cellular components and molecular functions (Fig. 4B, top 10 enriched biological roles
are listed). RNA binding was observed as one of the functions, in
accordance with the known biological role of TFs (24), demonstrating the credibility of this
method of analysis. Another interesting finding was that this TF
signature was associated with the metabolic process. This potential
biological role requires further experimental validation in
association with the MYC-ESRRA-RFX5 signature.
MYC-ESRRA-RFX5 panel can predict the
immune cell infiltration level and is associated with the clinical
status of the patient
As demonstrated in the biological assessment, the
MYC-ESRRA-RFX5 signature may be associated with the immune state of
a patient, which is an important indicator of their clinical
condition. Based on this finding, the tumor microenvironment of 537
patients was characterized. A study, led by TCGA Research Network,
established a reliable immunogenomics pipeline for assessing the
immune state of a patient using the immuno-transcriptome (15). This work has paved the way for
identifying the precise immune state using data from RNA-Seq. This
approach was used to characterize the precise features of the
immune state of patients with renal cell carcinoma.
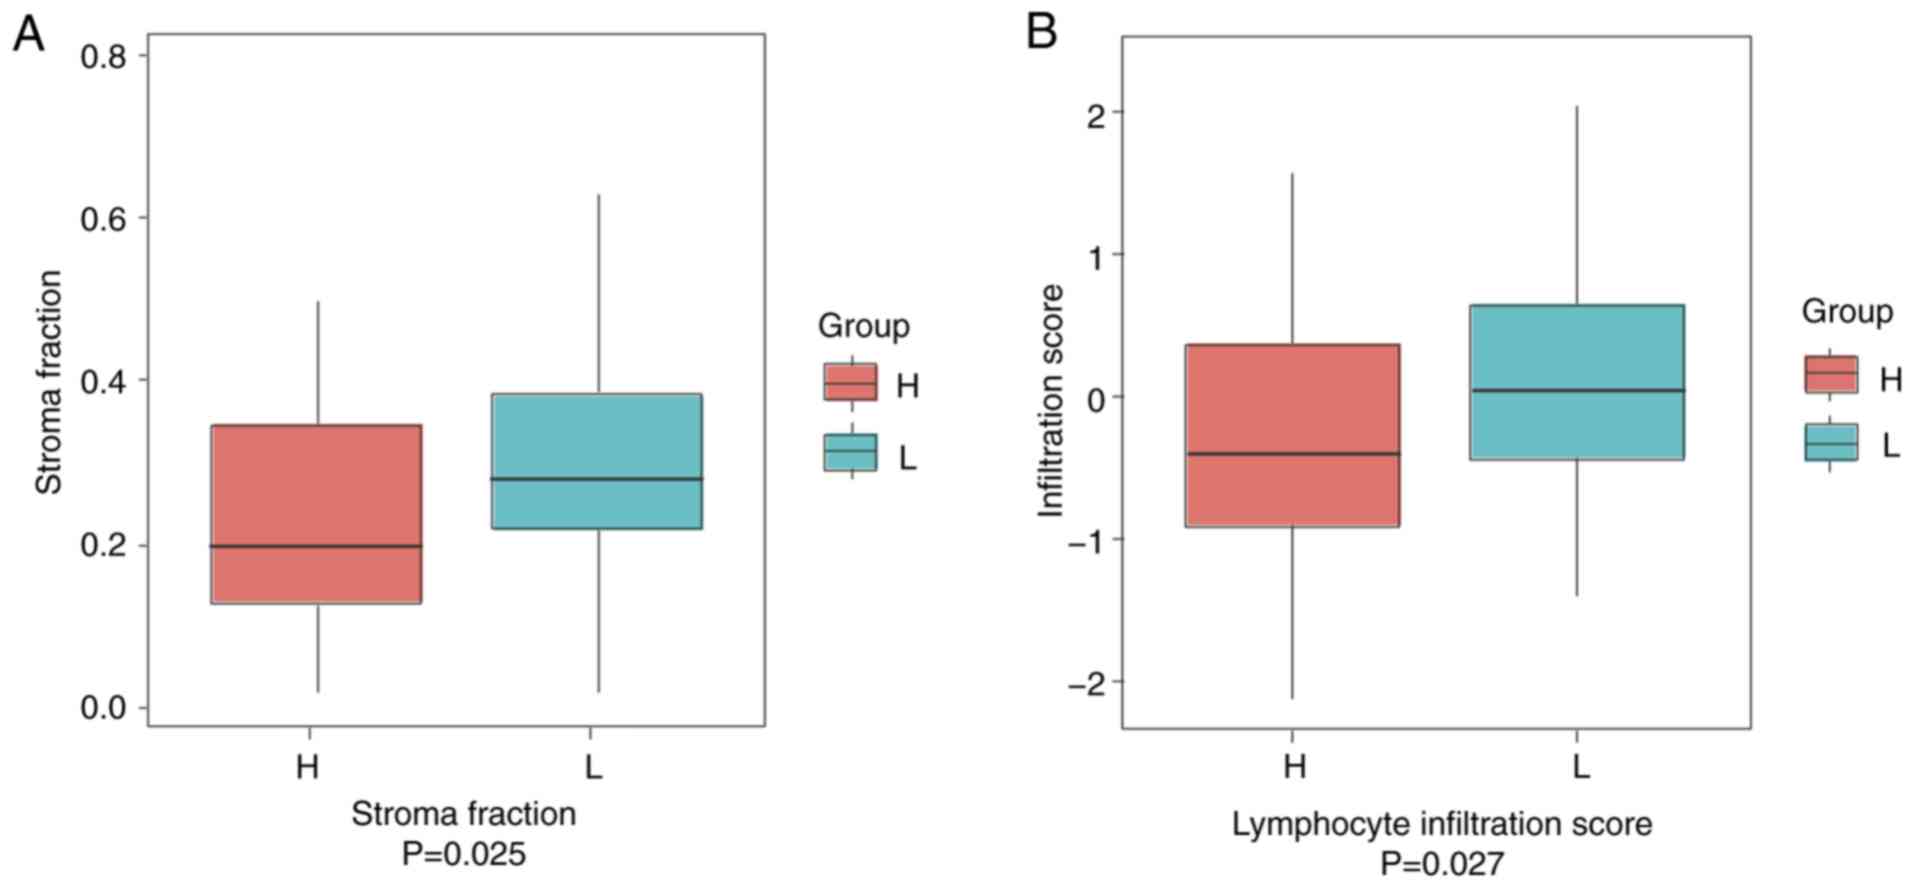
The stromal fraction was first analyzed, as stromal
cells are key players in tumor growth, disease development and drug
resistance (16). It was found that
patients in the low-risk group (classified by the MYC-ESRRA-RFX5
biomarker panel by the median TF value; n=268) had a median of ~30%
stromal fraction. On the contrary, the high-risk group (n=269) had
significantly lower stromal fraction (median, ~20%; P=0.025;
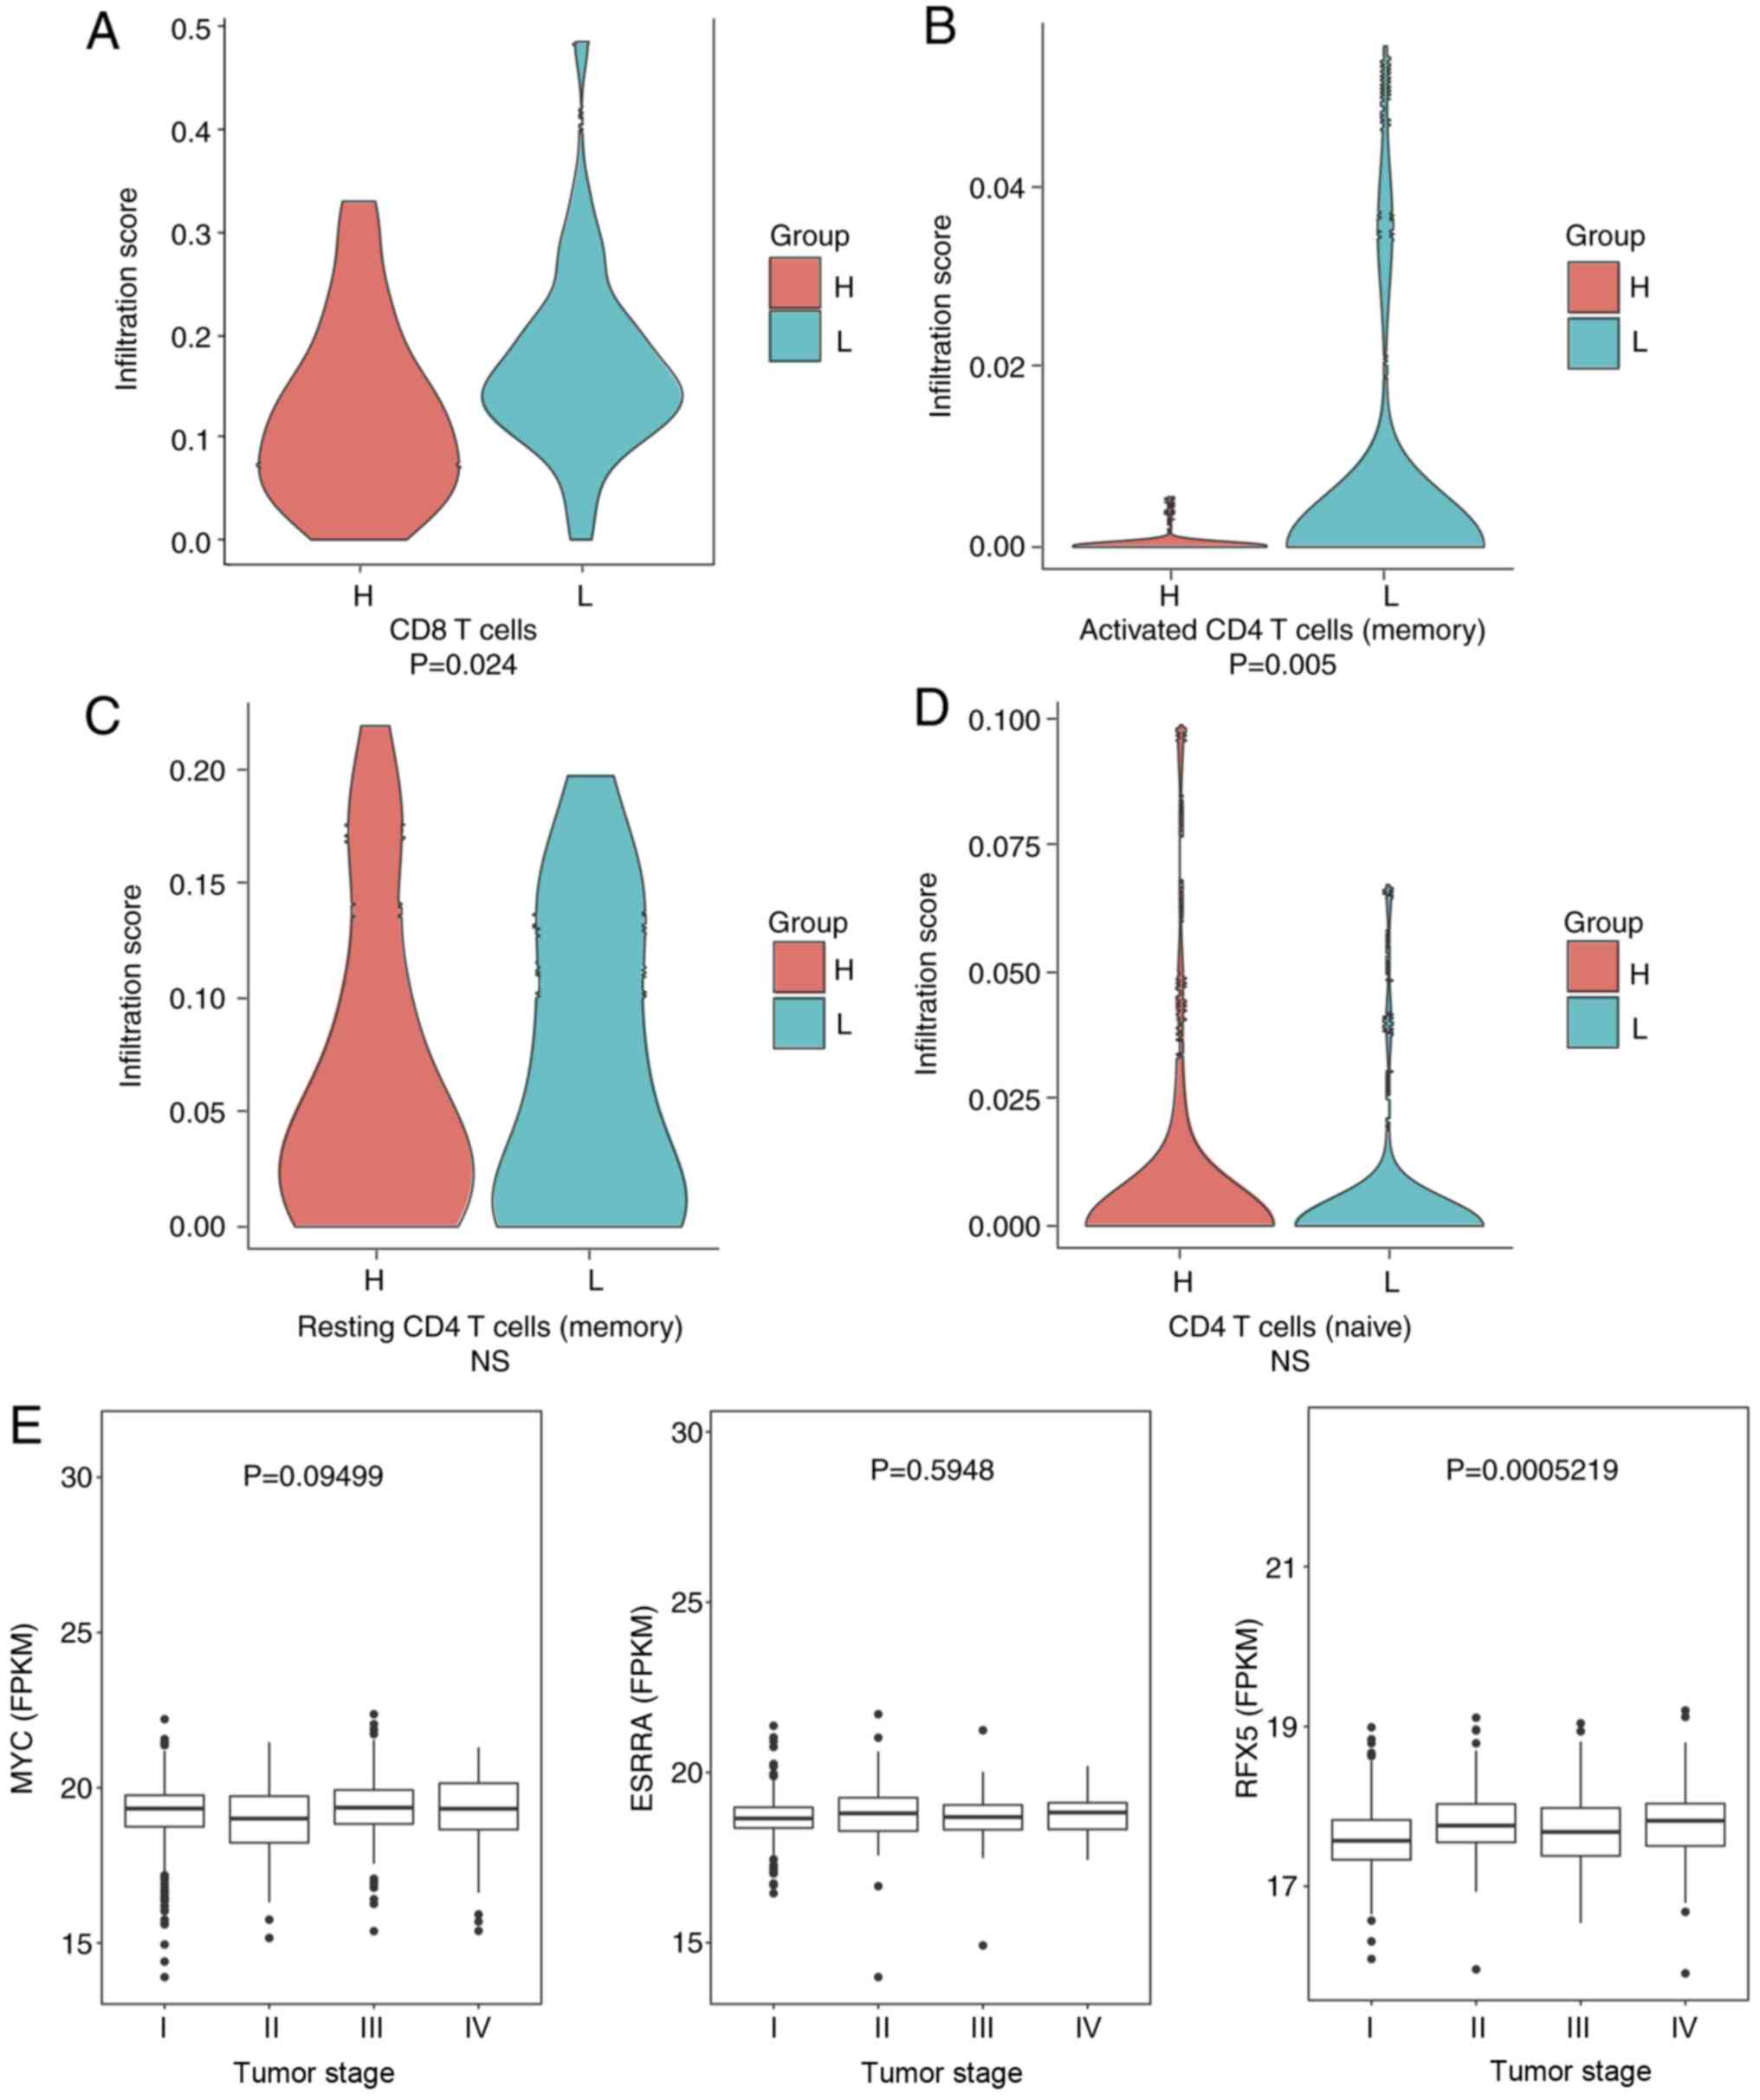
Fig. 5A). Secondly, the lymphocyte
infiltration score that marks the general immune state of a patient
was determined. The high-risk group displayed significantly lower
infiltrated immune cells (n=269) compared with the low-risk group
(n=268; P=0.027; Fig. 5B). To
evaluate the immune state in more detail, scores of the CD8 T cells
and activated (memory), resting (memory) and naive CD4 T cells were
calculated (Fig. 6). Significantly
higher infiltration of CD8 T cells and activated CD4 T cells
(memory) were observed in the low-risk group (P=0.024 and P=0.050,
respectively). The association between the three TFs and the
clinical stages was also examined. It was observed that the
expression of RFX5 differs between patients at different stages
(P<0.001; Fig. 6E). However, MYC
and ESRRA were not differentially expressed. These data revealed
that RFX5 may potentially serve as a marker of the different stages
of renal cell carcinoma.
MYC-ESRRA-RFX5 panel may predict the
efficacy of immune checkpoint inhibitors
The expression of PD-L1 is the most commonly used
biomarker for predicting response rate and progression-free
survival in the clinical use of immune checkpoint inhibitors
(PD-1/PD-L1 inhibitors) (25). It
was demonstrated that the MYC-ESRRA-RFX5 panel was associated with
the immune state of patients with renal cell carcinoma. Thus, the
ability of this biomarker panel to predict the effectiveness of
PD-1/PD-L1 inhibitors was investigated based on the expression of
PD-L1.
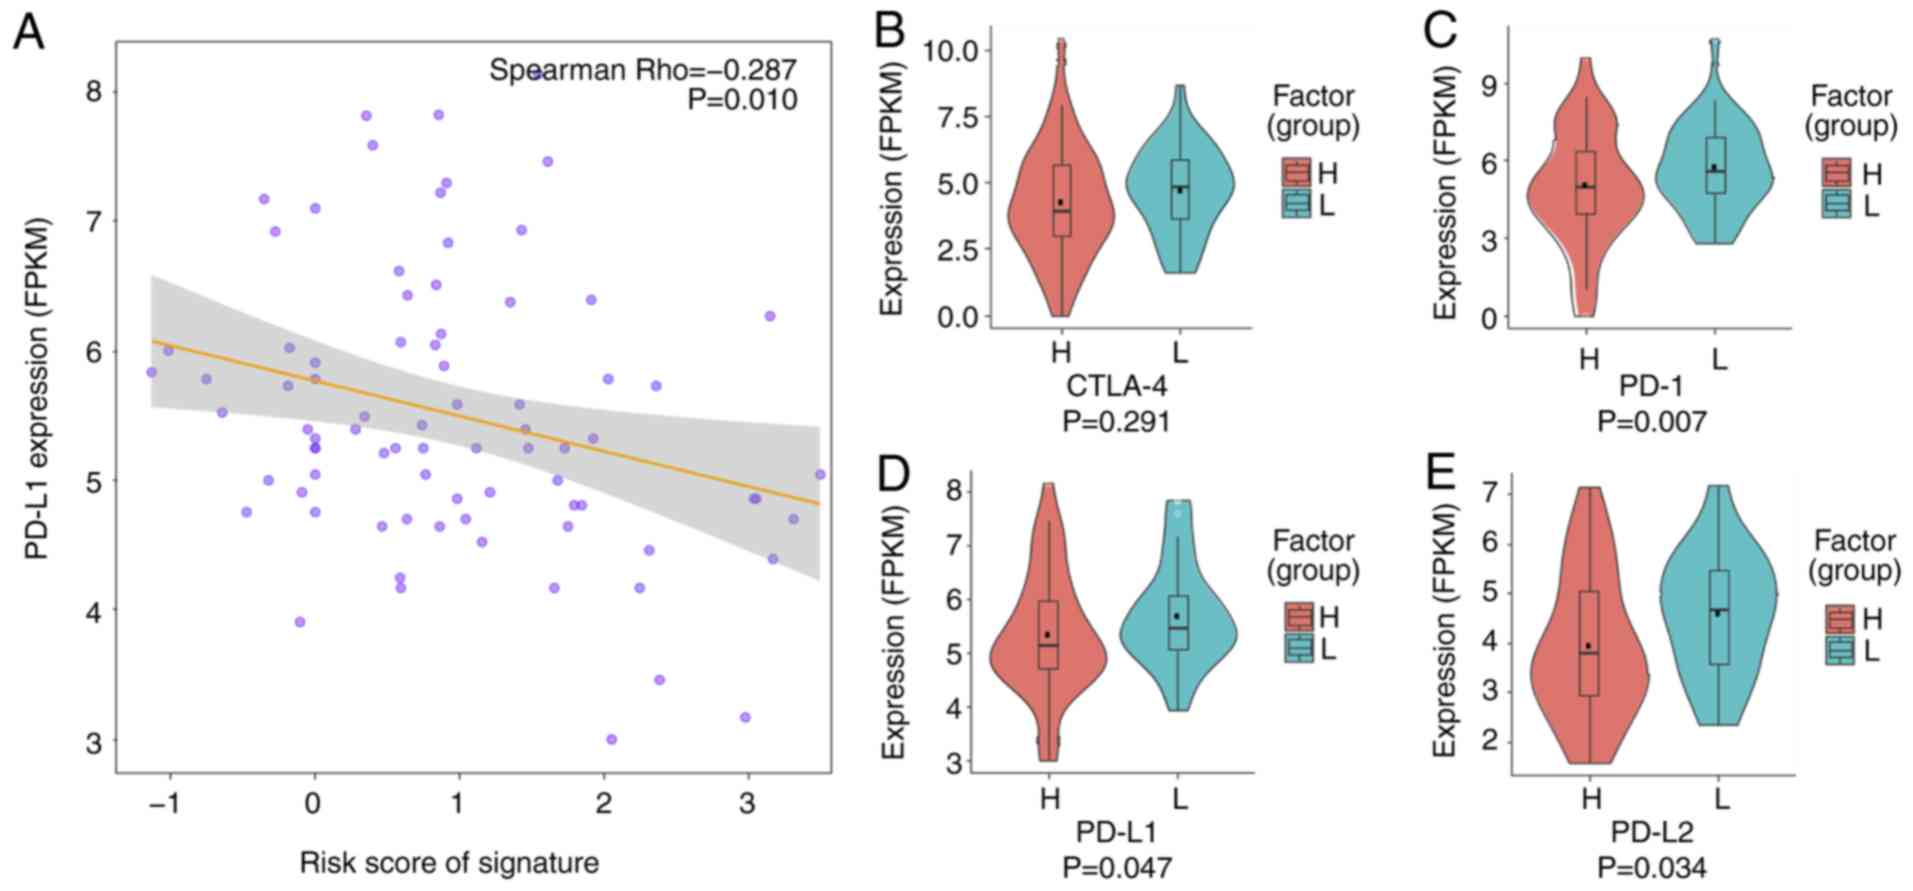
First, the correlation between the risk score
generated by the MYC-ESRRA-RFX5 panel, and PD-L1 expression was
determined. This led to the finding of a significant correlation
(Fig. 7A; Spearman's rank
coefficient, −0.287; P=0.010). Thereafter, the expression of
clinically used immune checkpoint proteins was compared between the
low- and high-risk groups. The expression of three of these
proteins, PD-1, PD-L1 and PD-L2, was significantly higher in the
low-risk group than in the high-risk group (Fig. 7B-E). This may be influenced by the
relatively small sample size. This trend suggests that the
MYC-ESRRA-RFX5 panel may predict the effectiveness of immune
checkpoint inhibitors in clinical practice.
Discussion
The findings in the present study demonstrated
promising prognostic roles of a TF signature that can robustly and
efficiently predict survival in renal cell carcinoma. Profiling of
TFs was conducted, which led to a three-TF biomarker panel that can
predict the survival and immune state of patients with this
disease.
Studies on TFs in the context of computational
biology are emerging. One such study systematically evaluated the
effects of MYC as a transcription factor and demonstrated that MYC
interacted with co-regulatory proteins such as MAX, MAX
gene-associated protein, MAX dimerization protein, providing new
insights into the oncogenic roles of TFs (26). Another study depicted the landscape
of the interactions between long non-coding (lnc)RNAs and TFs
(8). Notably, GSEA of targets found
that lncRNAs indirectly regulate specific TFs. A novel algorithm
(named LongHorn) was also developed (8), which precisely predicts the binding
sites of lncRNA, TFs and mRNA with high precision. Furthermore, a
study by Rau et al (27)
explored the gene expression drivers in TGCA tumor samples, and
reported on the essential roles of TFs. In the context of cancer
treatment, a study recently revealed that targeting the upstream
transcriptional factor of PD-L1 is an effective therapy in melanoma
(28). Overall, the findings from
these studies support the possibility that TFs may serve as targets
for cancer therapy.
TCGA is a systematic database that provides data of
copy numbers, DNA methylation, RNA-seq, somatic mutations and
protein expression based on over 10,000 patients across more than
20 cancer types. Moreover, 27 publications of The Pan-Cancer Genome
Atlas unraveled the origin of human cancer, oncogenic processes and
tumor-specific signaling pathways from the analysis of over 11,000
tumors across 33 cancer types (29).
Among them, two studies focused on TFs in the context of Pan-Cancer
(7,26). Interestingly, one study found that
MYC paralogs were significantly amplified in cancer. It was
demonstrated that MYC was associated with immune response
signaling, DNA replication and repair function, which was conserved
in a number of different types of cancer, including ovarian cancer
(26). Another interesting study
demonstrated that MYC expression correlates with PD-L1 expression
in non-small cell lung cancer, and that tumors expressing both
proteins may respond better to immune checkpoint blockade therapy
(30). The signature in the present
study, containing MYC, also demonstrated an association with immune
responses and oncogenic processes. This study highlights the
important roles of MYC in renal cell carcinoma.
The present study has some limitations. A major
concern is that a validation group is absent, due to insufficient
data, despite a thorough search of all available databases of TFs.
In addition, a better prognostic model could have been developed
using the lasso method (31);
however, the AUC value of the lasso method was not better than that
based on the Cox model (data not shown). Finally, the correlation
between clinical outcome and the MYC-ESRRA-RFX5 panel could not be
evaluated due to the lack of patient treatment follow-up data. In
the future, further investigation of this TF-based panel in the
clinical setting will be conducted.
In summary, the current study suggests an
immune-associated TF panel for predicting the prognosis of patients
with renal cell carcinoma. This MYC-ESRRA-RFX5 panel characterizes
the immune microenvironment and potentially predicts the
effectiveness of immune checkpoint inhibitors.
Acknowledgements
Not applicable.
Funding
No funding was received.
Availability of data and materials
The datasets used and/or analyzed during the current
study are available from the corresponding author on reasonable
request.
Authors' contributions
FL, QY, and WY designed the study, analyzed and
interpreted the data, and wrote the manuscript. FL, HZ, LX, QY, and
WY conducted the data analysis and wrote the manuscript.
Ethics approval and consent to
participate
Not applicable.
Patient consent for publication
Not applicable.
Competing interests
The authors declare that they have no competing
interests.
References
|
1
|
Iwafuchi-Doi M and Zaret KS: Pioneer
transcription factors in cell reprogramming. Genes Dev.
28:2679–2692. 2014. View Article : Google Scholar : PubMed/NCBI
|
|
2
|
Filtz TM, Vogel WK and Leid M: Regulation
of transcription factor activity by interconnected
post-translational modifications. Trends Pharmacol Sci. 35:76–85.
2014. View Article : Google Scholar : PubMed/NCBI
|
|
3
|
Johnston SJ and Carroll JS: Transcription
factors and chromatin proteins as therapeutic targets in cancer.
Biochim Biophys Acta. 1855:183–192. 2015.PubMed/NCBI
|
|
4
|
Yeh JE, Toniolo PA and Frank DA: Targeting
transcription factors: Promising new strategies for cancer therapy.
Curr Opin Oncol. 25:652–658. 2013. View Article : Google Scholar : PubMed/NCBI
|
|
5
|
Chen H, Li C, Peng X, Zhou Z, Weinstein
JN; Cancer Genome Atlas Research Network, ; Liang H: A pan-cancer
analysis of enhancer expression in nearly 9,000 patient samples.
Cell. 173:386–399.e12. 2018. View Article : Google Scholar : PubMed/NCBI
|
|
6
|
Sanchez-Vega F, Mina M, Armenia J, Chatila
WK, Luna A, La KC, Dimitriadoy S, Liu DL, Kantheti HS, Saghafinia
S, et al: Oncogenic signaling pathways in The Cancer Genome Atlas.
Cell. 173:321–337.e10. 2018. View Article : Google Scholar : PubMed/NCBI
|
|
7
|
Chiu HS, Somvanshi S, Patel E, Chen TW,
Singh VP, Zorman B, Patil SL, Pan Y, Chatterjee SS; Cancer Genome
Atlas Research Network, ; Sood AK, Gunaratne PH and Sumazin P:
Pan-cancer analysis of lncRNA regulation supports their targeting
of cancer genes in each tumor context. Cell Rep. 23:297–312.e12.
2018. View Article : Google Scholar : PubMed/NCBI
|
|
8
|
Knaack SA, Siahpirani AF and Roy S: A
pan-cancer modular regulatory network analysis to identify common
and cancer-specific network components. Cancer Inform. 13 (Suppl
5):S69–S84. 2014.
|
|
9
|
Siegel RL, Miller KD and Jemal A: Cancer
statistics, 2015. CA Cancer J Clin. 65:5–29. 2015. View Article : Google Scholar : PubMed/NCBI
|
|
10
|
Binnewies M, Roberts EW, Kersten K, Chan
V, Fearon DF, Merad M, Coussens LM, Gabrilovich DI,
Ostrand-Rosenberg S, Hedrick CC, et al: Understanding the tumor
immune microenvironment (TIME) for effective therapy. Nat Med.
24:541–550. 2018. View Article : Google Scholar : PubMed/NCBI
|
|
11
|
Massari F, Santoni M, Ciccarese C, Santini
D, Alfieri S, Martignoni G, Brunelli M, Piva F, Berardi R,
Montironi R, et al: PD-1 blockade therapy in renal cell carcinoma:
Current studies and future promises. Cancer Treat Rev. 41:114–121.
2015. View Article : Google Scholar : PubMed/NCBI
|
|
12
|
An N, Yu Z and Yang X: Expression
differentiation is not helpful in identifying prognostic genes
based on TCGA datasets. Mol Ther Nucleic Acids. 11:292–299. 2018.
View Article : Google Scholar : PubMed/NCBI
|
|
13
|
Tang H, Wang S, Xiao G, Schiller J,
Papadimitrakopoulou V, Minna J, WistubaI I and Xie Y: Comprehensive
evaluation of published gene expression prognostic signatures for
biomarker-based lung cancer clinical studies. Ann Oncol.
28:733–740. 2017. View Article : Google Scholar : PubMed/NCBI
|
|
14
|
Subramanian A, Tamayo P, Mootha VK,
Mukherjee S, Ebert BL, Gillette MA, Paulovich A, Pomeroy SL, Golub
TR, Lander ES and Mesirov JP: Gene set enrichment analysis: A
knowledge-based approach for interpreting genome-wide expression
profiles. Proc Natl Acad Sci USA. 102:15545–15550. 2005. View Article : Google Scholar : PubMed/NCBI
|
|
15
|
Thorsson V, Gibbs DL, Brown SD, Wolf D,
Bortone DS, Ou Yang TH, Porta-Pardo E, Gao GF, Plaisier CL, Eddy
JA, et al: The immune landscape of cancer. Immunity.
48:812–830.e14. 2018. View Article : Google Scholar : PubMed/NCBI
|
|
16
|
Yoshihara K, Shahmoradgoli M, Martínez E,
Vegesna R, Kim H, Torres-Garcia W, Treviño V, Shen H, Laird PW,
Levine DA, et al: Inferring tumour purity and stromal and immune
cell admixture from expression data. Nat Commun. 4:26122013.
View Article : Google Scholar : PubMed/NCBI
|
|
17
|
Liu Z, Dai J and Shen H: Systematic
analysis reveals long noncoding RNAs regulating neighboring
transcription factors in human cancers. Biochim Biophys Acta.
1864:2785–2792. 2018. View Article : Google Scholar
|
|
18
|
Jiang P, Freedman ML, Liu JS and Liu XS:
Inference of transcriptional regulation in cancers. Proc Natl Acad
Sci USA. 112:7731–7736. 2015. View Article : Google Scholar : PubMed/NCBI
|
|
19
|
Issa AM, Chaudhari VS and Marchant GE: The
value of multigene predictors of clinical outcome in breast cancer:
An analysis of the evidence. Expert Rev Mol Diagn. 15:277–286.
2015. View Article : Google Scholar : PubMed/NCBI
|
|
20
|
Lokeshwar SD, Talukder A, Yates TJ, Hennig
MJ, Garcia-Roig M, Lahorewala SS, Mullani NN, Klaassen Z, Kava BR,
Manoharan M, et al: Molecular characterization of renal cell
carcinoma: A potential three-MicroRNA prognostic signature. Cancer
Epidemiol Biomarkers Prev. 27:464–472. 2018. View Article : Google Scholar : PubMed/NCBI
|
|
21
|
Marziali G, Buccarelli M, Giuliani A,
Ilari R, Grande S, Palma A, D'Alessandris QG, Martini M, Biffoni M,
Pallini R and Ricci-Vitiani L: A three-microRNA signature
identifies two subtypes of glioblastoma patients with different
clinical outcomes. Mol Oncol. 11:1115–1129. 2017. View Article : Google Scholar : PubMed/NCBI
|
|
22
|
Mei S, Meyer CA, Zheng R, Qin Q, Wu Q,
Jiang P, Li B, Shi X, Wang B, Fan J, et al: Cistrome cancer: A web
resource for integrative gene regulation modeling in cancer. Cancer
Res. 77:e19–e22. 2017. View Article : Google Scholar : PubMed/NCBI
|
|
23
|
Kim HD, Yu SJ, Kim HS, Kim YJ, Choe JM,
Park YG, Kim J and Sohn J: Interleukin-4 induces senescence in
human renal carcinoma cell lines through STAT6 and p38 MAPK. J Biol
Chem. 288:28743–28754. 2013. View Article : Google Scholar : PubMed/NCBI
|
|
24
|
Cassiday LA: Having it both ways:
Transcription factors that bind DNA and RNA. Nucleic Acids
Research. 30:4118–4126. 2002. View Article : Google Scholar : PubMed/NCBI
|
|
25
|
Cyriac G and Gandhi L: Emerging biomarkers
for immune checkpoint inhibition in lung cancer. Semin Cancer Biol.
52:269–277. 2018. View Article : Google Scholar : PubMed/NCBI
|
|
26
|
Schaub FX, Dhankani V, Berger AC, Trivedi
M, Richardson AB, Shaw R, Zhao W, Zhang X, Ventura A, Liu Y, et al:
Pan-cancer alterations of the MYC oncogene and its proximal network
across the Cancer Genome Atlas. Cell Syst. 6:282–300.e2. 2018.
View Article : Google Scholar : PubMed/NCBI
|
|
27
|
Rau A, Flister M, Rui H and Auer PL:
Exploring drivers of gene expression in the Cancer Genome Atlas.
Bioinformatics. 35:62–68. 2019.PubMed/NCBI
|
|
28
|
Zhu B, Tang L, Chen S, Yin C, Peng S, Li
X, Liu T, Liu W, Han C, Stawski L, et al: Targeting the upstream
transcriptional activator of PD-L1 as an alternative strategy in
melanoma therapy. Oncogene. 37:4941–4954. 2018. View Article : Google Scholar : PubMed/NCBI
|
|
29
|
Blum A, Wang P and Zenklusen JC: SnapShot:
TCGA-analyzed tumors. Cell. 173:5302018. View Article : Google Scholar : PubMed/NCBI
|
|
30
|
Kim EY, Kim A, Kim SK and Chang YS: MYC
expression correlates with PD-L1 expression in non-small cell lung
cancer. Lung Cancer. 110:63–67. 2017. View Article : Google Scholar : PubMed/NCBI
|
|
31
|
Datta S, Le-Rademacher J and Datta S:
Predicting patient survival from microarray data by accelerated
failure time modeling using partial least squares and LASSO.
Biometrics. 63:259–271. 2007. View Article : Google Scholar : PubMed/NCBI
|