Introduction
Lung adenocarcinoma (AC) and lung squamous cell
carcinoma (SCC) are two major histological subtypes of non-small
cell lung cancer (NSCLC) and accounted for ~70% of lung cancer (LC)
cases worldwide in 2010 (1). For
patients with NSCLC, the five-year survival rate is less than 15%
(2). At present, the most promising
strategy is early diagnosis followed by surgical resection of the
tumors (3). Postoperative adjuvant
chemotherapy may improve the survival rate of patients with a poor
prognosis. However, it is not recommended for patients with stage
IA NSCLC, whose five-year survival rate is approximately 70%
(2). Therefore, using biomarkers to
identify patients with NSCLC who may benefit from adjuvant
chemotherapy is of clinical importance.
A biomarker is a measurable indicator of a
biological state or condition (4).
At present, biomarkers are used in numerous scientific fields.
Previous studies have investigated the development of novel
technologies for the accurate and easy detection and measurement of
potential biomarkers (5–7). Microarray technology may be used to
monitor thousands of genes and measure their expression values
simultaneously. Previous studies have demonstrated that the
signatures obtained using gene expression values from microarray
experiments may distinguish between AC and SCC with perfect
accuracy (8–13), and may determine the prognosis of
patients with NSCLC (14–16). The identification of such gene
signatures is generally accomplished with the aid of a feature
selection algorithm, which reduces the number of genes under
consideration, speeds up the learning process and improves the
biological interpretation of resulting models (17).
RNA-sequencing (RNA-seq) technology has notable
advantages over microarray technology, including increased
precision for identification of differentially expressed genes
(DEGs) (18), and it has replaced
microarray technology as the first choice for gene expression
profiling (19). However, the vast
majority of existing statistical methods, including those used to
identify the differentially expressed genes or select the relevant
genes associated with the phenotypes of interest, were designed for
continuous gene expression measures obtained from microarray
experiments. The introduction of the R function voom (20) has allowed the count values of RNA-Seq
data to be transformed into continuous values that follow
approximately normal distributions. Consequently, current
statistical methods used to analyze data obtained from microarray
experiments may be directly applied to RNA-Seq data. This allows
the investigation of the generalization of a gene signature trained
from one platform to another platform.
Regardless of the technology used, it is frequently
observed that the resulting prognostic gene signatures rarely
overlap when the same analytic procedure is applied to different
datasets. The accumulation of NSCLC gene expression data and the
integration of experiments using a specific statistical method, for
example a meta-analysis (21) or an
integrative analysis (22,23), allow for one unique gene signature
across multiple studies. In the present study, the overall
prognostic value of a gene across three NSCLC microarray datasets
was estimated using a meta-analysis model, with the aims of
identifying subtype-specific prognostic signatures for AC and SCC
and identifying the patients who may benefit from adjuvant
treatment. Previous studies in the framework of meta-analyses on
NSCLC for the purpose of prognosis have mainly focused on either
the identification of prognostic genes for one specific subtype
(24) or both AC and SCC patients
(25). By contrast, the present
study takes into account that the genes associated with the
survival time of patients with AC and SCC may differ (26–28),
with the aid of a feature selection algorithm capable of
identifying subtype-specific prognostic gene signatures known as
the Cox-filter method (27). The
resulting subtype-specific prognostic gene signatures were verified
on a RNA-seq dataset and an independent microarray dataset, and the
biological relevance of those genes was investigated using the
GeneCards database (www.genecards.org) (29).
Another feature of the present study was the control
over redundant genes by evaluating the Pearson's correlation
coefficients (PCCs) of a specific gene with all selected genes in a
forward stepwise regression manner. The term ‘redundancy’ refers to
the hidden associations or grouping structures that exist among
genes, and therefore a gene may be erroneously included in the
final gene signature due to its high correlation with the true
relevant gene/s (30). Redundant
genes do not contribute to the discriminative ability of a final
model, and in numerous cases they hinder this ability. Therefore,
the inclusion of redundant genes substantially influences the
quality of a final gene signature (30).
Materials and methods
Experimental data
The Gene Expression Omnibus (GEO; www.ncbi.nlm.nih.gov/geo) repository of the
National Institutes of Health was searched for the potential
microarray experiments using the following keywords: ‘lung cancer’,
‘adenocarcinoma’, ‘squamous cell carcinoma’, ‘survival’ and
‘Affymetrix chip’. Subsequently, the selected datasets were further
examined to identify whether patients with AC and SCC were included
and whether survival information was available. The studies that
did not include both were excluded. In total, four experiments were
selected for inclusion in the present study: GSE3141 (31), GSE37745 (32), GSE30219 (33) and GSE50081 (16). The characteristics of each dataset
are summarized in Table I.
 | Table I.Characteristics of the microarray
datasets used in the current study. |
Table I.
Characteristics of the microarray
datasets used in the current study.
| Dataset | Study | Raw data | Platform | Normalization
method | Number of
events/Number of AC patients | Number of
events/Number of SCC patients | (Refs.) |
|---|
|
GSE3141a | Bild et al,
2006 | No | HGU 133 Plus 2 | MAS5 | 32/58 | 26/53 | (31) |
| GSE30219 | Rousseaux et al,
2013 | Yes | HGU 133 Plus 2 | FRMA | 43/85 | 19/22 | (33) |
| GSE37745 | Botling et al,
2013 | Yes | HGU 133 Plus 2 | FRMA | 27/40 | 20/24 | (32) |
| GSE50081 | Der et al,
2014 | Yes | HGU 133 Plus 2 | FRMA | 51/127 | 16/42 | (16) |
The RNA-Seq data were downloaded from the lung
Adenocarcinoma (LUAD; for AC subtype) and lung squamous cell
carcinoma (LUSC; for SCC subtype) cohorts on The Cancer Genome
Atlas (TCGA; level 3, tcga-data.nci.nih.gov/tcga). The data of patients at
the early stages of the disease that had not undergone any adjuvant
treatment and that included survival information were selected. A
total of 70 patients with AC and 55 patients with SCC were
identified.
Pre-processing procedures
The raw data (CEL files) of the three microarray
data sets, GSE37745, GSE30219 and GSE50081, served as the training
set. They were downloaded from the GEO repository. The expression
values were obtained using the frozen robust multiarray analysis
(frma) algorithm (34), and
subsequently normalized using quantile normalization using R frma
package (34). In cases where
multiple probe sets matched to one specific gene, the probe set
with the largest fold change was selected. Subsequently, the
pre-processed gene expression matrix of GSE3141 was downloaded from
the GEO repository, and was considered as one of the test sets.
This test set was used to investigate the effects that different
pre-processing procedures may have on the downstream analyses.
For the second test set, the RNA-seq data, the
counts-per-million values were calculated and log2
transformed by the Voom function (20) in R limma package (35). The purpose of having this test set
was to examine the applicability of a gene signature trained on one
platform to a different platform. The downstream analysis was
performed on the 14,573 genes in the microarray data and the
RNA-seq data.
Statistical methods
Cox-filter
The Cox-filter method (27) was used to identify genes associated
with the survival rates of patients with the AC/SCC histology
subtype. In this method, a Cox model is fitted on each gene, and
the hazard function of patient i for gene g
(g=1, …, p) is calculated as follows:
λijg(t)=λ0g(t)exp(β1gI(j=1)+β2gXijg+β3gI(j=1)×Xijg)
Where Xij=(Xij1,…,
Xijp)T represents actual expression values
for the p genes under consideration. λ0g(t) is an
unknown baseline hazard function for the AC group while
λ0g(t)exp(β1g) is the baseline hazard
function for the SCC group. The two groups have different baseline
hazard functions, with β1g representing the difference
between the SCC and AC groups in terms of log baseline hazard
function. I(j=1) is an indicator, taking the value of 1 if the
histology subtype j of patient i is SCC, or the value
of 0 if patient i has AC. Both β2g and
β3g are the parameters of interest, with β2g
representing the change in log hazard rate associated with 1-unit
increase in the actual expression value of gene g among AC
and β3g representing the additional change in log hazard
rate associated with the SCC subtype. The values of
βACg, i.e., β2g, and βSCCg, i.e.,
β2g+β3g, determine whether subtype-specific
prognostic genes exist. For example, βACg≠0 and
βSCCg=0 correspond to an AC-specific gene, and
βSCCg≠0 and βACg=0 correspond to an
SCC-specific gene.
Overall effect size estimation using
meta-analysis
The overall effect sizes were calculated using a
meta-analysis model. The general model in a meta-analysis setting
is written as follows:
Ygj=θgj+εgj,εgj~N(0,σgj2)
θgj=μg+δgj,δgj~N(0,τg2)
Where Ygj represents the estimated
β coefficient (either βAC or βSCC) for study
j (j=1, …, J) for a specific gene g. θgi is
the study-specific hazard ratio for gene g, and εgi
is an error term which is assumed to follow a normal distribution
σ2gi represents the within-study variance of gene g for
study j. Ygj and σ2gi were estimated by
the Cox-filter models for each study and thus considered to be
known or more precisely observed. Furthermore, θgi is
assumed to be drawn from a superpopulation with an overall mean of
µg and a variance of
τg2. Of note, µg is
the average of the hazard ratio over all studies for gene g,
which is the parameter of interest. δgi is the error term
for a superpopulation. τg2 is the
between-study variance, which represents the variability between
studies and is estimated by the DerSimonian and Laird method
(36). Under a fixed-effect model,
τg2=0, and
τg2 >0 corresponds to a
random-effect model. The Cochran's Q statistic that follows a
χ2n-1 distribution under the null hypothesis
(H0: τg2=0 vs.
H1: τg2 >0) was used to
determine whether a fixed-effect or a random-effect model was more
appropriate (37).
If a fixed-effect model was selected, the estimated
µg was standardized by its standard errors to
obtain the Z-score, By contrast, the Z-score was the ratio of the
estimated µg, (represented by
µg^), to the square root of
τg2 +se
(µg^)2 in the random-effect
model. The Z-score was assumed to follow a standard normal
distribution and the adjusted P-values of the Z-score determined
whether the specific gene was associated with the survival rate. In
the present study, a gene with an adjusted P-value<0.05, where
the Benjamini and Hochberg procedure (38) was used for the multiple comparison
correction, and an integrated effect size (log hazard ratio)>0.5
was considered to indicate a statistically significant
difference.
Redundant gene elimination (RGE)
The expression values of genes are not independent
from one another as there are relationships or grouping structures
among genes. The correlations among genes result in numerous
redundant genes and the removal of the redundant genes may lead to
improved prediction accuracy and model stability (30). In the present study, in order to
eliminate redundant genes in the resulting gene lists identified
using the Cox-filter meta-analysis, the genes were arranged in an
ascending order according to their adjusted P-values in the
Cox-filter models, and a null set S was defined. The gene
with the most significant P-value was placed into the newly-defined
set S and the PCCs of the kth gene (k=2, …, p, where p is
the number of genes in the list) with the genes inside set S
were subsequently calculated for each study. If the absolute PCCs
of one specific gene with the genes inside S for all studies
were <0.4 (based on the sensitivity analysis), this gene was
placed into S, otherwise the gene was omitted. The PCCs were
calculated for each gene in the list. The final prognostic gene
signature with RGE was the resulting set S. The proposed
procedures are referred to as the meta Cox-filter method with RGE
(for the procedures with the add-on step of redundant gene
elimination, the cut-off of PCCs is set at 0.4 based on a
sensitivity analysis over values from 0.2 to 0.5, with an increment
of 0.1 and 1. A multiple Cox regression model was fitted with all
identified genes as covariates when the sizes of the resulting gene
signatures were small enough, otherwise a multiple Cox regression
model was fitted with the first five PCs of all identified genes as
covariates and the meta Cox-filter method without RGE
hereafter.
Pathway enrichment analysis
The Search Tool for the Retrieval of Interacting
Genes/Proteins (STRING, version 11.0, www.string-db.org) (39) was used to search for the Gene
Ontology (GO; geneontology.org) terms (40) and the Kyoto Encyclopedia of Genes and
Genomes (KEGG; http://www.genome.jp/kegg/) pathways (41) that were enriched by the AC-and the
SCC-specific prognostic signatures. The STRING software (39) is a stand-alone online server used to
construct the gene-to-gene interaction networks based on the data
of gene fusion, co-occurrence, co-expression, experiments, various
curated pathway databases and text mining.
Performance statistics
The censoring-adjusted C-statistic (42) over the follow-up period (0, τ) was
used to evaluate the performance of a resulting prognostic gene
signature. The C-statistic is defined as follows:
Cτ(β)=P(g(Xi)>g(Xj)|Ti<Tj,Ti<τ)
Where g(Xi) is the risk score for
patient i with predictor vector Xi, representing the
expression values of the selected prognostic genes. The risk scores
for patients were constructed by fitting an extra multiple Cox
regression model with either all genes or the first five principal
components (PCs) of all identified genes as covariates, with β
representing the coefficients before the covariates. Ti
and Tj were the survival/censoring time for patient
i and patient j, respectively. A C-index value
between 0.6 and 0.7 indicates a prognostic signature has
satisfactory performance (43).
Furthermore, using the median of those risk scores,
that is g(Xi), as a cut-off, the patients were
classified into either a low-or high-risk group. The Kaplan-Meier
curves for these two groups were obtained, and log-rank tests were
used to compare these two curves. A smaller P-value suggested a
more significant difference between the survival curves of the
low-and the high-risk groups.
Statistical language and packages
All statistical analyses were conducted in R
language (version 3.3; www.r-project.org).
Results and Discussion
In the present study, the data of three microarray
experiments (GSE37745, GSE30219 and GSE50081) were used as the
training sets, and the GSE3141 dataset and RNA-seq data from the
TCGA database were used as the test sets to validate the
performance of the resulting prognostic gene signatures.
First, a sensitivity analysis was conducted in
order to determine the optimal cut-off for the absolute PCCs, which
identifies the genes that are regarded as redundant genes and may
thus be excluded from the final gene lists. The C-statistics of the
resulting gene signatures were calculated for each study and are
presented in Table II. Based on
these statistics and the size of the final gene lists, the cut-off
was set at 0.4, which corresponded to the largest C-statistics for
all studies taken together and the smallest number of selected
genes. Furthermore, it was observed that the proportion of
redundant genes existing within a gene list selected by a filter
method, such as the Cox-filter method, was substantial. Following
RGE, the size of the AC-specific prognostic signature was reduced
from 131 to 24, indicating that approximately 80% of identified
genes were redundant. Similarly, the size of the SCC-specific
prognostic signature was reduced from 203 to 12, indicating that
the percentage of redundant genes for the SCC subtype was even
higher than the AC subtype. The 131-gene signature for AC and the
203-gene signature for SCC identified by the proposed method
without RGE are listed in Table SI,
along with the significance levels of those genes and the labels
for redundancy.
| Table II.Sensitivity analysis to determine the
cut-off value of average absolute Pearson's correlation
coefficients over three microarray studies. |
Table II.
Sensitivity analysis to determine the
cut-off value of average absolute Pearson's correlation
coefficients over three microarray studies.
|
| Size | GSE30219 | GSE37745 | GSE50081 |
|---|
|
|
|
|
|
|
|---|
| Cut-off value | AC | SCC | AC | SCC | AC | SCC | AC | SCC |
|---|
| 0.2 | 2 | 3 | 0.708 | 0.665 | 0.529 | 0.682 | 0.701 | 0.671 |
| 0.3 | 9 | 6 | 0.628 | 0.593 | 0.682 | 0.701 | 0.755 | 0.940 |
| 0.4 | 24 | 12 | 0.804 | 0.903 | 0.921 | 0.864 | 0.814 | 0.910 |
| 0.5a | 54 | 28 | 0.638 | 0.541 | 0.792 | 0.630 | 0.751 | 0.870 |
| 1a | 131 | 203 | 0.605 | 0.652 | 0.751 | 0.735 | 0.739 | 0.778 |
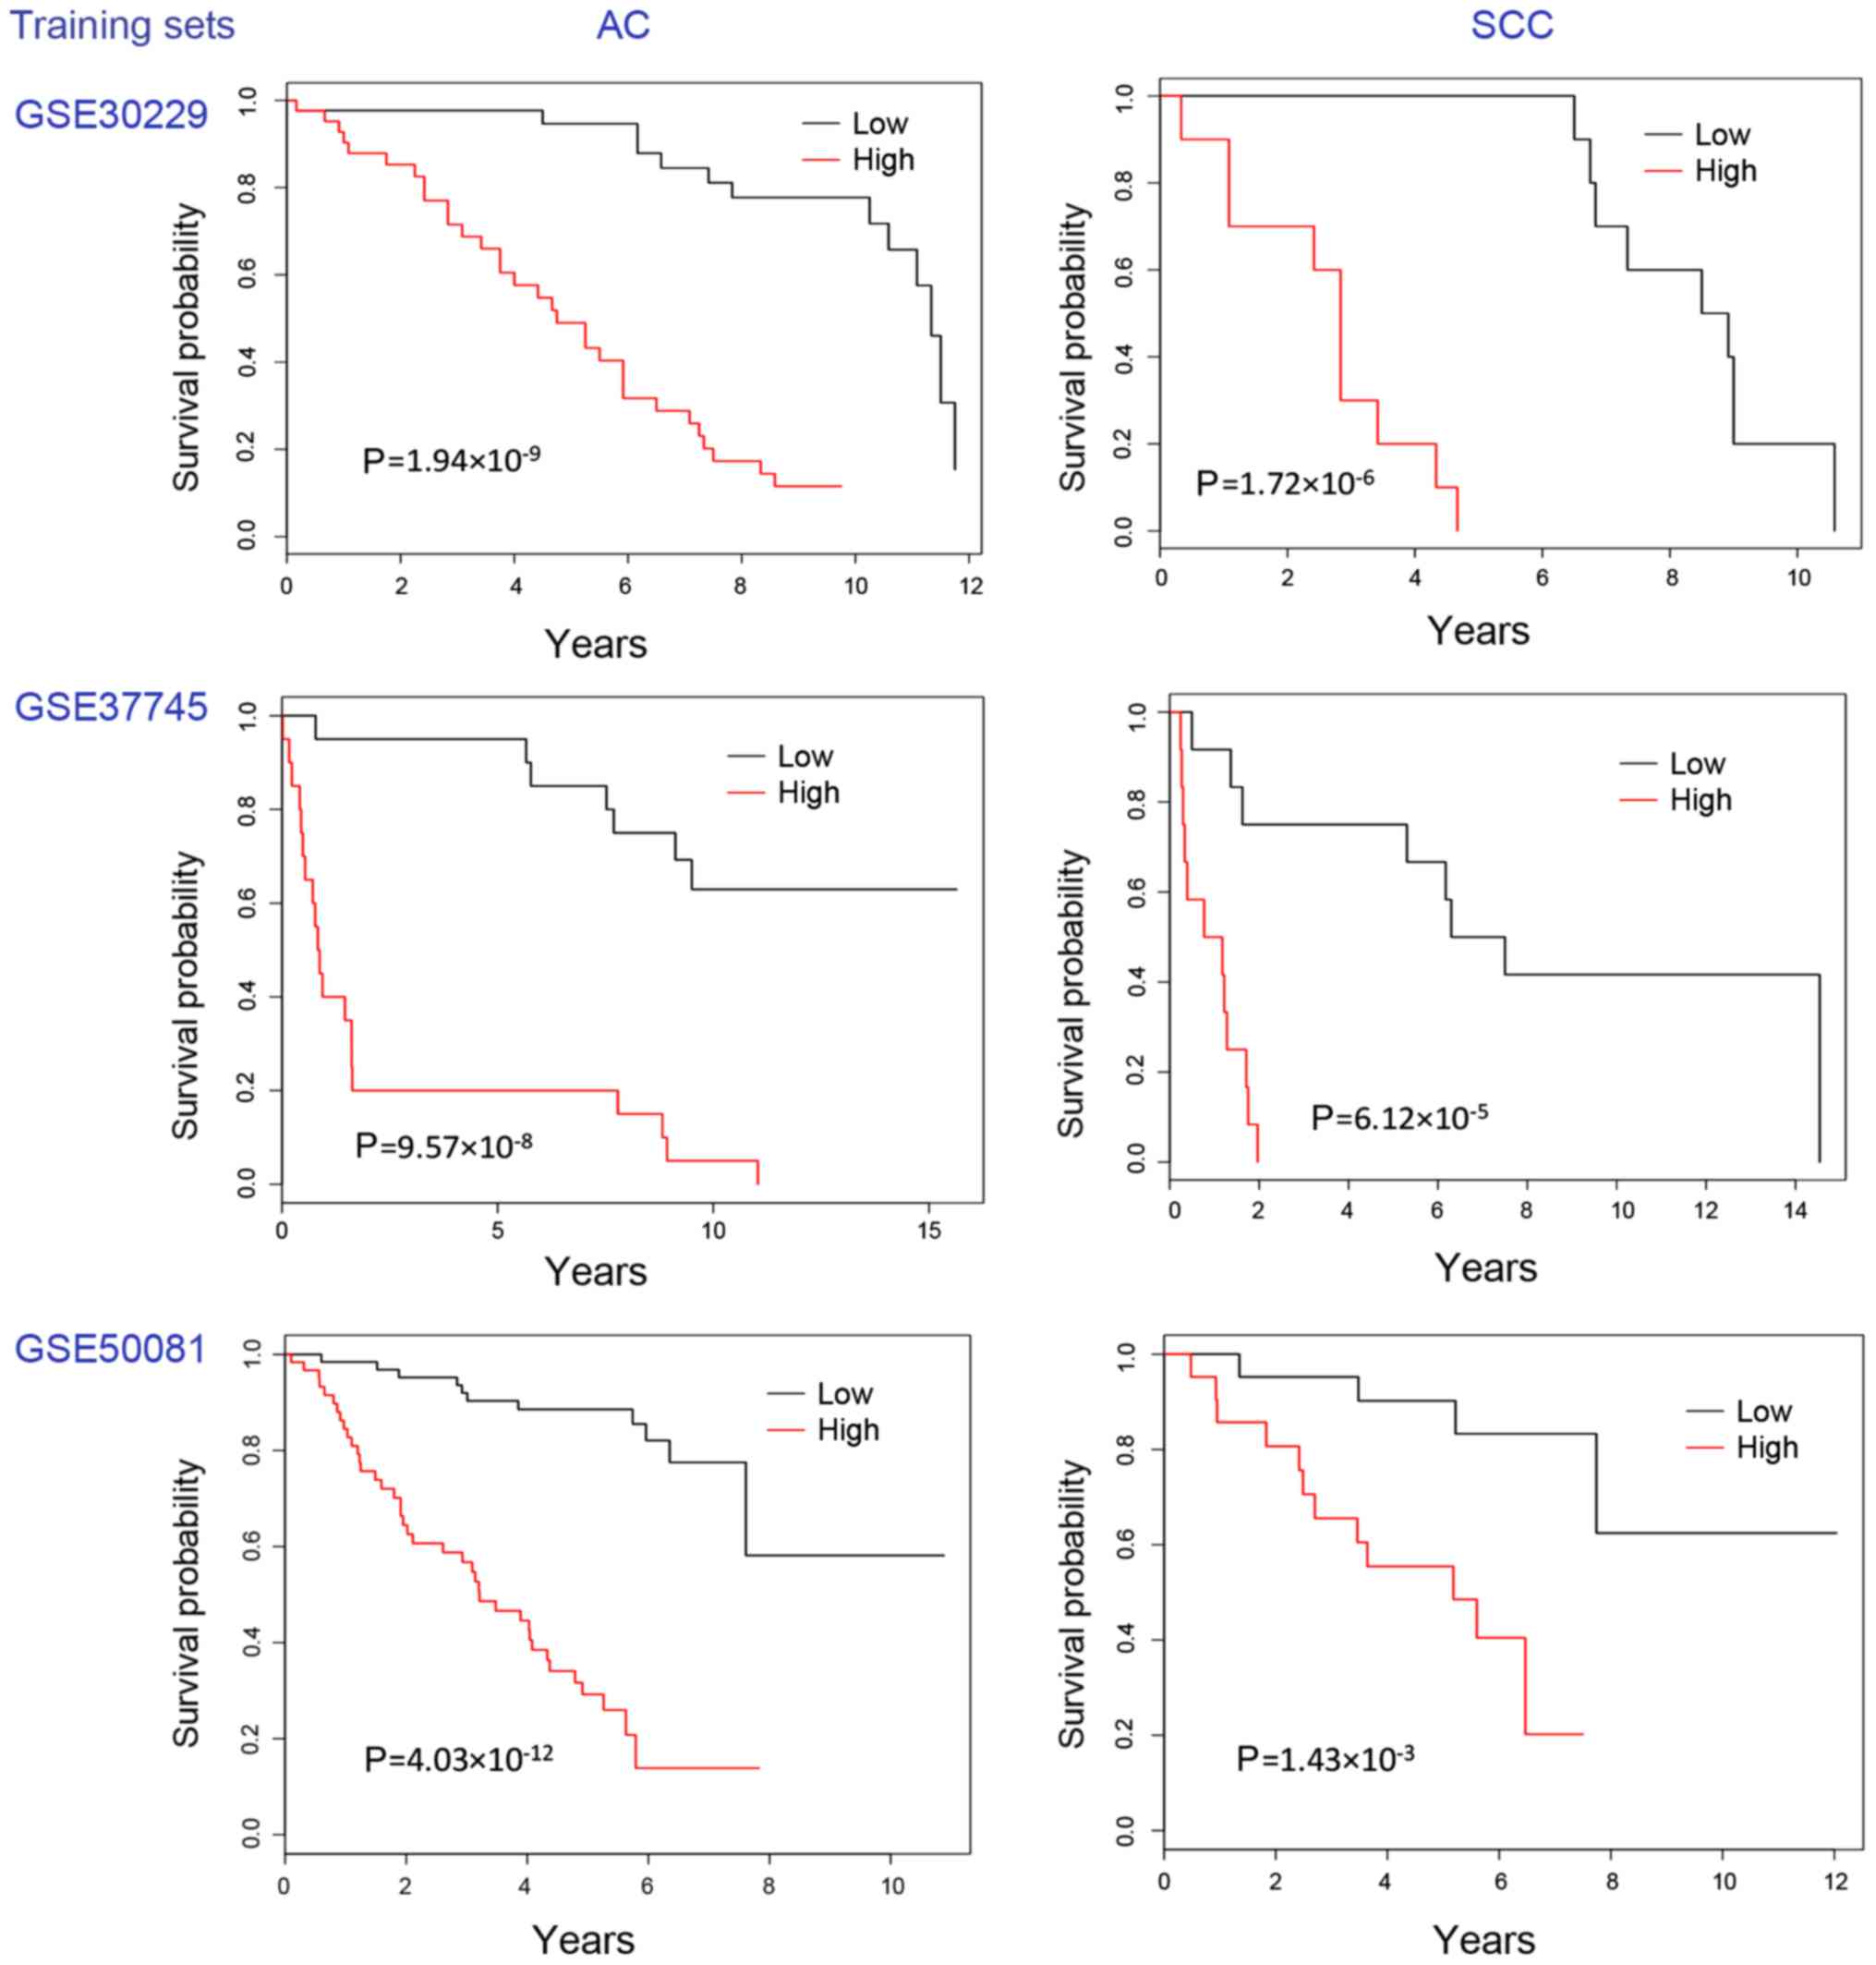
The meta Cox-filter method with RGE identified a
24-gene AC-specific prognostic signature and a 12-gene SCC-specific
prognostic signature. The Kaplan-Meier plots of the two signatures
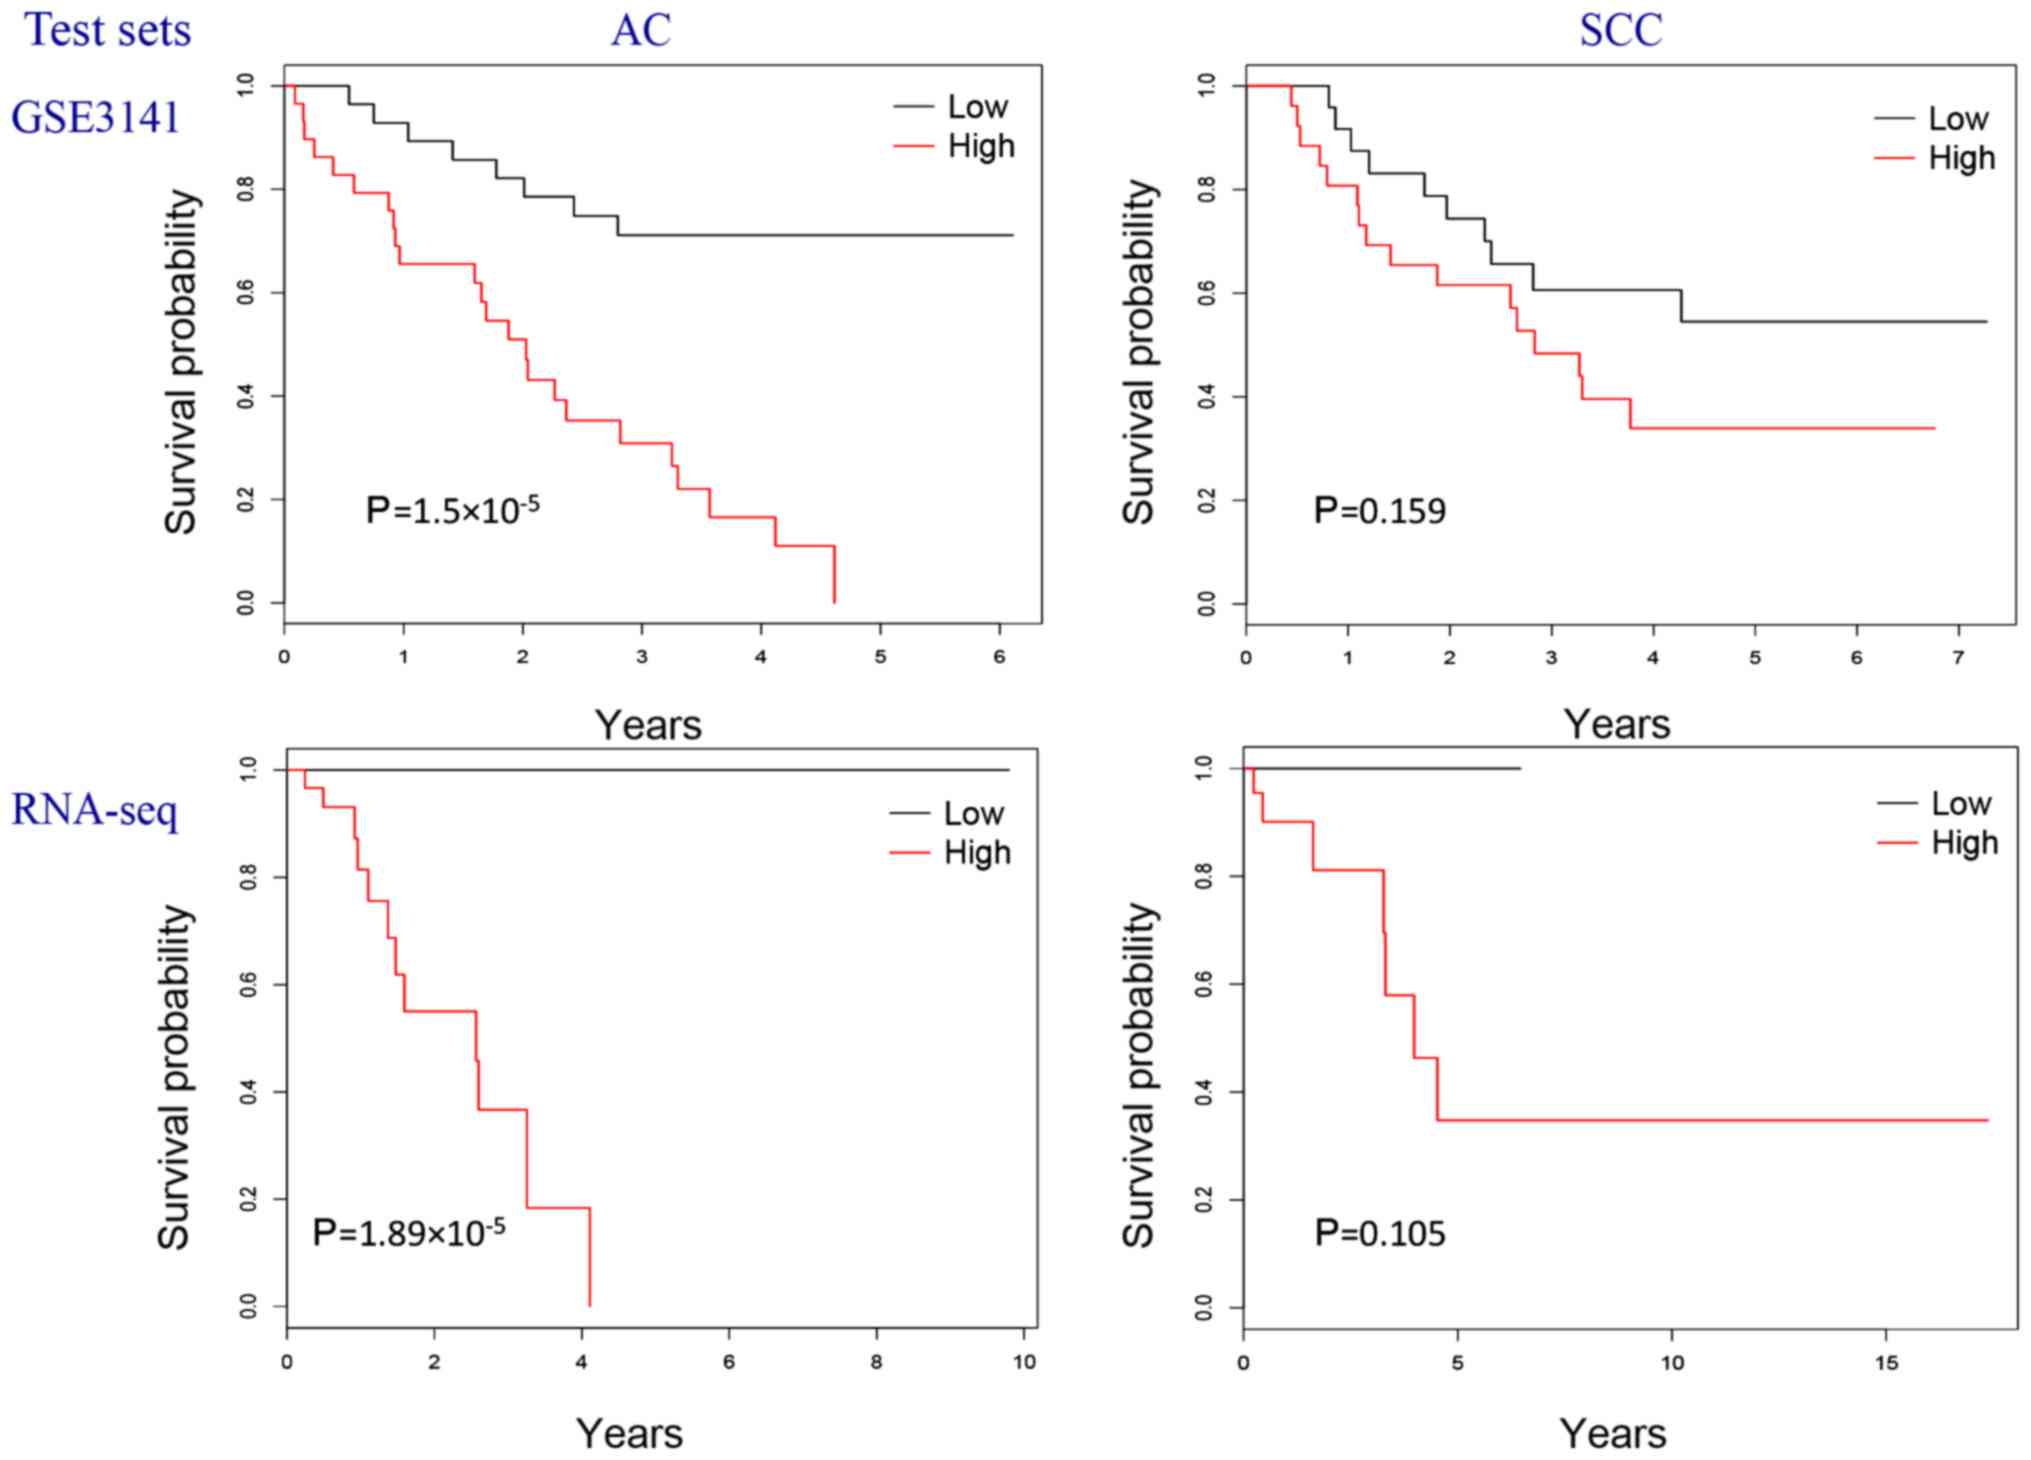
on the three training sets are presented in Fig. 1 and those on the two test sets are
presented in Fig. 2. Using two
independent studies, the GSE3141 dataset (31) and the TCGA RNA-Seq data (under the
cohorts of LUAD and LUSC), the resulting gene lists were
demonstrated to have a good predictive performance. Therefore, the
results of the present study have good generalization. The genes of
the 24-gene AC-specific prognostic signature and the 12-gene
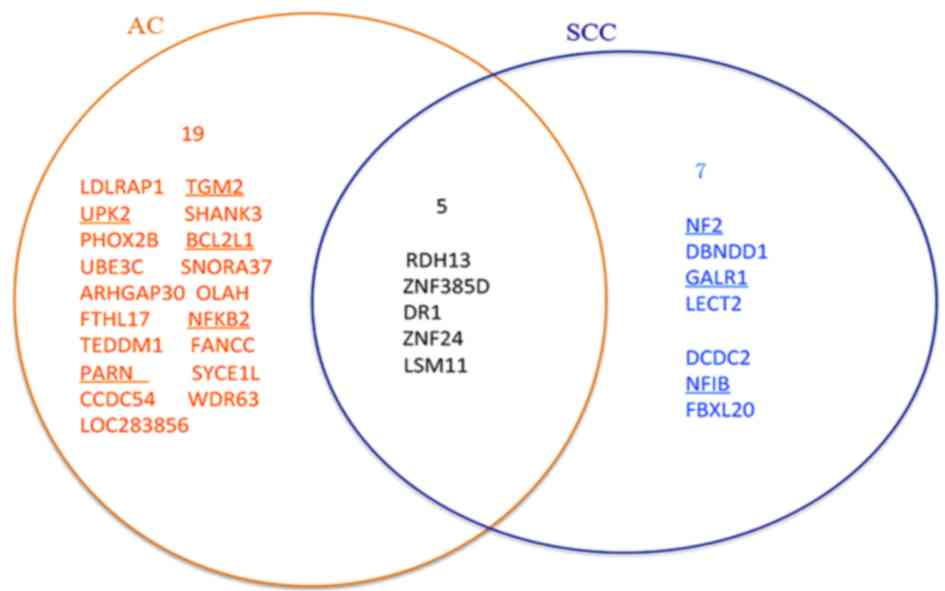
SCC-specific prognostic signature are presented in Fig. 3 with those directly associated with
lung cancer underlined. Using these two gene lists, clinicians may
design corresponding diagnostic kits to calculate the risk score
for a patient with NSCLC and predict the prognosis, and ultimately
allow for the possibility of a more ‘personalized’ treatment.
Therefore, the results of the present study are clinically
important.
The Venn-diagram in Fig.
3 indicates there five genes [retinol dehydrogenase 13 (RDH13),
zinc finger protein 24 (ZNF24), LSM11 U7 small nuclear RNA
associated (LSM11), down-regulator of transcription 1 (DR1) and
zinc finger protein 385D] overlapping between the two sets of
signatures. According to the GeneCards database (29), none of the five overlapped genes are
directly associated with lung cancer. However, all of them are
indirectly associated with lung cancer as shown by the GeneCards
database (29). For example, RDH13
and ZNF24 interact with a well-known cancer-associated gene tumor
protein 53 (TP53) which encodes a tumor suppressor protein that
contains transcriptional activation, DNA binding and
oligomerization domains. Mutations in TP53 are associated with a
several types of of human cancer. Furthermore, the GeneCards
database (29) indicates these five
genes are associated with other well-known cancer-associated genes.
Specifically, LSM11 is associated with KRAS proto-oncogene GTPase
(KRAS), epidermal growth factor receptor (EGFR) and signal
transducer and activator of transcription 3. RDH13 interplays with
EGFR and MET proto-oncogene, receptor tyrosine kinase, and ZNF24
interplays with KRAS and vascular endothelial growth factor (VEGF)
A and phosphatase and tensin homolog, and DR1 is targeted by Jun
proto-oncogene, AP-1 transcription factor subunit. All these
well-known genes are associated with lung cancer. For example, EGFR
was revealed to be involved in the development and progression of
lung cancer (44) and VEGF gene
polymorphism serves a role in the development of lung cancer
(45).
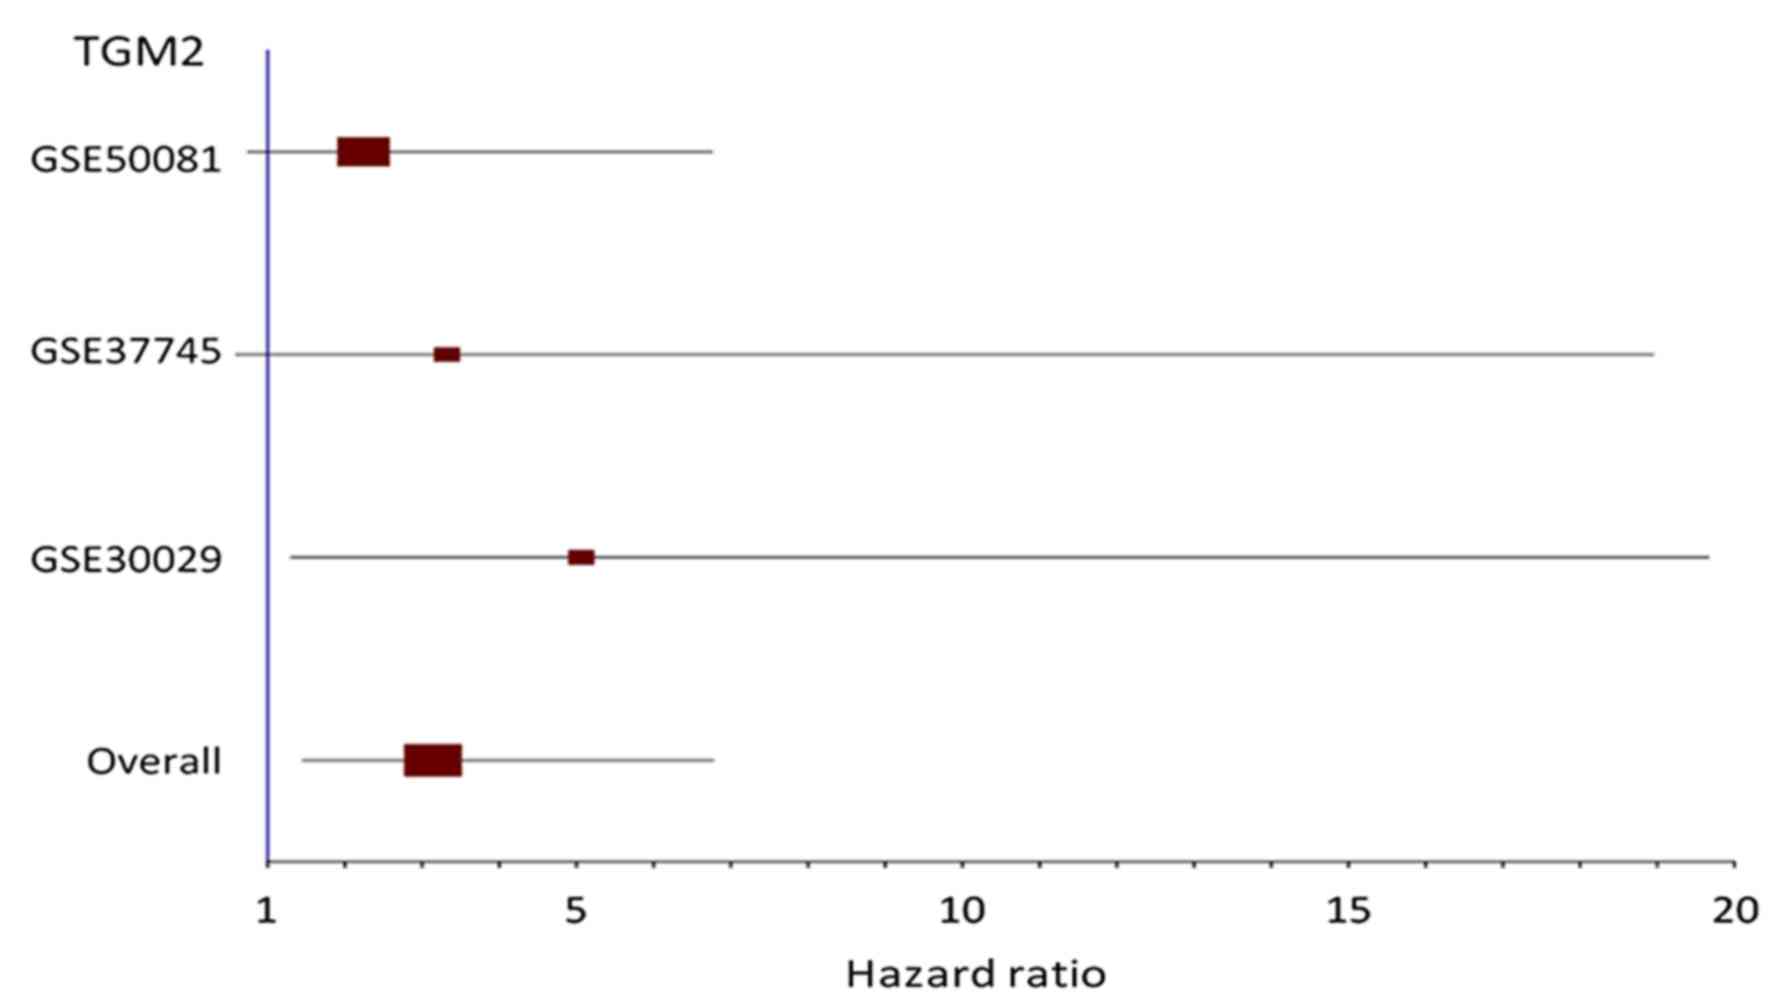
Choi et al (46) conducted a multivariate analysis that
demonstrated a significant correlation between strong
transglutaminase 2 (TGM2) expression and shorter disease-free
survival in patients with NSCLC and the non-adenocarcinoma subtype,
and the correlation in the patients with the adenocarcinoma was not
significant. However, the present study identified TGM2 as a
hazardous gene for the AC subtype by the meta Cox-filter methods
with and without RGE. The forest plot for this gene is presented in
Fig. 4 and it demonstrates that the
hazard ratios of TGM2 in all individual studies were positive, but
only that of the GSE30029 dataset was significant (P<0.05). A
meta-analysis model increases statistical power, so that
consistently hazardous but not statistically significant effects
across studies become statistically meaningful when taken together.
Further investigation on the prognostic value of TGM2 for the AC
subtype is required.
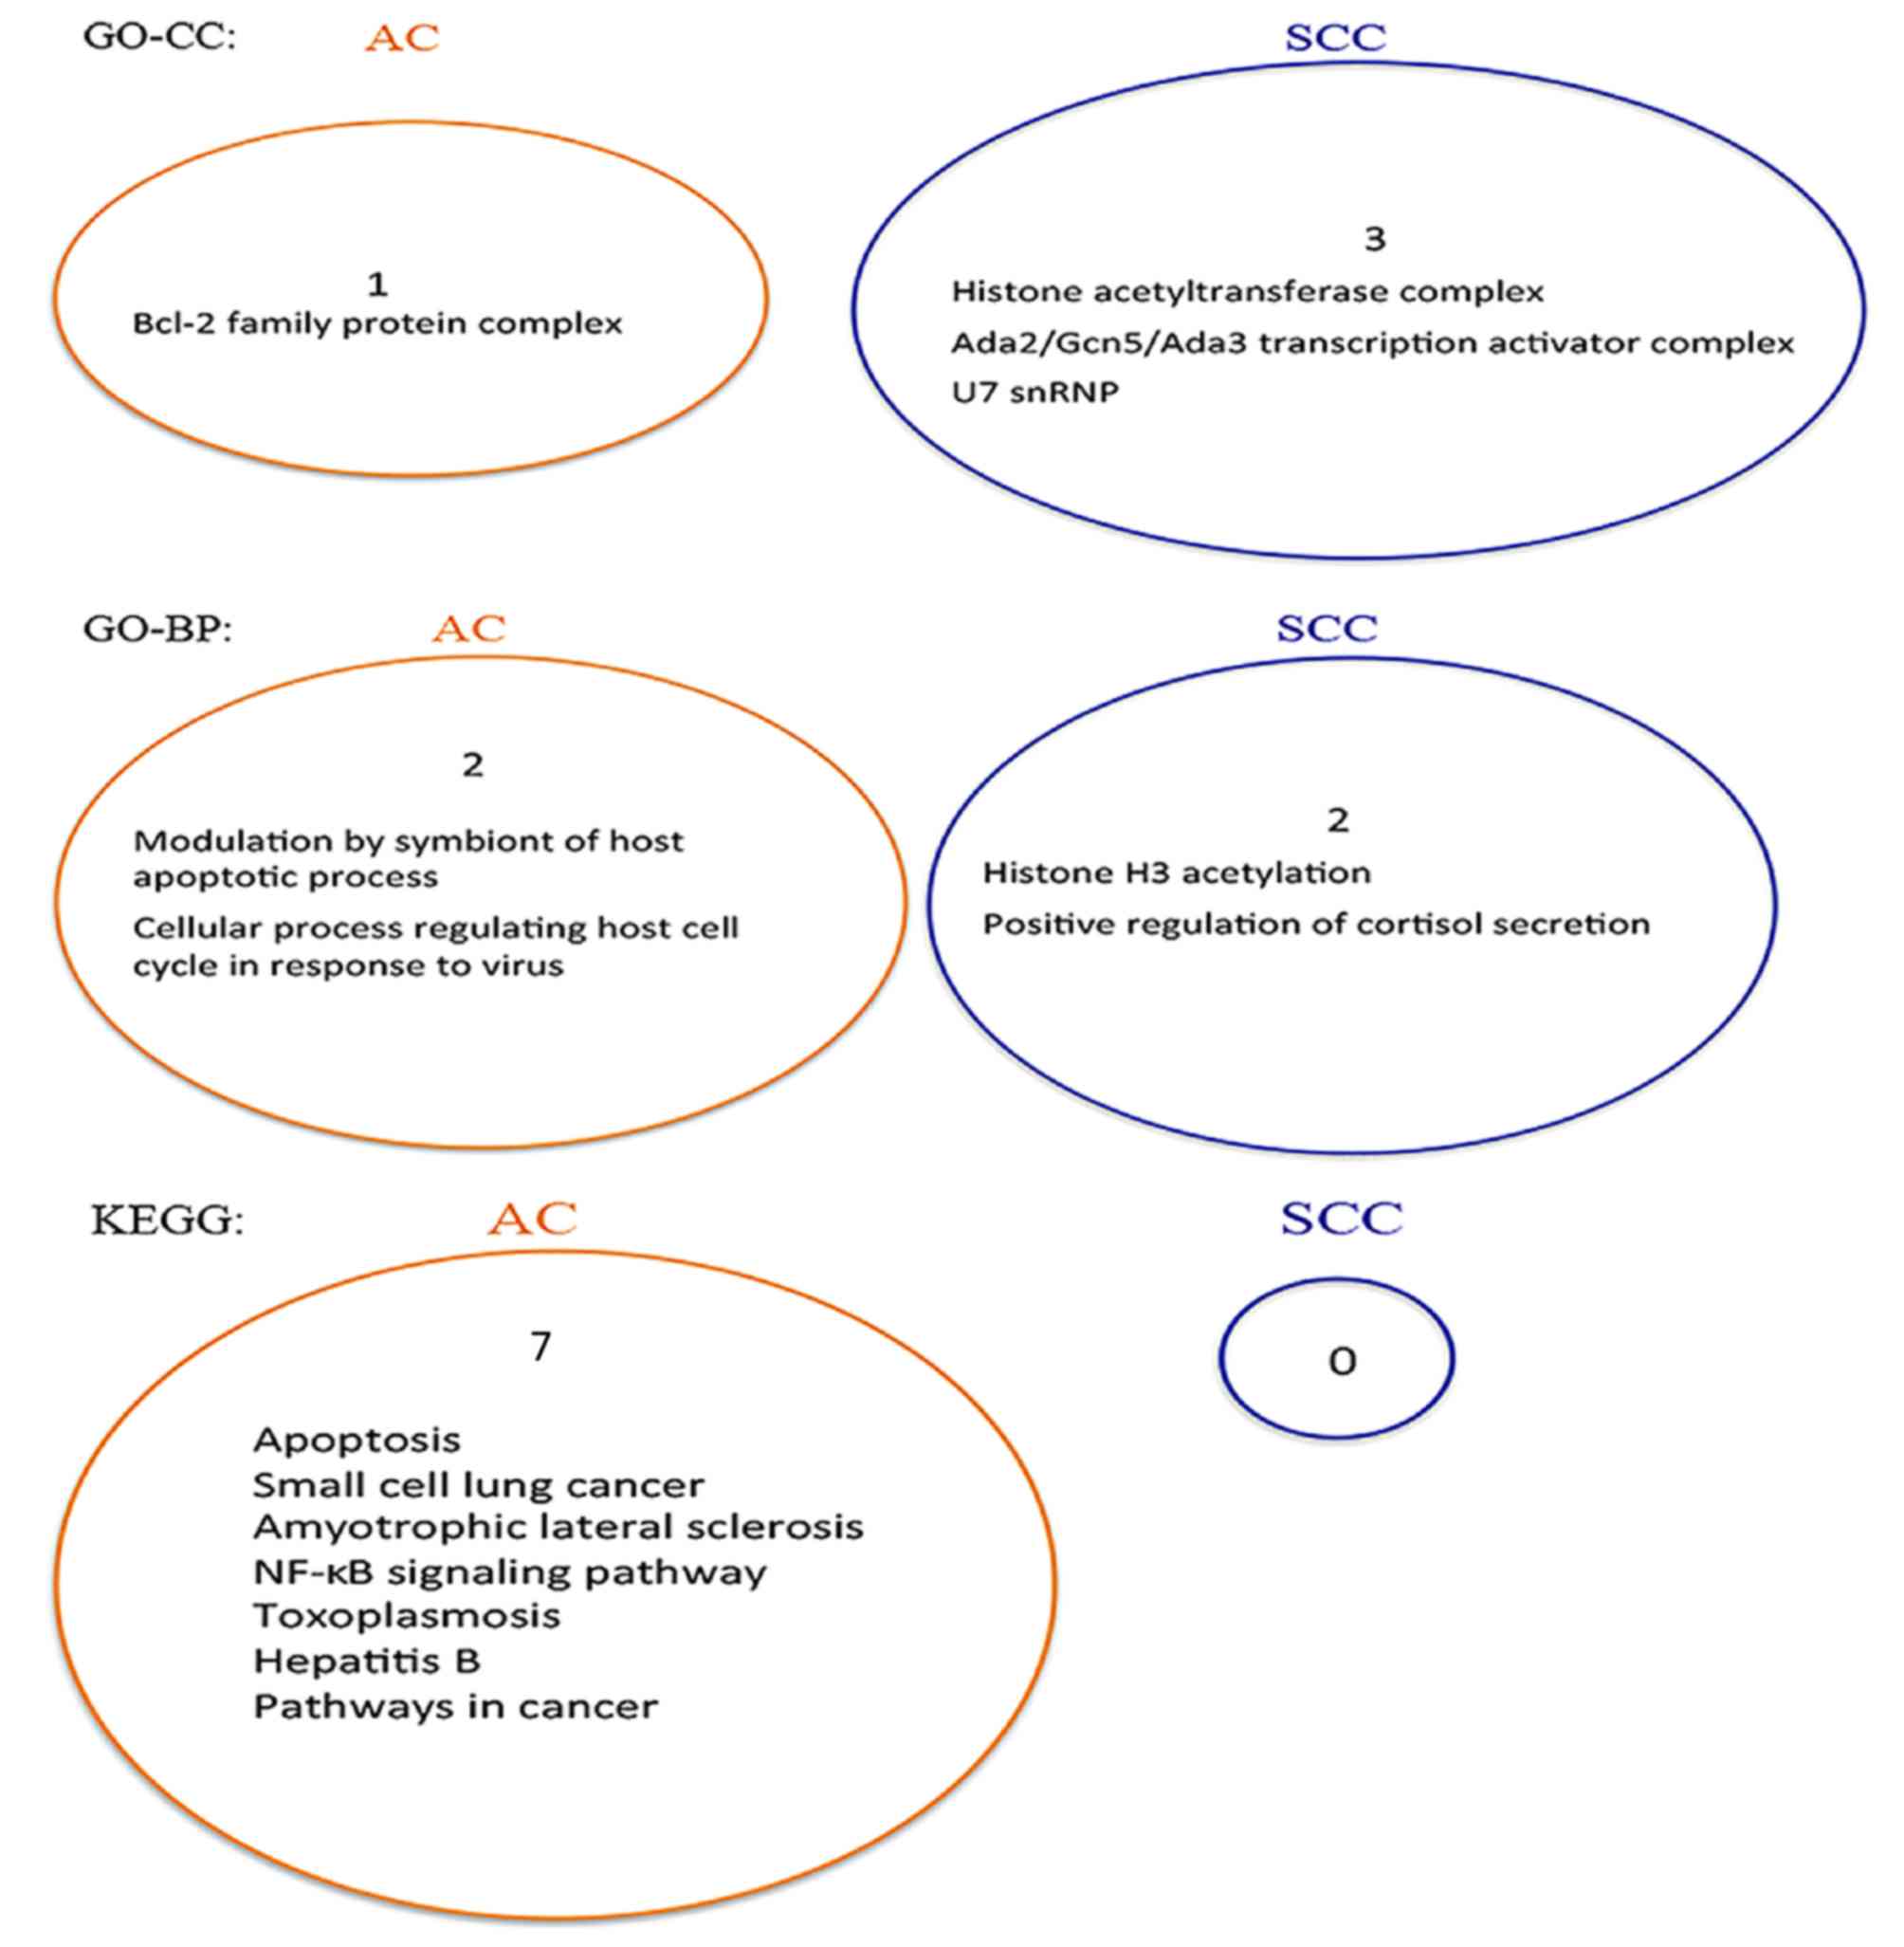
In the present study, STRING software (39) was used to search for the GO terms
(40) and the KEGG pathways
(41) that were enriched by the
AC-and the SCC-specific prognostic signatures. The results are
presented in Fig. 5. The figure
shows that there is no overlap between the two sets of enriched
gene sets for GO terms and KEGG pathways, respectively. Therefore,
the pathways enriched by these two gene signatures are
subtype-specific.
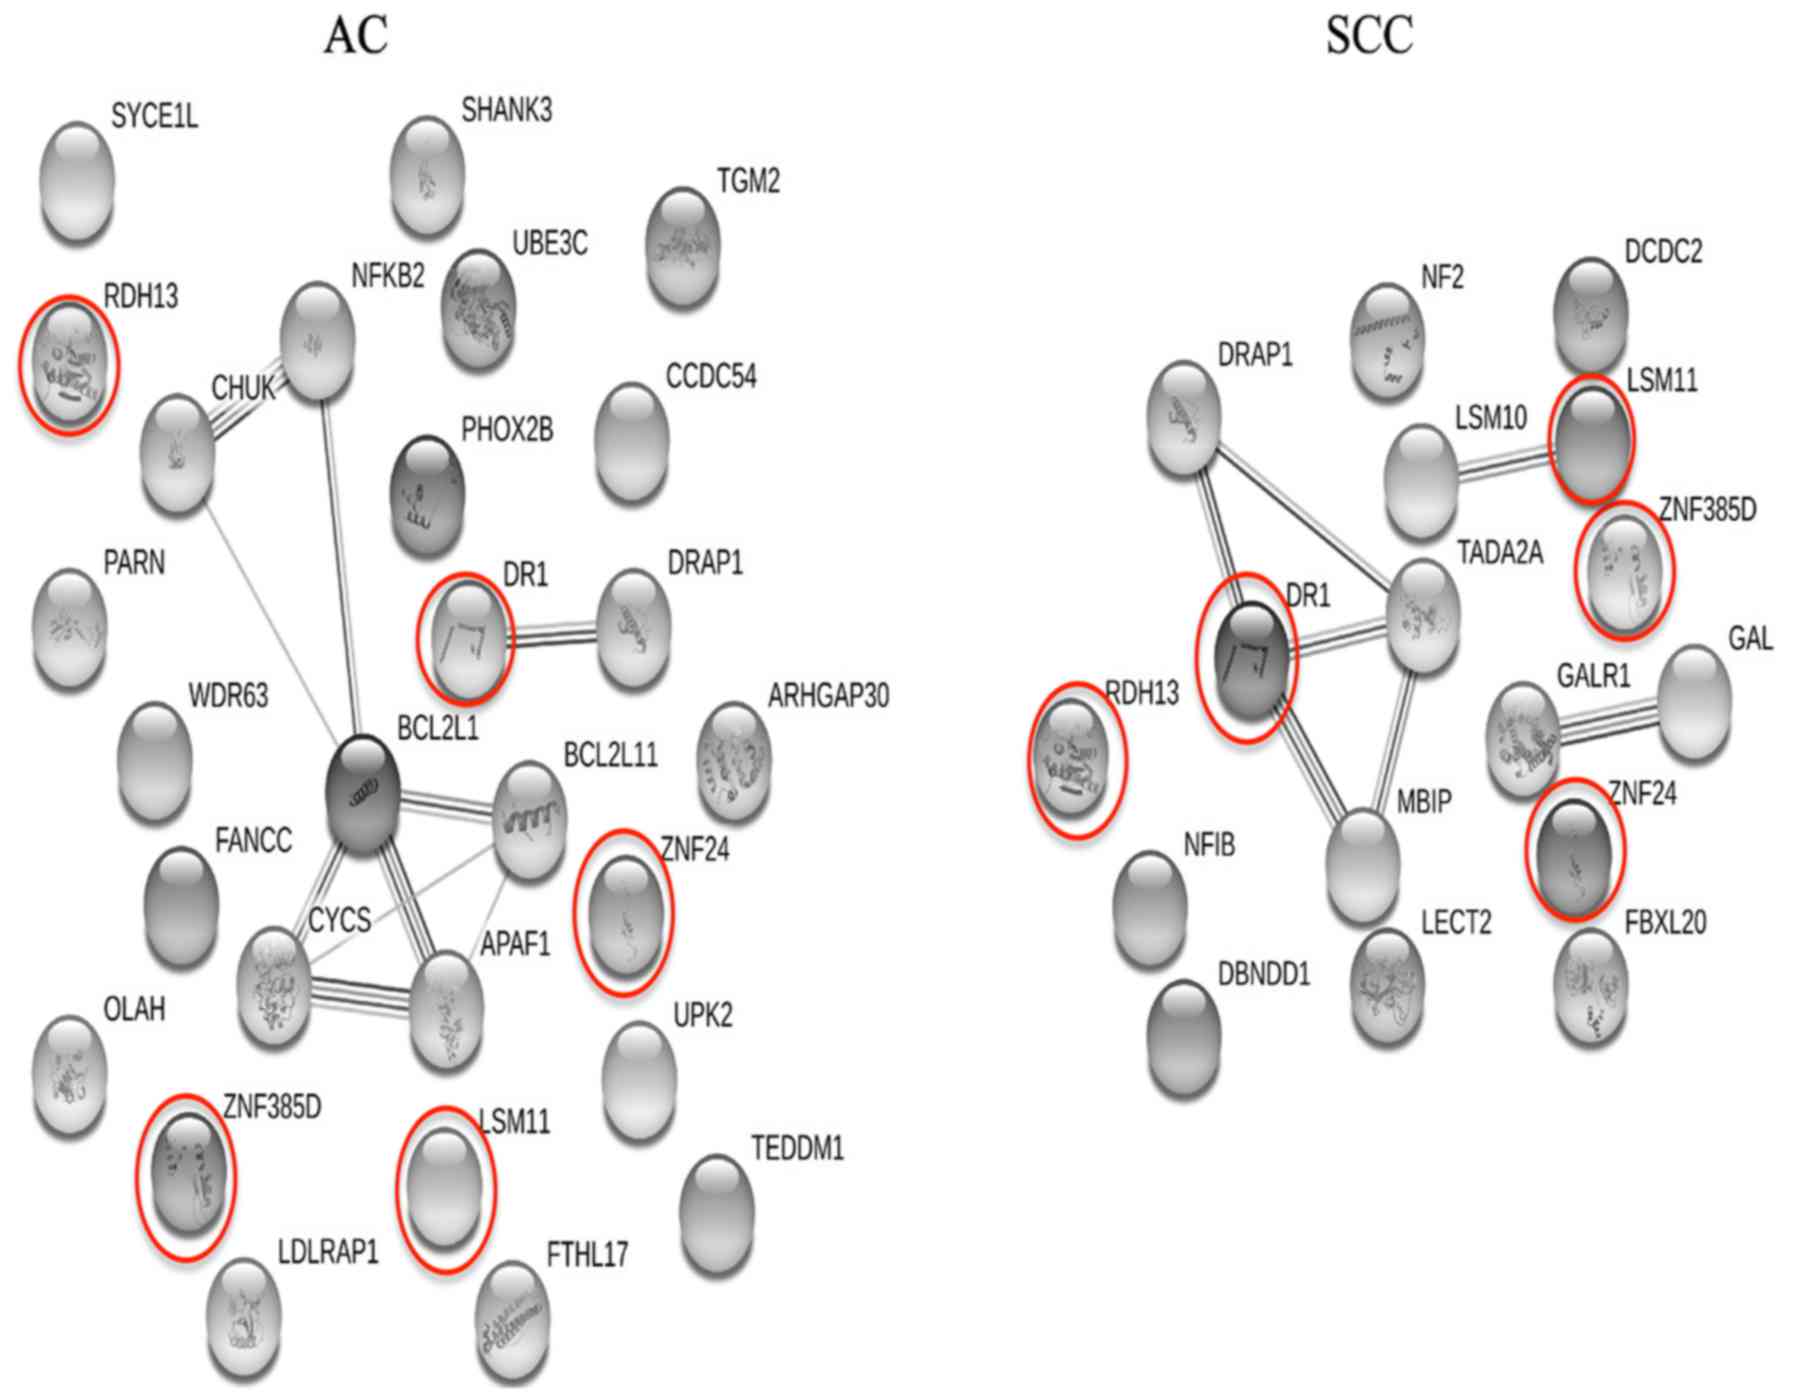
Subsequently, gene-to-gene interaction networks for
the AC- and SCC-specific gene signatures were constructed using the
String database, which show how the genes identified in the present
study are connected or interplay, and are shown in Fig. 6. If the genes used to construct a
network are highly associated with each other, there would be a
number of edges (lines to connect a gene pair) in the resulting
network instead of numerous isolated genes. As shown in Fig. 6, the majority of the subtype-specific
genes identified are isolated from one another, indicating that
these genes are independent from each other and thus have
independent prognostic values. This implies that the RGE step
screens out numerous highly associated genes, which are more likely
to be redundant, from the final gene lists. Therefore, the proposed
procedure for RGE is effective.
Compared with the meta Cox-filter method without
RGE, the meta Cox-filter method with RGE was superior with regards
to the two performance statistics under consideration, particularly
for the AC subtype. Thus, the RGE step is of critical importance in
the process of feature selection. The estimates of these
performance statistics on the two test sets for both the meta
Cox-filter method and the meta Cox-filter method with RGE are
presented in Table III. Based on
these statistics, the gene signatures trained from the data on one
platform can be applied to a different platform. Similarly, the
generalization of the gene signatures to the expression values
obtained using different pre-processing procedures was
achieved.
| Table III.Performance statistics of the
proposed procedure on two independent test sets. |
Table III.
Performance statistics of the
proposed procedure on two independent test sets.
|
| C-index | P-value |
|---|
|
|
|
|
|---|
|
| GSE3141 | RNA-seq | GSE3141 | RNA-seq |
|---|
|
|
|
|
|
|
|---|
| Method | AC | SCC | AC | SCC | AC | SCC | AC | SCC |
|---|
| mCox-filter with
RGE | 0.857 | 0.659 | 0.814 | 0.680 |
1.50×10⁻⁵ | 0.159 |
1.89×10⁻⁵ | 0.105 |
| mCox-filter without
RGE | 0.752 | 0.714 | 0.797 | 0.742 | 0.016 | 0.323 | 0.041 | 0.322 |
Feature selection in the framework of meta-analysis
combines meta-analysis with the feature selection process and thus
performs meta-analysis feature selection for multiple datasets. It
has a notable advantage over the methods of implementing a specific
feature selection algorithm for individual studies and then taking
the intersection of the gene signatures given by individual
studies. Namely, it can select the same set of genes across
multiple experiments. The proposed procedure in the present study
and the meta threshold gradient descent regularization (MTGDR)
method (47) belong to the meta
feature selection category. However, the proposed procedure, a
simple combination of the Cox-filter method and a meta-analysis on
the summary statistics (i.e., β coefficients), is not as
complicated as the MTGDR method. Compared with the MTGDR method,
therefore, the proposed procedure is easier to understand and
implement. The proposed method is potentially a superior choice
when a researcher aims to identify the subtype-specific prognostic
genes using multiple related gene expression datasets. Therefore,
the results of the present study have potential for clinical
application.
RGE is an important aspect of the feature selection
process (48). Consistent with
previous studies (49–51), the present study demonstrated that
the RGE step is beneficial by improving the predictive performance,
downscaling the sizes of the final gene signatures and increasing
model parsimony, thus facilitating the experimental validations.
Therefore, the additional consideration of deleting redundant genes
is highly recommended, particularly when a filter method is
utilized to perform feature selection. This is because filters
generally screen genes one by one according to their relevance
scores with the outcome of interest and thus lead to a high false
positive rate by including numerous redundant genes (52).
Supplementary Material
Supporting Data
Acknowledgements
Not applicable.
Funding
The current study was supported by the National
Natural Science Foundation of China (grant no. 31401123).
Availability of data and materials
The datasets used in the present study are
available in the GEO database (www.ncbi.nlm.nih.gov/geo) or the TCGA database
(tcga-data.nci.nih.gov/tcga).
Authors' contributions
ST conceived the study. LW, CL, TW and ST performed
the data analyses and interpreted the results. ST, CL, LW and TW
wrote the manuscript.
Ethics approval and consent to
participate
Not applicable.
Patient consent for publication
Not applicable.
Competing interests
The authors declare that they have no competing
interests.
References
|
1
|
Lu C, Onn A and Vaporciyan A: 78: Cancer
of the lung. In: Holland-Frei Cancer Medicine. 8th edition.
People's Medical Publishing House. 2010.
|
|
2
|
Crinò L, Weder W, van Meerbeeck J and
Felip E; ESMO Guidelines Working Group, : Early stage and locally
advanced (non-metastatic) non-small-cell lung cancer: ESMO clinical
practice guidelines for diagnosis, treatment and follow-up. Ann
Oncol. 21 (Suppl 5):v103–v115. 2010. View Article : Google Scholar : PubMed/NCBI
|
|
3
|
Yokoi K, Taniguchi T, Usami N, Kawaguchi
K, Fukui T and Ishiguro F: Surgical management of locally advanced
lung cancer. Gen Thorac Cardiovasc Surg. 62:522–530. 2014.
View Article : Google Scholar : PubMed/NCBI
|
|
4
|
Biomarkers Definitions Working Group, :
Biomarkers and surrogate endpoints: Preferred definitions and
conceptual framework. Clin Pharmacol Ther. 69:89–95. 2001.
View Article : Google Scholar : PubMed/NCBI
|
|
5
|
Chan DS, Yang H, Kwan MH, Cheng Z, Lee P,
Bai L, Jiang Z, Wong C, Fong W, Leung C and Ma D: Biochimie
Structure-based optimization of FDA-approved drug methylene blue as
a c-myc G-quadruplex DNA stabilizer. Biochimie. 93:1055–1064. 2011.
View Article : Google Scholar : PubMed/NCBI
|
|
6
|
Ma DL, Lin S, Wang W, Yang C and Leung CH:
Luminescent chemosensors by using cyclometalated iridium(III)
complexes and their applications. Chem Sci. 8:878–889. 2017.
View Article : Google Scholar : PubMed/NCBI
|
|
7
|
Miao X, Wang W, Kang T, Liu J, Shiu KK,
Leung CH and Ma DL: Ultrasensitive electrochemical detection of
miRNA-21 by using an iridium(III) complex as catalyst. Biosens
Bioelectron. 86:454–458. 2016. View Article : Google Scholar : PubMed/NCBI
|
|
8
|
Tian S and Suárez-fariñas M:
Hierarchical-TGDR: Combining biological hierarchy with a
regularization method for multi-class classification of lung cancer
samples via high-throughput gene-expression data. Systems
Biomedicine. 1:93–102. 2013. View Article : Google Scholar
|
|
9
|
Ben-hamo R, Boue S, Martin F, Talikka M
and Efroni S: Classification of lung adenocarcinoma and squamous
cell carcinoma samples based on their gene expression profile in
the sbv IMPROVER diagnostic signature challenge. Systems
Biomedicine. 1:83–92. 2013. View Article : Google Scholar
|
|
10
|
Tian S: Classification and survival
prediction for early-stage lung adenocarcinoma and squamous cell
carcinoma patients. Oncol Lett. 14:5464–5470. 2017.PubMed/NCBI
|
|
11
|
Tarca AL, Lauria M, Unger M, Bilal E, Boue
S, Kumar Dey K, Hoeng J, Koeppl H, Martin F, Meyer P, et al:
Strengths and limitations of microarray-based phenotype prediction:
Lessons learned from the IMPROVER diagnostic signature challenge.
Bioinformatics. 29:2892–2899. 2013. View Article : Google Scholar : PubMed/NCBI
|
|
12
|
Mramor M, Leban G, Demsar J and Zupan B:
Visualization-based cancer microarray data classification analysis.
Bioinformatics. 23:2147–2154. 2007. View Article : Google Scholar : PubMed/NCBI
|
|
13
|
Zhang L, Wang L, Du B, Wang T, Tian P and
Tian S: Classification of non-small cell lung cancer using
significance analysis of microarray-gene set reduction algorithm.
Biomed Res Int. 2016:24916712016.PubMed/NCBI
|
|
14
|
Boutros PC, Lau SK, Pintilie M, Liu N,
Shepherd FA, Der SD, Tsao MS, Penn LZ and Jurisica I: Prognostic
gene signatures for non-small-cell lung cancer. Proc Natl Acad Sci
USA. 106:2824–2828. 2009. View Article : Google Scholar : PubMed/NCBI
|
|
15
|
Zhu CQ, Ding K, Strumpf D, Weir BA,
Meyerson M, Pennell N, Thomas RK, Naoki K, Ladd-Acosta C, Liu N, et
al: Prognostic and predictive gene signature for adjuvant
chemotherapy in resected non-small-cell lung cancer. J Clin Oncol.
28:4417–4424. 2010. View Article : Google Scholar : PubMed/NCBI
|
|
16
|
Der SD, Sykes J, Pintilie M, Zhu CQ,
Strumpf D, Liu N, Jurisica I, Shepherd FA and Tsao MS: Validation
of a histology-independent prognostic gene including stage ia
patients. J Thorac Oncol. 9:59–64. 2014. View Article : Google Scholar : PubMed/NCBI
|
|
17
|
Hira ZM and Gillies DF: A review of
feature selection and feature extraction methods applied on
microarray data. Adv Bioinformatics. 2015:1983632015. View Article : Google Scholar : PubMed/NCBI
|
|
18
|
Rahmatallah Y, Emmert-Streib F and Glazko
G: Gene set analysis approaches for RNA-seq data: performance
evaluation and application guideline. Brief Bioinform. 17:393–407.
2016. View Article : Google Scholar : PubMed/NCBI
|
|
19
|
Hrdlickova R, Toloue M and Tian B: RNA-Seq
mthods for transcriptome analysis. Wiley Interdsicrip Rev RNA.
8:e13642017. View Article : Google Scholar
|
|
20
|
Law CW, Chen Y, Shi W and Smyth GK: Voom:
Precision weights unlock linear model analysis tools for RNA-seq
read counts. Genome Biol. 15:R292014. View Article : Google Scholar : PubMed/NCBI
|
|
21
|
Ramasamy A, Mondry A, Holmes CC and Altman
DG: Key issues in conducting a meta-analysis of gene expression
microarray datasets. PLoS Med. 5:e1842008. View Article : Google Scholar : PubMed/NCBI
|
|
22
|
Blettner M, Sauerbrei W, Schlehofer B,
Scheuchenpflug T and Friedenreich C: Traditional reviews,
meta-analyses and pooled analyses in epidemiology. Int J Epidemiol.
28:1–9. 1999. View Article : Google Scholar : PubMed/NCBI
|
|
23
|
Liu J, Huang J and Ma S: Integrative
analysis of multiple cancer genomic datasets under the
heterogeneity model. Stat Med. 32:3509–3521. 2013. View Article : Google Scholar : PubMed/NCBI
|
|
24
|
Krzystanek M, Moldvay J, Szüts D, Szallasi
Z and Eklund AC: A robust prognostic gene expression signature for
early stage lung adenocarcinoma. Biomark Res. 4:42016. View Article : Google Scholar : PubMed/NCBI
|
|
25
|
Lu Y, Lemon W, Liu PY, Yi Y, Morrison C,
Yang P, Sun Z, Szoke J, Gerald WL, Watson M, et al: A gene
expression signature predicts survival of patients with stage I
non-small cell lung cancer. PLoS Med. 3:e4672006. View Article : Google Scholar : PubMed/NCBI
|
|
26
|
Skrzypski M, Dziadziuszko R, Jassem E,
Szymanowska-Narloch A, Gulida G, Rzepko R, Biernat W, Taron M,
Jelitto-Górska M, Marjański T, et al: Main histologic types of
non-small-cell lung cancer differ in expression of
prognosis-related genes. Clin Lung Cancer. 14:666–673. 2013.
View Article : Google Scholar : PubMed/NCBI
|
|
27
|
Tian S, Wang C and An MW: Test on
existence of histology subtype-specific prognostic signatures among
early stage lung adenocarcinoma and squamous cell carcinoma
patients using a Cox-model based filter. Biol Direct. 10:152015.
View Article : Google Scholar : PubMed/NCBI
|
|
28
|
Tian S: Identification of subtype-specific
prognostic genes for early-stage lung adenocarcinoma and squamous
cell carcinoma patients using an embedded feature selection
algorithm. PLoS One. 10:e01346302015. View Article : Google Scholar : PubMed/NCBI
|
|
29
|
Safran M, Dalah I, Alexander J, Rosen N,
Stein TI, Shmoish M, Nativ N, Bahir I, Doniger T, Krug H, et al:
GeneCards Version 3: The human gene integrator. Database (Oxford).
2010:baq0202010. View Article : Google Scholar : PubMed/NCBI
|
|
30
|
Zeng XQ, Li GZ, Yang JY, Yang MQ and Wu
GF: Dimension reduction with redundant gene elimination for tumor
classification. BMC Bioinformatics. 9 (Suppl 6):S82008. View Article : Google Scholar : PubMed/NCBI
|
|
31
|
Bild AH, Yao G, Chang JT, Wang Q, Potti A,
Chasse D, Joshi M, Harpole D, Lancaster JM, Berchuck A, et al:
Oncogenic pathway signatures in human cancers as a guide to
targeted therapies. Nature. 439:353–357. 2006. View Article : Google Scholar : PubMed/NCBI
|
|
32
|
Botling J, Edlund K, Lohr M, Hellwig B,
Holmberg L, Lambe M, Berglund A, Ekman S, Bergqvist M, Pontén F, et
al: Biomarker discovery in non-small cell lung cancer: Integrating
gene expression profiling, meta-analysis and tissue microarray
validation. Clin Cancer Res. 19:194–204. 2013. View Article : Google Scholar : PubMed/NCBI
|
|
33
|
Rousseaux S, Debernardi A, Jacquiau B,
Vitte A, Vesin A, Nagy-mignotte H, Moro-sibilot D, Brichon P,
Hainaut P, Laffaire J, et al: Ectopic activation of germline and
placental genes identifies aggressive metastasis-prone lung
cancers. Sci Transl Med. 5:186ra662013. View Article : Google Scholar : PubMed/NCBI
|
|
34
|
McCall MN, Bolstad BM and Irizarry RA:
Frozen robust multiarray analysis (fRMA). Biostatistics.
11:242–253. 2010. View Article : Google Scholar : PubMed/NCBI
|
|
35
|
Smyth GK: Limma: linear models for
microarray data. In: Bioinformatics and Computational Biology
Solutions Using R and Bioconductor. Gentleman R, Carey V, Dudoit S,
Irizarry R and Huber W: Springer; New York, NY: pp. 397–420.
2005
|
|
36
|
DerSimonian R and Laird NM: Meta-analysis
in clinical trials. Control Clin Trials. 7:177–188. 1986.
View Article : Google Scholar : PubMed/NCBI
|
|
37
|
Choi JK, Yu U, Kim S and Yoo OJ: Combining
multiple microarray studies and modeling interstudy variation.
Bioinformatics. 19 (Suppl 1):i84–i90. 2003. View Article : Google Scholar : PubMed/NCBI
|
|
38
|
Benjamini Y and Hochberg Y: Controlling
the false discovery rate: A practical and powerful approach to
multiple testing. J Roy Statist Soc. 57:289–300. 1995.
|
|
39
|
Franceschini A, Szklarczyk D, Frankild S,
Kuhn M, Simonovic M, Roth A, Lin J, Minguez P, Bork P, von Mering C
and Jensen LJ: STRING v9.1: Protein-protein interaction networks,
with increased coverage and integration. Nucleic Acids Res 41
(Database Issue). D808–D815. 2013.
|
|
40
|
Ashburner M, Ball CA, Blake JA, Botstein
D, Butler H, Cherry JM, Davis AP, Dolinski K, Dwight SS, Eppig JT,
et al: Gene ontology: Tool for the unification of biology. The gene
ontology consortium. Nat Genet. 25:25–29. 2000. View Article : Google Scholar : PubMed/NCBI
|
|
41
|
Ogata H, Goto S, Sato K, Fujibuchi W, Bono
H and Kanehisa M: KEGG: Kyoto encyclopedia of genes and genomes.
Nucleic Acids Res. 27:29–34. 1999. View Article : Google Scholar : PubMed/NCBI
|
|
42
|
Uno H, Cai T, Pencina MJ, D'Agostino RB
and Wei LJ: On the C-statistics for evaluating overall adequacy of
risk prediction procedures with censored survival data. Stat Med.
30:1105–1117. 2011.PubMed/NCBI
|
|
43
|
Laimighofer M, Krumsiek J, Buettner F and
Theis FJ: Unbiased prediction and feature selection in
high-dimensional survival regression. J Comput Biol. 23:279–290.
2016. View Article : Google Scholar : PubMed/NCBI
|
|
44
|
Zhang W, Stabile LP, Keohavong P, Romkes
M, Grandis JR, Traynor AM and Siegfried JM: Mutation and
polymorphism in the EGFR-TK domain associated with lung cancer. J
Thorac Oncol. 1:635–647. 2006. View Article : Google Scholar : PubMed/NCBI
|
|
45
|
Liu J, Yang XY and Shi WJ: Identifying
differentially expressed genes and pathways in two types of
non-small cell lung cancer: Adenocarcinoma and squamous cell
carcinoma. Genet Mol Res. 13:95–102. 2014. View Article : Google Scholar : PubMed/NCBI
|
|
46
|
Choi CM, Jang SJ, Park SY, Choi YB, Jeong
JH, Kim DS, Kim HK, Park KS, Nam BH, Kim HR, et al:
Transglutaminase 2 as an independent prognostic marker for survival
of patients with non-adenocarcinoma subtype of non-small cell lung
cancer. Mol Cancer. 10:1192011. View Article : Google Scholar : PubMed/NCBI
|
|
47
|
Ma S and Huang J: Regularized gene
selection in cancer microarray meta-analysis. BMC bioinformatics.
10:12009. View Article : Google Scholar : PubMed/NCBI
|
|
48
|
Zeng XQ and Li GZ: Supervised redundant
feature detection for tumor classification. BMC Med Genomics. 7
(Suppl 2):S52014. View Article : Google Scholar : PubMed/NCBI
|
|
49
|
Ge R, Zhou M, Luo Y, Meng Q, Mai G, Ma D,
Wang G and Zhou F: McTwo: A two-step feature selection algorithm
based on maximal information coefficient. BMC Bio. 1–14. 2016.
|
|
50
|
Gu JL, Lu Y, Liu C and Lu H: Multiclass
classification of sarcomas using pathway based feature selection
method. J Theor Biol. 362:3–8. 2014. View Article : Google Scholar : PubMed/NCBI
|
|
51
|
Tian S: Identification of subtype-specific
prognostic signatures using Cox models with redundant gene
elimination. Oncol Lett. 15:8545–8555. 2018.PubMed/NCBI
|
|
52
|
Saeys Y, Inza I and Larrañaga P: A review
of feature selection techniques in bioinformatics. Bioinformatics.
23:2507–2517. 2007. View Article : Google Scholar : PubMed/NCBI
|