Introduction
Thyroid cancer (TC) is the most prevalent type of
endocrine carcinoma worldwide (1).
The incidence of this disease peaks in the third and fourth decades
of life (2). TC originates from the
follicular epithelium in >95% of all TCs, including papillary
thyroid carcinoma (PTC; 85%), follicular thyroid carcinoma (FTC,
11%) and anaplastic thyroid carcinoma (ATC; 4%). Furthermore,
medullary thyroid cancer, which originates from the parafollicular
cells of the thyroid, accounts for <5% of all TCs (3,4).
According to the 1975–2016 Surveillance,
Epidemiology, and End Results reports (5), the incidence of PTC increased from 4.8
to 14.9 per 100,000 people. The ratio of male to female papillary
thyroid cancer is usually about 1:2.5. The highest proportion of
women in 30–50 years old patients. This sex-based disparity is also
specific to the histologic subtype of TC. Specifically, the more
aggressive subtypes TC, ATC and MTC, the more similar rates of
incidence in men and women have similar incidence rates in men and
women (6).
At present, proteomics studies mainly use the
techniques of matrix-assisted laser desorption ionization
time-of-flight mass spectrometry and surface-enhanced laser
desorption/ionization time-of-flight mass spectrometry (7). These simple methods are used to
identify spectral fingerprints for prognosis and diagnosis.
However, these methodologies offer poor sensitivity and an
inability to convincingly identify proteins (8,9). In
addition these techniques require a labor-intensive sample
preparation protocol when used for the analysis of large sample
sets (10). Alternatively, Orbitrap
Q Exactive plus is a method that can be used to screen
differentially expressed proteins; this technology combines
quadrupole ion selection with Orbitrap high-resolution scanning to
provide high-quality full-scan and tandem mass spectrometry (MS/MS)
data, yielding therefore a superior performance and operability
compared with other types of hybrid MS/MS (11).
The study of abnormal tumor lipid metabolism
represents a new field of research that has recently received
increasing interest. The crosstalk between tumor cells and
tumor-associated stromal cells can modulate the tumor high
metabolic demands. Notably, tumor cells require a high fatty acid
turnover rate to provide the energetic and synthetic requirements
for the growing tumor (12). In
addition, previous studies reported that patients' lipid profile,
including lipid molecules [cholesterol (CHO), triglycerides (TG),
high-density lipoprotein-cholesterol (HDL-C), low-density
lipoprotein-cholesterol (LDL-C), apolipoprotein A1 (ApoA1), and
apolipoprotein B (ApoB)] and their derivative indexes (LDL-C/HDL-C
ratio and ApoB/ApoA1 ratio) are associated with various types of
carcinoma (13,14).
To the best of our knowledge, only a few studies
have investigated the use of a serum lipid profile as a diagnostic
tool for TC. The present study aimed to identify a diagnostic serum
lipid profile for TC by using a proteomics-based approach with the
Orbitrap Q Exactive plus, and to validate this differential lipid
profile in a large population.
Materials and methods
Training study and participants
A total of 61 participants were recruited from the
Beijing Peking Union Medical College Hospital (PUMCH) and the
Zhejiang Cancer Hospital between February 2017 and January 2018.
Patients were divided into three groups as follows: i) 15 healthy
controls (HC); ii) 15 patients with benign thyroid nodules (TN);
and iii) 31 patients with TC. Patients with TC were further divided
into three subgroups according to tumor histological analysis and
morphology as follows: i) 15 patients with PTC; ii) 10 patients
with medullary thyroid cancer (MTC); and iii) 6 patients with
FTC.
Validation study design and
participants
Data from patients with TC admitted between November
1, 2013 and November 11, 2018 were collected from the outpatient
department of the PUMCH. The lipid metabolism data included the
CHO, TG, HDL-C, LDL-C, ApoA1, lipoprotein (a) and ApoB levels.
Additional information was obtained from the laboratory information
system (LIS) A total of 3875 outpatients were enrolled in the
study. Lipid profiles were divided into two groups, the cancer
(PTC, FTC and MTC) and control (TN and HC) groups. This study
enrolled 462 male patients with cancer, 889 male controls, 1255
female patients with cancer and 1269 female controls.
Each cancer group, according to whether there exists
the cervical lymph node metastasis, was divided into the metastasis
and non-metastasis groups. The information collected from the
laboratory information system included the identification number,
name, sex, age, hospital department, diagnosis and the results of
thyroid function and lipid metabolism tests of patients with TC.
The data were analyzed after removing all personal identification
information. A statistical method was used to exclude outliers
according to the exclusion criteria. Outlying values were
identified using Tukey's method, which involves the computation of
the 25th (Q1) and 75th (Q3) percentiles and the interquartile range
(IQR=Q3-Q1). Outliers were excluded based on the following formula:
Q1-3IQR and Q3+3IQR (15).
Inclusion criteria and exclusion
criteria for the training and validation studies
The inclusion criteria for the training and
validation studies were as follows: i) Patients with TC aged ≥18
years old; ii) patients diagnosed with PTC, MTC and FTC following
postoperative histopathological analysis; and iii) patients with
thyroid nodules measuring ≥1 cm in diameter. Furthermore, patients
with TN were included according to the following features: i) They
were aged ≥18 years old; ii) they had thyroid nodules ≥1 cm in
diameter as confirmed via ultrasonography; and iii) they had been
diagnosed with TN by a physician. HC group comprised healthy
volunteers who underwent a health checkup at the PUMCH and who had
clear thyroid ultrasonography results. Healthy volunteers were
excluded according to the following criteria: i) They presented
with systemic diseases, including diabetes mellitus, hypertension,
cancer or other cardiovascular, renal, gastrointestinal or
pulmonary diseases; ii) they had recurrent TC; iii) they had
surgery within 6 months preceding the study; and/or (4) they were taking treatment for thyroid
diseases prior to the analysis. No differences in diet were
observed among all participants. A total of 1 ml serum was obtained
from the eligible candidates. In the cancer group (PTC, MTC, FTC)
and TN group, the serum was taken prior to surgery and stored at
−80°C. The histopathological assessment and classification were
conducted according to the criteria of the World Health
Organization (16). Informed consent
was obtained from each patient included in this study. The study
and procedures were approved by the Institutional Research Ethics
Committee of the PUMCH.
Sample preparation for the training
study
Serum samples were depleted from immunoglobulin (Ig)
G and albumin using the ProteoPrep Blue Albumin and IgG Depletion
Kit (PROTBA; Sigma-Aldrich; Merck KGaA) according to the
manufacturer s instructions. The protein concentration after
depletion and vacuum concentration was evaluated by the Bradford
method. A total of 40 µg protein lysate per sample was reduced with
25 mM DTT at 60°C for 30 min and alkylated with 50 mM iodoacetamide
in the dark for 10 min. After alkylation, the sample was loaded
onto an ultrafiltration filter (10 kDa cut-off; Sartorius AG) for
FASP digestion. Trypsin was added at a ratio of 1:100 (enzyme:
Protein) at 37°C for 14–16 h. The samples were spun at 20,000 g at
4°C for 10 min. Peptides were then desalted using Ziptip pipette
tips containing C18 media (Merck KGaA) according to the
manufacturer's instructions.
High pH reversed phase
fractionation
The digests from sample preparation were further
fractionated using high pH reversed phase chromatography. A reverse
chromatography column (XBridge® peptide BEH C18; Waters
Corp) combined with the RIGOL L-3000 system (Rigol Technologies,
Inc.) were used to separate the mixed peptides in the sample. The
peptide mixtures were dissolved in 100 µl mobile phase A [2% (v/v)
acetonitrile, 98% (v/v) ddH2O; pH 10] and centrifuged at 14,000 × g
at 4°C for 20 min. The supernatant loaded onto the column and
eluted stepwise by injecting mobile B [98% (v/v) acetonitrile, 2%
(v/v) ddH2O; pH 10]. The flow rate was set at 700 µl/min. The
fractions were eluted (1.5 min each) and collected using step
gradients of mobile phase B (5.0, 5.0, 8.5, 20.5, 31.0, 90.0, 95.0,
5.0 and 5.0%).
Mass spectrometric data analysis
Date from data-independent acquisition were analyzed
using the Spectronaut Pulsar X software (Biognosys AG).
Data-dependent acquisition (DDA) spectra were analyzed using the
Proteome Discoverer analysis software (version 2.1; Thermo Fisher
Scientific, Inc.) with the default settings ‘trypsin/P’ and ‘two
missed cleavages’. The DDA files were searched against the human
Swiss-Prot FASTA database (www.uniprot.org/uniprot/?query=proteome:
UP000005640%20reviewed:yes; state 15.03.2018; 20,240 entries) and
the Biognosys iRT peptides FASTA database (biognosys.com/shop/irt-kit#SupportMaterials; uploaded
to the public repository).
Laboratory measurements for the
validation study
The CHO, TG, HDL-C, LDL-C, ApoA1, ApoB, lipoprotein
(a) and free fatty acid (FFA) levels were measured using a Beckman
AU Series Automatic Biochemical Analyzer (Beckman Coulter, Inc.)
and reagents from Sekisui Medical Co. Ltd. Biochemical laboratories
that participated in this survey followed a common internal quality
control program that had been standardized by the PUMCH.
Statistical analysis
The Kolmogorov-Smirnov test was used to estimate the
distribution of data. Normally distributed continuous variables
were presented as the means ± standard deviations. A one-way ANOVA
followed by the Student-Newman-Keuls post hoc test was used for
statistical analysis. Variables with a skewed distribution were
presented as medians (interquartile ranges). The Student's t-test
was used to determine the significance between two groups, the
Mann-Whitney U test was used to compare differences between groups
and the Kruskal-Wallis test was used to compare differences among
groups. The quoted P-values were two-sided, and a P-value <0.05
was considered statistically significant. All statistical analyses
were performed using SPSS 20.0 (IBM Corp.).
Results
Clinical characteristics of study
participants
The demographic data of the participants are
provided in Table I. A total of 61
samples were included in the five groups. Among the 15 patients
with HC, 15 patients with TN and 15 patients with PTC, the
male-to-female ratio was 1:3. No significant differences in age
were observed among these three groups. However, age comparisons of
participants with FTC and MTC vs. patients with TN, HC and PTC were
all significant (P<0.05).
 | Table I.Summary of the serum samples collected
from the patients in the training study. |
Table I.
Summary of the serum samples collected
from the patients in the training study.
| Group | Number (n) | Age (mean ± SD) | P-value | Sex (male:
female) |
|---|
| HC | 15 | 43.8±9.13 | 0.102a | 4:11 |
| TN | 15 | 49.6±10.38 |
| 4:11 |
| PTC | 15 | 43±7.37 |
| 4:11 |
| FTC | 6 | 60.2±17.66 | <0.05b | 1:5 |
| MTC | 10 | 54.1±13.2 | <0.05c | 2:3 |
Detection and identification of total
proteins and differentially expressed proteins
Total proteins were analyzed by Student's t-tests to
determine the significance between two groups (FTC_HC, PTC_HC,
MTC_HC, FTC_TN, PTC_TN, MTC_TN) with the Perseus software (version
1.5.0.31; Max-Planck Institute of Biochemistry). The q-values were
calculated on the basis of permutation-based false-discovery rate
(FDR) default setting in Perseus. The significance threshold of
P-values was 0.05. Ratio cut-off values were set as 2 or 0.5.
Differentially expressed proteins were designated when meeting the
two following requirements simultaneously: i) P<0.05; and ii)
ratios ≥2 (upregulated) or ≤0.5 (downregulated). The FDR values of
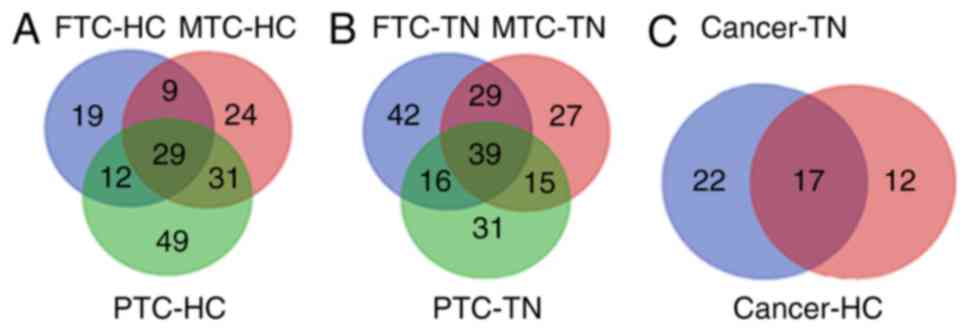
the differentially expressed proteins are shown in Data S1. A total
of 29 proteins expressed in patients with PTC, FC, MC and HC were
identified. Furthermore, 39 proteins were expressed in patients
with PTC, FC, MC and TN. In addition, the intersections between
these two sets of proteins were assessed. After considering the
P-values and ratio, 17 differentially expressed proteins were
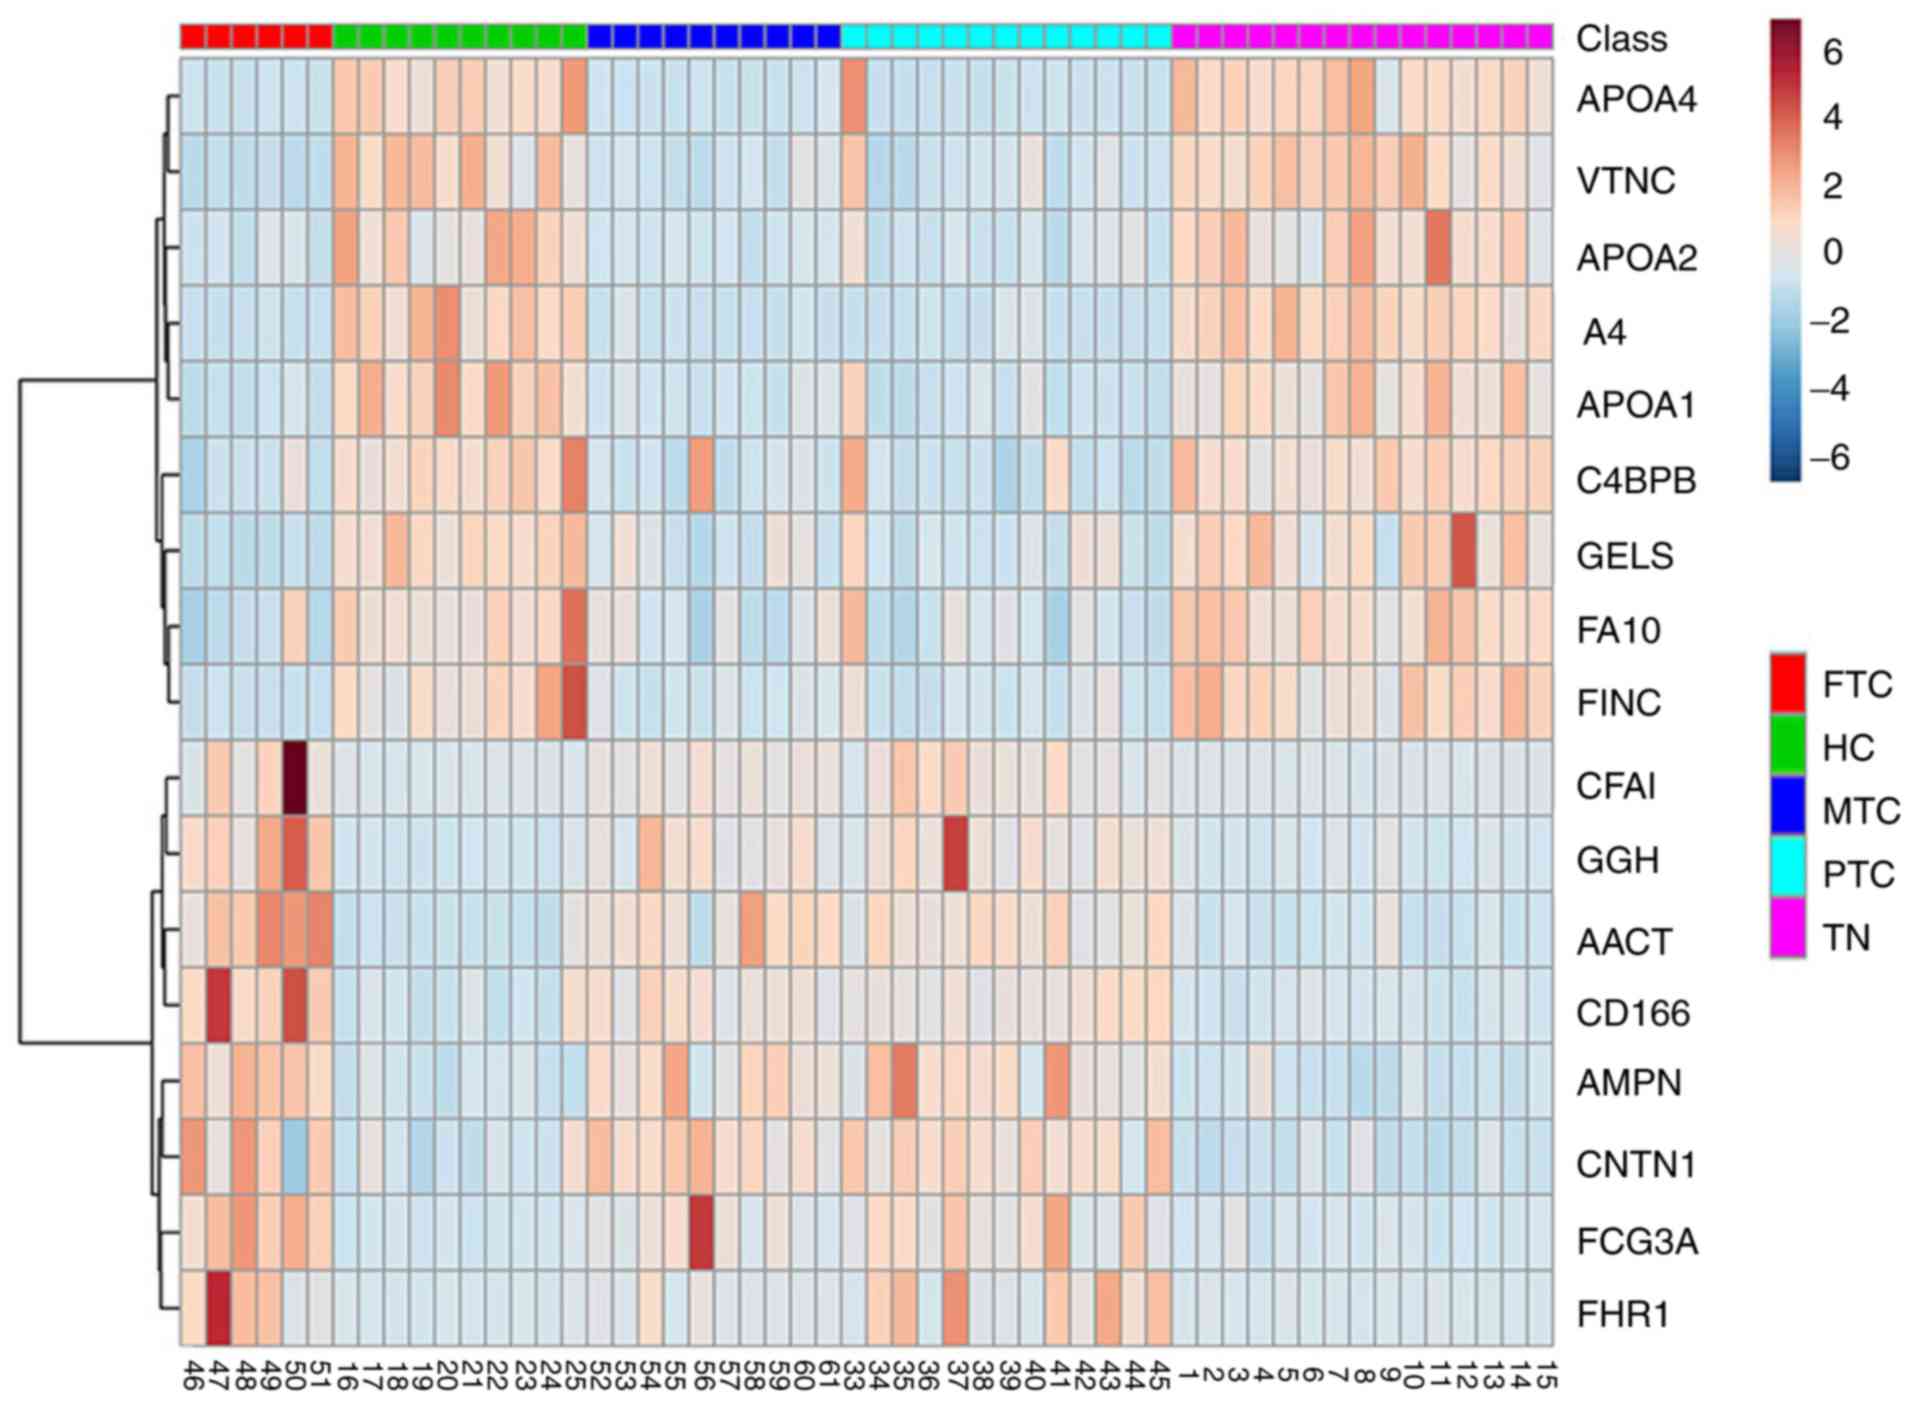
identified. The results are presented in Figs. 1 and 2. Eight and nine proteins were upregulated
(ratio >2) and downregulated (ratio <0.5), respectively, in
the TC group compared with the non-TC groups (Table II). These 17 proteins included
ApoA1, ApoA2 and ApoA4, which are involved in lipid metabolism.
| Table II.Expression of the 17 differential
proteins. |
Table II.
Expression of the 17 differential
proteins.
| Protein groups | Protein
description | Up or
downregulation | Fold
change_(cancer/control) |
|---|
| A4_HUMAN | Amyloid beta A4
protein | Down | 0.0433 |
| APOA4_HUMAN | Apolipoprotein
A-IV | Down | 0.134 |
| APOA1_HUMAN | Apolipoprotein
A-I | Down | 0.258 |
| FINC_HUMAN | Fibronectin | Down | 0.259 |
| VTNC_HUMAN | Vitronectin | Down | 0.298 |
| APOA2_HUMAN | Apolipoprotein
A-II | Down | 0.337 |
| GELS_HUMAN | Gelsolin | Down | 0.356 |
| C4BPB_HUMAN | C4b-binding protein
beta chain | Down | 0.403 |
| FA10_HUMAN | Coagulation factor
X | Down | 0.435 |
| CNTN1_HUMAN | Contactin-1 | Up | 2.373 |
| AMPN_HUMAN | Aminopeptidase
N | Up | 2.566 |
| AACT_HUMAN |
Alpha-1-antichymotrypsin | Up | 3.188 |
| FCG3A_HUMAN | Low affinity
immunoglobulin gamma Fc region receptor III-A | Up | 3.194 |
| CD166_HUMAN | CD166 antigen | Up | 3.62 |
| CFAI_HUMAN | Complement factor
I | Up | 3.814 |
| GGH_HUMAN | Gamma-glutamyl
hydrolase | Up | 4.66 |
| FHR1_HUMAN | Complement factor
H-related protein 1 | Up | 7.799 |
Ingenuity pathway analysis (IPA)
network and pathway analysis
IPA software (Winter 2018 release; Qiagen, Inc.) was
used to conduct network analyses of the 17 differentially expressed
proteins in the serum samples of individuals with and without TC.
The IPA software calculated the P-values using Fisher's exact test
and the p score (p score=-lgP-value) in order to assess
the probability that the submitted proteins in a protein-protein
interaction would be matched by random chance. To do so, the 17
differentially expressed proteins were imported into IPA software,
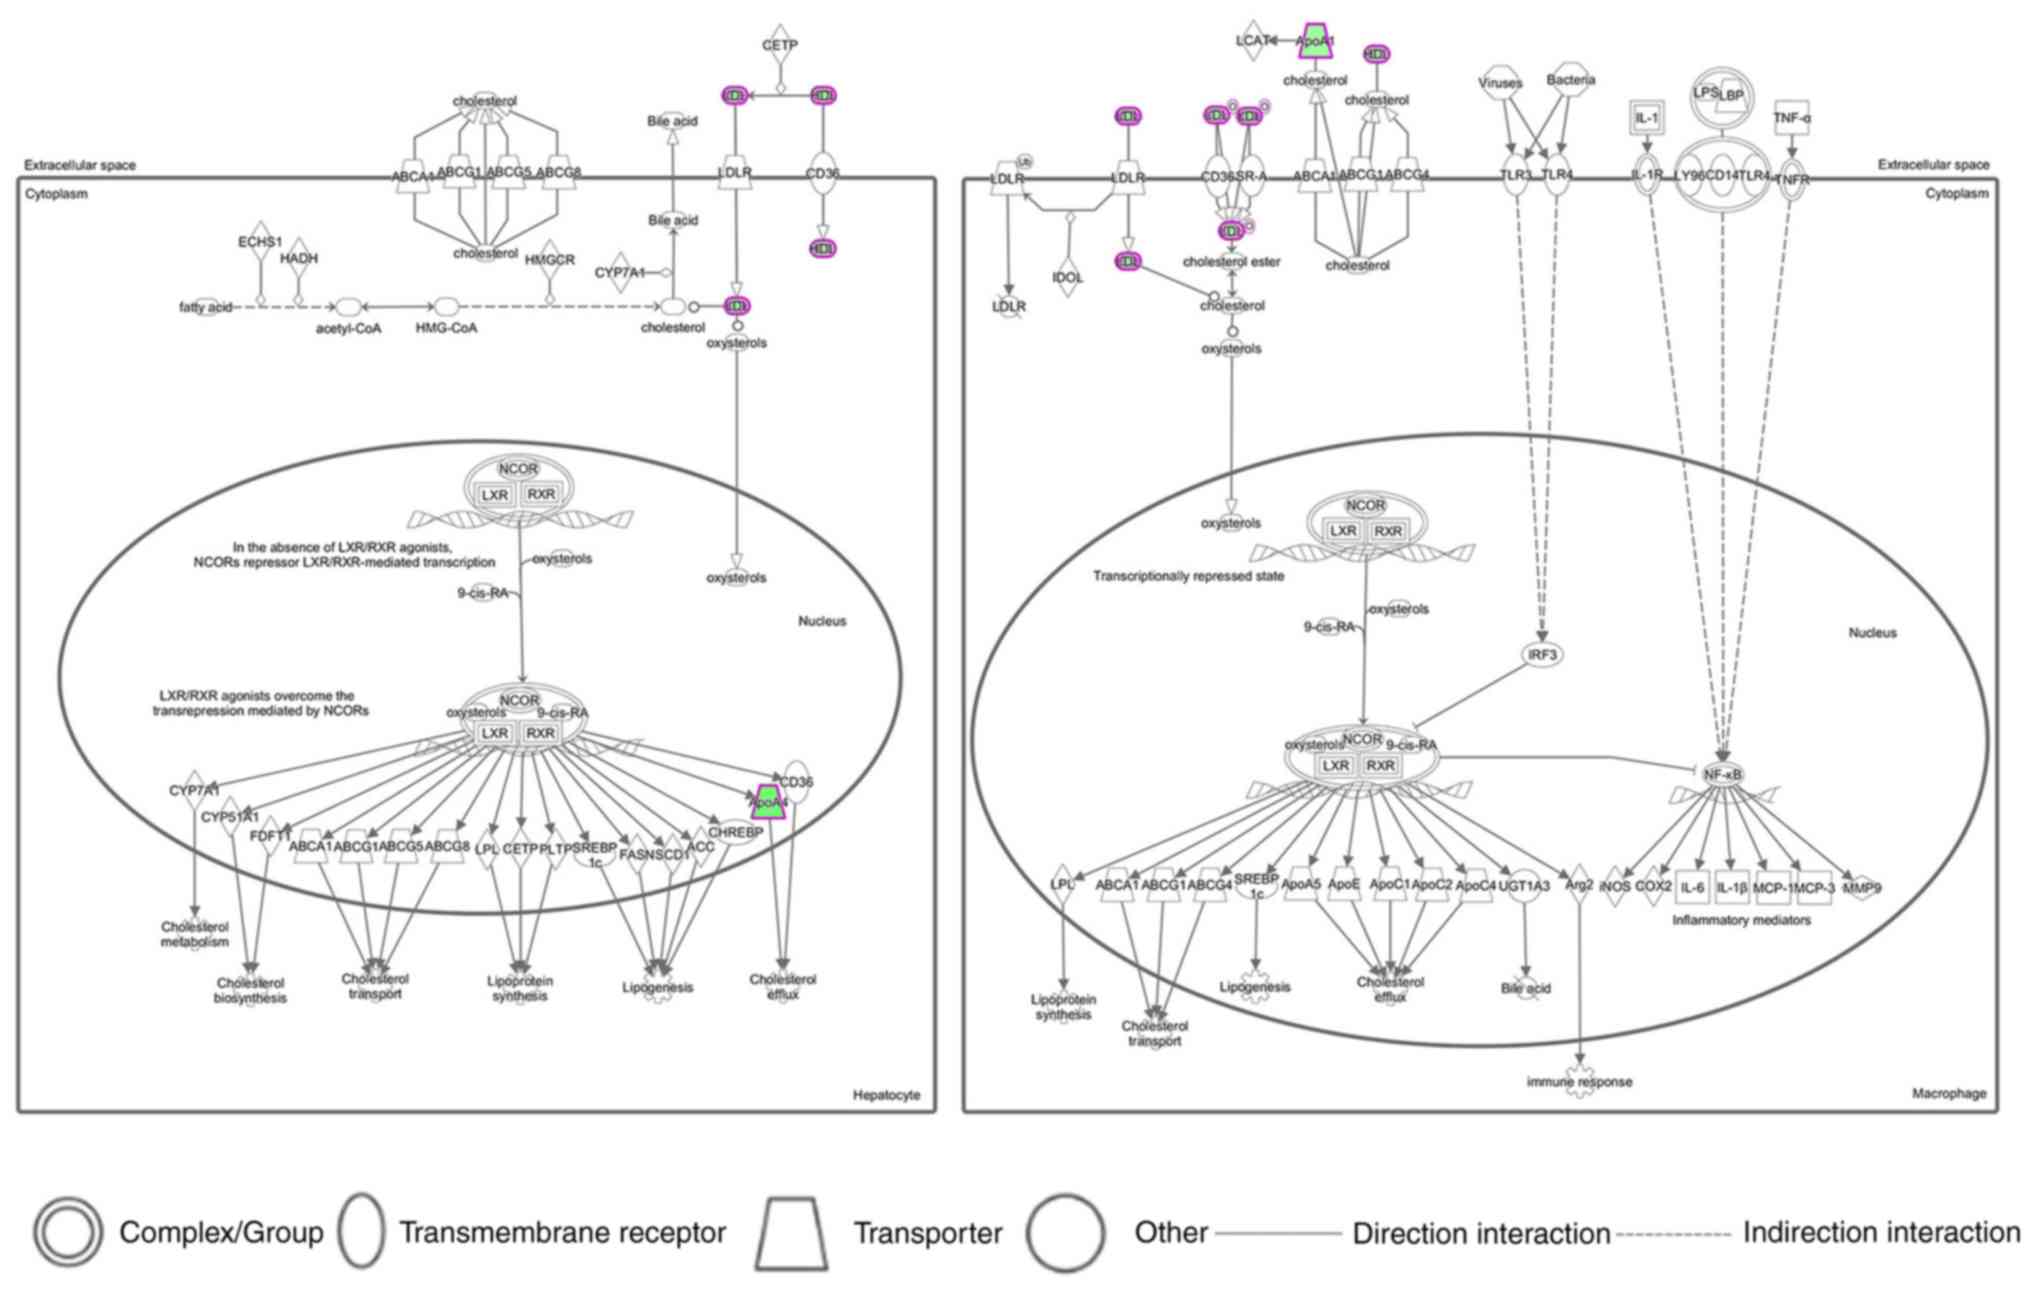
and the top six generated pathways are presented in Table III. The LXR/RXR activation networks
are described in Fig. 3. The results
demonstrated that the lipid profile of HDL, LDL, ApoA1 and ApoA4
existed in the LXR/RXR activation pathway, which suggested that
these lipids may serve important roles in lipid metabolism.
| Table III.Top six canonical pathways enriched
by IPA. |
Table III.
Top six canonical pathways enriched
by IPA.
| Ingenuity canonical
pathways | Log (P-value) | Ratio | Molecules |
|---|
| LXR/RXR
activation | 5.70 | 0.0331 | APOA1, APOA4,
APOA2, VTN |
| FXR/RXR
activation | 5.63 | 0.0317 | APOA1, APOA4,
APOA2, VTN |
| Atherosclerosis
signaling | 3.92 | 0.0236 | APOA1, APOA4,
APOA2 |
| Phagosome
formation | 3.88 | 0.0229 | FN1, VTN,
FCGR3A/FCGR3B |
| IL-12 signaling and
production in macrophages | 3.74 | 0.0205 | APOA1, APOA4,
APOA2 |
|
Glutathione-mediated detoxification | 3.59 | 0.0645 | GGH, ANPEP |
Large data validation of the lipid
profiles in the cancer and control groups
The lipid profiles in the cancer (PTC, FTC and MTC)
and control (TN and HC) groups are presented in Table IV. The present study enrolled 462
male patients with cancer and 889 male controls, and 1255 female
patients with cancer and 1269 female controls. Significant
differences in the CHO level were observed between men and women in
both groups. Among women, the TG, HDL-C, Apo A1 and LDL-C/HDL-C
levels differed significantly between the cancer and control groups
(all P<0.05). In particular, TG and LDL-C/HDL-C levels were
higher in women from the cancer group compared with women from the
control group. Conversely, Apo A1 and HDL-C levels were lower in
women from the cancer group compared with women from the control
group. Results from analysis of the impact of lymph node metastasis
on lipid profile in patients with TC are presented in Table V. Among patients with FTC and MTC, no
significant differences were observed between the metastasis and
non-metastasis groups. However, among patients with PTC, the CHO,
HDL-C, LDLC, Apo A1, Apo B and lipoprotein (a) levels were higher
in the non-metastasis group compared with the metastasis group.
| Table IV.Level of lipid profile between the
cancer and control groups. |
Table IV.
Level of lipid profile between the
cancer and control groups.
|
| Men (n=1351) | Women (n=2524) |
P-valuea |
P-valueb |
|---|
|
|
|
|
|
|
|---|
| Variable | Cancer (n=462) | Control
(n=889) | Cancer
(n=1255) | Control
(n=1269) | − | − |
|---|
| Age (years) | 47 (41–56) | 52 (47–57) | 46 (39–54) | 49 (41–58) | <0.001 | <0.001 |
| CHO (mmol/l) | 4.49
(4.00–5.11) | 4.63
(4.04–5.22) | 4.65
(4.07–5.36) | 4.78
(4.24–5.37) | 0.040 | 0.002 |
| TG (mmol/l) | 1.51
(1.04–2.23) | 1.52
(1.02–2.18) | 1.10
(0.74–1.65) | 0.99
(0.70–1.47) | 0.632 | <0.001 |
| HDL-C (mmol/l) | 1.02
(0.88–1.17) | 1.02
(0.89–1.18) | 1.22
(1.06–1.43) | 1.32
(1.11–1.53) | 0.472 | <0.001 |
| LDL-C (mmol/l) | 2.66
(2.21–3.22) | 2.74
(2.28–3.23) | 2.67
(2.22–3.23) | 2.75
(2.32–3.28) | 0.119 | <0.025 |
| ApoA1 (g/l) | 1.25
(1.13–1.35) | 1.24
(1.13–1.35) | 1.38
(1.26–1.51) | 1.42
(1.28–1.55) | 0.475 | 0.01 |
| ApoB (g/l) | 0.93
(0.80–1.08) | 0.96
(0.83–1.10) | 0.89
(0.75–1.06) | 0.89
(0.77–1.06) | 0.021 | 0.527 |
| Lipoprotein (a)
(mg/l) | 77.5
(33–162.25) | 65.5 (35–158) | 85 (42–179) | 97 (47–192) | 0.416 | 0.004 |
| FFA (µmol/l) | 456.5
(340–575.25) | 442 (337–574) | 498
(344.5–665.0) | 471
(351.5–628.5) | 0.828 | 0.214 |
| LDL-C/HDL-C | 2.69
(2.13–3.22) | 2.65
(2.12–3.27) | 2.22
(1.76–2.73) | 2.11
(1.66–2.63) | 0.671 | 0.036 |
| ApoB/ApoA1 | 0.76
(0.62–0.88) | 0.78
(0.64–0.90) | 0.65
(0.53–0.78) | 0.64
(0.53–0.77) | 0.001 | 0.242 |
| Table V.Association between lipid profile
level in the different types of TC and lymph node metastasis among
the participants. |
Table V.
Association between lipid profile
level in the different types of TC and lymph node metastasis among
the participants.
|
| PTC | FTC | MTC |
|---|
|
|
|
|
|
|---|
| Variable | Metastasis | Non-metastasis | P-value | Metastasis | Non-metastasis | P-value | Metastasis | Non-metastasis | P-value |
|---|
| Age (years) | 45.00
(38.0053.00) | 50.00
(41.00–58.00) | 0.050 | 49.50
(44.25–54.25) | 51.00
(38.50–56.75) | 0.909 | 47.50
(44.00–53.25) | 48.00
(40.00–60.00) | 0.869 |
| CHO (mmol/l) | 4.41
(3.80–5.07) | 4.65
(4.07–5.31) | 0.001 | 4.05
(1.08–4.69) | 4.65
(3.91–5.47) | 0.148 | 4.44
(3.93–5.43) | 4.80
(4.18–5.26) | 0.803 |
| TG (mmol/l) | 1.15
(0.79–1.80) | 1.18
(0.78–1.78) | 0.654 | 3.69
(1.24–4.78) | 1.77
(1.08–2.34) | 0074 | 1.45
(1.12–2.29) | 1.40
(0.95–2.48) | 0.914 |
| HDL-C (mmol/l) | 1.12
(0.96–1.30) | 1.16
(1.00–1.37) | 0.024 | 1.32
(0.98–1.52) | 1.17
(0.95–1.38) | 0.481 | 1.29
(1.02–1.73) | 1.27
(1.04–1.51) | 0.266 |
| LDL-C (mmol/l) | 2.50
(2.11–3.14) | 2.69
(2.25–3.22) | 0.003 | 2.47
(2.05–3.43) | 2.86
(2.26–3.51) | 0.392 | 2.66
(2.24–3.08) | 2.83
(2.30–3.28) | 0.521 |
| Apo A1 (g/l) | 1.32
(1.20–1.43) | 1.35
(1.23–1.48) | 0.023 | 1.22
(1.13–1.44) | 1.35
(1.20–1.43) | 0.493 | 1.52
(1.22–1.74) | 1.36
(1.18–1.54) | 0.114 |
| Apo B(g/l) | 0.85
(0.72–1.03) | 0.91
(0.77–1.07) | 0.006 | 0.9350
(0.7775–1.0825) | 1.03
(0.77–1.15) | 0.879 | 0.83
(0.78–1.04) | 0.94
(0.80–1.07) | 0.353 |
| Lipoprotein
(a) | 75.00 | 85.00 | 0.043 | 89.50 | 124.00 | 0.581 | 35.00 | 71.00 | 0.105 |
| (mg/l) | (33.75–149.75) | (42.00–177.00) |
| (57.25–158.50) | (47.75–379.25) |
| (18.50–119.20) | (29.75–192.00) |
|
| FFA (µmol/l) | 466.00 | 487.00 | 0.416 | 462.00 | 374.00 | 0.502 | 586.00 | 478.00 | 0.862 |
|
|
(347.50–621.00) |
(344.00–638.50) |
|
(286.00–713.00) |
(309.00–584.00) |
|
(315.25–678.75) |
(351.50–673.50) |
|
| LDLC/HDL-C | 2.28
(1.80–2.88) | 2.33
(1.84–2.90) | 0.542 | 2.04
(1.75–2.51) | 2.77
(2.21–3.10) | 0.057 | 2.37
(1.41–2.71) | 2.26
(1.76–2.93) | 0.317 |
| ApoB/ApoA1 | 0.66
(0.64–0.80) | 0.67
(0.56–0.81) | 0.322 | 0.73
(0.60–0.94) | 0.75
(0.65–0.86) | 0.939 | 0.65
(0.43–0.79) | 0.67
(0.52–0.86) | 0.205 |
Discussion
Recent studies revealed that lipid metabolism
disorders are important in carcinogenesis and cancer development,
as they induce abnormalities in the expression of various genes and
proteins, and in the regulation of cytokines and signaling pathways
(17,18). The present study demonstrated that
lipid metabolism disorders occurred in patients with TC. To the
best of our knowledge, this study was the first to validate the
differential lipid profile in a large population of patients with
TC.
As the incidence of TC varies by sex (6), the present study screened the
differential lipid profiles in age- and sex-matching samples. A
total of 17 proteins were designated as differentially expressed
proteins. These proteins were therefore subjected to bioinformatics
analyses. The IPA output identified the LXR/RXR activation pathway
as the significant canonical pathway. In addition, significantly
lower expression levels of ApoA1, ApoA2 and ApoA4 were observed in
patients with TC, compared with healthy controls. Furthermore,
after observing the significant modulation of expression in TC
pathogenesis and etiology, this differential lipid profile was
validated in a larger population.
A previous cohort study reported that the serum TG
concentration is negatively and positively correlated with the risk
of prostate and renal cancer, respectively, in men. Furthermore,
serum TG level is positively correlated with the risk of
gynecological cancer in women (19).
Consistent with that study, the present study demonstrated that TG
concentrations were higher in women with TC compared with women in
the control group. In men however, no significant difference was
observed in the TG level between cancer and control groups. A
previous study demonstrated that TG levels are not associated with
the risk of cancer-associated mortality (20). Further investigation is therefore
needed to validate the importance of TG in tumor development.
ApoA-I (28 kDa), which is the major protein
constituent of high-density lipoprotein, serves a crucial role in
reverse cholesterol transport. This protein can transfer
cholesterol and phospholipids from peripheral cells to the liver
for excretion (21). A previous
study identified HPX, POTEE and ApoA1 as the most
significant genes associated with the proteomic profile. In
addition, these genes are significantly correlated with the risk of
breast cancer and could be used for the detection of disease
progression (22). In the present
study, women in the cancer group expressed lower levels of Apo A1
compared with women in the control group.
Numerous studies have validated the prognostic
values of lipid molecules and their derivative indexes in various
types of carcinoma (23,24). In the present study, a new derivative
index was developed for the ApoB/ApoA1 and LDL-C/HDL-C ratios.
Furthermore, the LDL-C/HDL-C and ApoB/ApoA1 ratios have significant
diagnostic values in several diseases (25,26). Ma
et al (14) reported that,
among the various lipid molecules and derivative indexes, the
ApoB/ApoA1 ratio could serve as an independent prognostic marker of
gastric cancer. In the present study, the LDL-C/HDL-C level was
significantly higher in women with TC compared with women in the
control group, mainly because the former group had a decreased
level of HDL-C.
Hong et al (23) reported that the preoperative serum
lipid profile is correlated with the outcome of patients with
non-metastatic colorectal cancer. In the present study, no
significant differences between the metastasis and non-metastasis
groups were observed in patients with FTC and MTC. The effect of
lymph node metastasis on lipid metabolism requires therefore
further investigation.
Preliminary exploration of lipid metabolism in
patients with TC revealed the existence of lipid metabolism
disorders (27). The present study
demonstrated that ApoA1 and HDL-C levels, which have positive
effects in human metabolism, were decreased Conversely, TG level
and LDL-C/HDL-C ratio, which have negative effects on human
metabolism, were increased. Identification of a lipid metabolism
disorder in patients may therefore provide additional evidences
leading to the diagnosis of TC. Subsequently, lipid profile
analysis is essential and may yield valuable biomarkers in the
early diagnosis of TC.
The present study had some major strengths. Firstly,
it included a variety of patients with various types of TC.
Secondly, the screening targeted differentially expressed proteins.
Thirdly, the differentially expressed proteins involved in lipid
mechanism between the groups were compared and validated in large
samples. However, this study had certain limitations. Firstly, the
screening and validation experiments applied age- and sex-matching
to HC and patients with TN and PTC; however, as the incidence rates
of MTC and FTC were extremely low, the sample sizes for these
tumors were too small to allow appropriate matching. Secondly, the
exact moment of tumor recurrence/progression could not be
determined due to information bias. This study did therefore not
evaluate the effects of lipid metabolism on the prognosis of TC.
Thirdly, the underlying mechanism of lipid metabolism on the
carcinogenesis and development of TC requires further
investigation.
In conclusion, the present study identified lipid
metabolism disorders in patients with TC. Notably, ApoA1, ApoA2 and
ApoA4 levels were significantly lower in patients with TC compared
with healthy controls. Following further validation, significantly
lower levels of Apo A1 and HDL-C were identified in women with TC
compared with female controls. The underlying molecular mechanism
of lipid metabolism and cancer require further investigation in
order to develop potential novel diagnostic biomarkers and
therapeutic targets for human cancers.
Supplementary Material
Supporting Data
Acknowledgements
The authors would like to thank Mr. Jun Wang
(Laboratory Information System, Beijing Peking Union Medical
College Hospital) for providing technical support.
Funding
The present study was funded by the National Natural
Science Foundation of China (grant no. 81702060; www.nsfc.gov.cn).
Availability of data and materials
The datasets used and/or analyzed during the current
study are available from the corresponding author on reasonable
request.
Authors' contributions
DL, JW and LQ designed the study. WC, YMZ and LZ
collected the samples. DL and CM analyzed the data. SY, DW and YTZ
made substantial contributions to conception and design and the
acquisition of data and contributed reagents, materials and
analysis tools. All authors read and approved the final
manuscript.
Ethics approval and consent to
participate
The study was approved by the Institutional Research
Ethics Committee of PUMCH. Informed consent was obtained from each
patient included in this study.
Patients consent for publication
Not applicable.
Competing interests
The authors declare that they have no competing
interests.
References
|
1
|
Scopa CD: Histopathology of thyroid
tumors. An overview. Hormones (Athens). 3:100–110. 2004. View Article : Google Scholar : PubMed/NCBI
|
|
2
|
Holmes L Jr, Hossain J and Opara F:
Pediatric thyroid carcinoma incidence and temporal trends in the
USA (1973–2007): Race or shifting diagnostic paradigm? ISRN Oncol.
2012:9061972012.PubMed/NCBI
|
|
3
|
Faquin WC: The thyroid gland: Recurring
problems in histologic and cytologic evaluation. Arch Pathol Lab
Med. 132:622–632. 2008.PubMed/NCBI
|
|
4
|
Navas-Carrillo D, Rios A, Rodriguez JM,
Parrilla P and Orenes-Piñero E: Familial nonmedullary thyroid
cancer: Screening, clinical, molecular and genetic findings.
Biochim Biophys Acta. 1846:468–476. 2014.PubMed/NCBI
|
|
5
|
Howlader N, Noone AM, Krapcho M, Miller D,
Brest A, Yu M, Ruhl J, Tatalovich Z, Mariotto A, Lewis DR, et al:
SEER Cancer Statistics Review, 1975–2016. National Cancer
Institute; Bethesda, MD: https://seer.cancer.gov/csr/1975_2016/based on
November 2018 SEER data submission, posted to the SEER web site.
April. 2019
|
|
6
|
Rahbari R, Zhang L and Kebebew E: Thyroid
cancer gender disparity. Future Oncol. 6:1771–1779. 2010.
View Article : Google Scholar : PubMed/NCBI
|
|
7
|
Paricharttanakul NM, Saharat K,
Chokchaichamnankit D, Punyarit P, Srisomsap C and Svasti J:
Unveiling a novel biomarker panel for diagnosis and classification
of well-differentiated thyroid carcinomas. Oncol Rep. 35:2286–2296.
2016. View Article : Google Scholar : PubMed/NCBI
|
|
8
|
Villanueva J, Martorella AJ, Lawlor K,
Philip J, Fleisher M, Robbins RJ and Tempst P: Serum peptidome
patterns that distinguish metastatic thyroid carcinoma from
cancer-free controls are unbiased by gender and age. Mol Cell
Proteomics. 5:1840–1852. 2006. View Article : Google Scholar : PubMed/NCBI
|
|
9
|
Wang JX, Yu JK, Wang L, Liu QL, Zhang J
and Zheng S: Application of serum protein fingerprint in diagnosis
of papillary thyroid carcinoma. Proteomics. 6:5344–5349. 2006.
View Article : Google Scholar : PubMed/NCBI
|
|
10
|
Cohen A, Wang E, Chisholm KA, Kostyleva R,
O'Connor-McCourt M and Pinto DM: A mass spectrometry-based plasma
protein panel targeting the tumor microenvironment in patients with
breast cancer. J Proteomics. 81:135–147. 2013. View Article : Google Scholar : PubMed/NCBI
|
|
11
|
Egertson JD, Kuehn A, Merrihew GE, Bateman
NW, MacLean BX, Ting YS, Canterbury JD, Marsh DM, Kellmann M,
Zabrouskov V, et al: Multiplexed MS/MS for improved
data-independent acquisition. Nat Methods. 10:744–746. 2013.
View Article : Google Scholar : PubMed/NCBI
|
|
12
|
Maan M, Peters JM, Dutta M and Patterson
AD: Lipid metabolism and lipophagy in cancer. Biochem Biophys Res
Commun. 504:582–589. 2018. View Article : Google Scholar : PubMed/NCBI
|
|
13
|
Tamura K, Horikawa M, Sato S, Miyake H and
Setou M: Discovery of lipid biomarkers correlated with disease
progression in clear cell renal cell carcinoma using desorption
electrospray ionization imaging mass spectrometry. Oncotarget.
10:1688–1703. 2019. View Article : Google Scholar : PubMed/NCBI
|
|
14
|
Ma MZ, Yuan SQ, Chen YM and Zhou ZW:
Preoperative apolipoprotein B/apolipoprotein A1 ratio: A novel
prognostic factor for gastric cancer. Onco Targets Ther.
11:2169–2176. 2018. View Article : Google Scholar : PubMed/NCBI
|
|
15
|
Wang D, Cheng X, Yu S, Qiu L, Lian X, Guo
X, Hu Y, Lu S, Yang G and Liu H: Data mining: Seasonal and
temperature fluctuations in thyroid-stimulating hormone. Clin
Biochem. 60:59–63. 2018. View Article : Google Scholar : PubMed/NCBI
|
|
16
|
Thompson L: World Health Organization
classification of tumours: Pathology and genetics of head and neck
tumours. Ear Nose Throat J. 85:742006. View Article : Google Scholar : PubMed/NCBI
|
|
17
|
Long J, Zhang CJ, Zhu N, Du K, Yin YF, Tan
X, Liao DF and Qin L: Lipid metabolism and carcinogenesis, cancer
development. Am J Cancer Res. 8:778–791. 2018.PubMed/NCBI
|
|
18
|
Nikitin PV, Potapov AA, Ryzhova MV,
Shurkhay VA, Kulikov EE, Zhvanskiy ES, Popov IA and Nikolaev EN:
The role of lipid metabolism disorders, atypical isoforms of
protein kinase C, and mutational status of cytosolic and
mitochondrial forms of isocitrate dehydrogenase in carcinogenesis
of glial tumors. Zh Vopr Neirokhir Im N N Burdenko. 82:112–120.
2018.(In Russian). View Article : Google Scholar : PubMed/NCBI
|
|
19
|
Ulmer H, Borena W, Rapp K, Klenk J,
Strasak A, Diem G, Concin H and Nagel G: Serum triglyceride
concentrations and cancer risk in a large cohort study in Austria.
Br J Cancer. 101:1202–1206. 2009. View Article : Google Scholar : PubMed/NCBI
|
|
20
|
Martin RM, Vatten L, Gunnell D, Romundstad
P and Nilsen TI: Components of the metabolic syndrome and risk of
prostate cancer: The HUNT 2 cohort, Norway. Cancer Causes Control.
20:1181–1192. 2009. View Article : Google Scholar : PubMed/NCBI
|
|
21
|
Breslow JL, Ross D, McPherson J, Williams
H, Kurnit D, Nussbaum AL, Karathanasis SK and Zannis VI: Isolation
and characterization of cDNA clones for human apolipoprotein A-I.
Proc Natl Acad Sci USA. 79:6861–6865. 1982. View Article : Google Scholar : PubMed/NCBI
|
|
22
|
Cine N, Baykal AT, Sunnetci D, Canturk Z,
Serhatli M and Savli H: Identification of ApoA1, HPX and POTEE
genes by omic analysis in breast cancer. Oncol Rep. 32:1078–1086.
2014. View Article : Google Scholar : PubMed/NCBI
|
|
23
|
Hong TT, Shen D, Chen XP, Wu XH and Hua D:
Preoperative serum lipid profile and outcome in nonmetastatic
colorectal cancer. Chronic Dis Transl Med. 2:241–249. 2016.
View Article : Google Scholar : PubMed/NCBI
|
|
24
|
Zhao R, Cheng G, Wang B, Qin C, Liu Y, Pan
Y, Wang J, Hua L, Zhu W and Wang Z: BMI and serum lipid parameters
predict increasing risk and aggressive prostate cancer in Chinese
people. Oncotarget. 8:66051–66060. 2017.PubMed/NCBI
|
|
25
|
Liu BZ, Tao L, Chen YZ, Li XZ, Dong YL, Ma
YJ, Li SG, Li F and Zhang WJ: Preoperative body mass index, blood
albumin and triglycerides predict survival for patients with
gastric cancer. PLoS One. 11:e01574012016. View Article : Google Scholar : PubMed/NCBI
|
|
26
|
You S, Zhong C, Xu J, Han Q, Zhang X, Liu
H, Zhang Y, Shi J, Huang Z, Xiao G, et al: LDL-C/HDL-C ratio and
risk of all-cause mortality in patients with intracerebral
hemorrhage. Neurol Res. 38:903–908. 2016. View Article : Google Scholar : PubMed/NCBI
|
|
27
|
Liao T, Wang YJ, Hu JQ, Wang Y, Han LT, Ma
B, Shi RL, Qu N, Wei WJ, Guan Q, et al: Histone methyltransferase
KMT5A gene modulates oncogenesis and lipid metabolism of papillary
thyroid cancer in vitro. Oncol Rep. 39:2185–2192.
2018.PubMed/NCBI
|