Introduction
Colorectal cancer (CRC) is one of the most common
malignant tumors and it has exhibited an increasing morbidity rate
in the past decades. In 2017, ~135,000 individuals were diagnosed
with CRC in the USA, and the mean 5-year survival rate was <10%
once metastasis occurred (1,2). An accumulation of genetic and
epigenetic changes, including somatic mutations in the B-Raf
proto-oncogene serine/threonine kinase, KRAS proto-oncogene GTPase
and tumor protein 53 genes, contribute to the tumorigenesis of CRC.
These mutations are observed in the majority of patients with CRC
(3). Additionally, several signaling
pathways, including Wnt, Notch, mitogen-activated protein kinase,
transforming growth factor-β and phosphatidylinositol
3-kinase/protein kinase b pathways, are involved in the oncogenic
transformation of CRC (4–6). Furthermore, the pathogenesis of a
subset of CRC involves mechanisms such as aberrant DNA methylation
or CpG island methylator phenotype (CIMP) in promoter methylation
(7).
Previous studies have reported that DNA methylation
functions as a key regulator of gene expression and contributes to
CRC development (8,9). At the genome level, CRC is
characterized by absolute hypomethylation compared with adjacent
healthy tissues, such as hypomethylation level in repetitive
elements, including long interspersed nuclear element-1 and the Alu
element (10). Furthermore, a subset
of patients with CRC exhibit gene-specific promoter methylation
termed CIMP (11). While a number of
methylated genes are established as tumor suppressors in CRC, the
potential roles of several methylated genes in tumorigenesis remain
unclear. For example, McInnes et al (12) analyzed a subset of DNA methylation
profiles and identified a cohort of hypermethylated genes in high
level CIMP CRC tissues. Xue et al (13) used genome-wide methylation analysis
to screen several novel methylated markers with prognostic value in
colon cancer and revealed that five genes coincided with seven
prognostic differentially expressed regions. However, the use of
potential DNA methylation genes as predictive markers in CRC
detection and prognosis prediction requires further
investigation.
The current study analyzed mRNA expression and
methylation profiles to screen differentially expressed mRNAs and
methylated genes between CRC tumors and adjacent healthy tissues.
Univariable and multivariable Cox regression analysis identified
several candidate tumor marker genes and prognostic clinical
factors. A risk prediction model based on identified genes and
clinical factors was constructed. Randomization tests were utilized
to calculate P-values of performance metrics, and cross-validation
was performed to evaluate the accuracy of the prediction model. The
current study integrated genomic and methylation profiles to
identify candidate tumor marker genes, which may improve prognosis
prediction in patients with CRC.
Materials and methods
Data sources
Gene expression, DNA methylation profiles and the
corresponding clinical information associated with CRC were
downloaded from The Cancer Genome Atlas database (TCGA; http://portal.gdc.cancer.gov/). There were 329
samples with both gene expression and DNA methylation profiles,
including 41 adjacent healthy tissues and 288 tumor samples. After
excluding samples without survival outcome information, the
microarray data of the 239 tumor samples were used as the training
dataset.
In addition, two validated datasets, GSE77955
(14) and GSE17536 (15,16),
were downloaded from Gene Expression Omnibus (https://www.ncbi.nlm.nih.gov/geo/). The GSE77955
dataset included gene expression data based on the GPL96 [hg-u133]
Affymetrix Human Genome U133 platform (Affymetrix, Thermo Fisher
Scientific, Inc.) and DNA methylation data based on the GPL13534
Illumina Human Methylation 450 BeadChip platform (Illumina, Inc.).
A total of 48 pairs of gene expression and methylation profiles
were obtained from this dataset, including 14 adjacent healthy
tissues and 34 tumor samples. These 48 pairs of samples had matched
gene expression levels and DNA methylation levels and corresponding
clinical information. This dataset was used as validation dataset
of SVM classifier. The GSE17536 dataset consisted of 177 tumor
tissue samples with corresponding survival outcomes. The gene
expression data were based on GPL570 [HG-U133_Plus_2] Affymetrix
Human Genome U133 Plus 2.0 Array. The human gene expression
profiles of CRC were selected as validation datasets containing
corresponding survival outcome information. This dataset was used
as independent validation dataset of prognosis model. Clinical
information of samples in the training set and the two validation
datasets are presented in Table
I.
 | Table I.Clinical characteristics of the
training and validation datasets. |
Table I.
Clinical characteristics of the
training and validation datasets.
| Clinical
characteristic | TCGA (n=239) | GSE77955
(n=34) | GSE17536
(n=177) |
|---|
| Age, years (mean ±
SD) | 65.260±13.170 | 61.560±16.050 | – |
| Sex
(male/female) | 130/109 | 18/13/3 | – |
| Pathologic M
(M0/M1/-) | 159/33/44/3 | – | – |
| Pathologic N
(N0/N1/N2) | 137/64/38 | – | – |
| Pathologic T
(T1/T2/T3/T4/-) | 5/40/162/31/1 | – | – |
| Pathologic stage
(I/II/III/IV/-) | 41/88/71/34/5 | – | – |
| Lymphatic invasion
(yes/no/-) | 67/151/21 | – | – |
| History of colon
polyps (yes/no/-) | 44/142/53 | – | – |
| New tumor
(yes/no/-) | 51/180/8 | – | – |
| Alive
(yes/no/-) | 179/60/ | – | 103/74 |
| Overall survival
time (months, mean ± SD) | 29.690±30.020 | – | 48.650±32.460 |
Differentially expressed mRNAs and
methylated genes selection
The edgeR package version 30.2.9 (bioconductor.org/packages/release/bioc/html/edgeR.html)
in R software (version no. 3.4.1; http://www.r-project.org/) was used to identify the
differentially expressed mRNAs and methylated genes in normal and
tumor samples. A false discovery rate (FDR) <0.05 and
|log2 fold change (FC)|>0.585 were considered as
thresholds. Furthermore, the Wilcoxon signed-rank test (https://www.rdocumentation.org/packages/stats/versions/3.4.1/topics/wilcox.test)
in R was used to identify genes with significant differences in DNA
methylation levels between normal and tumor samples. The screening
criteria were set as FDR<0.05 and |Cancer-Normal|>0.2.
The oligo package version 1.48 (www.bioconductor.org/packages/release/bioc/html/oligo.html)
in R was used for preprocessing of the GSE77955 and GSE31056
datasets. Data preparation included original data conversion,
missing value supplementation, background correction and data
normalization.
Correlation analysis between
differentially expressed mRNA and methylated genes
Overlapping differentially expressed mRNA and
differentially methylated genes were selected for further analysis.
The Cor function (https://www.rdocumentation.org/packages/stats/versions/3.6.1/topics/cor)
in R was used to calculate the Pearson's correlation coefficients
(PCC) of gene expression levels and DNA methylated levels. The
differentially expressed mRNAs with significantly differential
methylated levels were considered as candidate tumor
biomarkers.
Construction of a sample classifier
based on tumor marker genes
The recursive feature elimination (RFE) algorithm in
the caret package version 6.0–84 (17) (cran.r-project.org/web/packages/caret) was used to
screen tumor marker genes in CRC. The RFE algorithm is an iterative
procedure that screens and assesses the optimal subsets from the
training dataset (18) and has been
employed for dimensionality reduction analysis. The gene
combination with the highest accuracy rate in cross validation of
RFE algorithm was taken as the optimal combination of tumor markers
for validation.
Following the identification of optimal marker genes
using RFE algorithm, Support Vector Machine (SVM) package version
1.6.8 (cran.r-project.org/web/packages/e1071) (19) was utilized to construct a SVM
classifier (kernel function, sigmoid kernel; cross, 10-fold cross
validation) and the performance of SVM classifier was validated
using the GSE77955 dataset. Additionally, the pheatmap package
version 1.0.8 (bioconductor.org/packages/release/bioc/html/pheatmap.html)
(20) in R was used to perform
bidirectional hierarchical clustering analysis using the centered
Pearson's correlation algorithm (21). In order to investigate the functions
of the tumor marker genes, Gene Ontology (GO)-biological processes
(BP) and Kyoto Encyclopedia of Genes and Genomes (KEGG) pathways of
these genes were analyzed using DAVID version 6.7 (https://david.ncifcrf.gov/) without any cut-off.
Screening tumor marker genes and
prognostic clinical factors
To further investigate the optimal tumor marker
genes, multivariate and univariate cox regression analysis in the
survival package version 2.42–3 (https://cran.r-project.org/web/packages/survival/index.html)
in R (22) were performed to assess
prognostic values of the selected genes and clinical factors.
P<0.05 was considered to indicate a statistically significant
difference. Survival curves were generated by the Kaplan-Meier
method and log-rank test.
Risk prediction model construction
based on tumor marker genes and prognostic clinical factors
The prognostic index (PI) of each sample was
calculated according to the following formula: PIgenomic
= βgene 1 × Expgene 1 + βgene 2 ×
Expgene 2 + βgene 3 × Expgene 3
+…+ βgene n × Expgene n, where β
represents the regression coefficient and Exp represents expression
level of a gene. Samples in the training set were divided into high
and low risk groups using the median score of the PI as the cut-off
value. Kaplan Meier survival curves and long-rank test in the
survival package were used to analyze the associations between risk
model and disease survival outcome (23). Additionally, receiver operating
characteristic (ROC) curves were plotted to calculate the area
under the curve (AUC). The GSE17536 dataset was used to perform
further data validation.
Based on the risk prediction model of prognostic
clinical factors, the PI of each sample was re-calculated according
to the following formula: PIclinical =
∑βclinical × Statusclinical, where
βclinical represents the regression coefficient and
Statusclinical represents the value of a clinical factor
(0 or 1). Samples in the training sets were divided into high- and
low-risk groups by using the PI median score as the cut-off value.
The Kaplan-Meier survival curves and log-rank test were used to
evaluate the associations between the risk model and prognosis.
Additionally, ROC curves were plotted to calculate the AUC.
The weight coefficients of optimal tumor marker
genes and prognostic clinical factors were integrated and a
comprehensive predictive risk model was constructed. The PI value
of each sample was re-calculated according to the following
formula: PIcombine = PIgenomic +
PIclinical. Kaplan-Meier survival curves and log-rank
test were generated to evaluate the associations between the risk
group and the overall survival (OS) times. ROC curves were plotted
to calculate the AUC.
Results
Screening the differentially expressed
mRNAs and differentially methylated genes
A total of 1,706 differentially expressed mRNAs were
identified between 329 tumor and adjacent healthy tissues,
including 676 upregulated and 1,030 downregulated genes. Moreover,
1,568 differentially methylated genes were screened using the
Wilcoxon signed-rank test, including 878 hypomethylated and 690
hypermethylated genes.
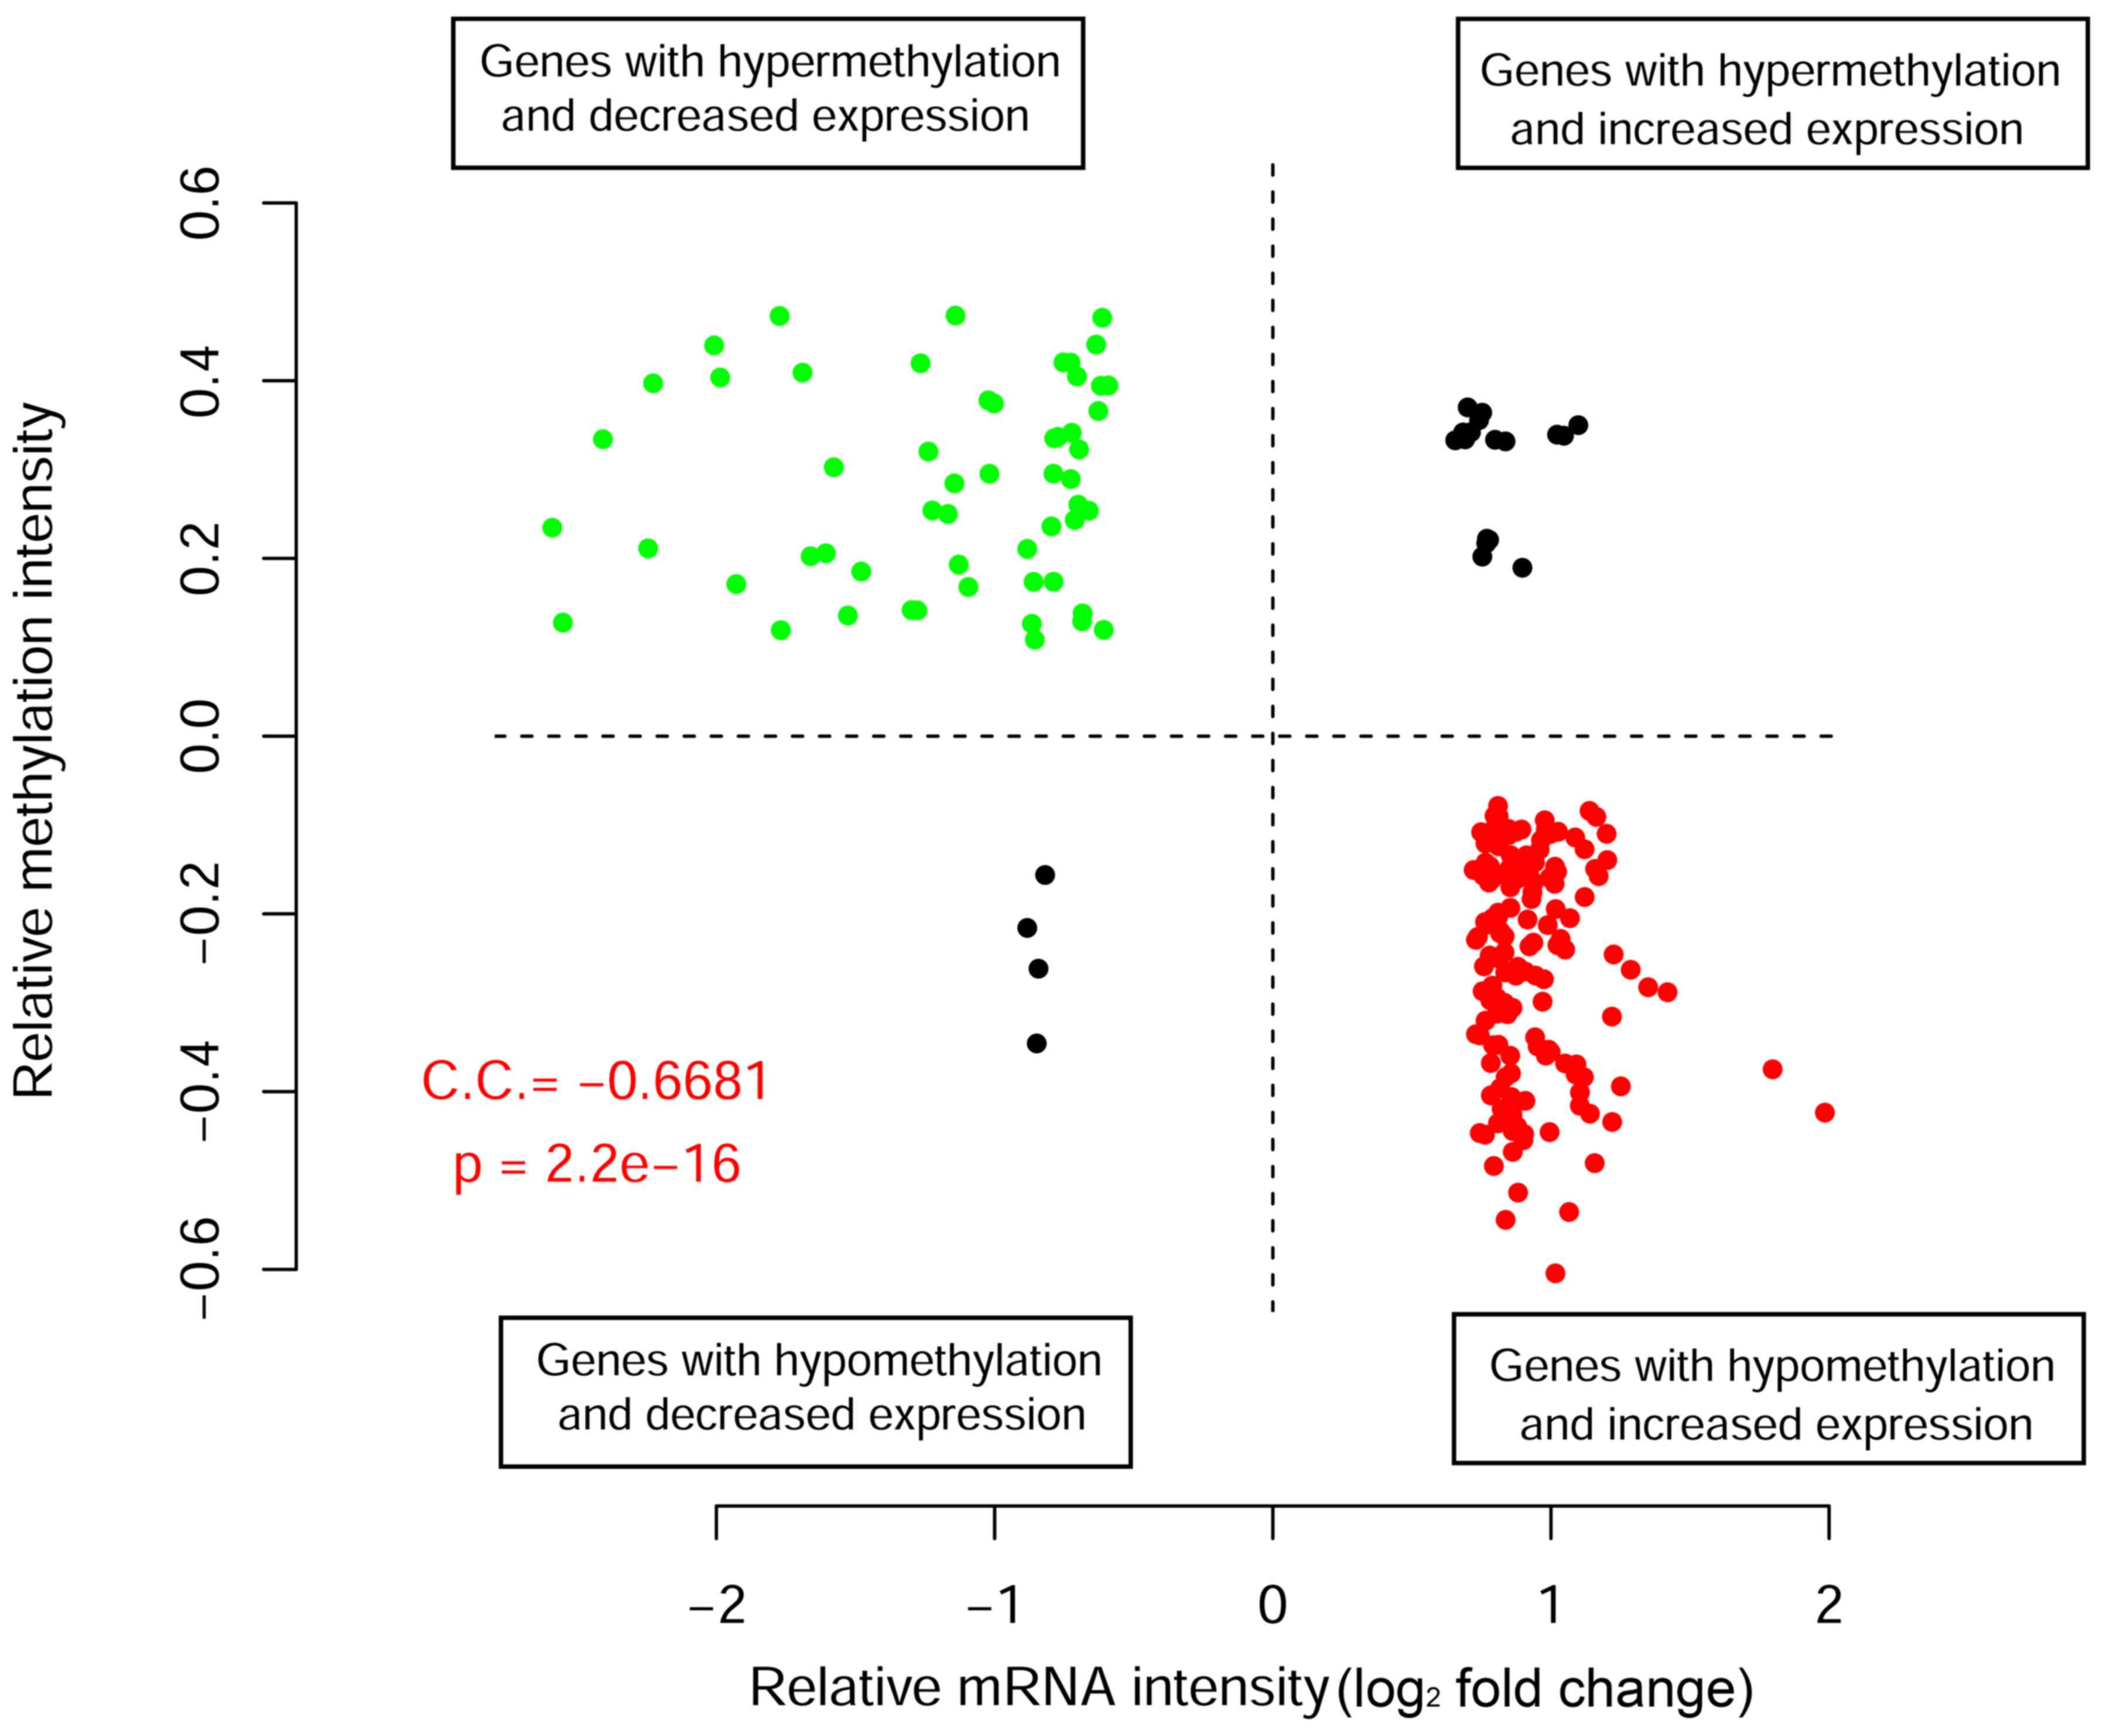
Correlation analysis for the gene
expression and DNA methylation
There were 228 overlapping differentially expressed
mRNAs and differentially methylated genes available for screening
the critical tumor marker genes. Correlation analysis was performed
to reveal correlations between gene expression and methylation
levels (Fig. 1). A total of 54 genes
were downregulated with hypermethylated levels, while 164 genes
were upregulated with hypomethylated levels. The overall PCC value
was −0.668, suggesting a significant negative correlation between
methylation and gene expression levels. The 218 differentially
expressed mRNAs with negative correlations between gene expression
and methylation levels were considered as candidate tumor
biomarkers for further investigation.
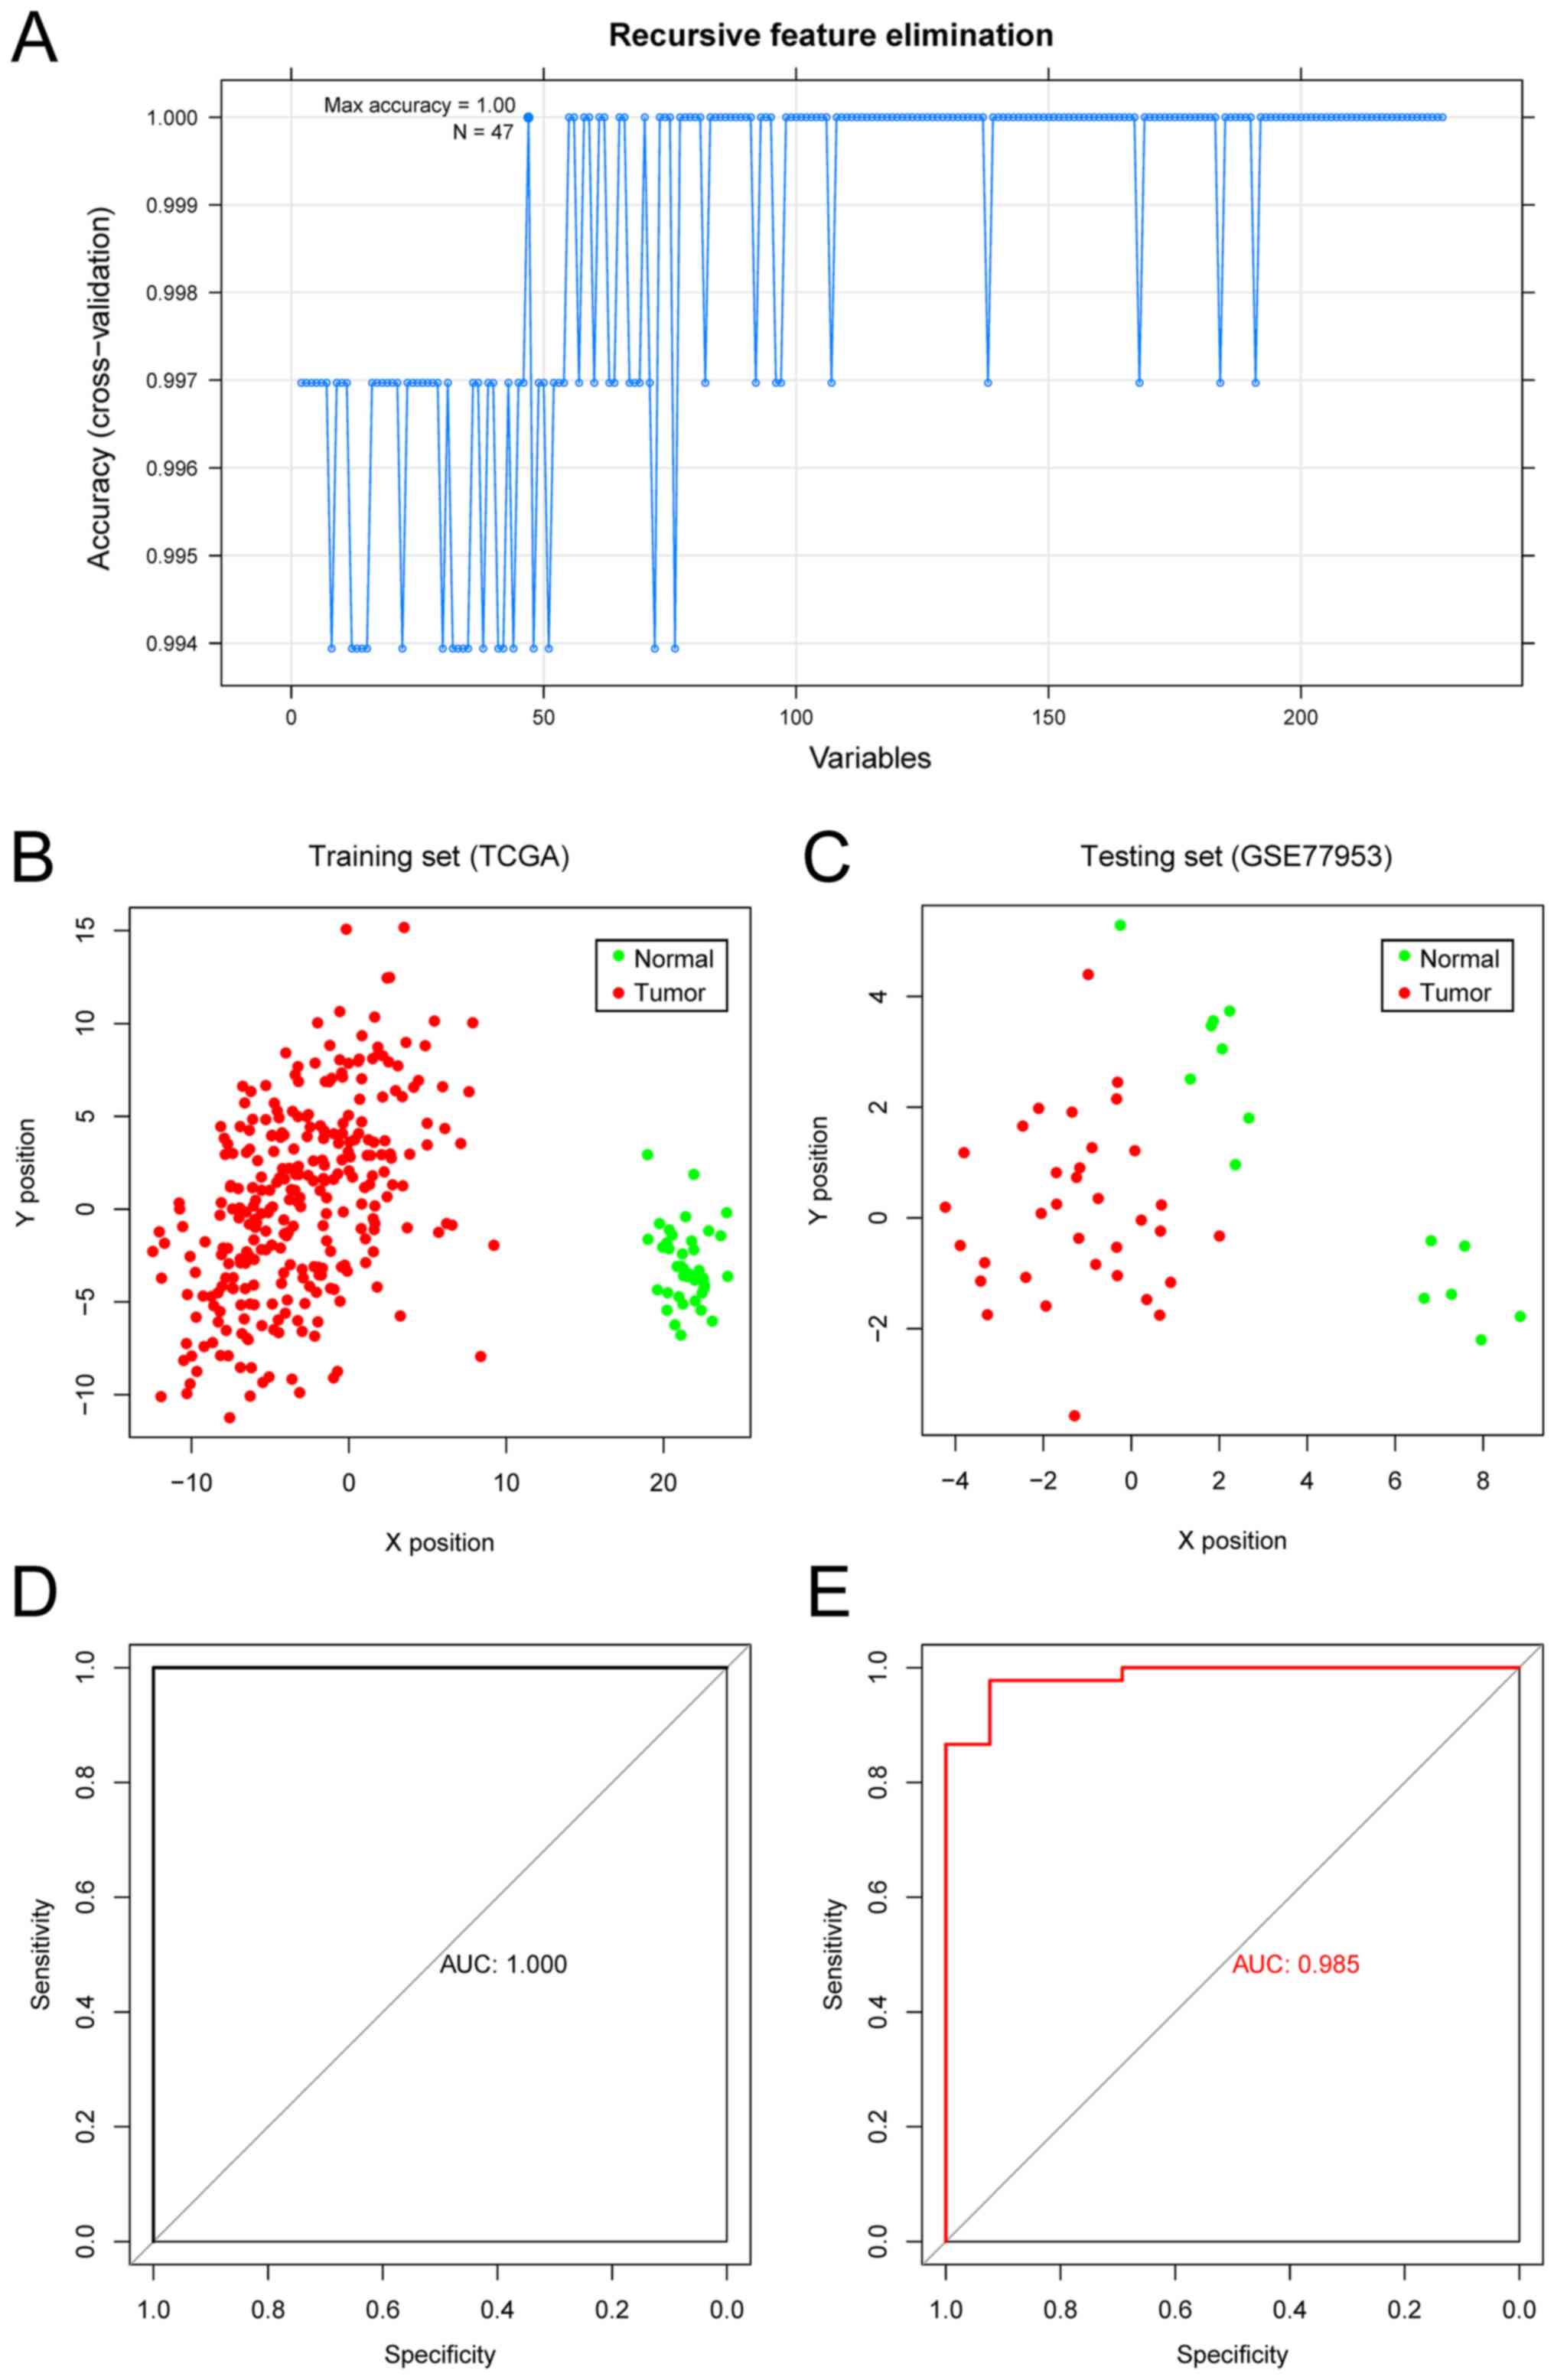
SVM method for sample
classification
The RFE algorithm was used to identify 47 optimal
marker genes from the aforementioned 218 candidate genes. An SVM
classifier was constructed using the 47 optimal marker genes,
achieving a mean accuracy rate of 100% (Fig. 2A). ROC curves were plotted to
calculate the AUC (Fig. 2B and D).
Furthermore, the GSE77955 dataset was used to independently
validate the sample classification efficiency, and a mean accuracy
of 97.9% was achieved (Fig. 2C and
E).
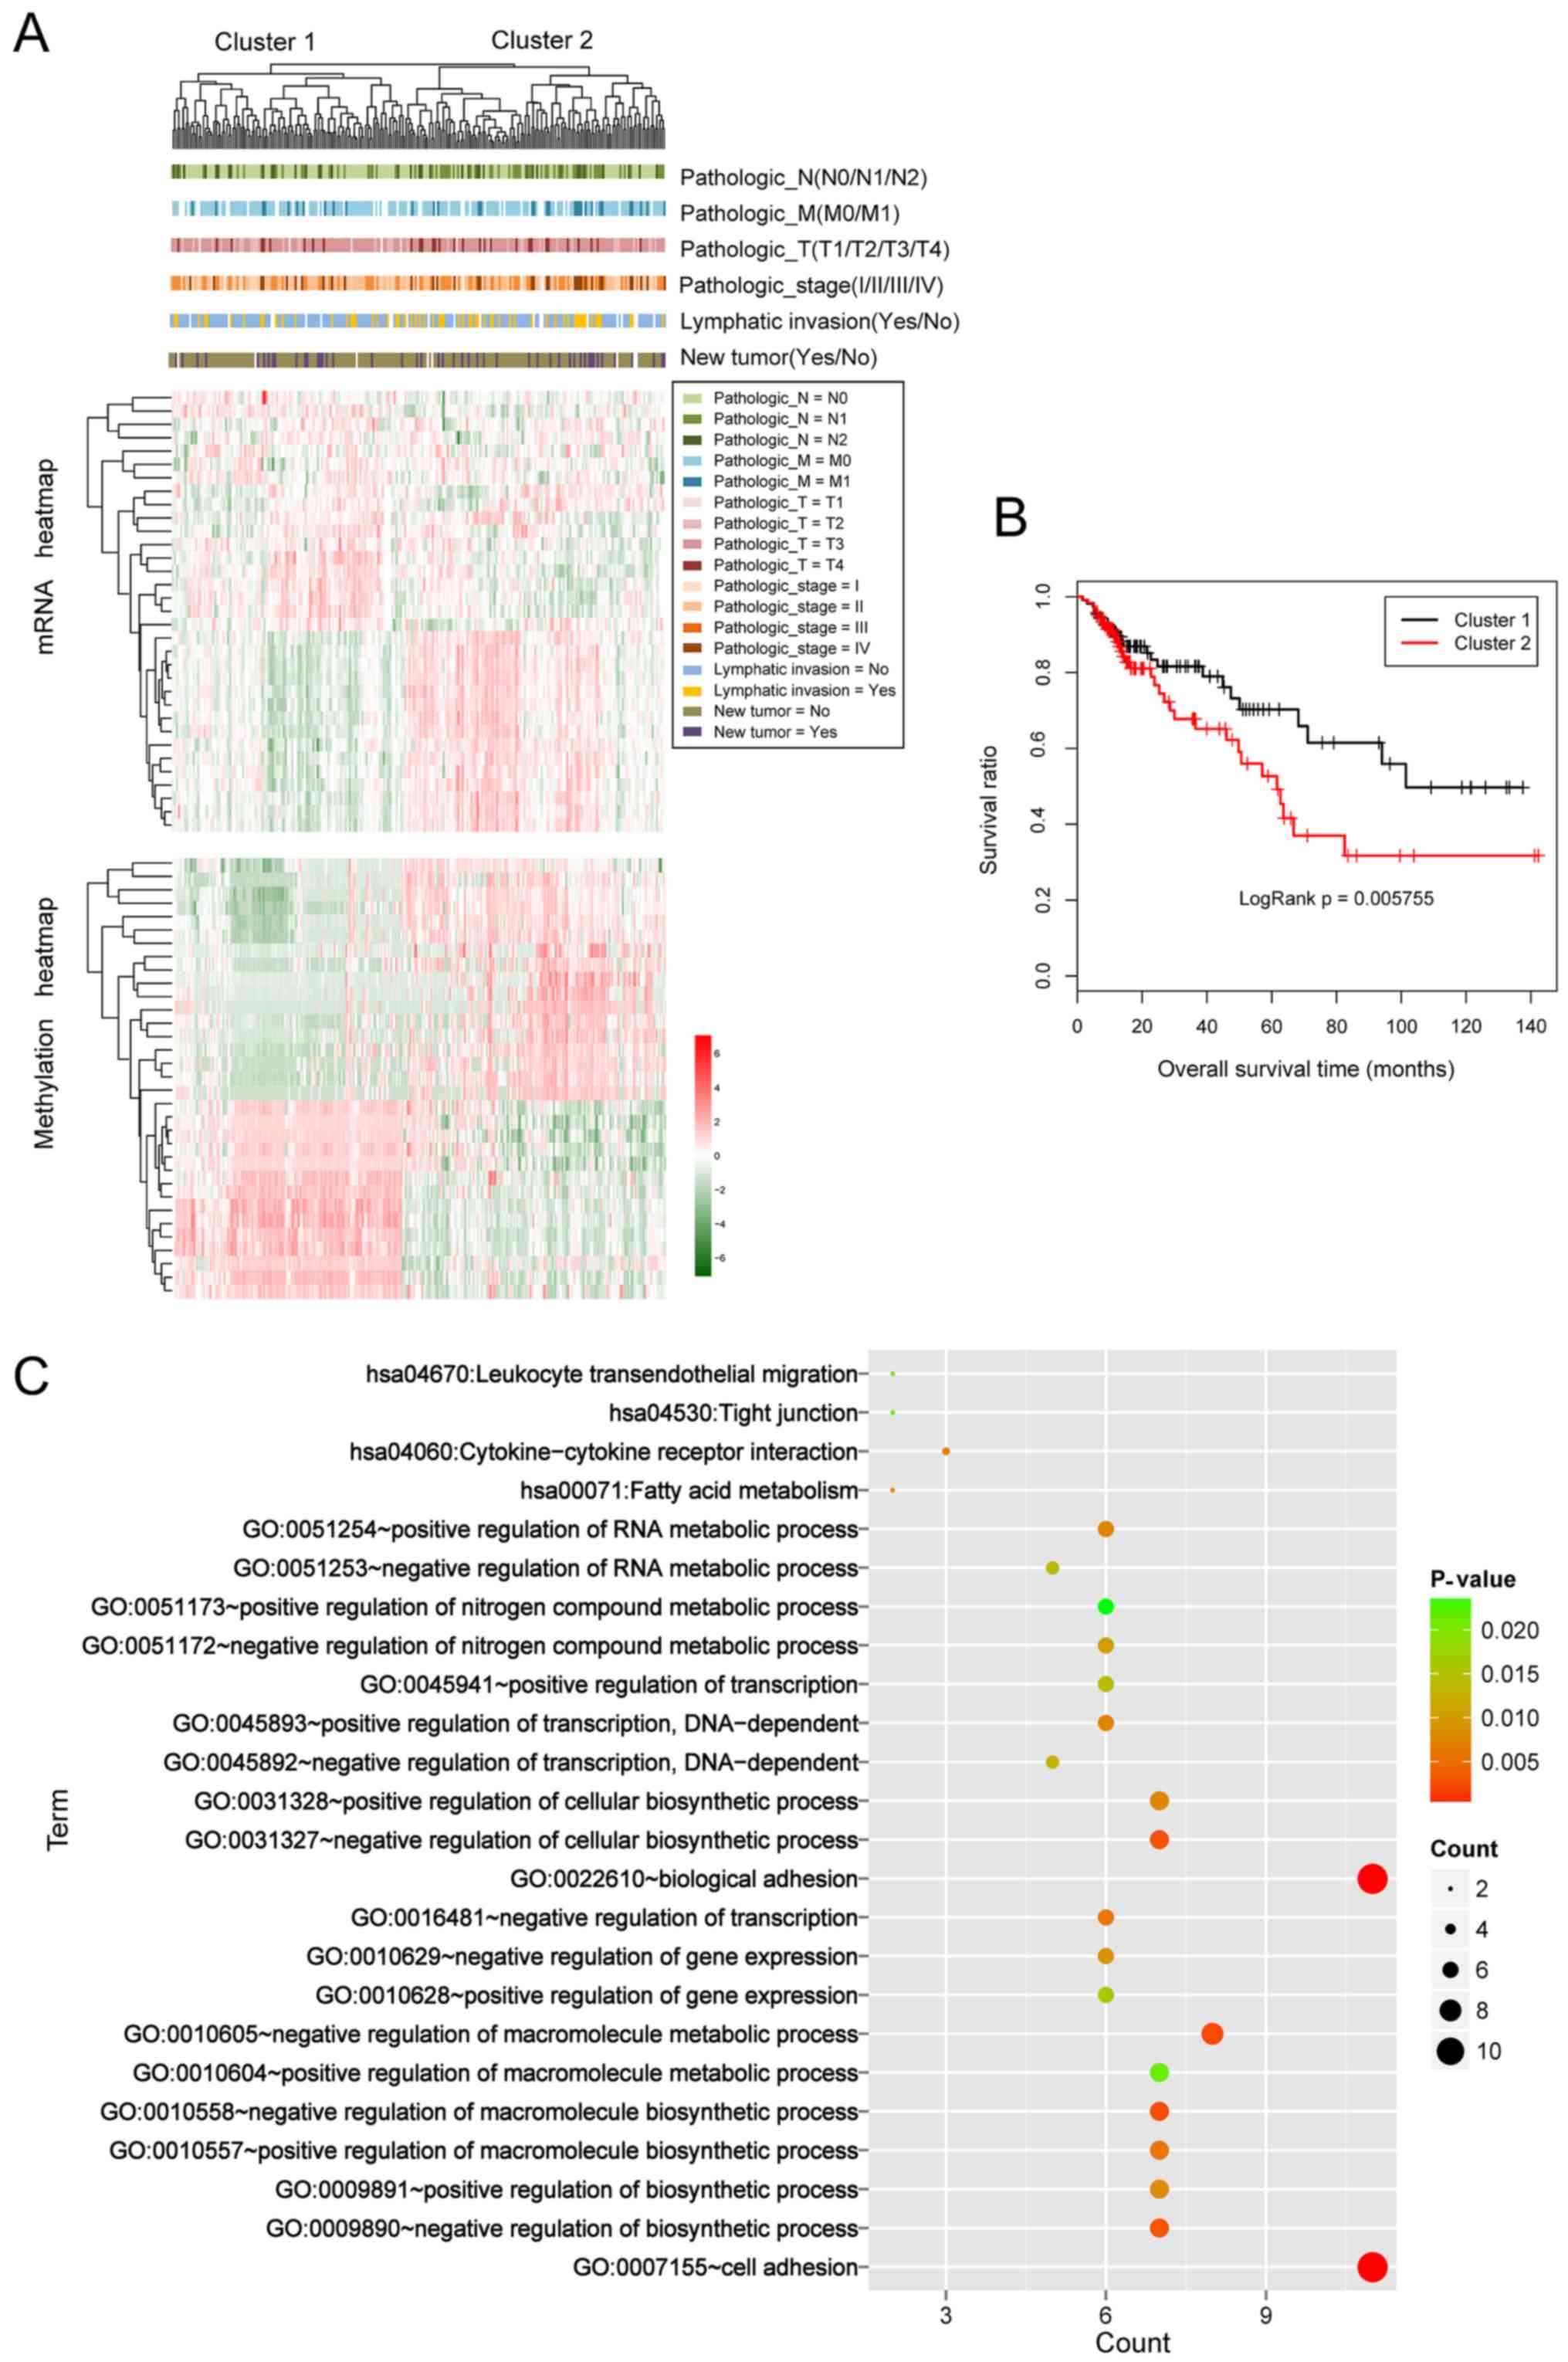
Cluster analysis was performed based on the
expression values and methylation levels of the 47 optimal marker
genes. The 239 samples from TCGA were divided into two groups,
cluster 1 and cluster 2 (Fig. 3A),
including 114 and 125 tumor samples, respectively. Kaplan-Meier
survival curves for the samples in the two groups are presented in
Fig. 3B. The log P-value was 0.006,
indicating a significant association of the samples with survival
outcome. The mean OS time in cluster 1 was significantly longer
than that in cluster 2 (33.890±33.790 months vs. 25.660±26.640
months; P=0.042). Moreover, the corresponding clinical information
of two cohort samples was analyzed. As presented in Table II, the distributions of the node and
disease stage were significantly different between two
clusters.
| Table II.Clinical information and Chi-square
test information for cluster 1 and 2 samples. |
Table II.
Clinical information and Chi-square
test information for cluster 1 and 2 samples.
| Clinical
characteristic | Cluster 1 | Cluster 2 | χ2 | P-value |
|---|
| Pathologic M
(M0/M1) | 76 | 10 | – | – | 76 | 22 | – | – | 3.018 | 0.082 |
| Pathologic N
(N0/N1/N2) | 75 | 18 | 17 | – | 57 | 44 | 20 | – | 13.107 | 0.001 |
| Pathologic T
(T1/T2/T3/T4) | 4 | 18 | 78 | 9 | 1 | 19 | 80 | 21 | 6.043 | 0.114 |
| Histological
differentiation (I/II/III/IV) | 21 | 48 | 30 | 10 | 18 | 17 | 39 | 23 | 14.306 | 0.003 |
| Lymphatic invasion
(yes/no) | 23 | 79 | – | – | 38 | 70 | – | – | 3.474 | 0.062 |
| New tumor
(yes/no) | 19 | 88 | – | – | 28 | 88 | – | – | 1.006 | 0.316 |
GO-BP terms and KEGG analyses were performed for the
47 candidate genes, and a total of 20 biological processes and 4
pathways were identified (Table
III; Fig. 3C). The results
revealed that these genes were significantly enriched in ‘cell
adhesion’, ‘biological adhesion process’, ‘fatty acid metabolism’
and ‘cytokine receptor interaction signaling’ pathways.
| Table III.GO and KEGG pathways enrichment
analysis for 47 candidate tumor genes. |
Table III.
GO and KEGG pathways enrichment
analysis for 47 candidate tumor genes.
| A, GO pathway
enrichment analysis |
|---|
|
|---|
| Term | Count | P-value |
|---|
| GO: 0007155~cell
adhesion | 11 | <0.001 |
| GO:
0022610~biological adhesion | 11 | <0.001 |
| GO:
0010605~negative regulation of macromolecule metabolic process | 8 | 0.002 |
| GO:
0010558~negative regulation of macromolecule biosynthetic
process | 7 | 0.003 |
| GO:
0031327~negative regulation of cellular biosynthetic process | 7 | 0.003 |
| GO:
0009890~negative regulation of biosynthetic process | 7 | 0.003 |
| GO:
0010557~positive regulation of macromolecule biosynthetic
process | 7 | 0.006 |
| GO:
0016481~negative regulation of transcription | 6 | 0.006 |
| GO:
0045893~positive regulation of transcription, DNA-dependent | 6 | 0.007 |
| GO:
0051254~positive regulation of RNA metabolic process | 6 | 0.008 |
| GO:
0031328~positive regulation of cellular biosynthetic process | 7 | 0.008 |
| GO:
0009891~positive regulation of biosynthetic process | 7 | 0.008 |
| GO:
0010629~negative regulation of gene expression | 6 | 0.009 |
| GO:
0051172~negative regulation of nitrogen compound metabolic
process | 6 | 0.010 |
| GO:
0045892~negative regulation of transcription, DNA-dependent | 5 | 0.013 |
| GO:
0051253~negative regulation of RNA metabolic process | 5 | 0.014 |
| GO:
0045941~positive regulation of transcription | 6 | 0.014 |
| GO:
0010628~positive regulation of gene expression | 6 | 0.016 |
| GO:
0010604~positive regulation of macromolecule metabolic process | 7 | 0.022 |
| GO:
0051173~positive regulation of nitrogen compound metabolic
process | 6 | 0.024 |
|
| B, KEGG pathway
enrichment analysis |
|
| Term | Count | P-value |
|
| hsa00071: Fatty
acid metabolism | 2 | 0.069 |
| hsa04060:
Cytokine-cytokine receptor interaction | 3 | 0.075 |
| hsa04670: Leukocyte
transendothelial migration | 2 | 0.191 |
| hsa04530: Tight
junction | 2 | 0.214 |
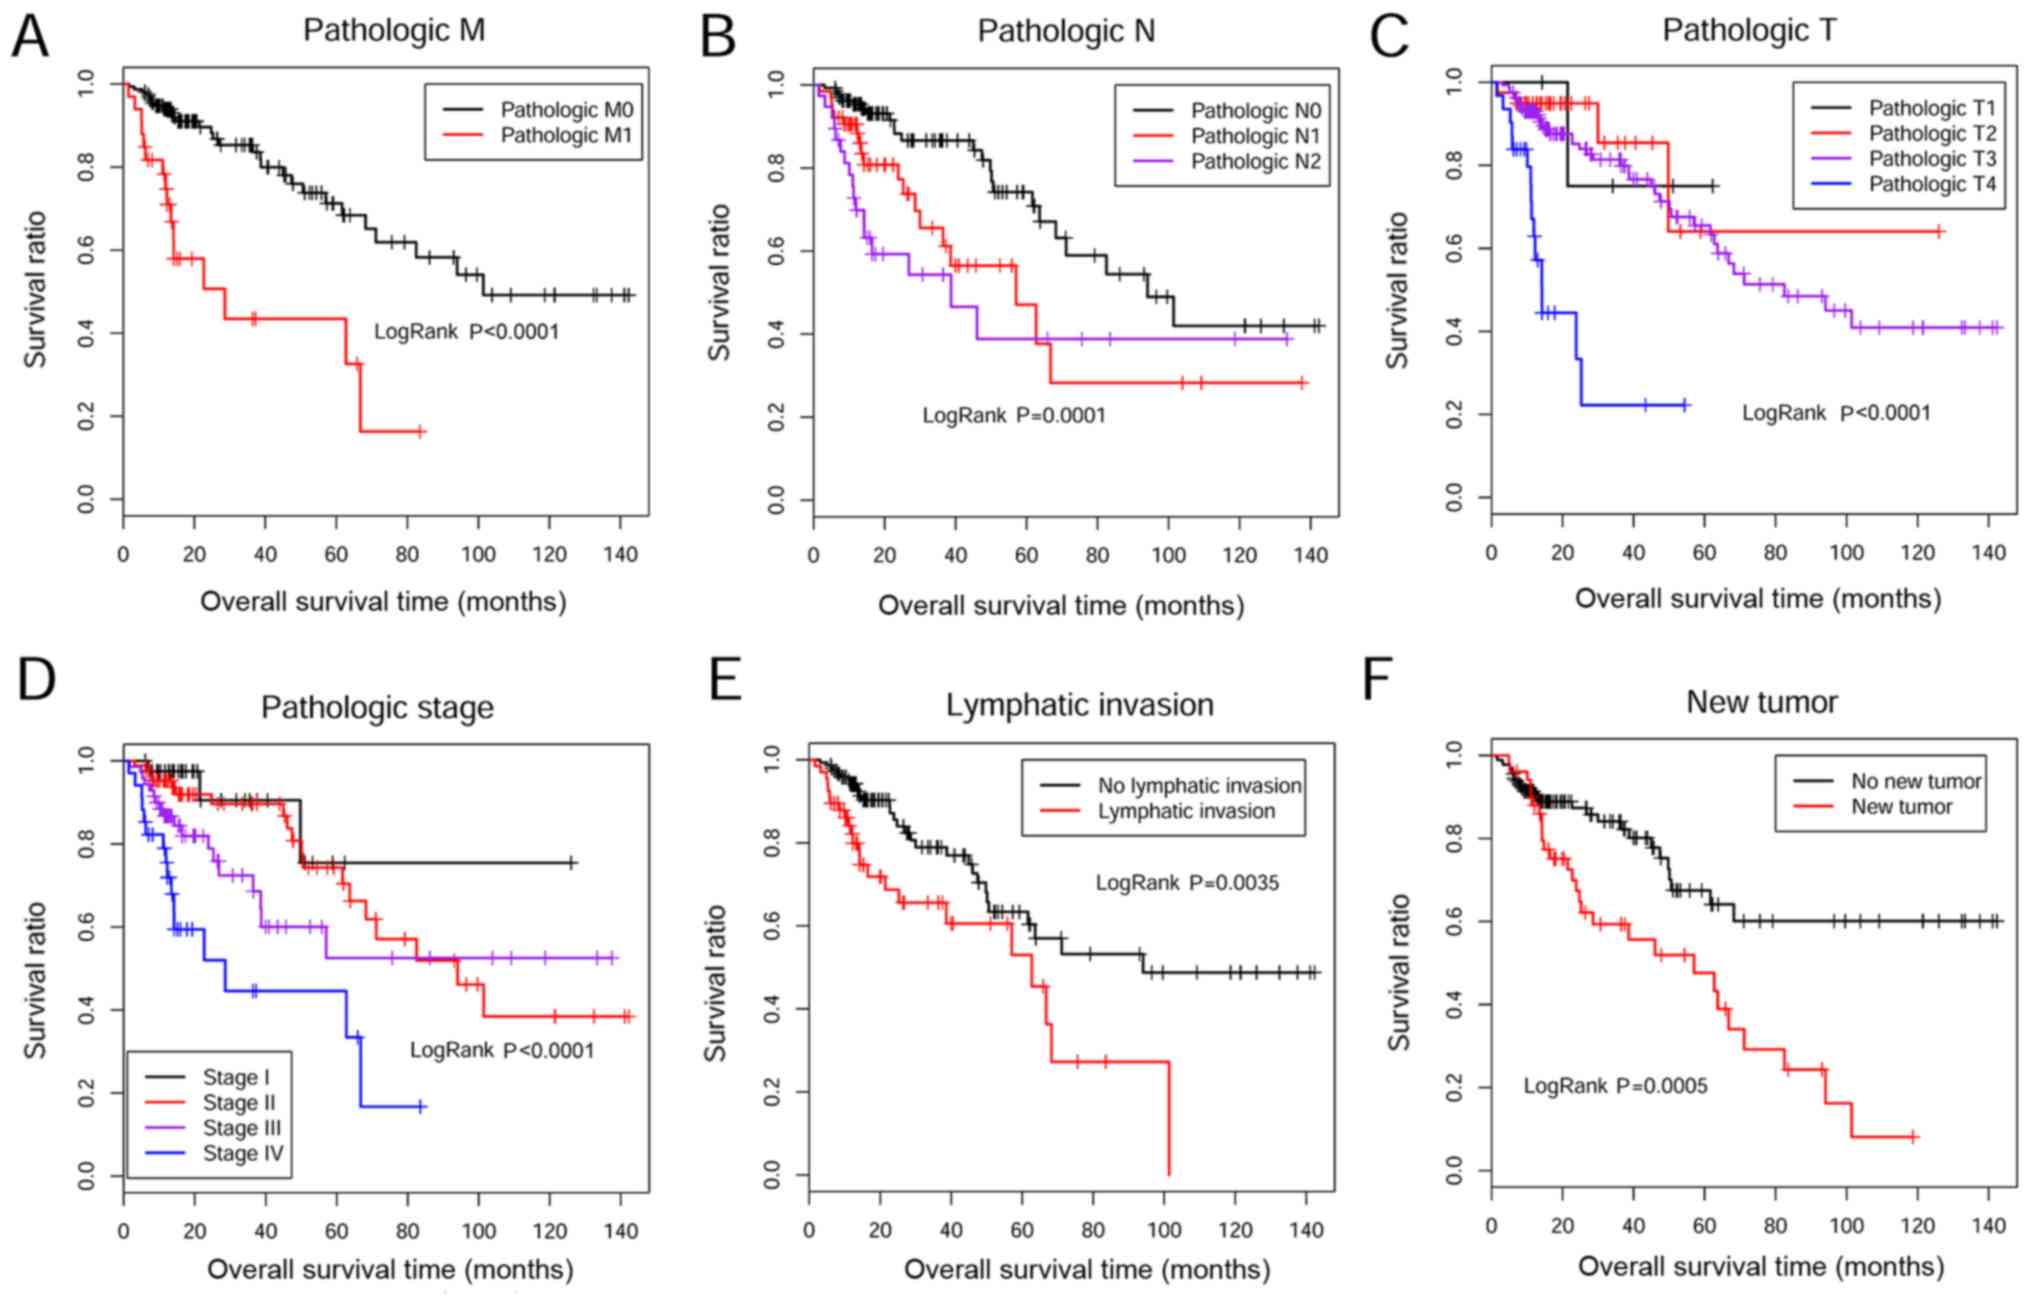
Screening prognostic tumor biomarker
genes and associated clinical factors
Univariable and multivariable Cox regression
analyses were performed to screen tumor biomarker genes and
prognostic clinical factors. Eight genes were significantly
associated with survival outcomes (Table IV), including endothelial
cell-specific molecule 1 (ESM1), pre-B-cell leukemia
transcriptional factor 3 (PBX4), acetyl-coenzyme A acyltransferase
2 (ACAA2), chromobox homolog 7 (CBX7), transcriptional enhancer
factor TEF-3 (TEAD4), claudin-1 (CLDN1), eukaryotic translated
initiation factor 4E family member 3 (EIF4E3) and zymogen granule
protein 16 (ZG16). Furthermore, there were six clinical factors
associated with OS times according to Kaplan-Meier survival curve
analysis, including metastasis stage (M0/M1/-), node stage
(N0/N1/N2), tumor stage (T1/T2/T3/T4/-), histological
differentiation (I/II/III/IV/-), lymphatic invasion (Yes/No/-) and
new tumor (recurrence or not) (Table
V; Fig. 4). Furthermore,
multivariable Cox regression analysis revealed that new tumor is an
independent clinical factor for CRC prognosis (P=0.001; Table V).
| Table IV.Candidate tumor marker genes
significantly associated with prognosis of colorectal cancer. |
Table IV.
Candidate tumor marker genes
significantly associated with prognosis of colorectal cancer.
| Gene name | Coefficient | Hazard ratio | P-value |
|---|
| Endothelial
cell-specific molecule 1 | 0.448 | 1.565 | 0.001 |
| Pre-B-cell leukemia
transcriptional factor 3 | 0.341 | 1.406 | 0.007 |
| Acetyl-coenzyme A
acyltransferase 2 | −0.413 | 0.662 | 0.008 |
| Chromobox homolog
7 | 0.409 | 1.506 | 0.015 |
| Transcriptional
enhancer factor TEF-3 | 0.363 | 1.44 | 0.022 |
| Claudin-1 | 0.124 | 1.132 | 0.038 |
| Eukaryotic
translated initiation factor 4E family member 3 | −0.159 | 0.853 | 0.039 |
| Zymogen granule
protein 16 | −0.047 | 0.955 | 0.040 |
| Table V.Univariable and multivariable Cox
regression analysis for prognostic clinical factors. |
Table V.
Univariable and multivariable Cox
regression analysis for prognostic clinical factors.
|
| Univariable cox
regression | Multivariable cox
regression |
|---|
|
|
|
|
|---|
| Clinical
characteristic | P-value | HR (95% CI) | P-value | HR (95% CI) |
|---|
| Age, years
(≤65/>65) | 0.137 | 1.501
(0.875–2.573) | – | – |
| Sex
(male/female) | 0.085 | 1.583
(0.935–2.683) | – | – |
| History of colon
polyps (yes/no/-) | 0.312 | 0.616
(0.239–1.589) | – | – |
| Pathologic M
(M0/M1/-) | <0.001 | 4.189
(2.238–7.839) | 0.8242 | 1.143
(0.352–3.710) |
| Pathologic N
(N0/N1/N2) | <0.001 | 1.777
(1.317–2.399) | 0.8034 | 1.149
(0.385–3.428) |
| Pathologic T
(T1/T2/T3/T4/-) | <0.001 | 3.375
(1.918–5.939) | 0.6650 | 1.593
(0.194–4.081) |
| Histological
differentiation (I/II/III/IV/-) | <0.001 | 1.919
(1.414–2.603) | 0.7191 | 1.438
(0.199–3.412) |
| Lymphatic invasion
(yes/no/-) | 0.004 | 2.217
(1.282–3.833) | 0.8923 | 1.074
(0.386–2.991) |
| New tumor
(yes/no/-) | <0.001 | 2.426
(1.444–4.076) | 0.0011 | 4.599
(1.837–11.520) |
Risk prediction model construction
based on tumor marker genes
A risk prediction model was constructed based on the
eight tumor marker genes identified through Cox regression
analysis. The PI of each tumor sample was calculated and the
samples in the two training sets were divided into high-risk and
low-risk groups with the median score (7.220) of PI as the cut-off
value.
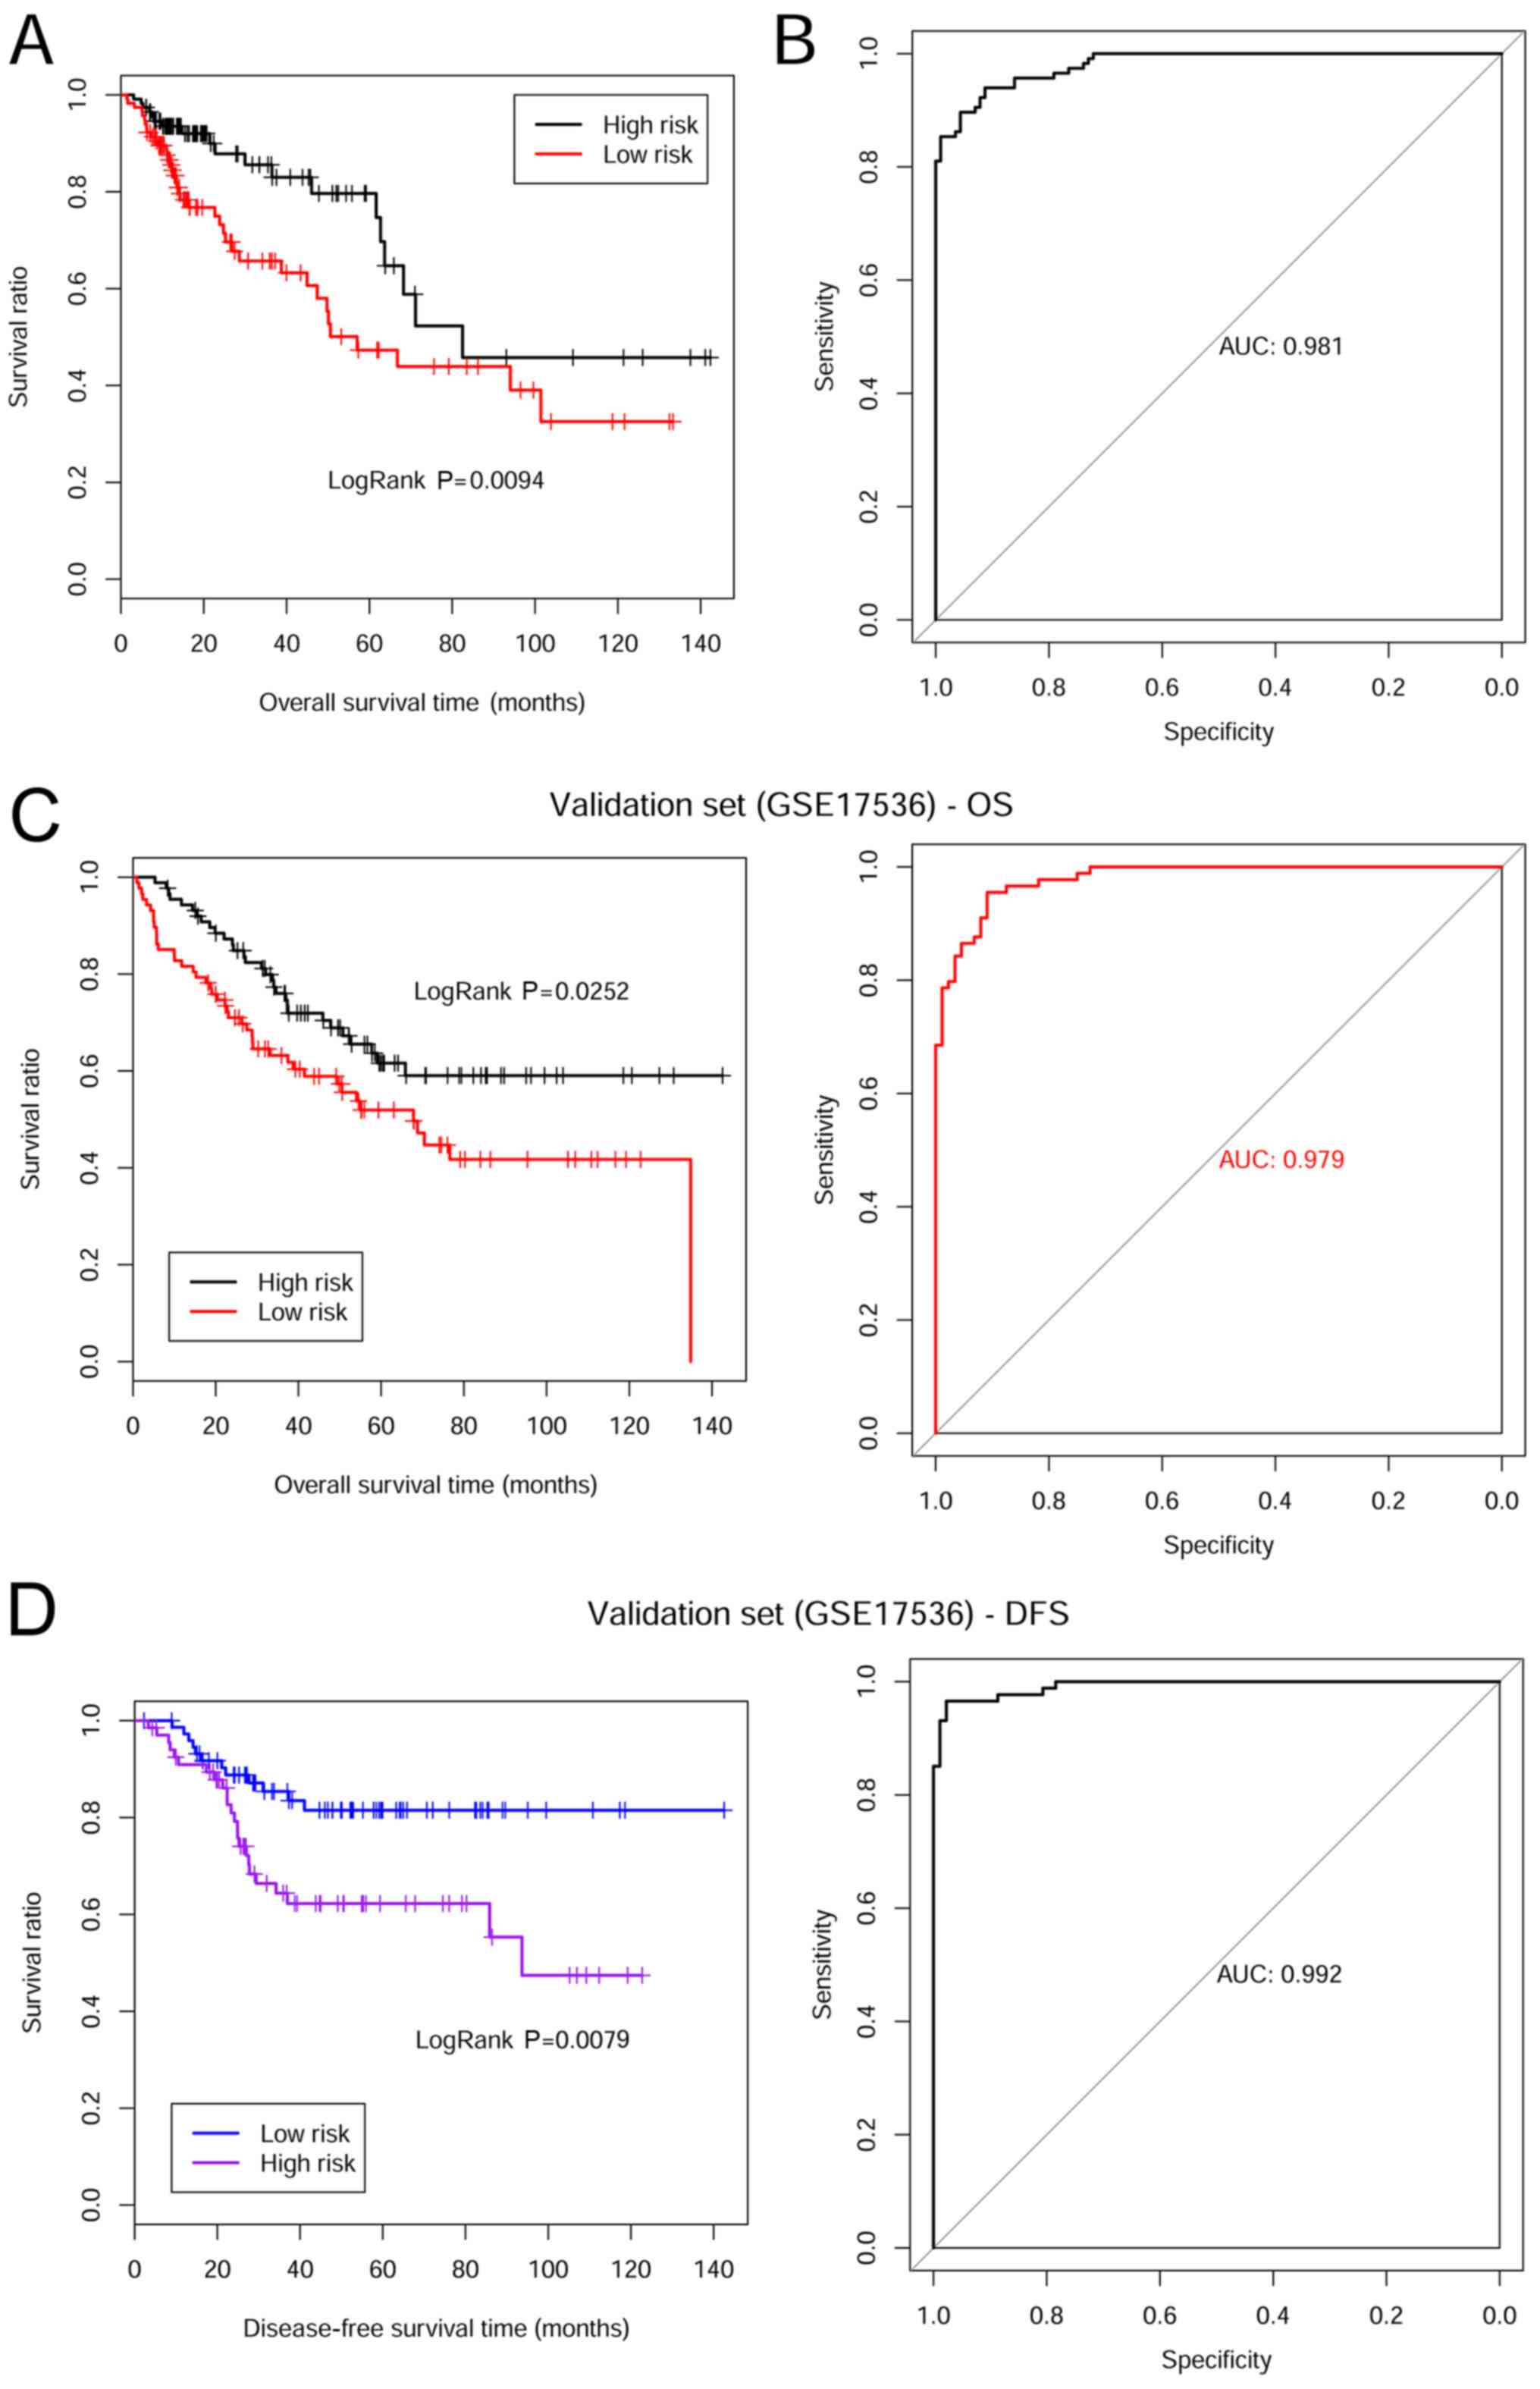
Kaplan-Meier survival curves were plotted based on
the risk prediction model of prognostic tumor marker genes for the
TCGA training set. The results revealed that patients in the
low-risk group had a significantly longer OS time compared with
those in the high-risk group (30.060±30.810 vs. 21.900±20.250
months, respectively; P=0.009; Fig.
5A). Prognosis prediction performance of this model was
assessed using a ROC curve, and an AUC of 0.981 was obtained
(Fig. 5B).
In addition, the OS and disease-free progression
survival (DFS) times were validated in the training set GSE17536.
For the OS time validation, patients in the low-risk group
exhibited a longer OS time compared with patients in the high-risk
group (52.510±31.230 vs. 44.740±33.380 months. respectively;
P=0.025; Fig. 5C). The ROC curve is
presented in Fig. 5C and the AUC was
0.979. Moreover, patients in the low-risk group exhibited a longer
DFS time compared with patients in the high-risk group
(42.390±32.770 vs. 33.440±32.590 months, respectively; P=0.008;
Fig. 5D). The AUC value was 0.992
(Fig. 5D).
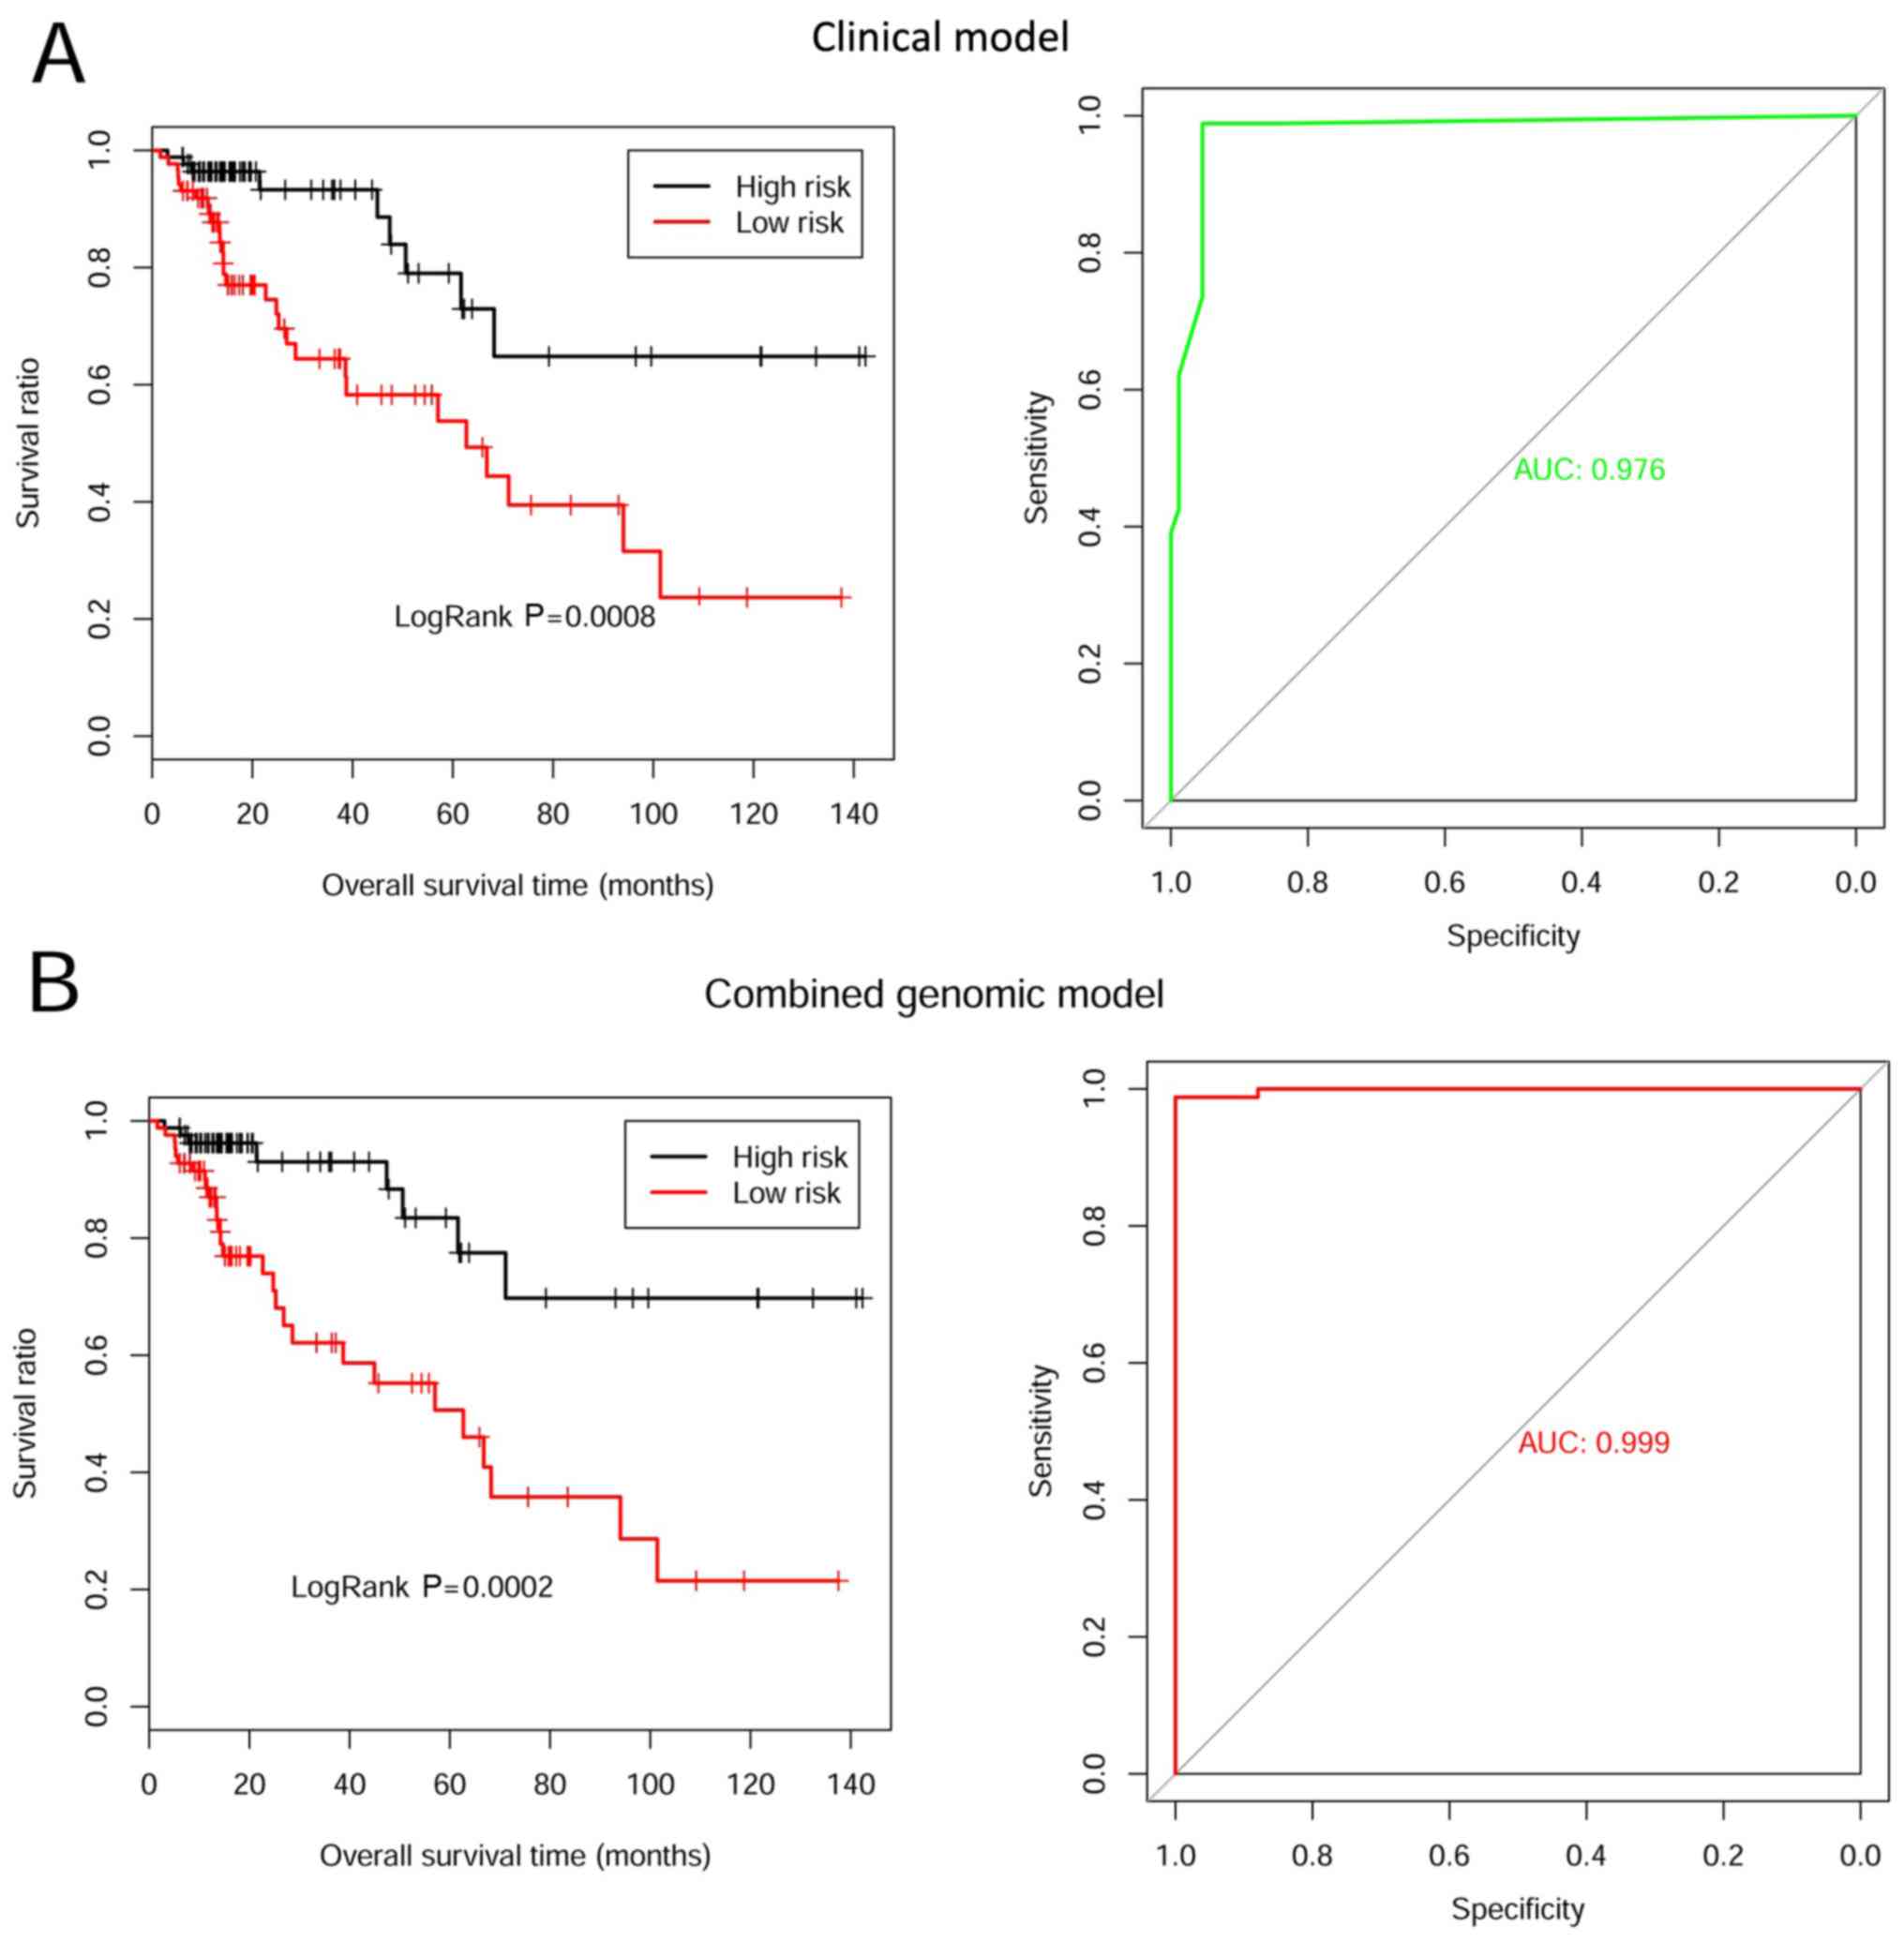
Risk prediction model construction
related to prognostic clinical factors
The risk prediction model of six clinical factors
was constructed based on Cox regression. Kaplan-Meier survival
curves were used to assess the prognosis prediction performance.
Patients in the low-risk group had a longer OS time compared with
those in the high-risk group (30.480±32.740 vs. 24.820±28.950
months, respectively; P<0.001; Fig.
6A). The ROC curve of prognostic discrimination accuracy of the
samples is presented in Fig. 6A, and
the AUC was 0.976.
The comprehensive predictive risk model was
constructed based on the integrated weight coefficients of the
eight tumor marker genes and six clinical factors. The PI of each
sample was re-calculated and Kaplan-Meier survival curves were
plotted to evaluate prognosis prediction performance. Patients in
the low-risk group had a longer OS time compared with those in the
high-risk group (31.690±34.010 vs. 21.890±20.710 months,
respectively; P<0.001; Fig. 6B).
The AUC value was 0.999 (Fig.
6B).
Discussion
In this present study, a total of 218 DEGs with
negative correlation between gene expression and methylation levels
were identified between CRC and healthy samples. Following the
construction of the SVM classifier, 47 genes were further
identified as potential tumor marker genes. GO and KEGG enrichment
analysis revealed that these genes were mainly associated with
‘cell adhesion’, ‘fatty acid metabolism’ and ‘cytokine receptor
interaction signaling’ pathways. Among these genes, univariable and
multivariable Cox regression analysis revealed that eight genes
(ESM1, PBX4, ACAA2, CBX7, TEAD4, CLDN1, EIF4E3 and ZG16) were
significantly associated with the survival times of patients with
CRC. The prognostic risk prediction models were constructed based
on these genes, six prognostic clinical factors or the combination
of the eight marker genes with the six clinical prognostic factors.
The performance of each prediction model was evaluated by using the
training and validation datasets. The eight genes were integrated
with the six clinical factors, and the accuracy of the integrated
risk prediction model increased. The P-value associated with risk
grouping and prognosis increased from 0.009 to 0.001. The AUC value
improved from 0.992 to 0.999, suggesting the comprehensive risk
prediction model exhibited a good performance for disease prognosis
prediction.
ESM1 is a protein that is mainly expressed on
endothelial cells in lung and kidney tissues (24). It serves a major role in
endothelium-dependent pathological disorders (25). The prognostic value of serum ESM1
expression in patients with CRC has been previously explored in a
Chinese population, and the results revealed that abnormal high
expression of ESM1 was significantly associated with histological
differentiation, TNM stage, tumor invasion and lymph node
metastasis (26). Kang et al
(27) demonstrated that activation
of the nuclear factor-κB signaling pathway is regulated by ESM-1,
and was associated with cell survival, migration and tumor invasion
in CRC. The present study revealed that upregulated ESM1 expression
and downregulated methylation levels were observed in CRC tissues
compared with adjacent tissues, and the abnormal expression level
was associated with the decreased OS time, which was consistent
with previous studies (28,29). These results indicated ESM1
expression may aid prognosis prediction for patients with CRC.
The results obtained in the current study revealed
that the 47 tumor marker genes are associated with cell adhesion.
Claudin proteins are cell membrane proteins associated with tight
junctions of epithelial cell polarity (28,29).
Reduced cell polarity and cell differentiation are frequently
observed in cancer, and are associated with tumor invasion and
metastasis (30). Abnormal
expression levels of claudin proteins have been reported in several
types of adenocarcinomas. For example, upregulation of claudin-3
was reported in ovarian and prostate carcinomas, and downregulated
claudin-7 has been found in several types of carcinoma, including
thyroid neoplasms, head and neck squamous cell carcinoma and
invasive esophageal cancer (31–33).
Correlation between CRC and CLDN1 expression has exhibited opposite
results. Shibutani et al (34) demonstrated that low expression of
CLDN1 in CRC tissues was correlated with poor prognosis in patients
with CRC and Bujko et al (35) revealed that upregulation of CLDN1 was
observed in CRC tissues compared with healthy adjacent tissues.
Although altered CLDN1 expression has been observed in colon
carcinoma, there are few studies investigating the roles of
epigenetic changes of this gene in CRC. Hahn-Strömberg et al
(36) recently demonstrated that
CLDN1 is significantly hypomethylated in CRC tumor samples compared
with paired normal mucosa samples. The present study demonstrated
that upregulated CLDN1 expression with abnormal low methylation
levels in tumor tissue and associated with OS time. Furthermore,
CLDN1 hypomethylation was associated with differences in biological
properties of the tumor, including pathological stage, metastasis
and prognosis.
CBX7 downregulation has been reported in multiple
human cancer tissues, including CRC (37). A previous study revealed that the
downregulation of CBX7 was negatively associated with survival
outcomes in patients with CRC (38).
TEAD4 promotes tumorigenesis by transcriptionally targeting
yes-associated protein (YAP)1 in CRC progression (39). Upregulation of TEAD4 may improve its
nuclear localization level, subsequently resulting in the
epithelial-mesenchymal transition through a YAP-independent manner
(40). ZG16 is located on human
chromosome 16 and serves as a tumor suppressor by decreasing CRC
cell proliferation via its carbohydrate-binding sites (41). Reduced ZG16 expression is associated
with pathological phenotypes of CRC (42). Based on the results obtained in the
aforementioned studies, CBX7, TEAD4 and ZG16 may be associated with
CRC progression. To the best of our knowledge, the current study is
the first to systemically demonstrate that the aberrant expression
and methylation levels of ESM1, PBX4, ACAA2, CBX7, TEAD4, CLDN1,
EIF4E3 and ZG16 are associated with the OS time of patients with
CRC. Therefore, these genes may serve as prognostic tumor marker
genes.
The current study had a number of limitations.
Firstly, the results obtained were not verified by in vitro
and in vivo experiments. Secondly, the number of CRC and
adjacent normal healthy samples was small. Additionally, since an
independent validation dataset containing the six clinical factors
is not available, the comprehensive risk prediction model cannot be
verified. Future studies integrating more methylation data to study
the mechanisms of gene methylation in CRC progression are
required.
In summary, the present study identified eight
methylated genes (ESM1, PBX4, ACAA2, CBX7, TEAD4, CLDN1, EIF4E3 and
ZG16) that may serve as potential tumor marker genes for prognosis
prediction of patients with CRC in a clinical setting.
Acknowledgements
Not applicable.
Funding
No funding was received.
Availability of data and materials
The datasets generated or analyzed during the
current study are available from the TCGA and GEO repositories
(accession nos. GSE GSE77955 and GSE17536).
Authors' contributions
FX conceived and designed the study. GH and WC
performed the data analysis and wrote the manuscript. All authors
read and approved the final manuscript.
Ethics approval and consent to
participate
Not applicable.
Patient consent for publication
Not applicable.
Competing interests
The authors declare that they have no competing
interests.
References
|
1
|
Arnold M, Sierra MS, Laversanne M,
Soerjomataram I, Jemal A and Bray F: Global patterns and trends in
colorectal cancer incidence and mortality. Gut. 66:683–691. 2017.
View Article : Google Scholar : PubMed/NCBI
|
|
2
|
Rougier P, Sahmoud T, Nitti D, Curran D,
Doci R, De Waele B, Nakajima T, Rauschecker H, Labianca R, Pector
JC, et al: Adjuvant portal-vein infusion of fluorouracil and
heparin in colorectal cancer: A randomised trial. European
Organisation for Research and Treatment of Cancer Gastrointestinal
Tract Cancer Cooperative Group, the Gruppo Interdisciplinare
Valutazione Interventi in Oncologia, and the Japanese Foundation
for Cancer Research. Lancet. 351:1677–1681. 1998. View Article : Google Scholar : PubMed/NCBI
|
|
3
|
Wood LD, D Williams P, Sian J, Lin J,
Sjöblom T, Leary RJ, Shen D, Boca SM, Barber T, Ptak J, et al: The
genomic landscapes of human breast and colorectal cancers. Science.
318:1108–1113. 2007. View Article : Google Scholar : PubMed/NCBI
|
|
4
|
Van Es JH and Clevers H: Notch and Wnt
inhibitors as potential new drugs for intestinal neoplastic
disease. Trends Mol Med. 11:496–502. 2005. View Article : Google Scholar : PubMed/NCBI
|
|
5
|
Watt FM: Unexpected hedgehog-Wnt
interactions in epithelial differentiation. Trends Mol Med.
10:577–580. 2004. View Article : Google Scholar : PubMed/NCBI
|
|
6
|
Pasparakis M: Role of NF-κB in epithelial
biology. Immunol Rev. 246:346–358. 2012. View Article : Google Scholar : PubMed/NCBI
|
|
7
|
Xie B, Zhao R, Bai B, Wu Y, Xu Y, Lu S,
Fang Y, Wang Z, Maswikiti EP, Zhou X, et al: Identification of key
tumorigenesisrelated genes and their microRNAs in colon cancer.
Oncol Rep. 40:3551–3560. 2018.PubMed/NCBI
|
|
8
|
Moore LD, Thuc L and Guoping F: DNA
methylation and its basic function. Neuropsychopharmacology.
38:23–38. 2013. View Article : Google Scholar : PubMed/NCBI
|
|
9
|
Fellow DHKLDMCR and Genetics SRiC: DNA
methylation: A form of epigenetic control of gene expression.
Obstetrician & Gynaecologist. 12:37–42. 2011.
|
|
10
|
Gaudet F, Hodgson JG, Eden A,
Jackson-Grusby L, Dausman J, Gray JW, Leonhardt H and Jaenisch R:
Induction of tumors in mice by genomic hypomethylation. Science.
300:489–492. 2003. View Article : Google Scholar : PubMed/NCBI
|
|
11
|
Rodriguez J, Frigola J, Vendrell E,
Risques RA, Fraga MF, Morales C, Moreno V, Esteller M, Capellà G,
Ribas M and Peinado MA: Chromosomal instability correlates with
genome-wide DNA demethylation in human primary colorectal cancers.
Cancer Res. 66:8462–9468. 2006. View Article : Google Scholar : PubMed/NCBI
|
|
12
|
McInnes T, Zou D, Rao DS, Munro FM,
Phillips VL, McCall JL, Black MA, Reeve AE and Guilford PJ:
Genome-wide methylation analysis identifies a core set of
hypermethylated genes in CIMP-H colorectal cancer. BMC Cancer.
17:2282017. View Article : Google Scholar : PubMed/NCBI
|
|
13
|
Xue W, Wu X, Wang F, Han P and Cui B:
Genome-wide methylation analysis identifies novel prognostic
methylation markers in colon adenocarcinoma. Biomed Pharmacother.
108:288–296. 2018. View Article : Google Scholar : PubMed/NCBI
|
|
14
|
Qu X, Sandmann T, Frierson H Jr, Fu L,
Fuentes E, Walter K, Okrah K, Rumpel C, Moskaluk C, Lu S, et al:
Integrated genomic analysis of colorectal cancer progression
reveals activation of EGFR through demethylation of the EREG
promoter. Oncogene. 35:6403–6415. 2016. View Article : Google Scholar : PubMed/NCBI
|
|
15
|
Smith JJ, Deane NG, Fei WU, Merchant NB,
Zhang B, Jiang A, Lu P, Johnson JC, Schmidt C, Bailey CE, et al:
Experimentally derived metastasis gene expression profile predicts
recurrence and death in patients with colon cancer.
Gastroenterology. 138:958–968. 2010. View Article : Google Scholar : PubMed/NCBI
|
|
16
|
Freeman TJ, Smith JJ, Chen X, Washington
MK, Roland JT, Means AL, Eschrich SA, Yeatman TJ, Deane NG and
Beauchamp RD: Smad4-mediated signaling inhibits intestinal
neoplasia by inhibiting expression of β-catenin. Gastroenterology.
142:562–571-e562. 2012. View Article : Google Scholar : PubMed/NCBI
|
|
17
|
Cortés-Ciriano I, Bender A and Malliavin
T: Prediction of PARP inhibition with proteochemometric modelling
and conformal prediction. Mol Inform. 34:357–366. 2015. View Article : Google Scholar : PubMed/NCBI
|
|
18
|
Lu X, Yang Y, Wu F, Gao M, Xu Y, Zhang Y,
Yao Y, Du X, Li C, Wu L, et al: Discriminative analysis of
schizophrenia using support vector machine and recursive feature
elimination on structural MRI images. Medicine (Baltimore).
95:e39732016. View Article : Google Scholar : PubMed/NCBI
|
|
19
|
Wang Q and Liu X: Screening of feature
genes in distinguishing different types of breast cancer using
support vector machine. Onco Targets Ther. 8:2311–2317.
2015.PubMed/NCBI
|
|
20
|
Wang L, Cao C, Ma Q, Zeng Q, Wang H, Cheng
Z, Zhu G, Qi J, Ma H, Nian H and Wang Y: RNA-seq analyses of
multiple meristems of soybean: Novel and alternative transcripts,
evolutionary and functional implications. BMC Plant Biol.
14:1692014. View Article : Google Scholar : PubMed/NCBI
|
|
21
|
Eisen MB, Spellman PT, Brown PO and
Botstein D: Cluster analysis and display of genome-wide expression
patterns. Proc Natl Acad Sci USA. 95:14863–14868. 1998. View Article : Google Scholar : PubMed/NCBI
|
|
22
|
Wang P, Wang Y, Hang B, Zou X and Mao JH:
A novel gene expression-based prognostic scoring system to predict
survival in gastric cancer. Oncotarget. 7:55343–55351.
2016.PubMed/NCBI
|
|
23
|
Goel MK, Khanna P and Kishore J:
Understanding survival analysis: Kaplan-Meier estimate. Int J
Ayurveda Res. 1:274–278. 2010. View Article : Google Scholar : PubMed/NCBI
|
|
24
|
Young JN, Young-Ho K, Jin JY, Kang YH, Lee
CI, Kim JW, Yeom YI, Chun HK, Choi YH, Kim JH, et al:
Identification of endothelial cell-specific molecule-1 as a
potential serum marker for colorectal cancer. Cancer Sci.
101:2248–2253. 2010. View Article : Google Scholar : PubMed/NCBI
|
|
25
|
Lassalle P, Molet S, Janin A, Heyden JV,
Tavernier J, Fiers W, Devos R and Tonnel AB: ESM-1 is a novel human
endothelial cell-specific molecule expressed in lung and regulated
by cytokines. J Biol Chem. 271:20458–20464. 1996. View Article : Google Scholar : PubMed/NCBI
|
|
26
|
Jiang H, Fu XG and Chen YT: Serum level of
endothelial cell-specific molecule-1 and prognosis of colorectal
cancer. Genet Mol Res. 14:5519–5526. 2015. View Article : Google Scholar : PubMed/NCBI
|
|
27
|
Kang YH, Ji Ny, Han SR, Lee CI, Kim JW,
Yeom YI, Kim YH, Chun HK, Kim JW, Chung JW, et al: ESM-1 regulates
cell growth and metastatic process through activation of NF-κB in
colorectal cancer. Cell Signal. 24:1940–1949. 2012. View Article : Google Scholar : PubMed/NCBI
|
|
28
|
Tsukita S, Furuse M and Itoh M:
Multifunctional strands in tight junctions. Nat Rev Mol Cell Biol.
2:285–293. 2001. View
Article : Google Scholar : PubMed/NCBI
|
|
29
|
Feigin ME and Muthuswamy SK: Polarity
proteins regulate mammalian cell-cell junctions and cancer
pathogenesis. Curr Opin Cell Biol. 21:694–700. 2009. View Article : Google Scholar : PubMed/NCBI
|
|
30
|
Martin TA and Jiang WG: Tight junctions
and their role in cancer metastasis. Histol Histopathol.
16:1183–1195. 2001.PubMed/NCBI
|
|
31
|
Tzelepi VN, Tsamandas AC, Vlotinou HD,
Vagianos CE and Scopa CD: Tight junctions in thyroid
carcinogenesis: Diverse expression of claudin-1, claudin-4,
claudin-7 and occludin in thyroid neoplasms. Mod Pathol. 21:22–30.
2008. View Article : Google Scholar : PubMed/NCBI
|
|
32
|
Al Moustafa AE, Alaoui-Jamali MA, Batist
G, Hernandez-Perez M, Serruya C, Alpert L, Black MJ, Sladek R and
Foulkes WD: Identification of genes associated with head and neck
carcinogenesis by cDNA microarray comparison between matched
primary normal epithelial and squamous carcinoma cells. Oncogene.
21:2634–2640. 2002. View Article : Google Scholar : PubMed/NCBI
|
|
33
|
Lioni M, Brafford P, Andl C, Rustgi A,
El-Deiry W, Herlyn M and Smalley KS: Dysregulation of claudin-7
leads to loss of E-cadherin expression and the increased invasion
of esophageal squamous cell carcinoma cells. Am J Pathol.
170:709–721. 2007. View Article : Google Scholar : PubMed/NCBI
|
|
34
|
Shibutani M, Noda E, Maeda K, Nagahara H,
Ohtani H and Hirakawa K: Low expression of claudin-1 and presence
of poorly-differentiated tumor clusters correlate with poor
prognosis in colorectal cancer. Anticancer Res. 33:3301–3306.
2013.PubMed/NCBI
|
|
35
|
Bujko M, Kober P, Mikula M, Ligaj M,
Ostrowski J and Siedlecki JA: Expression changes of cell-cell
adhesion-related genes in colorectal tumors. Oncol Lett.
9:2463–2470. 2015. View Article : Google Scholar : PubMed/NCBI
|
|
36
|
Hahn-Strömberg V, Askari S, Ahmad A,
Befekadu R and Nilsson TK: Expression of claudin 1, claudin 4, and
claudin 7 in colorectal cancer and its relation with CLDN DNA
methylation patterns. Tumour Biol. 39:10104283176975692017.
View Article : Google Scholar : PubMed/NCBI
|
|
37
|
Guan ZP, Gu LK, Xing BC, Ji JF, Gu J and
Deng DJ: Downregulation of chromobox protein homolog 7 expression
in multiple human cancer tissues. Zhonghua Yu Fang Yi Xue Za Zhi.
45:597–600. 2011.(In Chinese). PubMed/NCBI
|
|
38
|
Pallante P, Terracciano L, Carafa V,
Schneider S, Zlobec I, Lugli A, Bianco M, Ferraro A, Sacchetti S,
Troncone G, et al: The loss of the CBX7 gene expression represents
an adverse prognostic marker for survival of colon carcinoma
patients. Eur J Cancer. 46:2304–2313. 2010. View Article : Google Scholar : PubMed/NCBI
|
|
39
|
Tang JY, Yu CY, Bao YJ, Chen L, Chen J,
Yang SL, Chen HY, Hong J and Fang JY: TEAD4 promotes colorectal
tumorigenesis via transcriptionally targeting YAP1. Cell Cycle.
17:102–109. 2018. View Article : Google Scholar : PubMed/NCBI
|
|
40
|
Liu Y, Wang G, Yang Y, Mei Z, Liang Z, Cui
A, Wu T, Liu CY and Cui L: Increased TEAD4 expression and nuclear
localization in colorectal cancer promote epithelial mesenchymal
transition and metastasis in a YAP-independent manner. Oncogene.
35:2789–2800. 2016. View Article : Google Scholar : PubMed/NCBI
|
|
41
|
Mito A, Nakano Y, Saitoh T, Gouraud SSS,
Yamaguchi Y, Sato T, Sasaki N and Kojima-Aikawa K: Lectin ZG16p
inhibits proliferation of human colorectal cancer cells via its
carbohydrate-binding sites. Glycobiology. 28:21–31. 2018.
View Article : Google Scholar : PubMed/NCBI
|
|
42
|
Meng H, Li W, Boardman LA and Wang L: Loss
of ZG16 is associated with molecular and clinicopathological
phenotypes of colorectal cancer. BMC Cancer. 18:4332018. View Article : Google Scholar : PubMed/NCBI
|