Introduction
Lung cancer is the leading cause of
cancer-associated mortality worldwide in men and women, and its
prognosis remains dismal with a five-year survival rate of <15%
(1). Non-small cell lung cancer
(NSCLC), including lung adenocarcinoma (LUAD) and lung squamous
cell carcinoma (LUSC), accounts for ~75–80% of all lung cancer
cases (2). In addition, although
there are several treatment methods for patients with early-stage
NSCLC, including surgery, chemotherapy, radiotherapy and molecular
targeted therapy, the number of NSCLC cases is still increasing. In
addition, treatment options for patients with advanced disease are
limited (3), and almost 80% of
patients with NSCLC are first diagnosed at an advanced stage
(4). Therefore, there is an urgent
requirement to conduct further investigations to study the
mechanisms of the onset and progression of NSCLC, as well as to
identify potential prognostic biomarkers. The development of
prognostic biomarkers may improve the therapeutic choice for
patients with NSCLC, and ultimately improve their prognosis.
The pituitary tumor transforming gene (PTTG) family
is a novel class of homologous genes, which consists of three
genes: PTTG1, PTTG2 and PTTG3P (5).
The expression of PTTG1 is significantly upregulated in numerous
endocrine-associated tumors, including pituitary, thyroid, breast
and ovarian tumors (6). The
dysregulation of PTTG1 enhances tumor cell proliferation, invasion
and metastasis, and suppresses apoptosis (7–9). A
number of studies have demonstrated that PTTG1 is an oncogene, and
is overexpressed in human lung cancer. For example, Li et al
(10) have reported that PPTG1
promotes the migration and invasion of NSCLC. In addition, Li et
al (11) have demonstrated that
knockdown of PTTG1 suppresses growth and invasion of LUAD. PTTG2
and PTTG3P, which are homologous genes of PTTG1, have recently been
identified (5). Although little is
understood regarding their biological functions, PTTG2 and PTTG3P
have been revealed to be closely associated with the development of
human cancer types. For example, Guo et al (12) have demonstrated that PTTG2 expression
is significantly upregulated in glioblastoma, and its
overexpression promoted glioblastoma cell proliferation and
invasion. Weng et al (13)
have demonstrated that PTTG3P enhances the in vitro
proliferation and invasion of gastric cancer, and is an indicator
of poor prognosis. However, to date, systematic analyses have not
been performed for the mRNA expression pattern and prognostic roles
of the PTTG family in NSCLC.
The present study determined the mRNA expression
pattern of PTTG family genes in NSCLC, including LUAD and LUSC,
using the Gene Expression Profiling Interactive Analysis (GEPIA),
UALCAN and Oncomine databases. Subsequently, the prognostic values
of PTTG family genes in NSCLC were assessed using the Kaplan-Meier
plotter database. The Kaplan-Meier plotter database was also used
to analyze the associations of PTTG1, PTTG2 and PTTG3P expression
with the prognosis of patients based on clinicopathological
features, including subtype, clinical stage, pathological grade,
chemotherapy, radiotherapy, lymph node status, smoking history and
sex. The in silico analysis performed in the present study
may assist with the development of effective therapeutic targets
and contribute to the improvement of the prognosis of patients with
NSCLC.
Materials and methods
GEPIA database (http://gepia.cancer-pku.cn/detail.php)
The expression levels of PTTG family genes in
patients with LUAD and LUSC were evaluated using the GEPIA
database, which is a newly developed interactive web server for
analyzing the RNA sequencing expression data of 9,736 tumors and
8,587 normal samples from The Cancer Genome Atlas (TCGA) and
Genotype-Tissue Expression projects (14). The results of differential expression
analyses (PTTG1, PTTG2 and PTTG3P in LUAD/LUSC) are available on
the website (GEPIA). Fold-change (FC)>2 and P<0.05 were set
as the thresholds of gene upregulation.
UALCAN database (http://ualcan.path.uab.edu/index.html)
The expression levels of PTTG family genes in
patients with LUAD and LUSC were further analyzed using the UALCAN
database. UALCAN is a user-friendly, interactive web resource for
analyzing TCGA transcriptome data (15). The analytical results were presented
on the webpage (UALCAN). P<0.05 was considered to indicate a
statistically significant result.
Oncomine database (https://www.oncomine.org)
Oncomine, which is a cancer microarray database and
a web-based data-mining platform, was used to analyze the
expression levels of PTTG family genes in LUAD and LUSC samples
compared with normal lung samples using the differential expression
analysis provided by the database (16,17).
FC>1.5, P<0.05 and a gene rank in the top 10% were set as the
thresholds for selecting the datasets.
Kaplan-Meier plotter database
(http://kmplot.com/analysis)
The prognostic value of the mRNA expression levels
of PTTG family genes in patients with NSCLC was assessed using the
online database Kaplan-Meier plotter, as previously described
(18–20). Kaplan-Meier plotter was established
using gene expression data and the survival information of patients
with cancer downloaded from the Gene Expression Omnibus database
(21). In the present study, the
associations between PTTG1, PTTG2 and PTTG3P expression levels and
the overall survival (OS) of patients with NSCLC were evaluated.
Briefly, the three genes were first put into the database to obtain
Kaplan-Meier survival plots. According to the median expression
level, the cases were generally classified into low- and
high-expression groups. A log-rank P-value, hazard ratio (HR) and
95% confidence interval (CI) were automatically calculated and
presented on the webpage (Kaplan-Meier plotter). A log-rank
P<0.05 was considered to indicate a statistically significant
difference.
Results
Expression levels of the PTTG family
genes in patients with NSCLC
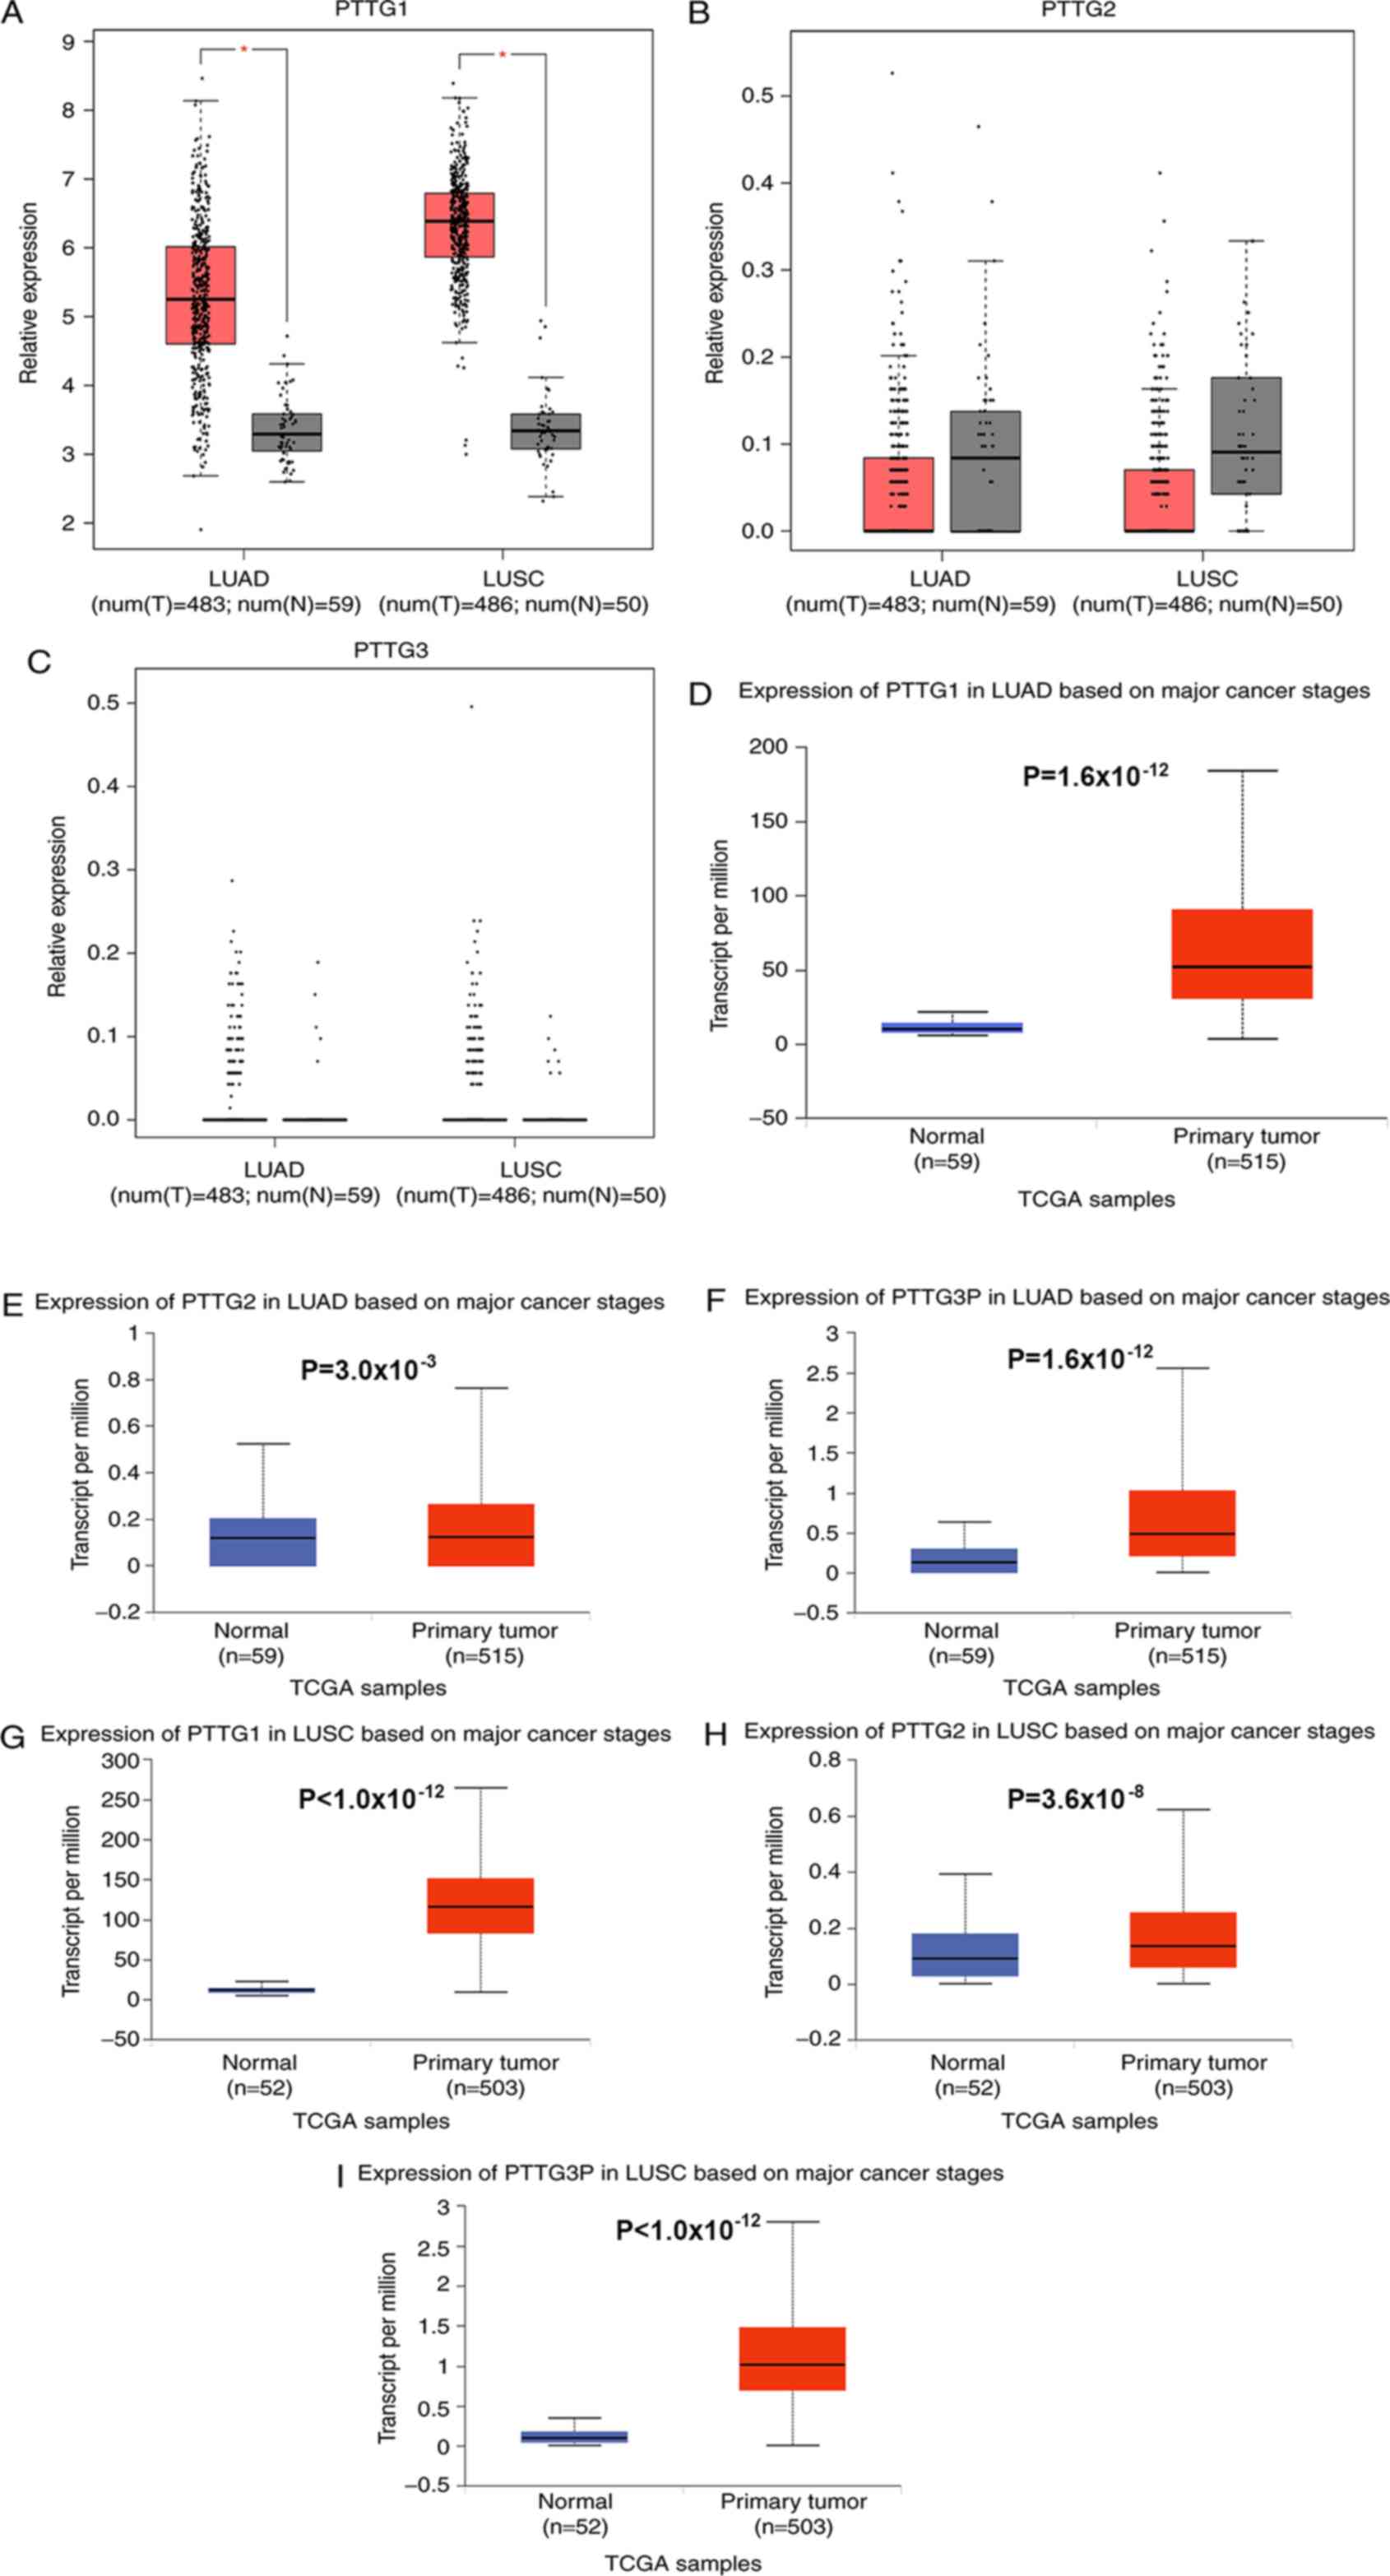
To investigate the mRNA expression levels of PTTG
family genes in human NSCLC, three online databases, including
GEPIA, UALCAN and Oncomine, were successively used. The GEPIA
database was used to compare the mRNA expression levels of PTTG
family genes in NSCLC samples with those in normal lung samples.
PTTG1 expression was significantly upregulated in NSCLC subtypes
LUAD and LUSC compared with normal lung samples (Fig. 1A). However, no significant
differences were identified between PTTG2 or PTTG3P expression in
cancer tissues and normal tissues (Fig.
1B and C). PTTG3P expression levels in LUAD, LUSC and
corresponding normal controls were extremely low. Similar results
of the expression levels of PTTG family genes in NSCLC were
obtained using the UALCAN database (Fig.
1D-I). The UALCAN database demonstrated that the expression
levels of PTTG2 and PTTG3P were low (transcripts per million
<1), which may lead to inaccurate statistical differences of
PTTG2 and PTTG3P.
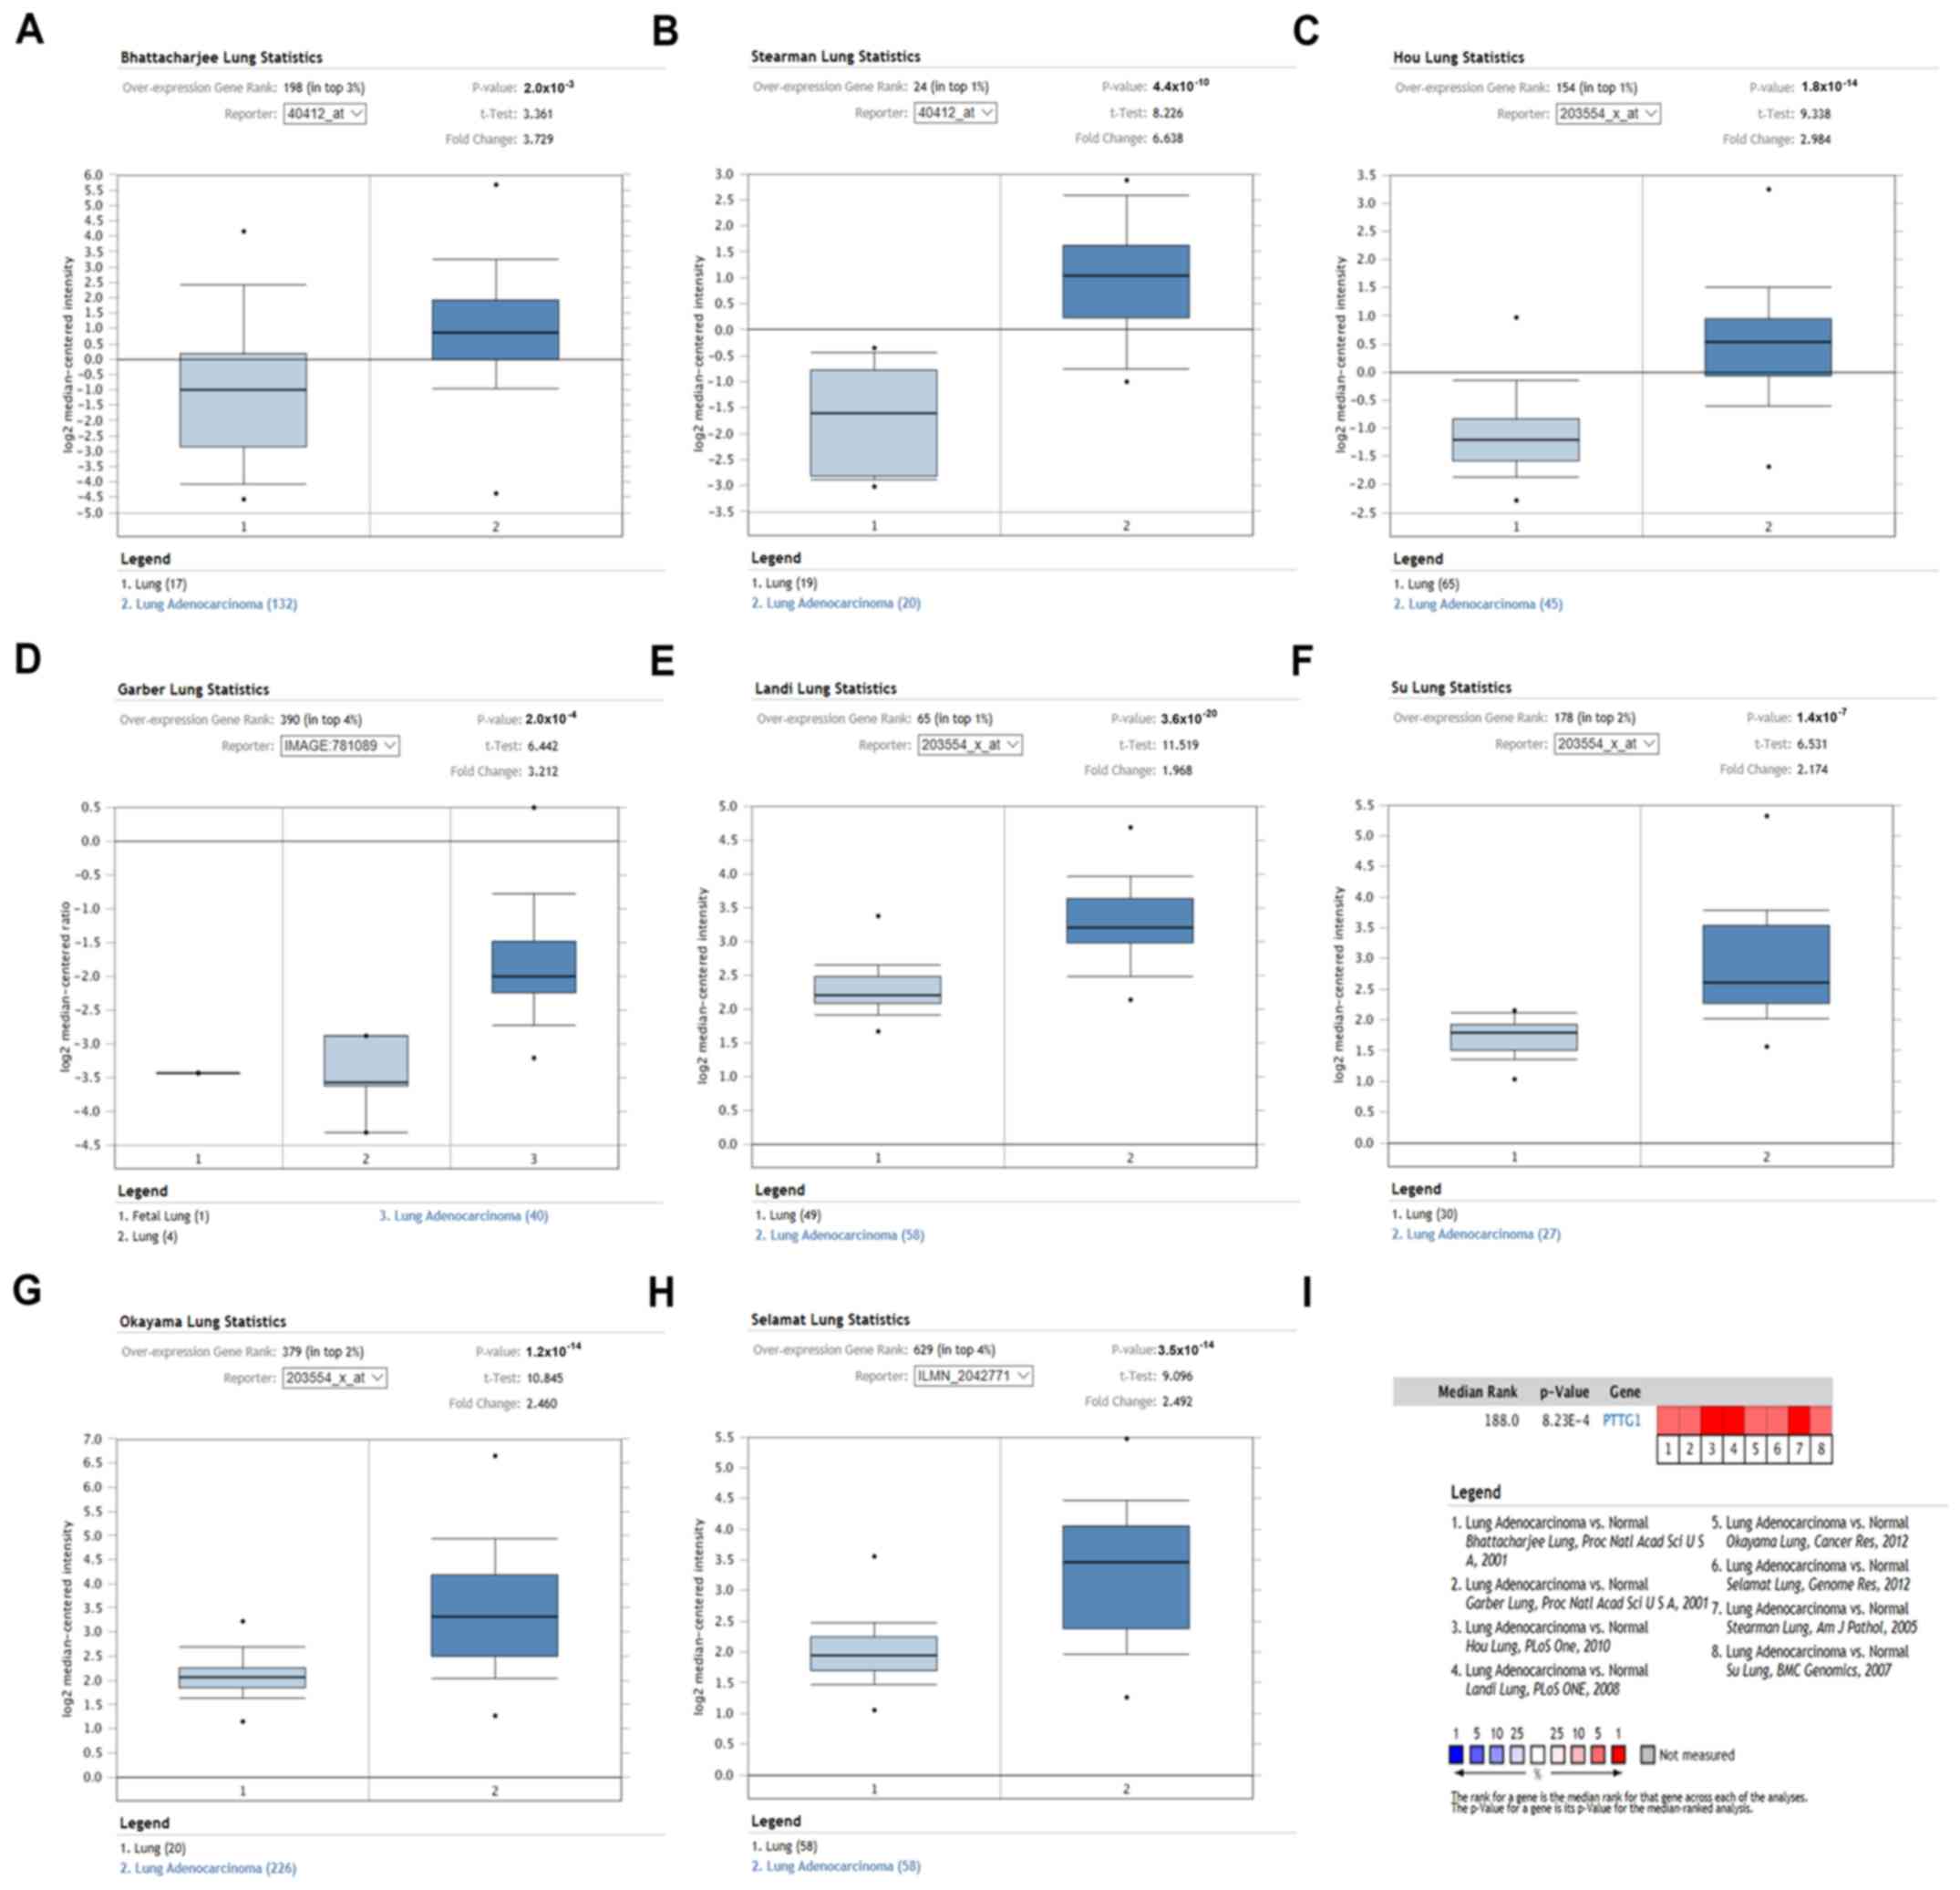
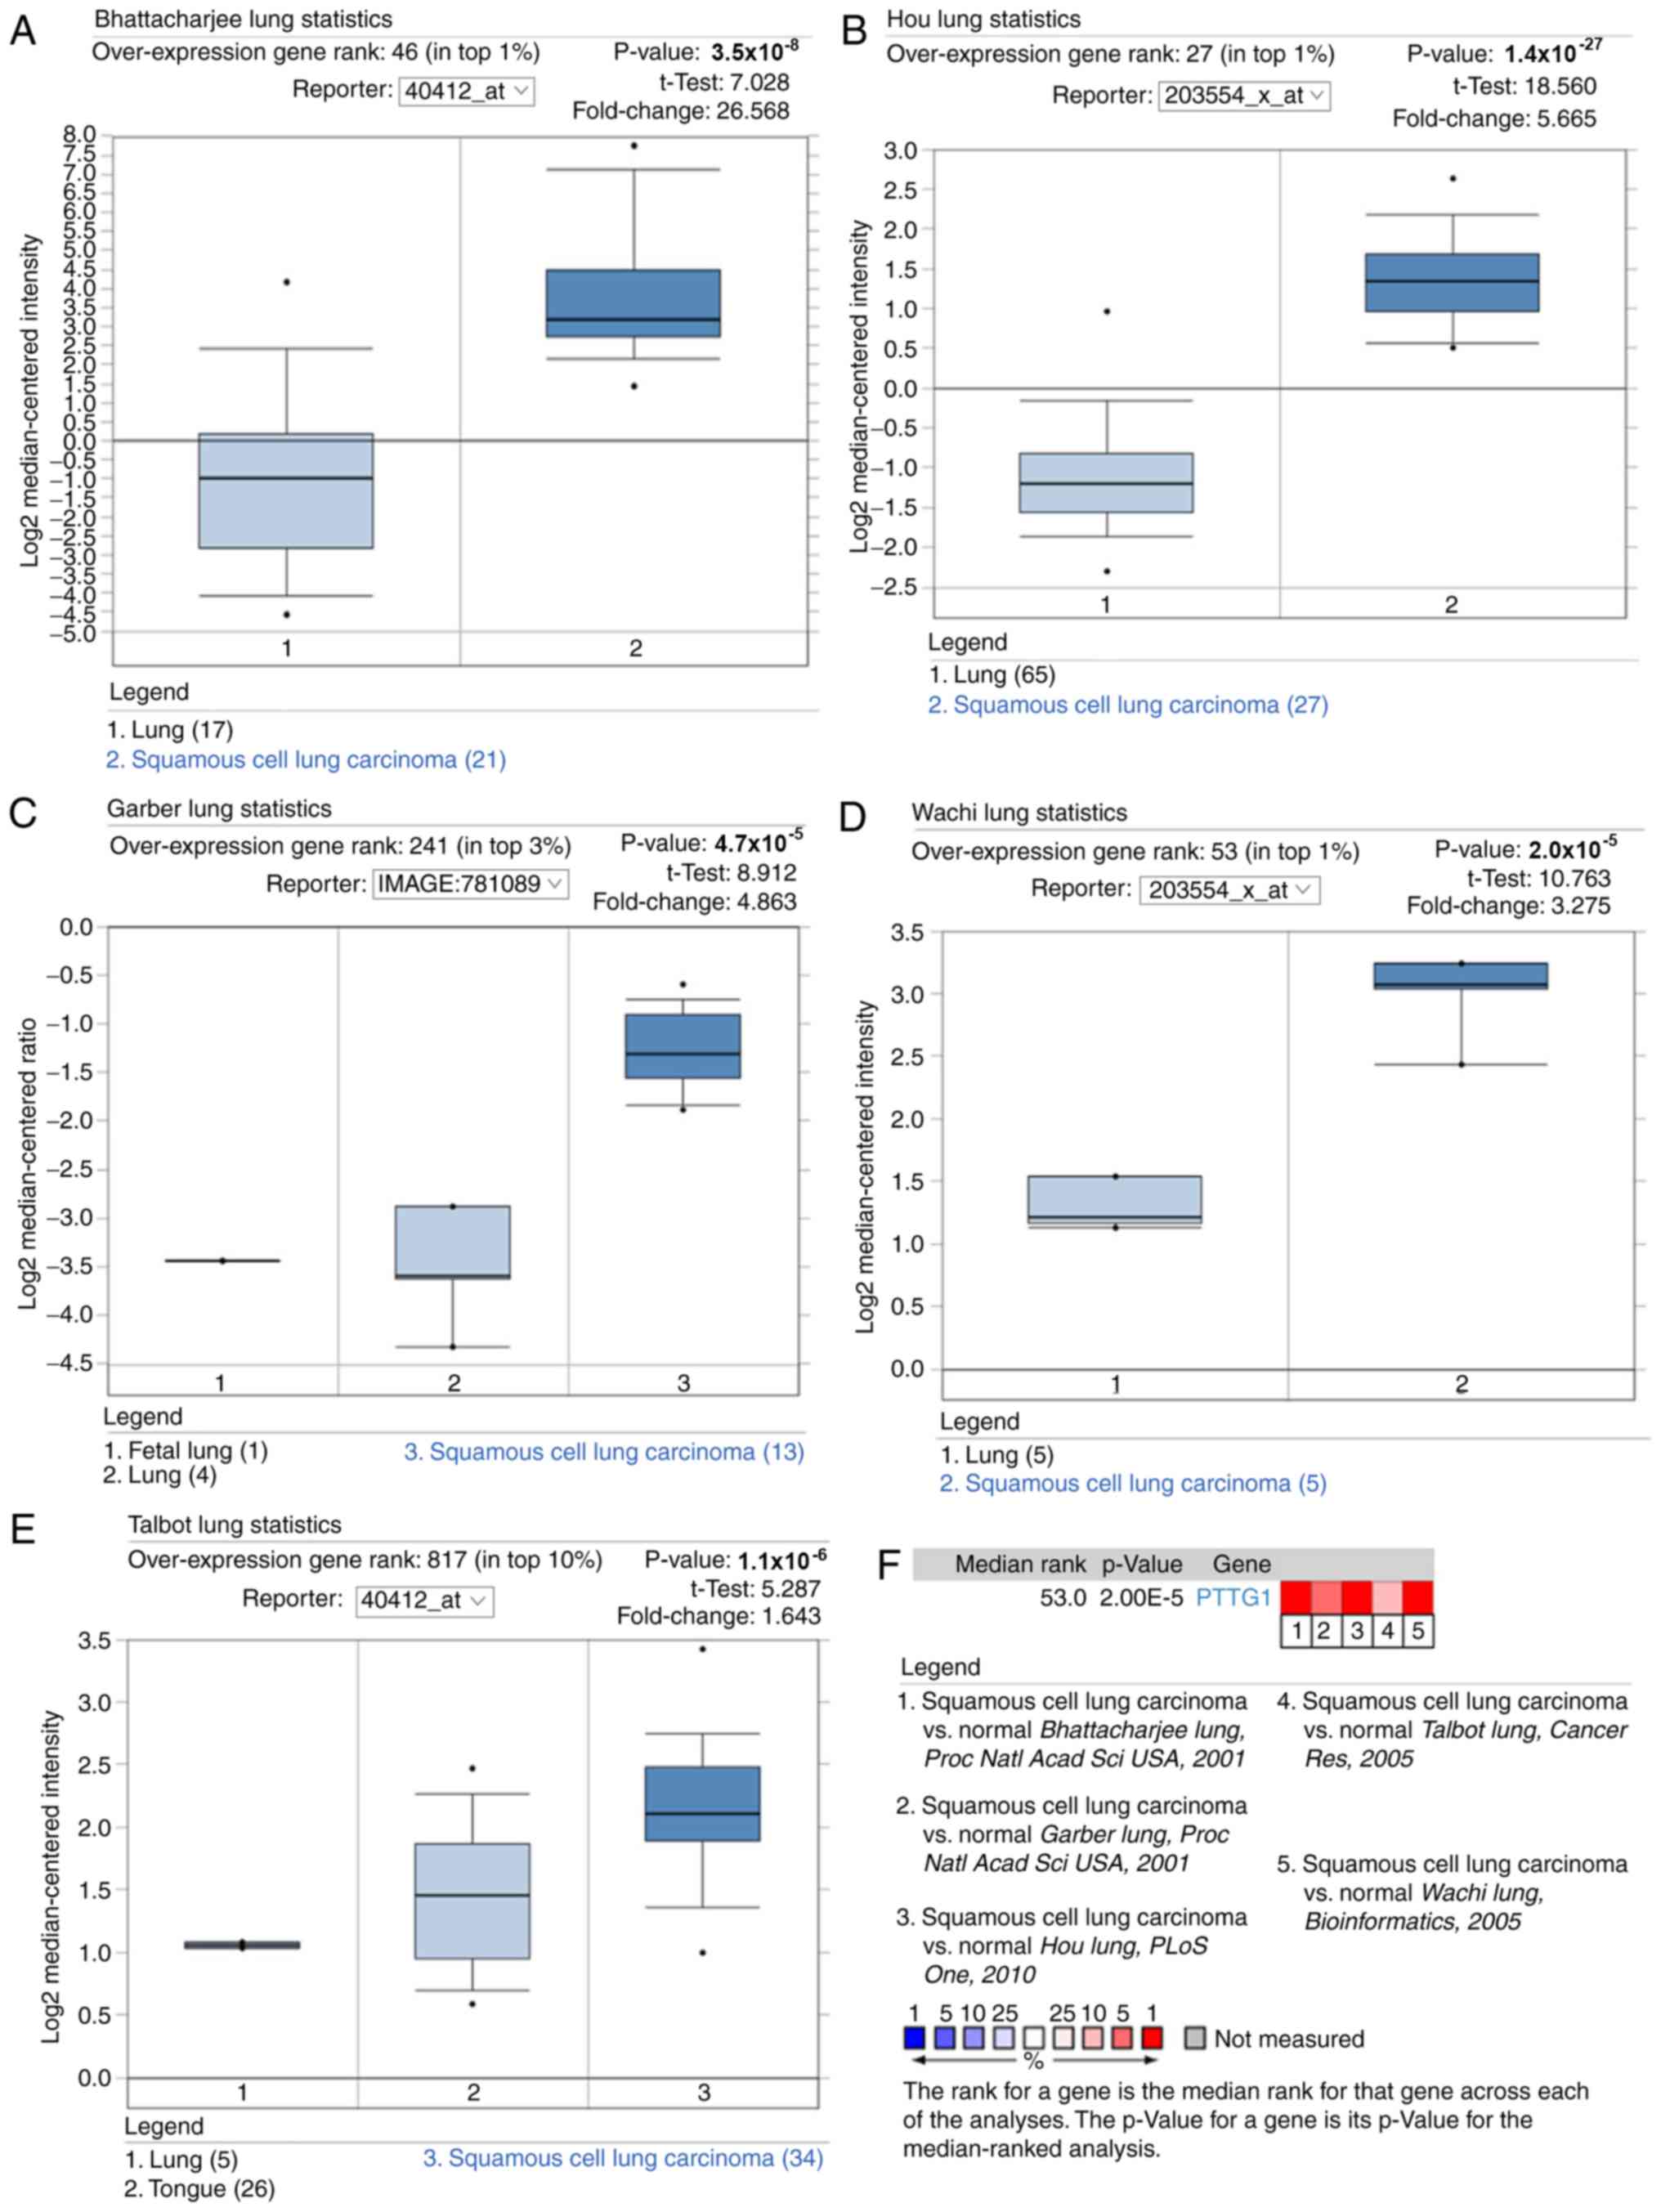
Oncomine analysis was used to further evaluate the
mRNA expression of PTTG family genes in NSCLC. Similar to the
previous results, PTTG1 expression was significantly increased in
both LUAD (Fig. 2) and LUSC
(Fig. 3) compared with normal lung
tissues. No significant differences were identified in the PTTG2
and PTTG3P expression levels between NSCLC and normal samples. The
detailed information of the datasets with statistical significance
information is presented in Table I.
These data suggested that PTTG1 may be upregulated in NSCLC
compared with normal lungs, whereas PTTG2 and PTTG3P are not
dysregulated in NSCLC.
 | Table I.Expression levels of PTTG1 in
patients with non-small cell lung cancer from Oncomine
database. |
Table I.
Expression levels of PTTG1 in
patients with non-small cell lung cancer from Oncomine
database.
| A, LUAD vs.
normal |
|---|
|
|---|
| Normal samples | Cancer samples | Reporter | Gene rank (%) | P-value | t | Fold change |
|---|
| 17 | 132 | Bhattacharjee
lung | 198 (top 3) |
2.0×10⁻³ | 3.361 | 3.729 |
| 19 | 20 | Stearman lung | 24 (top 1) |
4.4×10⁻¹⁰ | 8.226 | 6.638 |
| 65 | 45 | Hou lung | 154 (top 1) |
1.8×10⁻¹⁴ | 9.338 | 2.984 |
| 4 | 40 | Garber lung | 390 (top 4) |
2.0×10⁻⁴ | 6.442 | 3.212 |
| 49 | 58 | Landi lung | 65 (top 1) |
3.6×10⁻²⁰ | 11.519 | 1.968 |
| 30 | 27 | Su lung | 178 (top 2) |
1.4×10⁻⁷ | 6.531 | 2.174 |
| 20 | 226 | Okayama lung | 379 (top 2) |
1.2×10⁻¹⁴ | 10.845 | 2.460 |
| 58 | 58 | Selamat lung | 629 (top 4) |
3.5×10⁻¹⁴ | 9.096 | 2.492 |
|
| B, LUSC vs.
normal |
|
| Normal
samples | Cancer
samples |
Reporter | Gene rank
(%) | P-value | t | Fold
change |
|
| 17 | 21 | Bhattacharjee
lung | 46 (top 1) |
3.5×10⁻⁸ | 7.028 | 26.568 |
| 65 | 27 | Hou lung | 27 (top 1) |
1.4×10⁻²⁷ | 18.560 | 5.665 |
| 4 | 13 | Garber lung | 241 (top 3) |
4.7×10⁻⁵ | 8.912 | 4.863 |
| 5 | 5 | Wachi lung | 53 (top 1) |
2.0×10⁻⁵ | 10.763 | 3.275 |
| 28 | 34 | Talbot lung | 817 (top 10) |
1.1×10⁻⁶ | 5.287 | 1.643 |
Prognostic values of PTTG family gene
mRNA expression levels in patients with NSCLC
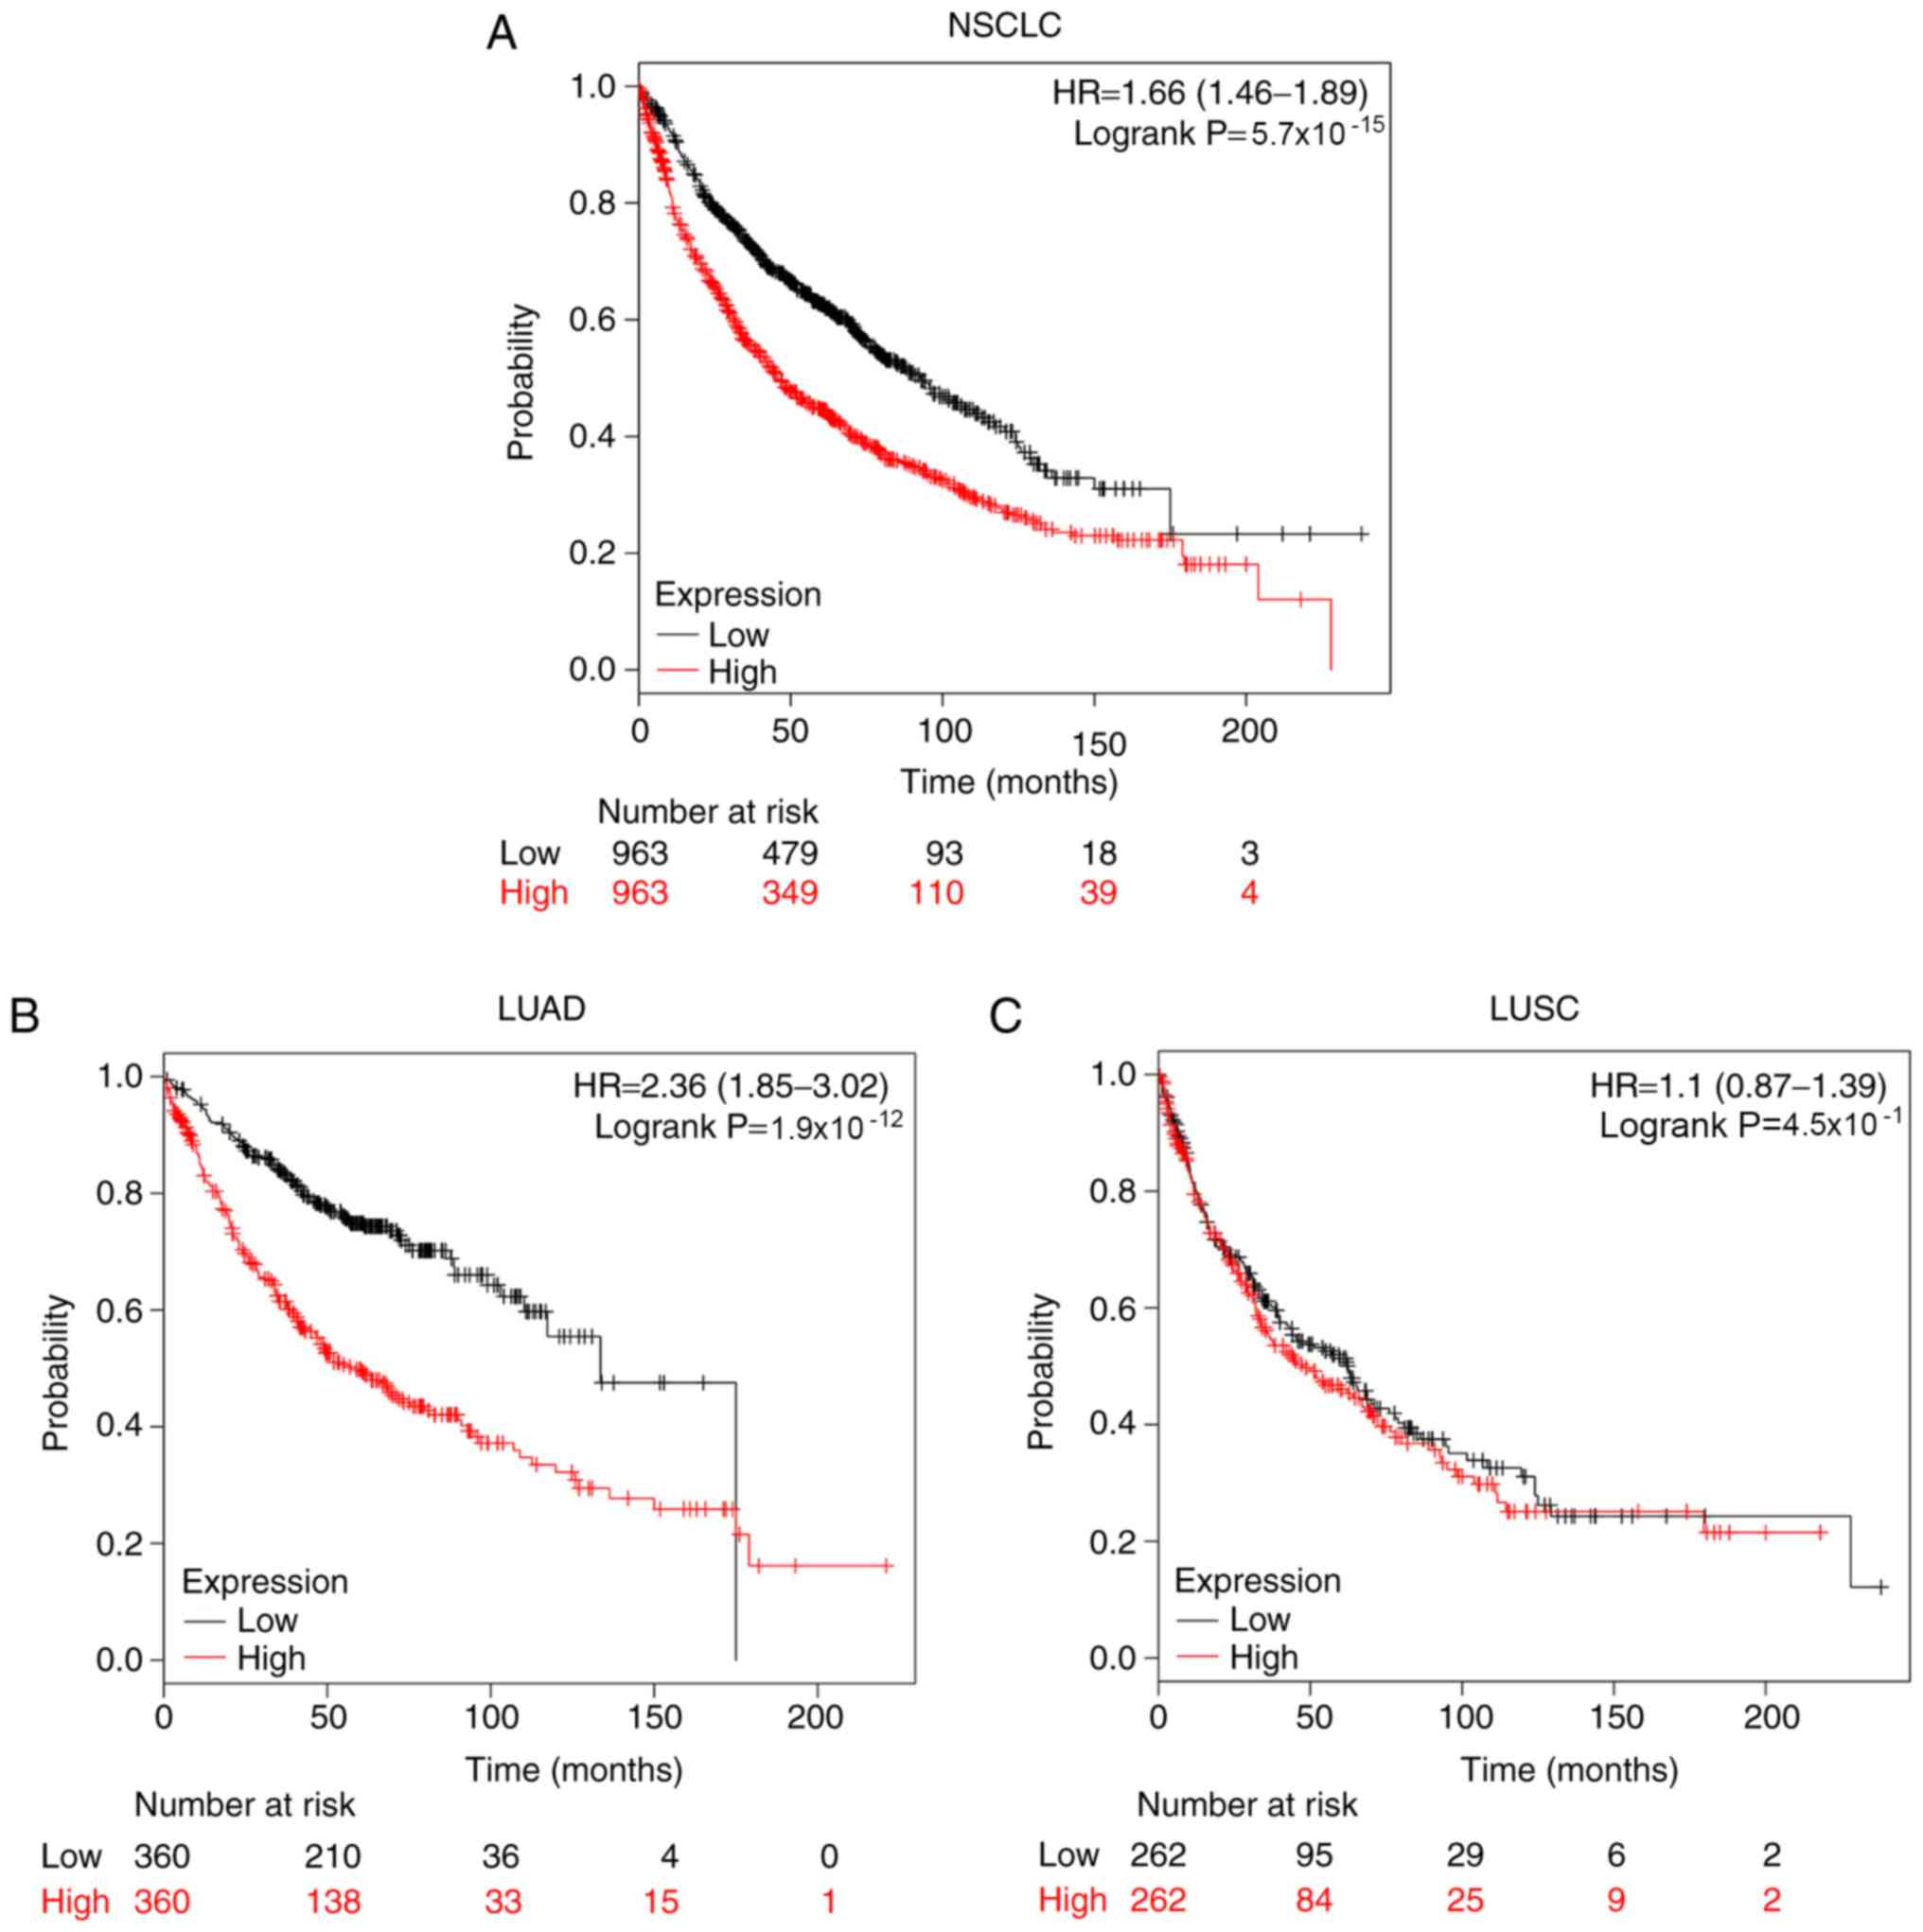
Kaplan-Meier plotter database was used to assess the
effects of the mRNA expression levels of PTTG family genes on the
survival of patients with NSCLC. The prognostic value of PTTG1 in
all patients with NSCLC, patients with LUAD and patients with LUSC
is presented in Fig. 4. Patients
with NSCLC with high expression of PTTG1 exhibited significantly
shorter OS time compared with patients with a low expression of
PTTG1 (HR, 1.66; 95% CI, 1.46–1.89; log-rank
P=5.7×10⁻¹⁵; Fig. 4A).
High expression of PTTG1 in patients with LUAD indicated a poor
prognosis (HR, 2.36; 95% CI, 1.85–3.02; log-rank
P=1.9×10⁻¹²; Fig. 4B).
However, in patients with LUSC, high PTTG1 expression was not
associated with OS (Fig. 4C).
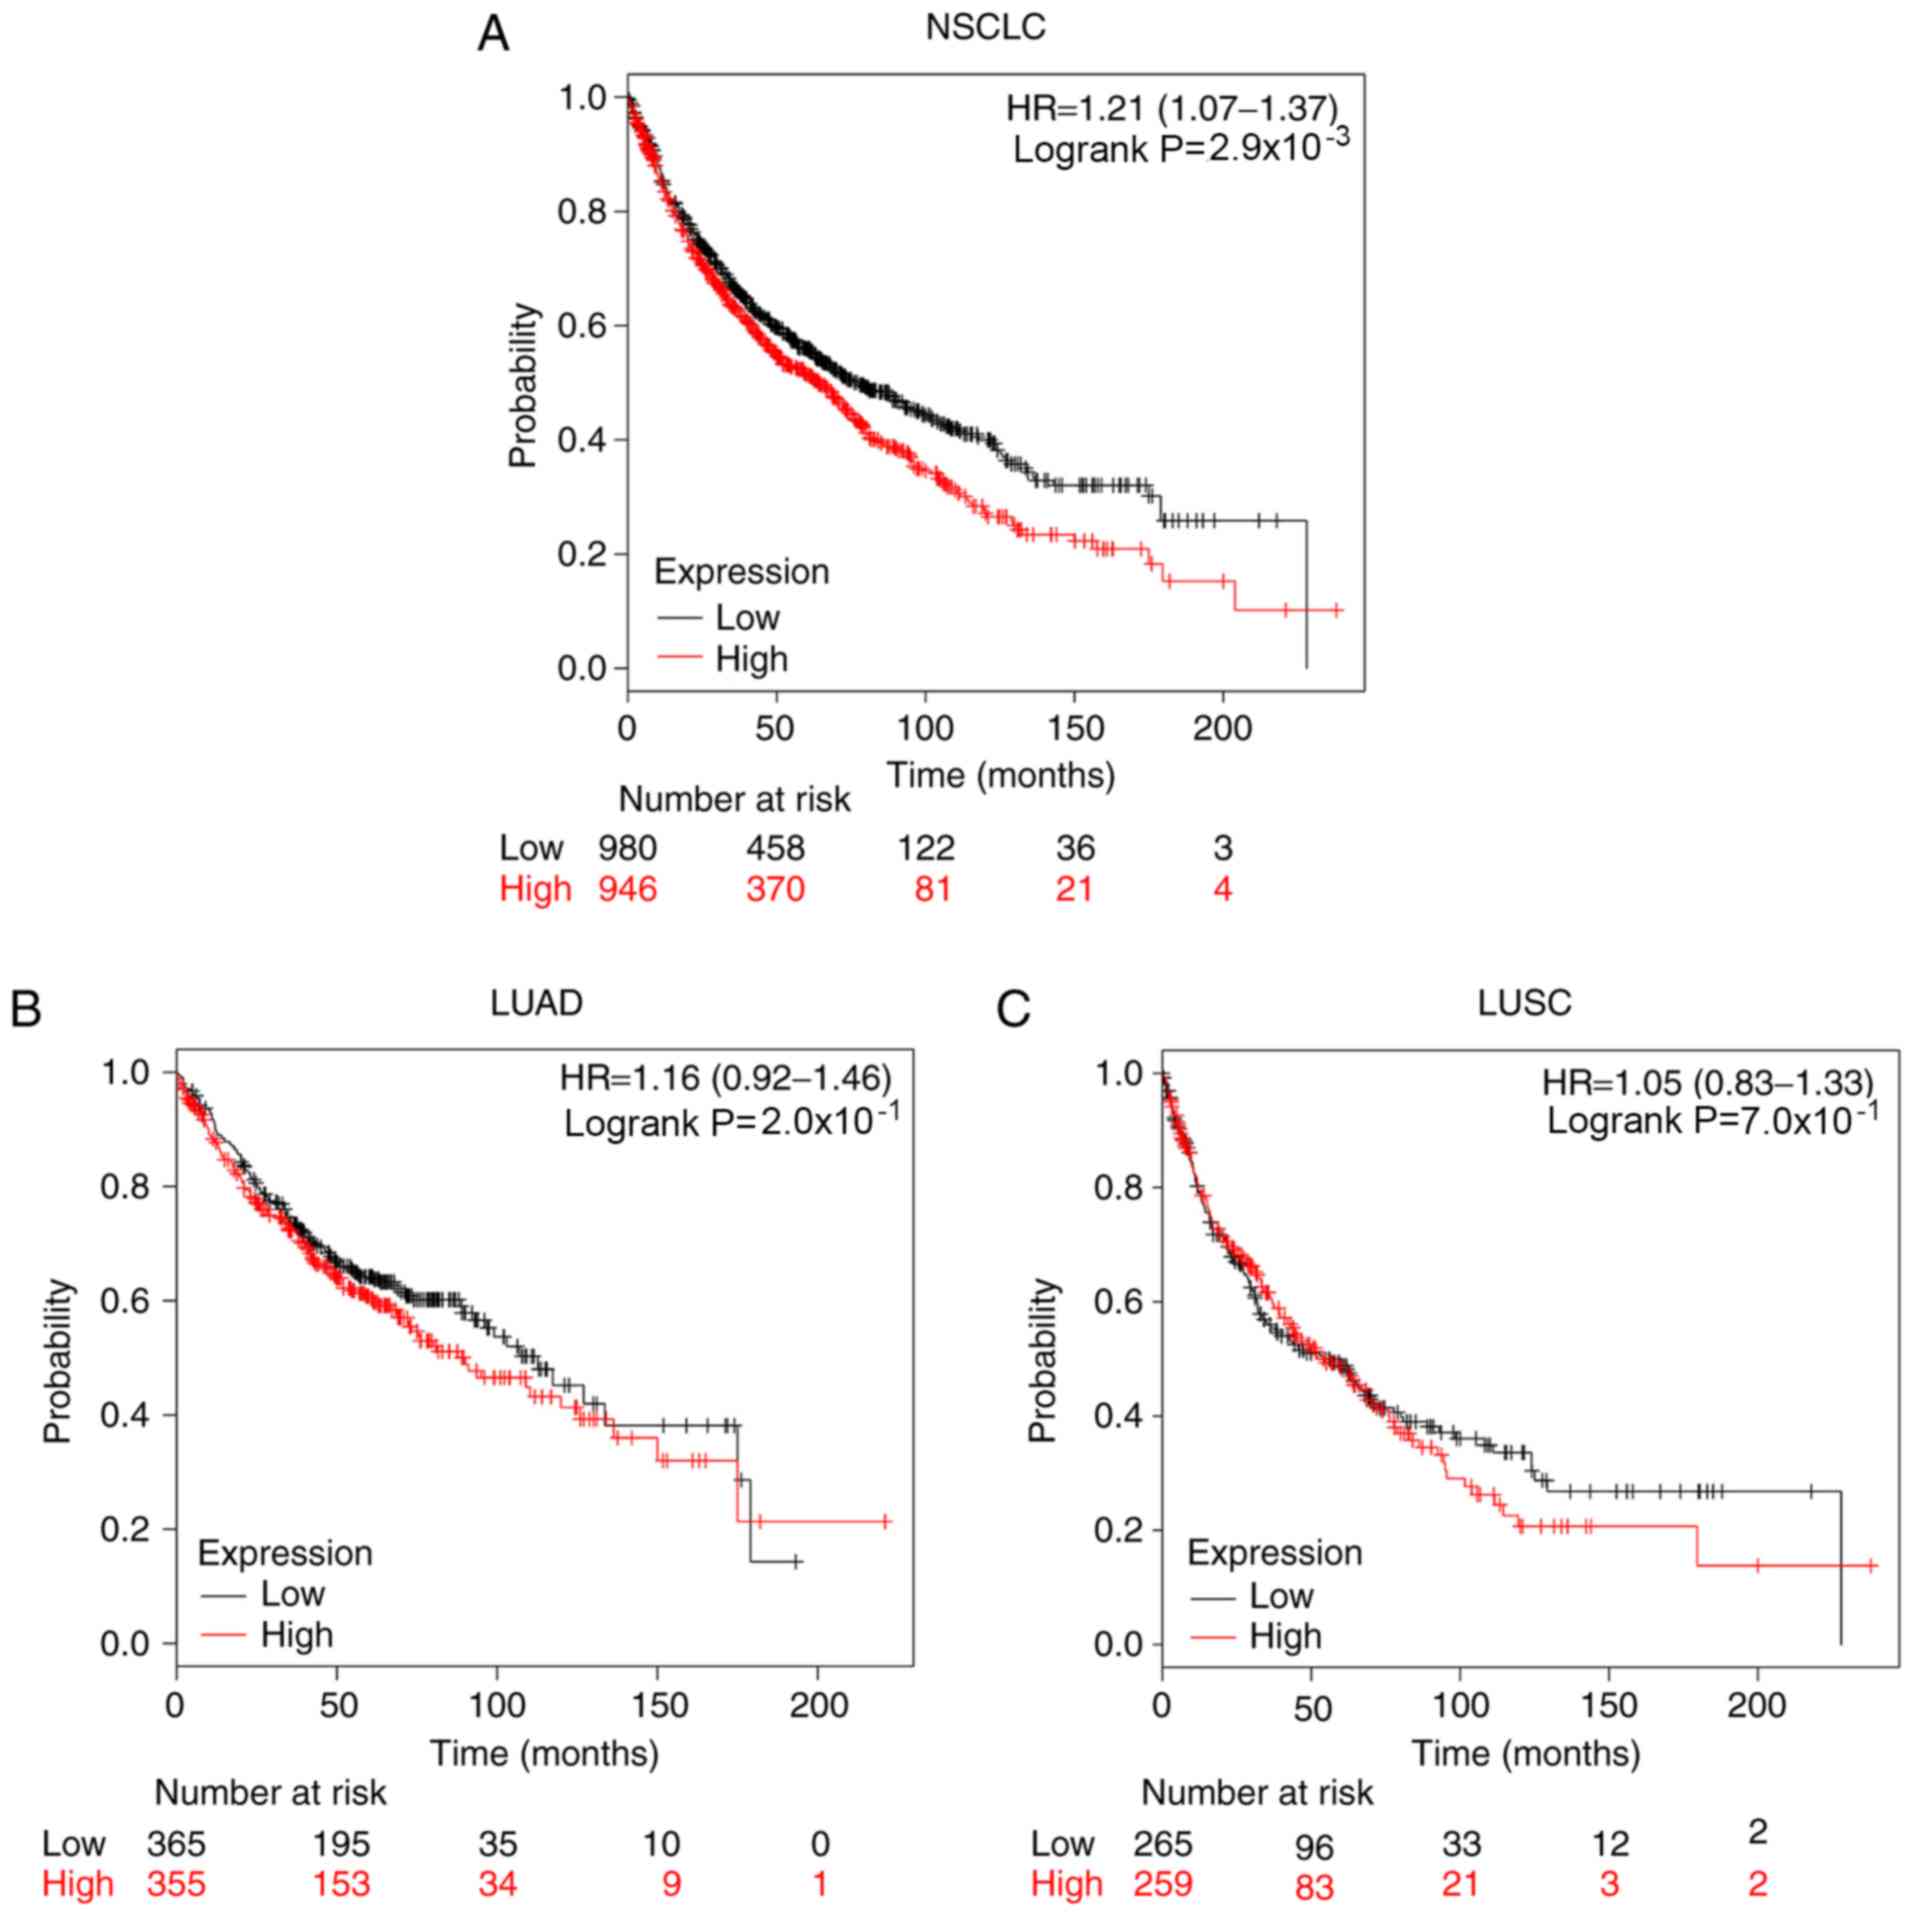
The associations between PTTG2 mRNA expression
levels and the overall survival of all patients with NSCLC,
patients with LUAD and patients with LUSC were also analyzed. High
PTTG2 expression levels were only significantly associated with a
worse prognosis for all patients with NSCLC (HR, 1.21; 95% CI,
1.07–1.37; log-rank P=2.9×10⁻²; Fig. 5A). For patients with LUAD (HR, 1.16;
95% CI, 0.92–1.46; log-rank P=2.0×10⁻¹) and patients
with LUSC (HR, 1.06; 95% CI, 0.83–1.33; log-rank
P=7.0×10⁻¹), PTTG2 expression was not significantly
associated with the prognosis of patients (Fig. 5B and C).
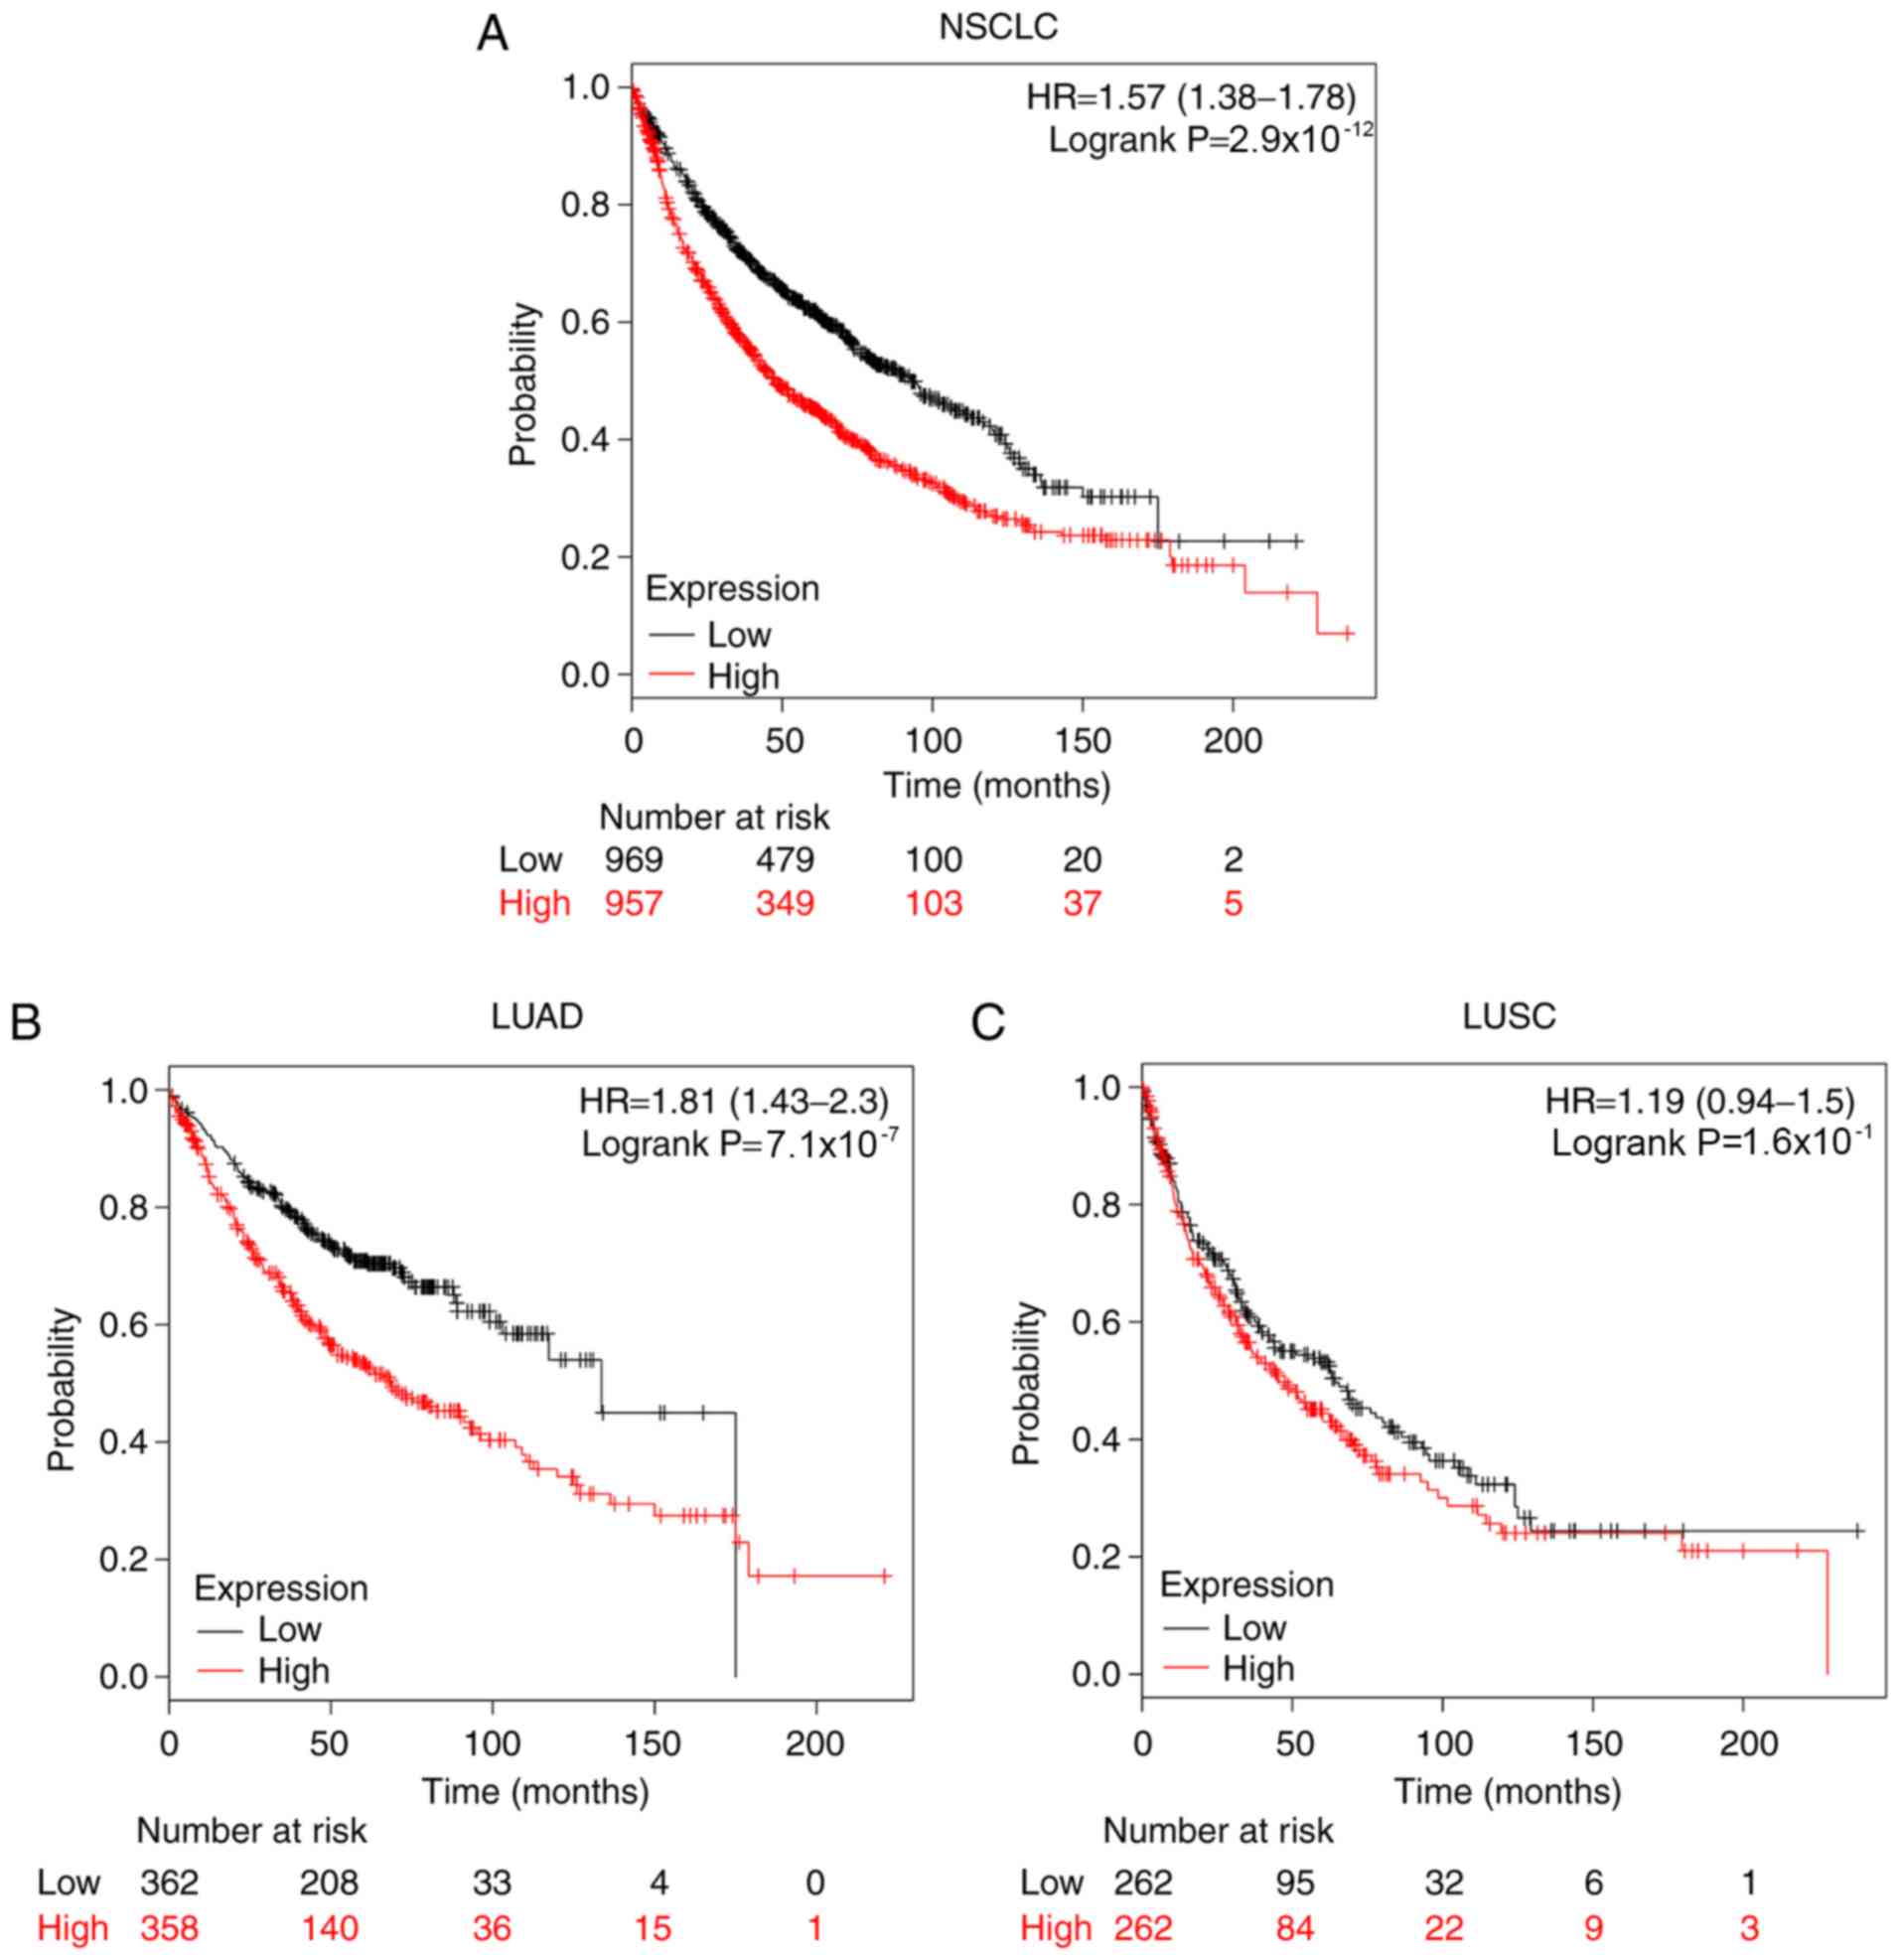
The associations between PTTG3P mRNA expression
level and survival for all patients with NSCLC, patients with LUAD
and patients with LUSC were evaluated. As presented in Fig. 6A and B, high expression of PTTG3P was
significantly associated with unfavorable OS for all patients with
NSCLC (HR, 1.57; 95% CI, 1.38–1.78; log-rank
P=2.9×10⁻¹²) and patients with LUAD (HR, 1.81; 95% CI,
1.43–2.30; log-rank P=7.1×10⁻⁷). However, for patients
with LUSC, PTTG3P was not significantly associated with OS (HR,
1.19; 95% CI, 0.94–1.50; log-rank P=1.6×10⁻¹; Fig. 6C). Taken together, these results
indicated that the three PTTG family genes may be promising
biomarkers that predict a poor prognosis in all patients with
NSCLC. Additionally, PTTG1 and PTTG3P may also be two prospective
prognostic biomarkers for patients with LUAD.
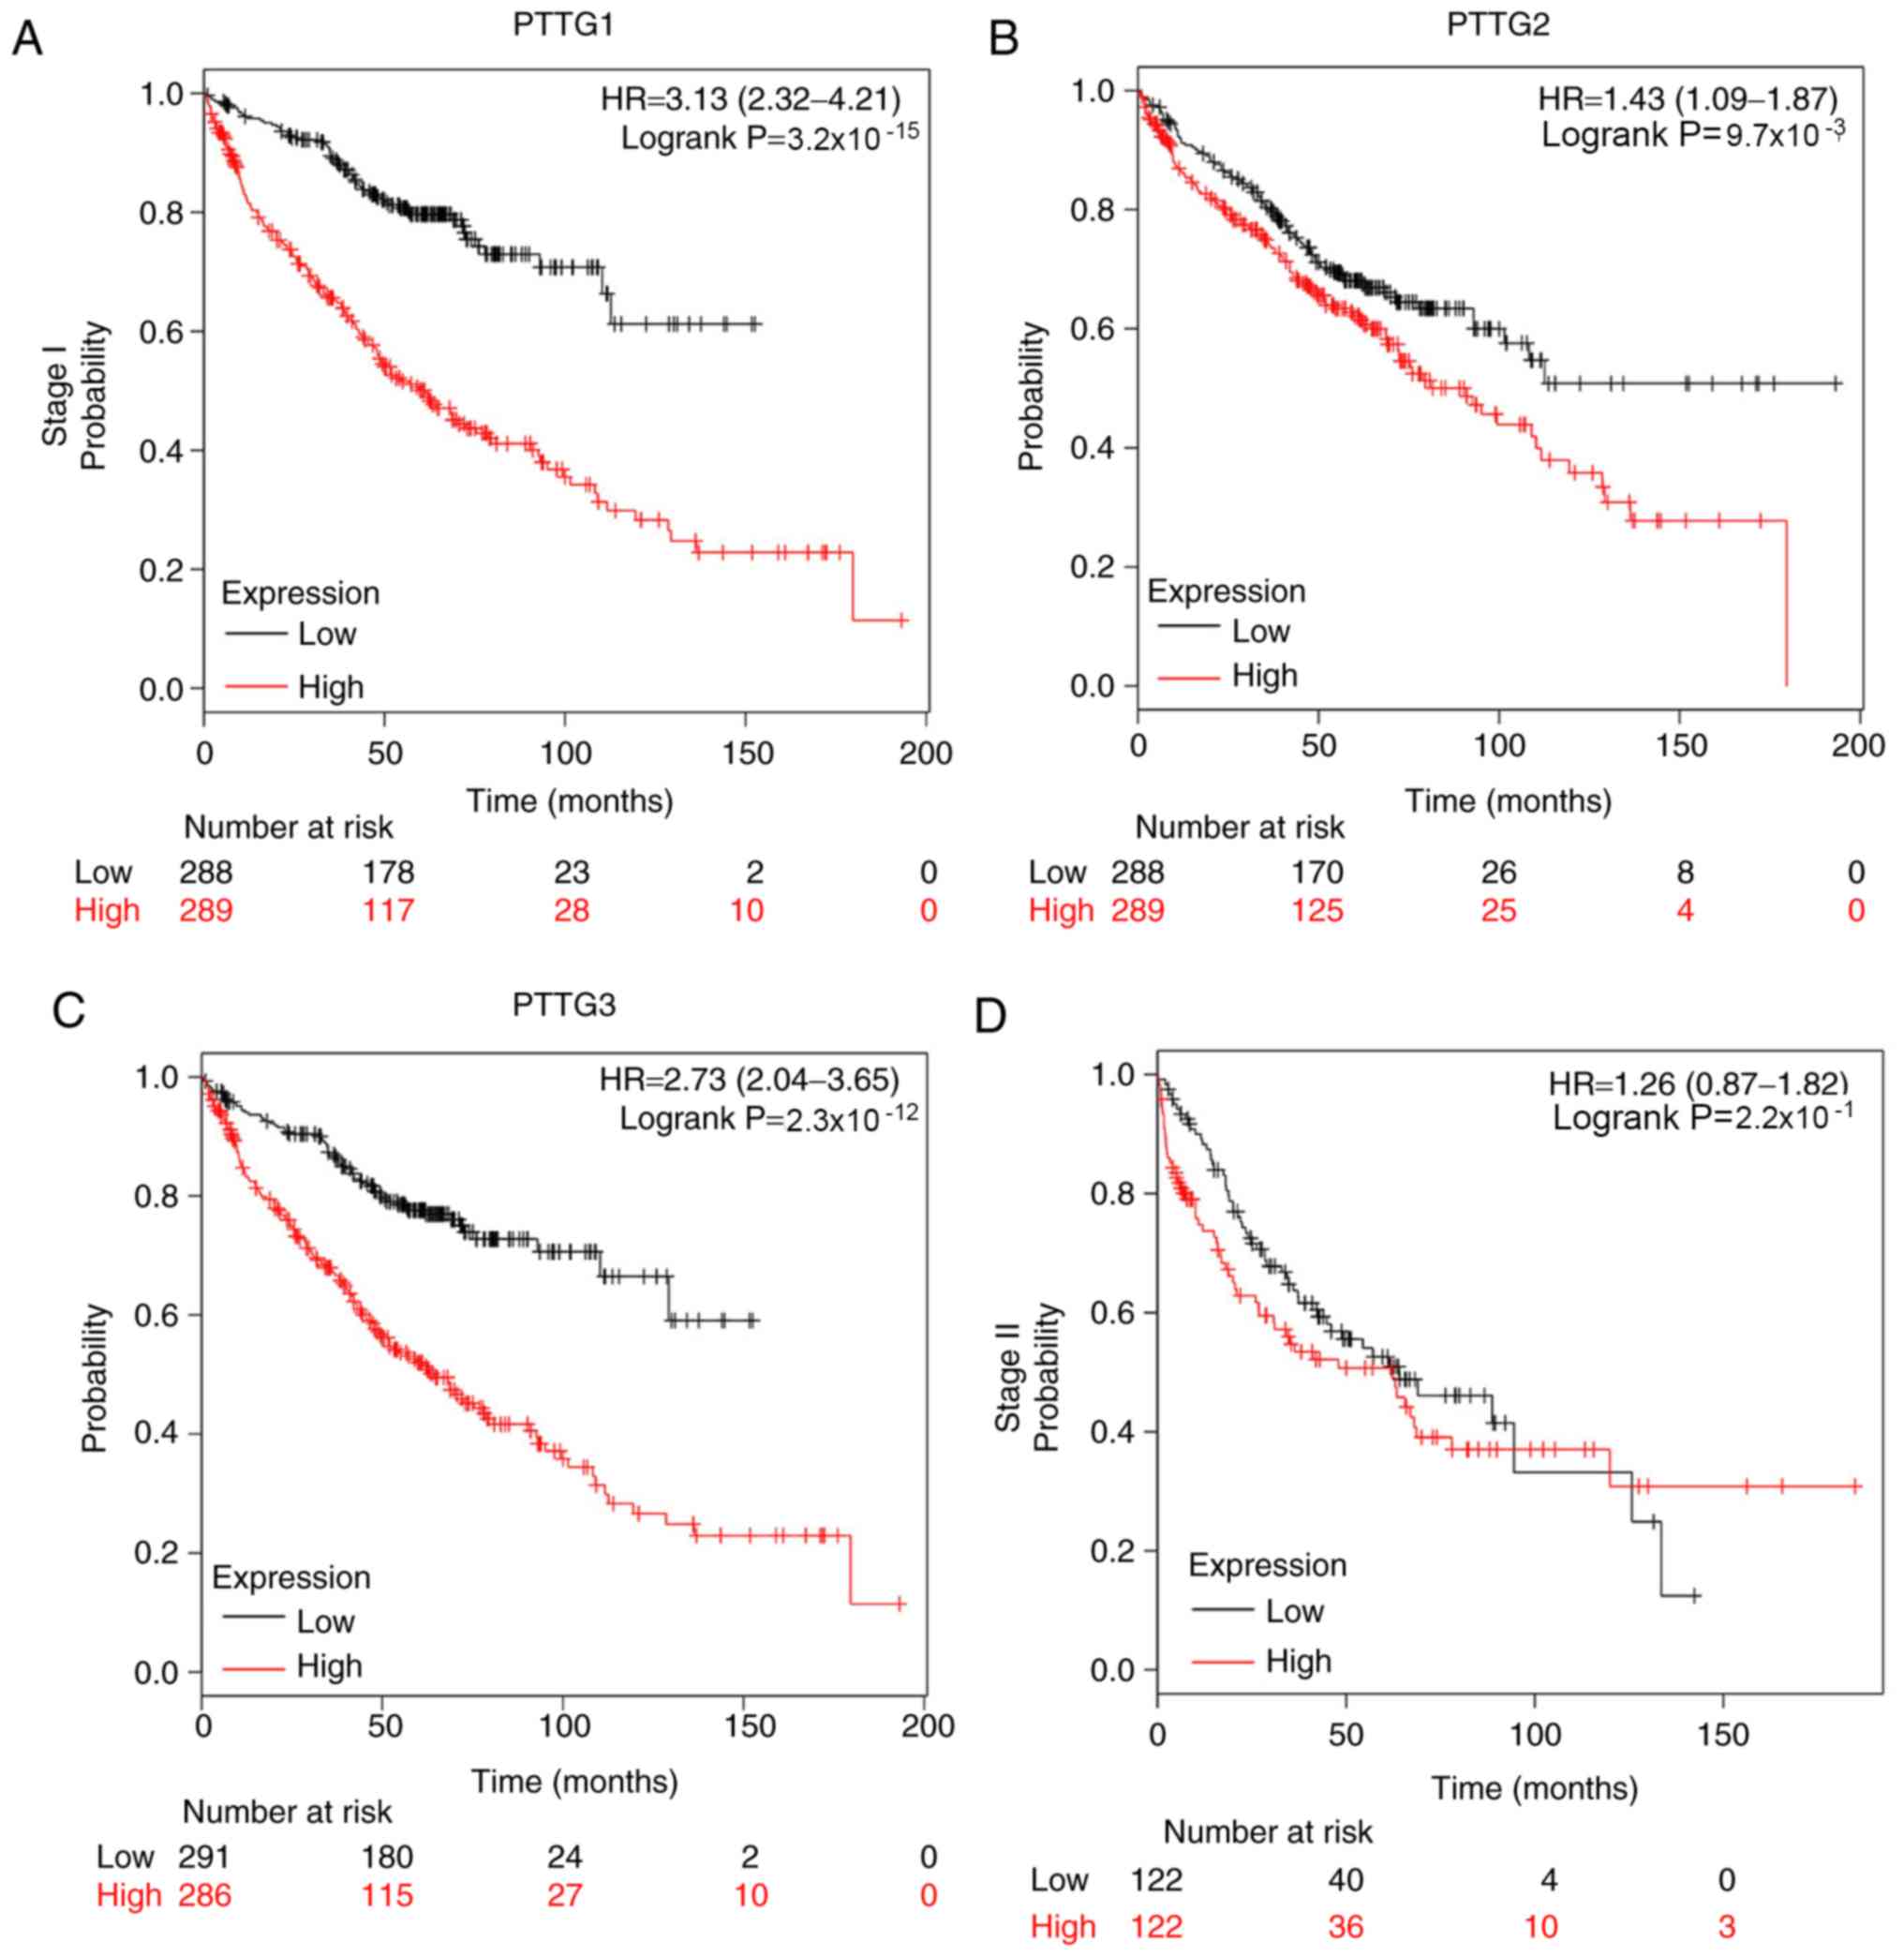
Associations between the prognostic
values of PTTG family mRNA expression and clinical stage
The associations between the prognostic values of
the PTTG family mRNA expression levels and the clinical stage of
patients with NSCLC were examined. Patients with clinical stage I
NSCLC with high expression of PTTG1 (HR, 3.13; 95% CI, 2.32–4.21;
log-rank P=3.2×10⁻¹⁵; Fig.
7A), PTTG2 (HR, 1.43; 95% CI, 1.09–1.87; log-rank
P=9.7×10⁻³; Fig. 7B) and
PTTG3P (HR, 2.73; 95% CI, 2.04–3.65; log-rank
P=2.3×10⁻¹²; Fig. 7C)
exhibited worse OS compared with patients with low PTTG1
expression. High expression of PTTG2 indicated a poor prognosis in
patients with clinical stage II NSCLC compared with low PTTG2
expression (HR, 1.61; 95% CI, 1.12–2.33; log-rank
P=1.0×10⁻²; Fig. 7E).
PTTG1 (HR, 1.26; 95% CI, 0.87–1.82; log-rank P=2.2×10⁻¹;
Fig. 7D) and PTTG3P (HR, 1.18; 95%
CI, 0.82–1.70; log-rank P=3.8×10⁻¹; Fig. 7F) did not demonstrate any significant
effects on the OS of patients with stage II NSCLC. For patients
with clinical stage III NSCLC, PTTG1 (HR, 0.89; 95% CI, 0.51–1.53;
log-rank P=6.6×10⁻¹; Fig.
7G), PTTG2 (HR, 0.74; 95% CI, 0.42–1.27; log-rank
P=2.7×10⁻¹; Fig. 7H) and
PTTG3P (HR, 1.29; 95% CI, 0.75–2.22; log-rank
P=3.6×10⁻¹; Fig. 7I)
expression levels exhibited no significant associations with
prognosis. These results suggested that PTTG family genes may be
effective prognostic biomarkers for patients with clinical stage I
NSCLC.
Associations between the prognostic
values of PTTG family mRNA expression and chemotherapy or
radiotherapy
Chemotherapy and radiotherapy are two major
therapeutic strategies for treating different cancer types,
including NSCLC, particularly for patients with advanced stage
disease. The present study further investigated the associations
between the prognostic roles of the mRNA expression levels of PTTG
family genes and chemotherapy and radiotherapy in NSCLC. High
expression levels of PTTG1 (HR, 1.58; 95% CI, 1.13–2.22; log-rank
P=7.0×10⁻³) and PTTG3P (HR, 1.45; 95% CI, 1.03–2.03;
log-rank P=3.0×10⁻²) were significantly associated with
OS of patients with NSCLC without chemotherapy (Table II). However, none of the PTTG family
gene expression levels were significantly associated with OS of
patients with or without radiotherapy (Table III).
| Table II.Correlation of PTTG family with
chemotherapy of patients with non-small cell lung cancer. |
Table II.
Correlation of PTTG family with
chemotherapy of patients with non-small cell lung cancer.
| PTTG family
member | Affymetrix ID | Chemotherapy | Low expression
(N) | High expression
(N) | HR | 95% CI | Log-rank
P-value |
|---|
| PTTG1 | 203554_x_at | No | 155 | 155 | 1.58 | 1.13–2.22 |
7.0×10⁻³a |
|
| 203554_x_at | Yes | 88 | 88 | 0.95 | 0.63–1.45 |
8.3×10⁻¹ |
| PTTG2 | 214557_at | No | 158 | 152 | 1.16 | 0.83–1.63 |
3.7×10⁻¹ |
|
| 214557_at | Yes | 88 | 88 | 0.93 | 0.62–1.4 |
7.3×10⁻¹ |
| PTTG3P | 208511_at | No | 156 | 154 | 1.45 | 1.03–2.03 |
3.0×10⁻²a |
|
| 208511_at | Yes | 89 | 87 | 0.81 | 0.54–1.22 |
3.1×10⁻¹ |
| Table III.Correlation of PTTG family with
radiotherapy of patients with non-small cell lung cancer. |
Table III.
Correlation of PTTG family with
radiotherapy of patients with non-small cell lung cancer.
| PTTG family
member | Affymetrix ID | Radiotherapy | Low expression
(N) | High expression
(N) | HR | 95% CI | Log-rank
P-value |
|---|
| PTTG1 | 203554_x_at | No | 137 | 134 | 1.22 | 0.86–1.75 |
2.6×10⁻¹ |
|
| 203554_x_at | Yes | 35 | 35 | 0.95 | 0.55–1.63 |
8.4×10⁻¹ |
| PTTG2 | 214557_at | No | 136 | 135 | 1.04 | 0.73–1.49 |
8.2×10⁻¹ |
|
| 214557_at | Yes | 36 | 34 | 0.87 | 0.51–1.49 |
6.2×10⁻¹ |
| PTTG3P | 208511_at | No | 136 | 135 | 1.11 | 0.77–1.58 |
5.8×10⁻¹ |
|
| 208511_at | Yes | 35 | 35 | 1.15 | 0.68–1.96 |
6.0×10⁻¹ |
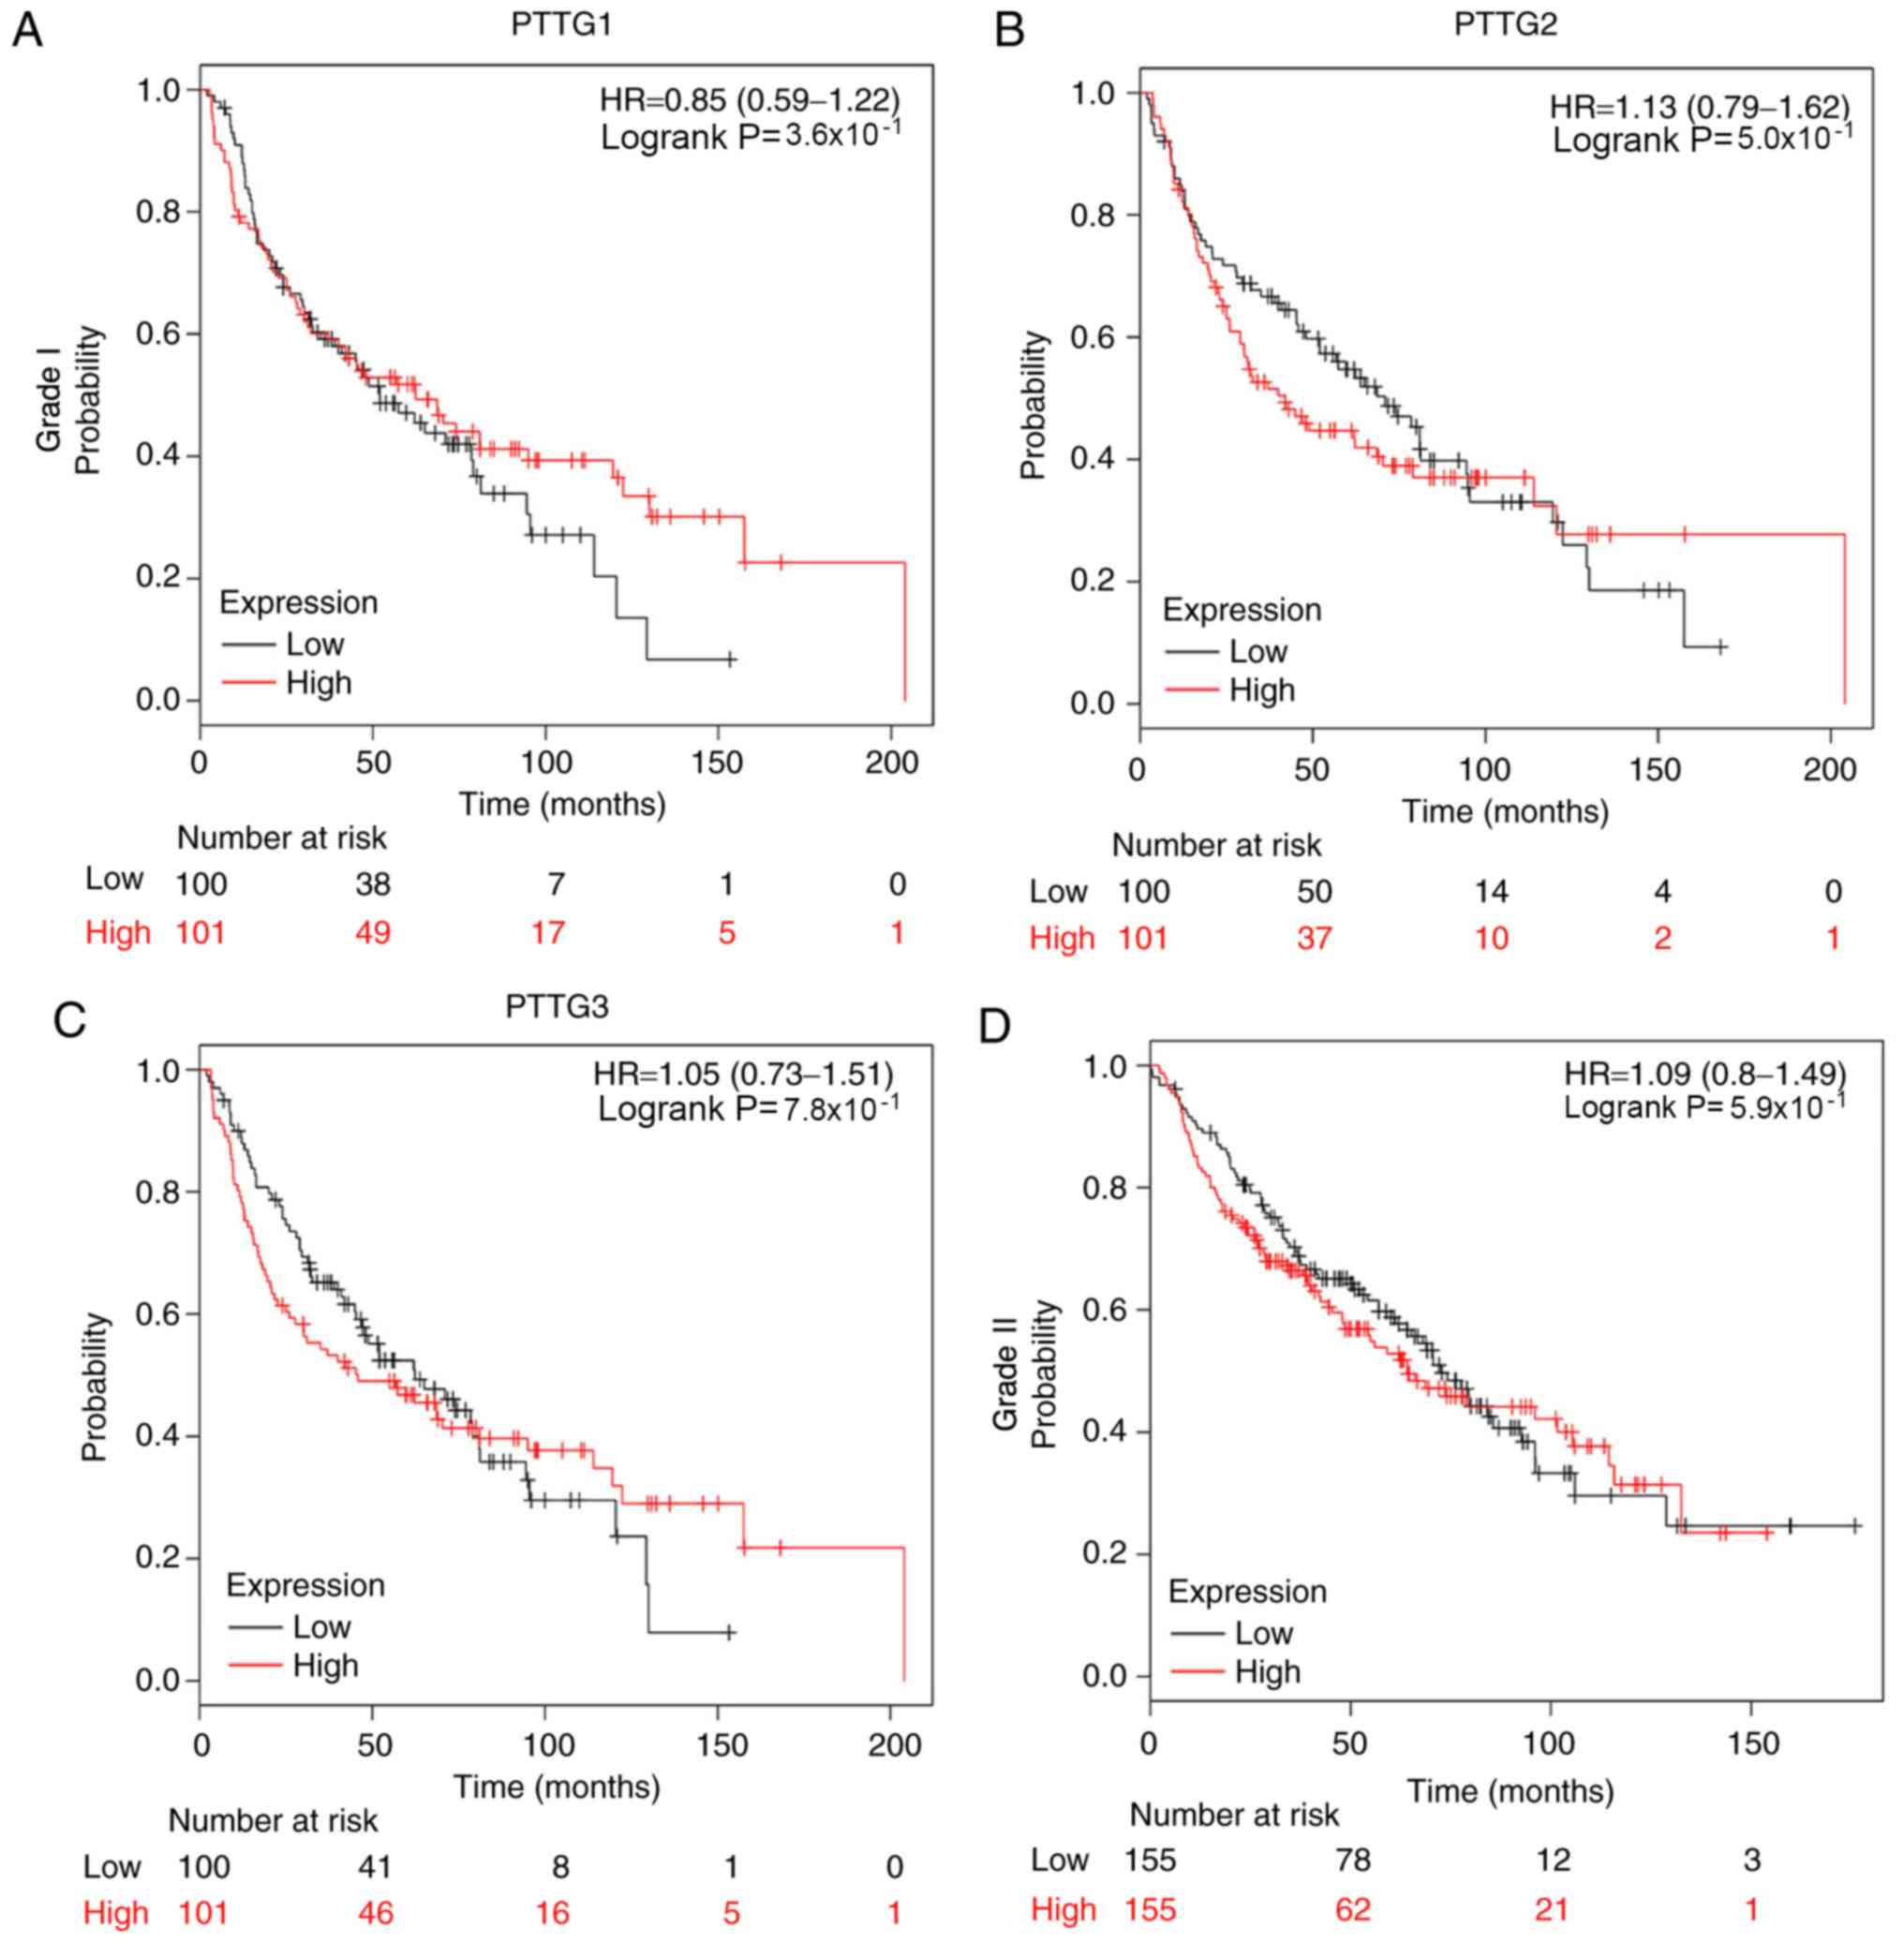
Associations between the prognostic
values of PTTG family mRNA expression levels and other
clinicopathological features
The associations of individual PTTG family genes
with other clinicopathological features, including pathological
grade (Fig. 8), lymph node status
(Table IV), smoking status
(Table V) and sex (Table VI), were determined. Fig. 8 presents the prognostic values of
PTTG family genes in NSCLC based on various pathological grades;
none of the genes demonstrated a significant association with OS of
patients with grade I, II or III NSCLC, which may have occurred
partially due to the relatively limited sample size. The data
presented in Table IV demonstrated
the associations between the prognostic values of PTTG family mRNA
expression levels and lymph node status of patients with NSCLC. A
high expression of PTTG1 (HR, 1.39; 95% CI, 1.12–1.71; log-rank
P=2.3×10⁻³) was significantly associated with poor OS
for patients with NSCLC without invasive and/or metastatic lymph
nodes (lymph node, 0). However, PTTG2 and PTTG3P were not
associated with NSCLC lymph node status. Table V presents the associations of the
PTTG family with the smoking history of patients with NSCLC.
Compared with patients with NSCLC with low expression of PTTG1,
high expression of PTTG1 indicated a worse prognosis in patients
with NSCLC who had never smoked (HR, 3.03; 95% CI, 1.63–5.62;
log-rank P=2.2×10⁻⁴) or smoked (HR, 1.32; 95% CI,
1.07–1.62; log-rank P=8.9×10⁻³). Patients with NSCLC
with a high expression of PTTG2 who had smoked (HR, 1.47; 95% CI,
1.19–1.81; log-rank P=2.8×10⁻⁴) and never-smoked (HR,
2.10; 95% CI, 1.18–3.75; log-rank P=1.0×10⁻²) exhibited
a shorter OS time compared with patients with NSCLC with low
expression of PTTG2. Additionally, high expression of PTTG3P was
also significantly associated with the OS or patients who had
never-smoked (HR, 3.11; 95% CI, 1.70–5.71; log-rank
P=1.1×10⁻⁴) and smoked (HR, 1.41; 95% CI, 1.15–1.74;
log-rank P=1.1×10⁻³). High expression of PTTG1, PTTG2
and PTTG3P was significantly associated with OS of both female and
male patients with NSCLC (PTTG1-female: HR, 1.87; 95% CI,
1.47–2.38; log-rank P=1.7×10⁻⁷; PTTG1-male: HR, 1.53;
95% CI, 1.31–1.79; log-rank P=1.2×10⁻⁷; PTTG2-female:
HR, 1.34; 95% CI, 1.06–1.69; log-rank P=1.4×10⁻²;
PTTG2-male: HR, 1.24; 95% CI, 1.06–1.46; log-rank
P=6.9×10⁻³; PTTG3P-female: HR, 1.81; 95% CI, 1.43–2.29;
log-rank P=6.6×10⁻⁷; PTTG3P-male: HR, 1.45; 95% CI,
1.24–1.70; log-rank P=4.2×01−6; Table VI).
| Table IV.Correlation of PTTG family with lymph
node status of patients with non-small cell lung cancer. |
Table IV.
Correlation of PTTG family with lymph
node status of patients with non-small cell lung cancer.
| PTTG family
member | Affymetrix ID | Lymph node
status | Low expression
(N) | High expression
(N) | HR | 95% CI | Log-rank
P-value |
|---|
| PTTG1 | 203554_x_at | 0 | 390 | 391 | 1.39 | 1.12–1.71 |
2.3×10⁻³a |
|
| 214775_at | 1 | 126 | 126 | 1.21 | 0.89–1.66 |
2.3×10⁻¹ |
|
| 208511_at | 2 | 56 | 55 | 1.01 | 0.67–1.51 |
9.7×10⁻¹ |
| PTTG2 | 203554_x_at | 0 | 391 | 390 | 1.06 | 0.86–1.31 |
5.7×10⁻¹ |
|
| 214775_at | 1 | 129 | 123 | 1.22 | 0.89–1.67 |
2.1×10⁻¹ |
|
| 208511_at | 2 | 56 | 55 | 1.23 | 0.82–1.84 |
3.2×10⁻¹ |
| PTTG3P | 203554_x_at | 0 | 391 | 390 | 1.12 | 0.9–1.38 |
3.1×10⁻¹ |
|
| 214775_at | 1 | 128 | 124 | 1.24 | 0.91–1.69 |
1.8×10⁻¹ |
|
| 208511_at | 2 | 56 | 55 | 1.32 | 0.88–1.97 |
1.8×10⁻¹ |
| Table V.Correlation of PTTG family with
smoking history of patients with non-small cell lung cancer. |
Table V.
Correlation of PTTG family with
smoking history of patients with non-small cell lung cancer.
| PTTG family
member | Affymetrix ID | Smoking status | Low expression
(N) | High expression
(N) | HR | 95% CI | Log-rank
P-value |
|---|
| PTTG1 | 203554_x_at | Never smoked | 102 | 103 | 3.03 | 1.63–5.62 |
2.2×10⁻⁴a |
|
| 203554_x_at | Smoked | 410 | 410 | 1.32 | 1.07–1.62 |
8.9×10⁻³a |
| PTTG2 | 214557_at | Never smoked | 102 | 103 | 2.1 | 1.18–3.75 |
1.0×10⁻²a |
|
| 214557_at | Smoked | 423 | 397 | 1.47 | 1.19–1.81 |
2.8×10⁻⁴a |
| PTTG3P | 208511_at | Never smoked | 105 | 100 | 3.11 | 1.70–5.71 |
1.1×10⁻⁴a |
|
| 208511_at | Smoked | 413 | 407 | 1.41 | 1.15–1.74 |
1.1×10⁻³a |
| Table VI.Correlation of PTTG family with the
sex of non-small cell lung cancer patients. |
Table VI.
Correlation of PTTG family with the
sex of non-small cell lung cancer patients.
| PTTG family
member | Affymetrix ID | Sex | Low expression
(N) | High expression
(N) | HR | 95% CI | Log-rank
P-value |
|---|
| PTTG1 | 203554_x_at | Female | 359 | 356 | 1.87 | 1.47–2.38 |
1.7×10⁻⁷a |
|
| 203554_x_at | Male | 550 | 550 | 1.53 | 1.31–1.79 |
1.2×10⁻⁷a |
| PTTG2 | 214557_at | Female | 364 | 351 | 1.34 | 1.06–1.69 |
1.4×10⁻²a |
|
| 214557_at | Male | 580 | 520 | 1.24 | 1.06–1.46 |
6.9×10⁻³a |
| PTTG3P | 208511_at | Female | 359 | 356 | 1.81 | 1.43–2.29 |
6.6×10⁻⁷a |
|
| 208511_at | Male | 556 | 544 | 1.45 | 1.24–1.70 |
4.2×10⁻⁶a |
Discussion
Lung cancer is the leading cause of
cancer-associated mortality worldwide, which is associated with
significant health and financial burdens (1). As the most common type or lung cancer,
rapid improvements in the diagnosis, treatment and prognosis of
NSCLC is important. The PTTG family, which comprises PTTG1, PTTG2
and PTTG3P, is a newly identified gene class. Among the three
homologous genes, PTTG1 has been the most extensively studied and
has been identified to be closely associated with the onset and
progression of multiple human cancer types, including pituitary
tumor (22), malignant glioma
(7), thyroid (23), breast (24), ovarian (25), bladder (8), prostate (9) and lung cancer (26–30).
Honda et al (30) have
demonstrated that PTTG1 is significantly upregulated in NSCLC and
its overexpression serves a role in the genesis and progression of
NSCLC. However, to the best or our knowledge, a systematic analysis
regarding the expression and prognostic role of PTTG1 in NSCLC has
not been previously performed. In addition, PTTG2 and PTTG3P have
been reported to be associated with tumor development (12,13); to
the best of our knowledge, no previous study has investigated their
expression and roles in NSCLC. Therefore, the present study
systematically investigated the expression and prognostic roles of
the PTTG family genes in NSCLC.
A comprehensive analysis of the mRNA expression of
the PTTG family genes in NSCLC was performed in the present study
using the GEPIA, UALCAN and Oncomine databases. The results
demonstrated that PTTG1 was significantly upregulated in cancer
tissue compared with normal tissue, which was in accordance with
the results of previous studies on other types of cancer (7–9). By
contrast, for PTTG2 and PTTG3P expression, the data from the three
databases were inconsistent. The results of the GEPIA and Oncomine
database analysis suggested that there were no significant
differences in PTTG2 and PTTG3P expression between NSCLC and normal
lung tissues. However, the results from the UALCAN database
indicated an upregulation of PTTG2 and PTTG3P in NSCLC compared
with normal tissue. Therefore, further studies on the expression of
these genes in NSCLC are required to confirm these results.
The Kaplan Meier-plotter database was used to
perform a broad assessment of the prognostic roles of the PTTG
family genes in patients with NSCLC. The results demonstrated that
patients with NSCLC (1,924 samples) with high PTTG1, PTTG2 and
PTTG3P expression exhibited a shorter OS time compared with healthy
controls. In different subtypes of patients with NSCLC, PTTG1 and
PTTG3P may serve as promising prognostic biomarkers, as their mRNA
expression levels were significantly associated with the prognosis
of patients with LUAD. However, for patients with LUAD and LUSC,
PTTG2 was not significantly associated with prognosis. Only 720 and
524 clinical samples were included in the analysis of the
prognostic roles of PTTG2 in patients with LUAD and LUSC,
respectively; the relatively small sample counts may have
influenced the results.
The present study further determined the
associations of the prognostic values of the mRNA expression of
PTTG family genes with clinicopathological features, including
clinical stage, pathological grade, lymph node metastasis, smoking
history and sex. The associations between the levels of PTTG family
mRNA expression and chemotherapy or radiotherapy were also
assessed. The findings demonstrated that a high expression of PTTG
family genes indicated a poor prognosis in patients with clinical
stage I disease, patients who had smoked, patients who had
never-smoked. No differences were observed in terms of the sex of
the patients in the prognosis of patients with NSCLC with high
expression of PTTG family genes. High expression levels of PTTG1
and PTTG3P were associated with short survival time of patients
with NSCLC who had not received chemotherapy. PTTG family genes
demonstrated no significant association with radiotherapy,
pathological grade and lymph node status, partially due to the
relatively limited sample size. These results may inform the
selection of therapeutic choices for NSCLC patients with various
PTTG family gene expression levels. Future studies with a larger
sample size are required to further reveal the associations of the
expression levels of PTTG family genes with these
clinicopathological features in patients with NSCLC. Of note, in
addition to LUAD and LUSC subtypes, NSCLC also has other subtypes,
such as lung adenosquamous carcinoma and large cell lung cancer.
Therefore, although PTTG family exhibited unfavorable prognostic
values in all NSCLC patients, they may have various prognostic
values in LUAD or LUSC.
In conclusion, the results of the present study
suggest that PTTG family genes, particularly PTTG1, are
significantly overexpressed in LUAD and LUSC. In addition,
increased expression of PTTG family genes may serve as promising
prognostic biomarkers for patients with NSCLC.
Acknowledgements
Not applicable.
Funding
This study was supported by the 2017 Science and
Technology Innovation Team Project of Zhengzhou Railway Vocational
and Technical College (grant no. 17060001).
Availability of data and materials
All data generated or analyzed during this study are
included in this published article.
Authors' contributions
WL and JC conceived and designed the study. SY, XW
and JL wrote the manuscript. SY, XW and JL performed gene
expression analysis, survival analysis and prepared figures and
tables. BD and KS interpreted the results. BD, KS and WL revised
the manuscript. All authors read and approved the final
manuscript.
Ethics approval and consent to
participate
Not applicable.
Patient consent for publication
Not applicable.
Competing interests
The authors declare that they have no competing
interests.
Glossary
Abbreviations
Abbreviations:
|
NSCLC
|
non-small cell lung cancer
|
|
LUAD
|
lung adenocarcinoma
|
|
LUSC
|
lung squamous cell carcinoma
|
|
PTTG
|
pituitary tumor transforming gene
|
|
GEPIA
|
Gene Expression Profiling Interactive
Analysis
|
|
TCGA
|
The Cancer Genome Atlas
|
|
FC
|
fold-change
|
|
OS
|
overall survival
|
|
HR
|
hazard ratio
|
|
CI
|
confidence interval
|
References
|
1
|
Chen W, Zheng R, Baade PD, Zhang S, Zeng
H, Bray F, Jemal A, Yu XQ and He J: Cancer statistics in China,
2015. CA Cancer J Clin. 66:115–132. 2016. View Article : Google Scholar : PubMed/NCBI
|
|
2
|
Liu K, Jin M, Xiao L, Liu H and Wei S:
Distinct prognostic values of mRNA expression of glutathione
peroxidases in non-small cell lung cancer. Cancer Manag Res.
10:2997–3005. 2018. View Article : Google Scholar : PubMed/NCBI
|
|
3
|
Jones CM, Brunelli A, Callister ME and
Franks KN: Multimodality treatment of advanced non-small cell lung
cancer: Where are we with the evidence? Curr Surg Rep. 6:52018.
View Article : Google Scholar : PubMed/NCBI
|
|
4
|
You Q, Guo H and Xu D: Distinct prognostic
values and potential drug targets of ALDH1 isoenzymes in
non-small-cell lung cancer. Drug Des Devel Ther. 9:5087–5097. 2015.
View Article : Google Scholar : PubMed/NCBI
|
|
5
|
Chen L, Puri R, Lefkowitz EJ and Kakar SS:
Identification of the human pituitary tumor transforming gene
(hPTTG) family: Molecular structure, expression, and chromosomal
localization. Gene. 248:41–50. 2000. View Article : Google Scholar : PubMed/NCBI
|
|
6
|
Vlotides G, Eigler T and Melmed S:
Pituitary tumor-transforming gene: Physiology and implications for
tumorigenesis. Endocr Rev. 28:165–186. 2007. View Article : Google Scholar : PubMed/NCBI
|
|
7
|
Su X, Chen J, Ni L, Shi W, Shi J, Liu X,
Zhang Y, Gong P, Zhu H and Huang Q: Inhibition of PTTG1 expression
by microRNA suppresses proliferation and induces apoptosis of
malignant glioma cells. Oncol Lett. 12:3463–3471. 2016. View Article : Google Scholar : PubMed/NCBI
|
|
8
|
Xiang W, Wu X, Huang C, Wang M, Zhao X,
Luo G, Li Y, Jiang G, Xiao X and Zeng F: PTTG1 regulated by
miR-146a-3p promotes bladder cancer migration, invasion, metastasis
and growth. Oncotarget. 8:664–678. 2017. View Article : Google Scholar : PubMed/NCBI
|
|
9
|
Zhang Z, Jin B, Jin Y, Huang S, Niu X, Mao
Z and Xin D: PTTG1, A novel androgen responsive gene is required
for androgen-induced prostate cancer cell growth and invasion. Exp
Cell Res. 350:1–8. 2017. View Article : Google Scholar : PubMed/NCBI
|
|
10
|
Li H, Yin C, Zhang B, Sun Y, Shi L, Liu N,
Liang S, Lu S, Liu Y, Zhang J, et al: PTTG1 promotes migration and
invasion of human non-small cell lung cancer cells and is modulated
by miR-186. Carcinogenesis. 34:2145–2155. 2013. View Article : Google Scholar : PubMed/NCBI
|
|
11
|
Li WH, Chang L, Xia YX, Wang L, Liu YY,
Wang YH, Jiang Z, Xiao J and Wang ZR: Knockdown of PTTG1 inhibits
the growth and invasion of lung adenocarcinoma cells through
regulation of TGFB1/SMAD3 signaling. Int J Immunopathol Pharmacol.
28:45–52. 2015. View Article : Google Scholar : PubMed/NCBI
|
|
12
|
Guo Y, Shao Y, Chen J, Xu S, Zhang X and
Liu H: Expression of pituitary tumor-transforming 2 in human
glioblastoma cell lines and its role in glioblastoma tumorigenesis.
Exp Ther Med. 11:1847–1852. 2016. View Article : Google Scholar : PubMed/NCBI
|
|
13
|
Weng W, Ni S, Wang Y, Xu M, Zhang Q, Yang
Y, Wu Y, Xu Q, Qi P, Tan C, et al: PTTG3P promotes gastric tumour
cell proliferation and invasion and is an indicator of poor
prognosis. J Cell Mol Med. 21:3360–3371. 2017. View Article : Google Scholar : PubMed/NCBI
|
|
14
|
Tang Z, Li C, Kang B, Gao G, Li C and
Zhang Z: GEPIA: A web server for cancer and normal gene expression
profiling and interactive analyses. Nucleic Acids Res 45 (W1).
W98–W102. 2017. View Article : Google Scholar
|
|
15
|
Chandrashekar DS, Bashel B, Balasubramanya
SAH, Creighton CJ, Ponce-Rodriguez I, Chakravarthi BVSK and
Varambally S: UALCAN: A portal for facilitating tumor subgroup gene
expression and survival analyses. Neoplasia. 19:649–658. 2017.
View Article : Google Scholar : PubMed/NCBI
|
|
16
|
Rhodes DR, Kalyana-Sundaram S, Mahavisno
V, Varambally R, Yu J, Briggs BB, Barrette TR, Anstet MJ,
Kincead-Beal C, Kulkarni P, et al: Oncomine 3.0: Genes, pathways,
and networks in a collection of 18,000 cancer gene expression
profiles. Neoplasia. 9:166–180. 2007. View Article : Google Scholar : PubMed/NCBI
|
|
17
|
Rhodes DR, Yu J, Shanker K, Deshpande N,
Varambally R, Ghosh D, Barrette T, Pandey A and Chinnaiyan AM:
ONCOMINE: A cancer microarray database and integrated data-mining
platform. Neoplasia. 6:1–6. 2004. View Article : Google Scholar : PubMed/NCBI
|
|
18
|
Hou GX, Liu P, Yang J and Wen S: Mining
expression and prognosis of topoisomerase isoforms in
non-small-cell lung cancer by using Oncomine and Kaplan-Meier
plotter. PLoS One. 12:e01745152017. View Article : Google Scholar : PubMed/NCBI
|
|
19
|
Lou W, Chen J, Ding B, Chen D, Zheng H,
Jiang D, Xu L, Bao C, Cao G and Fan W: Identification of
invasion-metastasis-associated microRNAs in hepatocellular
carcinoma based on bioinformatic analysis and experimental
validation. J Transl Med. 16:2662018. View Article : Google Scholar : PubMed/NCBI
|
|
20
|
Lou W, Liu J, Ding B, Chen D, Xu L, Ding
J, Jiang D, Zhou L, Zheng S and Fan W: Identification of potential
miRNA-mRNA regulatory network contributing to pathogenesis of
HBV-related HCC. J Transl Med. 17:72019. View Article : Google Scholar : PubMed/NCBI
|
|
21
|
Győrffy B, Surowiak P, Budczies J and
Lánczky A: Online survival analysis software to assess the
prognostic value of biomarkers using transcriptomic data in
non-small-cell lung cancer. PLoS One. 8:e822412013. View Article : Google Scholar : PubMed/NCBI
|
|
22
|
Fuertes M, Sapochnik M, Tedesco L, Senin
S, Attorresi A, Ajler P, Carrizo G, Cervio A, Sevlever G, Bonfiglio
JJ, et al: Protein stabilization by RSUME accounts for PTTG
pituitary tumor abundance and oncogenicity. Endocr Relat Cancer.
25:665–676. 2018. View Article : Google Scholar : PubMed/NCBI
|
|
23
|
Read ML, Fong JC, Modasia B, Fletcher A,
Imruetaicharoenchoke W, Thompson RJ, Nieto H, Reynolds JJ, Bacon A,
Mallick U, et al: Elevated PTTG and PBF predicts poor patient
outcome and modulates DNA damage response genes in thyroid cancer.
Oncogene. 36:5296–5308. 2017. View Article : Google Scholar : PubMed/NCBI
|
|
24
|
Gao H, Zhong F, Xie J, Peng J and Han Z:
PTTG promotes invasion in human breast cancer cell line by
upregulating EMMPRIN via FAK/Akt/mTOR signaling. Am J Cancer Res.
6:425–439. 2016.PubMed/NCBI
|
|
25
|
Wang X, Duan W, Li X, Liu J, Li D, Ye L,
Qian L, Yang A, Xu Q, Liu H, et al: PTTG regulates the metabolic
switch of ovarian cancer cells via the c-myc pathway. Oncotarget.
6:40959–40969. 2015. View Article : Google Scholar : PubMed/NCBI
|
|
26
|
Kakar SS and Malik MT: Suppression of lung
cancer with siRNA targeting PTTG. Int J Oncol. 29:387–395.
2006.PubMed/NCBI
|
|
27
|
Mu YM, Oba K, Yanase T, Ito T, Ashida K,
Goto K, Morinaga H, Ikuyama S, Takayanagi R and Nawata H: Human
pituitary tumor transforming gene (hPTTG) inhibits human lung
cancer A549 cell growth through activation of p21(WAF1/CIP1).
Endocr J. 50:771–781. 2003. View Article : Google Scholar : PubMed/NCBI
|
|
28
|
Rehfeld N, Geddert H, Atamna A, Rohrbeck
A, Garcia G, Kliszewski S, Neukirchen J, Bruns I, Steidl U, Fenk R,
et al: The influence of the pituitary tumor transforming gene-1
(PTTG-1) on survival of patients with small cell lung cancer and
non-small cell lung cancer. J Carcinog. 5:42006. View Article : Google Scholar : PubMed/NCBI
|
|
29
|
Shah PP, Fong MY and Kakar SS: PTTG
induces EMT through integrin αVβ3-focal adhesion kinase signaling
in lung cancer cells. Oncogene. 31:3124–3135. 2012. View Article : Google Scholar : PubMed/NCBI
|
|
30
|
Honda S, Hayashi M, Kobayashi Y, Ishikawa
Y, Nakagawa K and Tsuchiya E: A role for the pituitary
tumor-transforming gene in the genesis and progression of non-small
cell lung carcinomas. Anticancer Res. 23:3775–3782. 2003.PubMed/NCBI
|