Introduction
Osteosarcoma (OS) is the most common type of bone
cancer encountered in children and adolescents (1). The incidence rates of OS for all races
and sexes are 4/1,000,000/year for individuals aged 0–14 years and
5/1,000,000/year for individuals aged 0–19 years (2). This tumor is highly aggressive and
metastasizes primarily to lungs. It occurs in the metaphyseal
regions of the proximal humerus, proximal tibia and distal femur
with a male predominance. At present, the pathogenesis of OS
remains unclear. Due to the early occurrence of distant metastasis
and insensitivity to chemotherapy, the 5-year survival rate of the
patients was only 50–60%. Therefore, it is important to investigate
novel treatments for OS. Numerous studies have indicated that miRNA
serves an important role in the occurrence, development, invasion
and metastasis of OS (3,4). miRNA has been developed as a biomarker
for OS (5–7).
MicroRNA (miRNA) is a type of small non-coding RNA,
containing 18–21 nucleotides. It can regulate gene expression at
the post-transcriptional level by base pairing to the complementary
sequences in the 3′-untranslated region (UTR) of the target mRNA.
miRNAs occur, not only in the cell, but also in the serum, plasma,
saliva, urine, milk and other body fluids or secretions (8). Ma et al (9) detected the expression levels of
circulating miR-148a by reverse transcription-quantitative
polymerase chain reaction (RT-qPCR) and revealed that expression of
circulating miR-148a in the peripheral blood have clinical
potential as a novel diagnostic biomarker for OS (9). Previous studies have revealed that in
the OS tissues, the expression levels of certain miRNAs increased
while the expression levels of certain miRNAs decreased. miR-27a
functions as an oncogene by targeting MAP2K4 in the OS MG63 cell
line. Inhibition of miR-27a can inhibit the proliferation and
migration of MG63 cells (10).
However, the expression levels of miR-145 and miR-32 were
significantly lower in the OS tissues than in the adjacent normal
tissues (11,12). Overexpression of miR-145 or miR-32
can inhibit the proliferation of human OS cells. Therefore,
research into the expression of miRNAs in OS is required.
The development of gene expression profiles may aid
in elucidating the function of miRNAs in OS. Hu et al
(4) identified 268 miRNAs that were
significantly dysregulated in OS by miRNA microarrays and RT-qPCR.
Among these miRNAs, miR-9, miR-99, miR-195, miR-148a and miR-181a
were overexpressed, whereas miR-143, miR-145, miR-335 and miR-539
were downregulated (4). In another
miRNA microarray of 19 human OS cell lines, the expression levels
of miR-9, miR-21, miR-31, miR-196a/b, miR-374a, miR-29 and miR-130
were increased, while the expression levels of miR-126, miR-486-5p,
miR-150, miR-142-3p, miR-223, miR-144, miR-1, miR-195 and miR-206
were decreased (13). Collectively,
these altered miRNAs may function as valuable diagnostic and
predictive tools for OS, but the complexity of OS, difference in
sample datasets and diversity of analysis methods serve as
limitations, as the expression levels of certain miRNAs in
different studies are inconsistent. Therefore, it is necessary to
identify certain specific miRNAs as biomarkers for the diagnosis of
OS. This study presented an integrative strategy for identifying
OS-associated miRNAs/mRNAs by analyzing miRNA and mRNA expression
profiles from the Gene Expression Omnibus database (GEO). To the
best of our knowledge, the present study predicted differentially
expressed miRNA target genes by intersecting the datasets from the
GEO database, and constructed an miRNA-targets regulatory network.
Certain important miRNAs would be used as biomarkers for the
diagnosis, prediction and prognosis of therapeutic response.
Materials and methods
Search strategy
The NCBI GEO database (available at http://www.ncbi.nlm.nih.gov/geo) was carefully
searched until January 8, 2016, to identify relevant data,
including four mRNA expression profiling (GSE70414, GSE42572,
GSE56001 and GSE36001) and two microRNA expression profiling
(GSE28424 and GSE70415) datasets. Two distinct sets of key words
were used simultaneously, namely ‘osteosarcoma’ and ‘Homo
sapiens’.
Data were used if they met the following criteria:
i) They studied the patients with expression profiles or non-coding
RNA profiles by array; ii) the selected dataset included
genome-wide mRNA transcriptome data and miRNA expression data; iii)
these data came from biopsy tissues or cultured cells of patients
with OS and a control group; iv) standardization and original
datasets were considered. A total of 4 sets of mRNA datasets and 2
sets of miRNA datasets were incorporated into the present study
following selection.
Screening differentially expressed
miRNAs and mRNAs
Following background correction and normalization of
raw data, the differentially expressed miRNAs and mRNAs between OS
and controls were identified by Student's t-tests using the Limma
package in R (Bioconductor 3; http://www.bioconductor.org) (14). Next, the χ2 test was used
to combine P-values of multiple studies. The random effects model
was used to calculate effects from multiple studies. The criterion
of selection of differently expressed miRNAs and mRNAs was FDR
<0.01.
Targets of miRNA
The targeted genes for human miRNA were downloaded
from the miRTarBase database (http://mirtarbase.mbc.nctu.edu.tw/), and the
transcriptional targets of the identified miRNAs in OS were
predicted. Since the miRNAs and the mRNAs targeted by miRNA exhibit
an inverse expression association, in the present study, the miRNA
and the mRNAs that exhibited inverse expression correlations with
each other were subjected to further study.
Gene annotation
The Database for Annotation, Visualization and
Integrated Discovery (DAVID; http://david.ncifcrf.gov/) (15) is the most efficient and commonly used
tool to analyze gene functional enrichment. To fully understand the
biological functions of miRNA target genes, Gene Ontology (GO) and
Kyoto Encyclopedia of Genes and Genomes (KEGG) pathway enrichment
analysis were performed (http://www.genome.ad.jp/kegg/). P<0.05 was
considered to indicate a statistically significant difference.
Human OS tissue samples and the MG-63
cell line
Five frozen OS tissue samples and 5 normal bone
samples from individuals of similar age groups were obtained from
Xiangya Hospital of Central South University (Changsha, China). The
mean ages of the OS patients and normal patients were 55±5 and
58±6, years, respectively. All patients were male. The excised
primary OS tumors were obtained prior to the initiation of
chemotherapy or radiotherapy following the receipt of written
informed consent and approval from the Institutional Review Board
of Xiangya Hospital of Central South University. The MG-63 cell
line was cultured in Dulbecco's modified Eagle's medium (Thermo
Fisher Scientific, Inc., Waltham, MA, USA) containing 10% fetal
bovine serum (Hyclone; GE Healthcare Life Sciences, Logan, UT, USA)
supplemented with streptomycin (100 µg/ml) and penicillin (100
U/ml) (Life Technologies; Thermo Fisher Scientific, Inc.).
RNA extraction and reverse
transcription-quantitative polymerase chain reaction (RT-qPCR)
Total RNA was extracted using TRIzol reagent (Thermo
Fisher Scientific, Inc.), according to the manufacturer's
protocols, and reverse transcribed using a Transgen reverse
transcription kit (Beijing Transgen Biotech Co., Ltd., Beijing,
China). The resultant cDNA was used for subsequent qPCR analysis.
qPCR was performed in a ABI7500 Real-Time PCR system with a PCR
Master mix (SYBRGreen) reagent kit (Beijing Transgen Biotech Co.,
Ltd.). The thermal cycling conditions were as follows: 95°C for 10
min, followed by 40 cycles of 95°C for 15 sec and 60°C for 1 min,
annealing at 55°C for 30 sec and elongation at 72°C for 3 min. The
results were analyzed using the 2−∆∆Cq method (16). GAPDH was used as an internal control
gene and each reaction was performed in triplicate. The primers
used in the RT-qPCR are listed in Tables
I and II.
 | Table I.Primers of the genes. |
Table I.
Primers of the genes.
| Gene symbol | Forward (5′-3′) | Reverse (5′-3′) |
|---|
| ESR1 |
CCCACTCAACAGCGTGTCTC |
CGTCGATTATCTGAATTTGGCCT |
| BTK |
TCTGAAGCGATCCCAACAGAA |
TGCACGGTCAAGAGAAACAGG |
| Foxp1 |
ATGATGCAAGAATCTGGGACTG |
AGCTGGTTGTTTGTCATTCCTC |
| c-FLIP |
TCAAGGAGCAGGGACAAGTTA |
GACAATGGGCATAGGGTGTTATC |
| MAOA |
GAATCAAGAGAAGGCGAGTATCG |
GGCAGCAGATAGTCCTGAAATG |
| EGR1 |
GGTCAGTGGCCTAGTGAGC |
GTGCCGCTGAGTAAATGGGA |
| GAS1 |
ATGCCGCACCGTCATTGAG |
TCATCGTAGTAGTCGTCCAGG |
| TSC22D3 |
AACACCGAAATGTATCAGACCC |
TGTCCAGCTTAACGGAAACCA |
| MEOX2 |
GCACCCGTTCTCCCAATCC |
TCCCGCGATTATGCAAGATGA |
| SLC2A3 |
GCTGGGCATCGTTGTTGGA |
GCACTTTGTAGGATAGCAGGAAG |
| GAPDH |
GGAGCGAGATCCCTCCAAAAT |
GGCTGTTGTCATACTTCTCATGG |
| Table II.Primers of the miRNAs. |
Table II.
Primers of the miRNAs.
| miRNA | Stem loop primer
(5′-3′) | Forward (5′-3′) | Reverse (5′-3′) |
|---|
| hsa-miR-22 |
GTCGTATCCAGTGCAGGGTCCGAGGTATTCGCACTGGATACGACTAAAGC | GAGTCTTCAGTGGCAA |
GTGCAGGGTCCGAGGT |
| hsa-miR-134 |
GTCGTATCCAGTGCAGGGTCCGAGGTATTCGCACTGGATACGACCCCCTC |
GGATGTGACTGGTTGACC |
GTGCAGGGTCCGAGGT |
| hsa-miR-493 |
GTCGTATCCAGTGCAGGGTCCGAGGTATTCGCACTGGATACGACAATGTT |
GGGTTGTACATGGTAGGCT |
GTGCAGGGTCCGAGGT |
| hsa-miR-346 |
GTCGTATCCAGTGCAGGGTCCGAGGTATTCGCACTGGATACGACAGAGGC |
GGGTGTCTGCCCGCATGCCT |
GTGCAGGGTCCGAGGT |
| hsa-miR-494 |
GTCGTATCCAGTGCAGGGTCCGAGGTATTCGCACTGGATACGACAGAGAA |
GGGAGGTTGTCCGTGTTGTC |
GTGCAGGGTCCGAGGT |
| hsa-miR-541 |
GTCGTATCCAGTGCAGGGTCCGAGGTATTCGCACTGGATACGACAGTGGG |
GGGAAAGGATTCTGCTGTCGGT |
GTGCAGGGTCCGAGGT |
| hsa-miR-182 |
GTCGTATCCAGTGCAGGGTCCGAGGTATTCGCACTGGATACGACAGTGTG |
GGGTTTGGCAATGGTAGAACT |
GTGCAGGGTCCGAGGT |
| hsa-miR-183 |
GTCGTATCCAGTGCAGGGTCCGAGGTATTCGCACTGGATACGACAGTGAA |
GGATATGGCACTGGTAGAA |
GTGCAGGGTCCGAGGT |
| hsa-miR-301a |
GTCGTATCCAGTGCAGGGTCCGAGGTATTCGCACTGGATACGACAGTAGT |
GGAGCTCTGACTTTATTGC |
GTGCAGGGTCCGAGGT |
| hsa-miR-596 |
GTCGTATCCAGTGCAGGGTCCGAGGTATTCGCACTGGATACGACCCCGAG |
GGGAAGCCTGCCCGGCTC |
GTGCAGGGTCCGAGGT |
| U6 |
GTCGTATCCAGTGCAGGGTCCGAGGTATTCGCACTGGATACGACAAAATG |
GCGCGTCGTGAAGCGTTC |
GTGCAGGGTCCGAGGT |
Western blotting
Total proteins were isolated using an active protein
extraction kit (KGP1050, Nanjing KeyGen Biotech Co., Ltd., Nanjing,
China). A BCA protein assay kit (Pierce; Thermo Fisher Scientific,
Inc.) was used to determine the protein concentration. A total of
30 µg protein per lane was separated using 10% SDS-PAGE,
transferred onto polyvinylidene difluoride membranes and then
blocked with 5% fat-free milk at room temperature for 2 h.
Membranes were then incubated with primary antibodies detecting
c-FLIP (ab8421; 1:1,000 dilution; Abcam, Cambridge, MA) and GAPDH
(ab8226; 1:2,000 dilution; Abcam, Cambridge, MA) at 4°C overnight.
Following two washes with Tris-buffered saline with Tween 20 (0.5%)
(TBS-T), the membranes were incubated with horseradish
peroxidase-conjugated goat anti-rabbit IgG or anti-mouse IgG
(1:5,000; ZB-2306 or ZB-2304; OriGene Technologies, Inc., Beijing,
China) for 2 h at room temperature and then washed two times with
TBS-T. Proteins were detected using enhanced chemiluminescence
RapidStep™ ECL, according to the manufacturer's protocol (cat. no.
345818; Merck KGaA). ImageJ 1.8.0 (National Institutes of Health,
Bethesda, MD, USA) was applied to quantify the relative protein
levels.
Statistical analysis
Data are presented as the mean ± standard deviation.
The statistical analysis was performed using Student's t-test or
analysis of variance (ANOVA) in SPSS13.0 (SPSS, Inc., Chicago, IL,
USA). Bonferroni's post-hoc test was used when P<0.05 by one-way
ANOVA. All experiments were repeated ≥3 times, and representative
experiments are shown.
Results
Collecting differentially expressed
miRNAs and mRNAs in OS
A total of two miRNA expression profiling studies
and four mRNA expression profiling studies were included. The
characteristics of the aforementioned studies are presented in
Tables III and IV, respectively. After normalizing the raw
miRNA expression datasets and mRNA expression datasets, 15
differentially expressed miRNAs were identified. Among these 15
differentially expressed miRNAs, 5 were upregulated and 10 were
downregulated (Table V). A set of
452 differentially expressed genes (DGEs) were identified in OS,
including 359 upregulated and 93 downregulated.
| Table III.Characteristics of mRNA expression
profiling in osteosarcoma. |
Table III.
Characteristics of mRNA expression
profiling in osteosarcoma.
| GEO accession | Platform | Sample | Samples (N:C) | Country | Year | First author | (Refs.) |
|---|
| GSE70414 | GPL570
[HG-U133_Plus_2] Affymetrix Human Genome U133 Plus 2.0 Array | Cell line | 1:5 | Japan | 2015 | Kawano et
al | (17) |
| GSE42572 | GPL13376 Illumina
HumanWG-6 v2.0 expression beadchip | MSC from donor | 5:7 | USA | 2015 | Buddingh et
al | (18) |
| GSE56001 | GPL10558 Illumina
HumanHT-12 V4.0 expression beadchip | Primary human
osteosarcoma cells | 3:3 | Taiwan | 2014 | Wang et
al | (19) |
| GSE36001 | GPL6102 Illumina
human-6 v2.0 expression beadchip | Cell line | 6:19 | Norway | 2012 | Kresse et
al | (20) |
| Table IV.Characteristics of microRNA
expression profiling of osteosarcoma. |
Table IV.
Characteristics of microRNA
expression profiling of osteosarcoma.
| GEO accession | Platform | Sample | Samples (N:C) | Country | Year | First author | (Refs.) |
|---|
| GSE28424 | GPL13376 Illumina
HumanWG-6 v2.0 expression beadchip | Cell line | 4:19 | Norway | 2012 | Namløs et
al | (13) |
| GSE70415 | GPL16384 [miRNA-3]
Affymetrix Multispecies miRNA-3 Array | Cell line | 1:3 | Japan | 2015 | Wang et
al | (21) |
| Table V.List of differentially expressed
miRNAs in osteosarcoma. |
Table V.
List of differentially expressed
miRNAs in osteosarcoma.
| miRNAs | P-value | LogFC |
|---|
| Downregulated
miRNAs |
|
|
|
hsa-miR-541 |
1.19×10⁻⁴ | −1.45 |
|
hsa-miR-22 |
2.78×10⁻⁴ | −1.05 |
|
hsa-mir-520f_x_st |
1.97×10⁻² | −1.04 |
|
hsa-miR-134 |
7.49×10⁻¹² | −4.37 |
|
hsa-miR-493 |
5.05×10⁻³ | −1.36 |
|
hsa-mir-22_st |
2.29×10⁻³ | −1.38 |
|
hsa-miR-494 |
1.24×10⁻³ | −1.33 |
|
hsa-miR-633 |
1.79×10⁻⁴ | −0.82 |
|
hsa-miR-541_st |
4.30×10⁻² | −0.99 |
|
hsa-miR-605 |
3.22×10⁻³ | −1.86 |
| Upregulated
miRNAs |
|
|
|
hsa-miR-182_st |
1.31×10⁻⁴ | 2.70 |
|
hsa-miR-183 |
1.04×10⁻³ | 2.88 |
|
hsa-miR-596_st |
9.22×10⁻³ | 1.07 |
|
hsa-miR-301a |
2.66×10⁻⁷ | 5.55 |
|
hsa-miR-346 |
7.27×10⁻³ | 1.82 |
Regulatory network of miRNAs and
targets in OS
The present study used the miRTarBase to predict the
putative transcriptional targets of upregulated and downregulated
miRNAs in OS. Compared with the putative targets with DGEs in OS,
452 miRNA-target gene pairs with an inverse association were
obtained. Among them, 359 miRNA-target gene pairs were upregulated
and 93 miRNA-target gene pairs were downregulated.
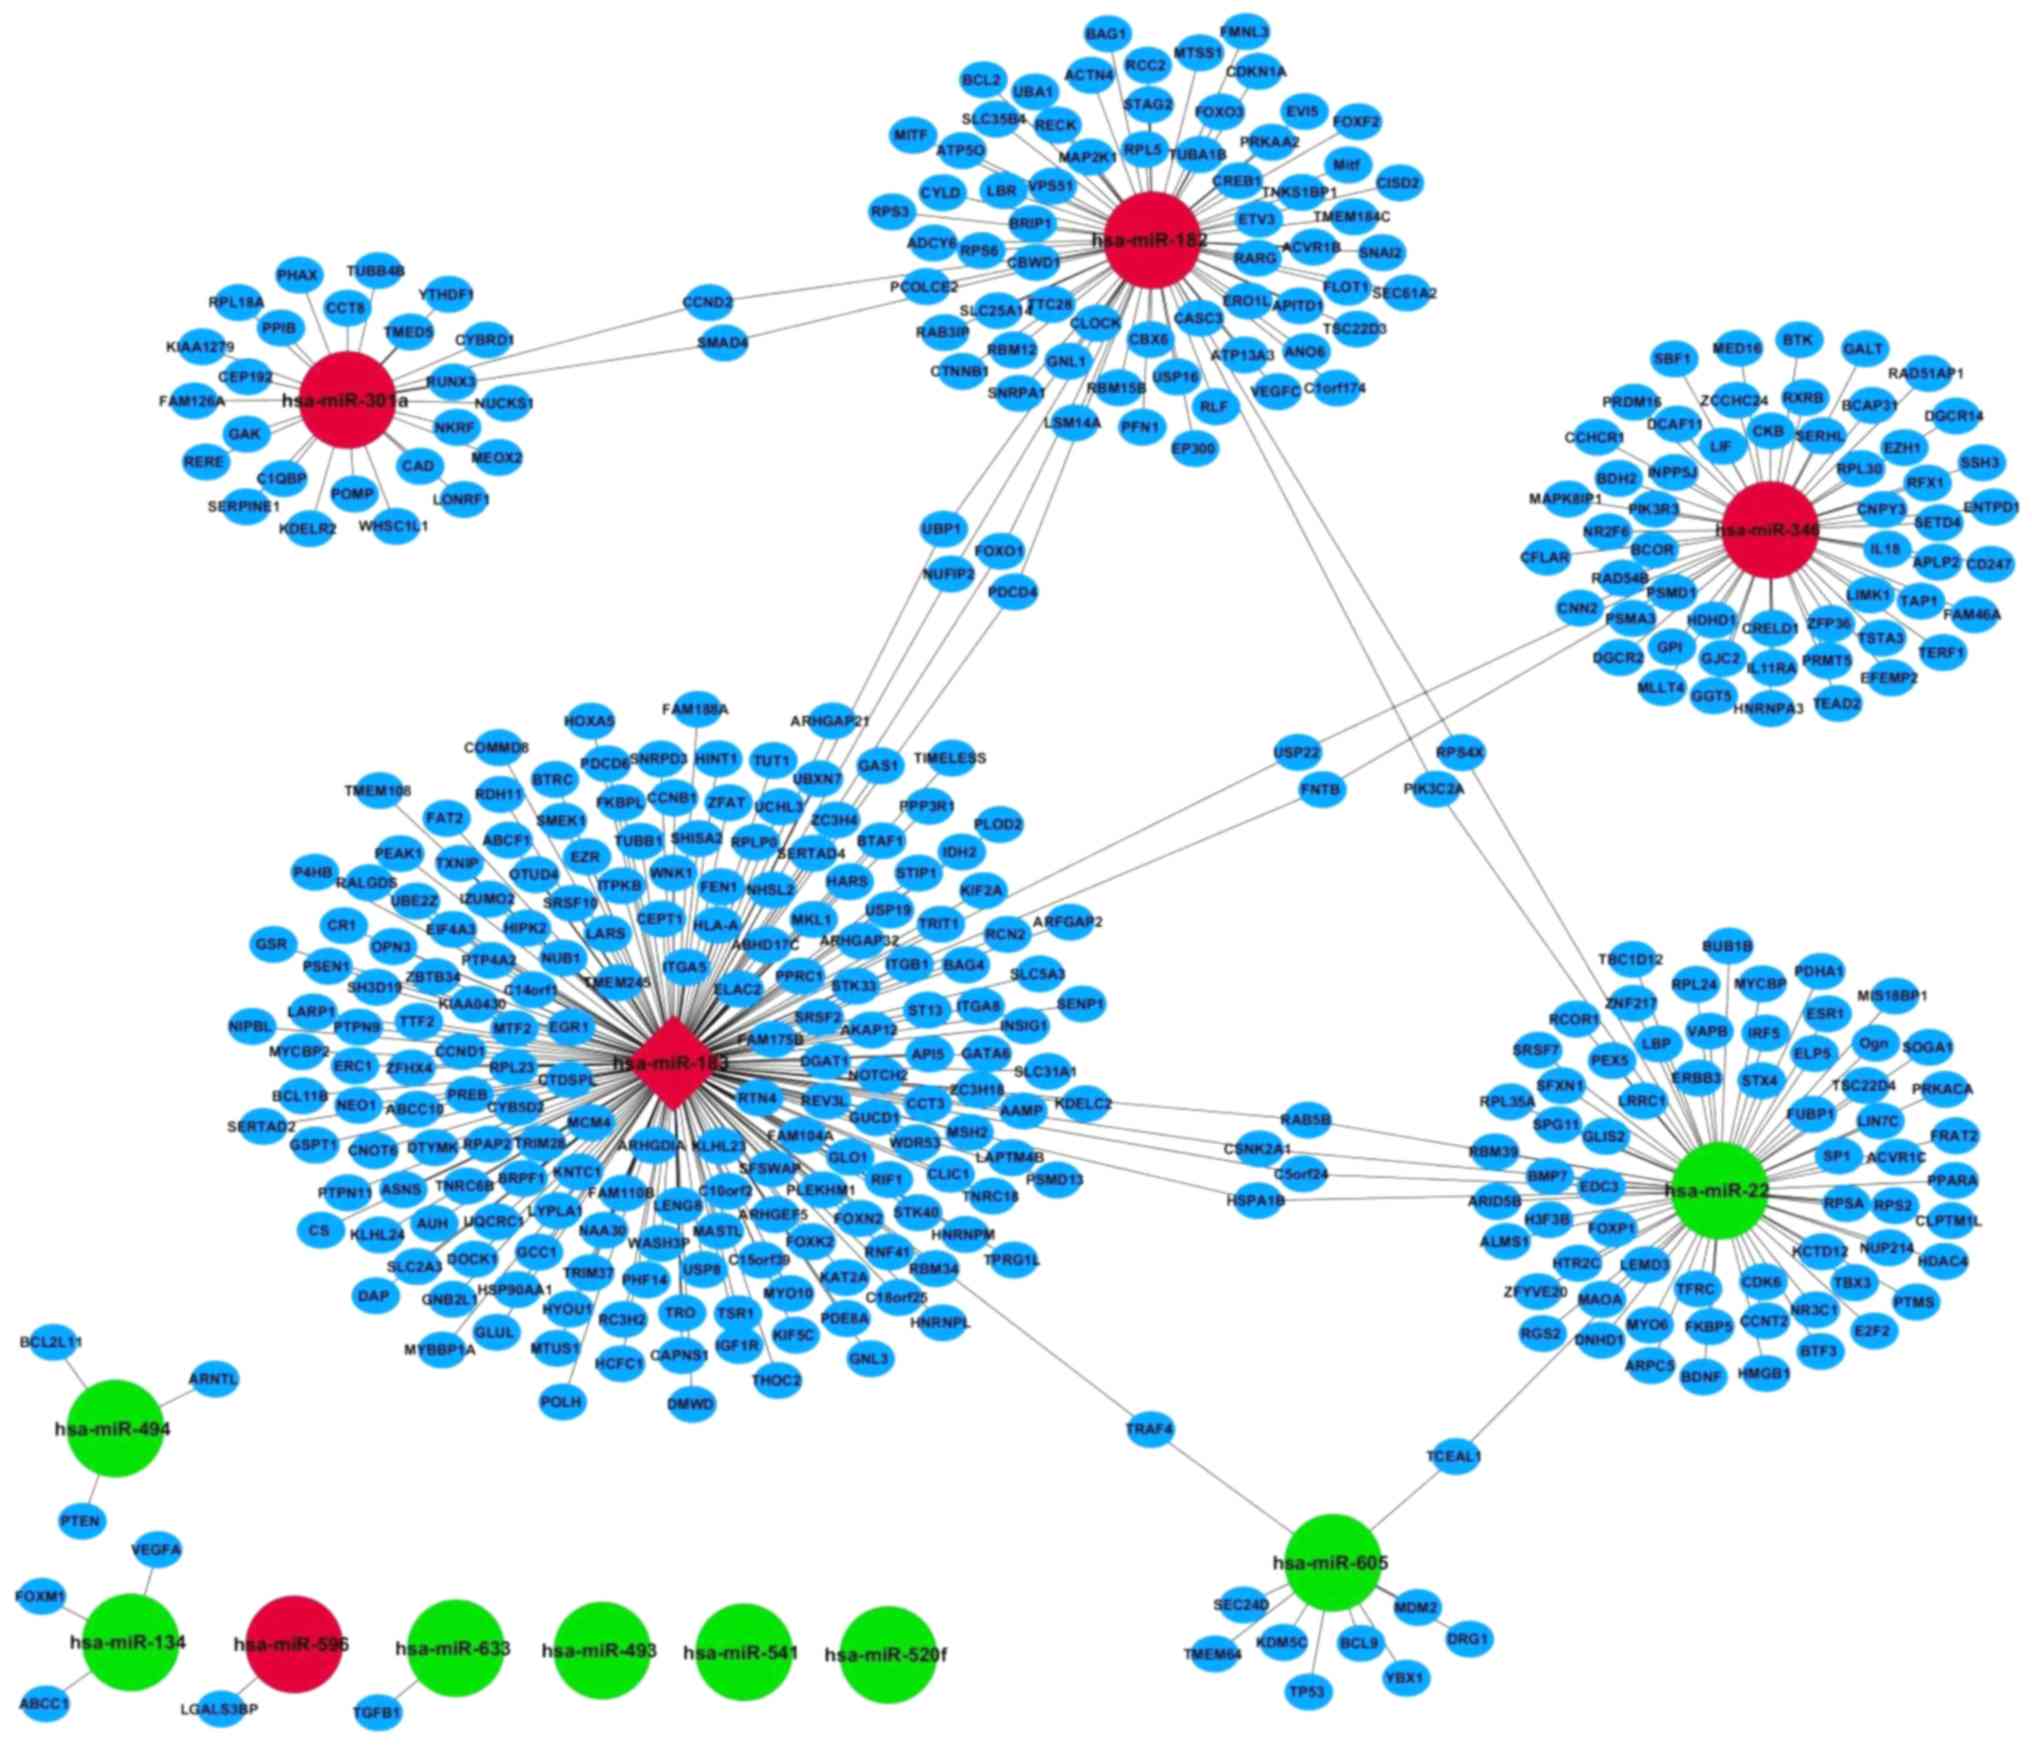
According to the miRNA-target gene pairs, a
miRNA-target gene regulatory network was constructed (Fig. 1). The regulatory networks consisted
of 452 miRNA-target interactions between 13 miRNAs and 452 targets
in the context of OS. The top ten downregulated miRNAs in the
regulatory network were hsa-miR-541, hsa-miR-22, hsa-mir-520f-x-st,
hsa-miR-134, hsa-miR-493, hsa-miR-22-st, hsa-miR-494, hsa-miR-633,
hsa-miR-541-st and hsa-miR-605. The top five upregulated miRNAs in
the network were hsa-miR-182, hsa-miR-183, hsa-mir-596,
hsa-miR-310a and hsa-miR-346.
Enrichment analysis
To assign putative biological functions and pathway
involvement to the differentially expressed target genes,
enrichment analysis was performed. It was revealed that the
significantly enriched GO terms for molecular functions were
transcription regulator activity, transcription activator activity,
enzyme binding, transcription factor activity, sequence-specific
DNA binding, transcription factor binding, structure-specific DNA
binding, RNA binding, nucleotide binding and DNA binding. The
significantly enriched GO terms for cellular component were
cytosol, organelle lumen, membrane-enclosed lumen, intracellular
organelle lumen, nuclear lumen, nucleoplasm, non-membrane-bounded
organelle, intracellular non-membrane-bounded organelle,
ribonucleoprotein complex and cytosolic part, while those for
biological processes were regulation of cell cycle, regulation of
apoptosis, regulation of cell death, regulation of transcription,
positive regulation of macromolecule metabolic process, negative
regulation of apoptosis and negative regulation of cell death
(Table VI).
| Table VI.Top 10 GO terms of differentially
expression microRNA target genes. |
Table VI.
Top 10 GO terms of differentially
expression microRNA target genes.
| A, Biological
process |
|---|
|
|---|
| GO ID | GO term | Count | P-value | FDR |
|---|
| GO:0051726 | Regulation of cell
cycle | 32 |
1.62×10⁻¹⁰ |
2.85×10⁻⁷ |
| GO:0042981 | Regulation of
apoptosis | 51 |
1.12×10⁻⁹ |
1.96×10⁻⁶ |
| GO:0043067 | Regulation of
programmed cell death | 51 |
1.55×10⁻⁹ |
2.72×10⁻⁶ |
| GO:0010941 | Regulation of cell
death | 51 |
1.73×10⁻⁹ |
3.04×10⁻⁶ |
| GO:0010604 | Positive regulation
of macromolecule metabolic process | 51 |
9.35×10⁻⁹ |
1.64×10⁻⁵ |
| GO:0007049 | Cell cycle | 46 |
6.73×10⁻⁸ |
1.18×10⁻⁴ |
| GO:0045449 | Regulation of
transcription | 105 |
8.03×10⁻⁸ |
1.41×10⁻⁴ |
| GO:0043066 | Negative regulation
of apoptosis | 28 |
1.95×10⁻⁷ |
3.43×10⁻⁴ |
| GO:0043069 | Negative regulation
of programmed cell death | 28 |
2.58×10⁻⁷ |
4.52×10⁻⁴ |
| GO:0060548 | Negative regulation
of cell death | 28 |
2.74×10⁻⁷ |
4.81×10⁻⁴ |
|
| B, Cellular
component |
|
| GO:0005829 | Cytosol | 74 |
3.48×10⁻¹² |
1.31×10⁻⁹ |
| GO:0043233 | Organelle
lumen | 83 |
2.64×10⁻⁹ |
9.92×10⁻⁷ |
| GO:0031974 | Membrane-enclosed
lumen | 84 |
2.90×10⁻⁹ |
1.09×10⁻⁶ |
| GO:0070013 | Intracellular
organelle lumen | 81 |
4.88×10⁻⁹ |
1.83×10⁻⁶ |
| GO:0031981 | Nuclear lumen | 70 |
8.13×10⁻⁹ |
3.06×10⁻⁶ |
| GO:0005654 | Nucleoplasm | 47 |
3.18×10⁻⁷ |
1.20×10⁻⁴ |
| GO:0043228 |
Non-membrane-bounded organelle | 97 |
1.58×10⁻⁶ |
5.95×10⁻⁴ |
| GO:0043232 | Intracellular
non-membrane-bounded organelle | 97 |
1.58×10⁻⁶ |
5.95×10⁻⁴ |
| GO:0030529 | Ribonucleoprotein
complex | 30 |
1.42×10⁻⁵ |
5.31×10⁻³ |
| GO:0044445 | Cytosolic part | 15 |
1.51×10⁻⁵ |
5.67×10⁻³ |
|
| C, Molecular
function |
|
| GO:0030528 | Transcription
regulator activity | 71 |
4.60×10⁻⁷ |
2.91×10⁻⁴ |
| GO:0016563 | Transcription
activator activity | 29 |
2.27×10⁻⁶ |
1.44×10⁻³ |
| GO:0019899 | Enzyme binding | 31 |
3.06×10⁻⁵ |
1.92×10⁻² |
| GO:0003700 | Transcription
factor activity | 46 |
7.68×10⁻⁵ |
4.74×10⁻² |
| GO:0043565 | Sequence-specific
DNA binding | 33 |
8.57×10⁻⁵ |
5.28×10⁻² |
| GO:0008134 | Transcription
factor binding | 29 |
1.31×10⁻⁴ |
7.99×10⁻² |
| GO:0043566 | Structure-specific
DNA binding | 13 |
3.45×10⁻⁴ |
0.1.96×10−1 |
| GO:0003723 | RNA binding | 35 |
3.90×10⁻⁴ |
2.19×10⁻¹ |
| GO:0000166 | Nucleotide
binding | 82 |
5.57×10⁻⁴ |
2.97×10⁻¹ |
| GO:0003677 | DNA binding | 84 |
7.06×10⁻⁴ |
3.61×10⁻¹ |
The results of KEGG pathway enrichment analysis
indicated that the most significantly enriched pathways were
prostate cancer, pancreatic cancer, chronic myeloid leukemia,
colorectal cancer, pathways in cancer, melanoma, ribosome, glioma,
cell cycle and bladder cancer, which may have a significant impact
on OS (Table VII).
| Table VII.Top 10 KEGG pathways of
differentially expression miRNA target genes. |
Table VII.
Top 10 KEGG pathways of
differentially expression miRNA target genes.
| KEGG ID | KEGG term | Count | FDR | Genes |
|---|
| hsa05215 | Prostate
cancer | 15 | 0.00083 | E2F2, HSP90AA1,
MAP2K1, CREB1, TP53, FOXO1, PTEN, CTNNB1, IGF1R, CCND1, CDKN1A,
EP300, BCL2, MDM2, PIK3R3 |
| hsa05212 | Pancreatic
cancer | 13 | 0.00286 | E2F2, MAP2K1, TP53,
SMAD4, CDK6, TGFB1, RALGDS, ACVR1C, ACVR1B, VEGFC, CCND1, VEGFA,
PIK3R3 |
| hsa05220 | Chronic myeloid
leukemia | 13 | 0.00448 | E2F2, MAP2K1, TP53,
SMAD4, CDK6, TGFB1, PTPN11, ACVR1C, ACVR1B, CCND1, CDKN1A, MDM2,
PIK3R3 |
| hsa05210 | Colorectal
cancer | 13 | 0.01505 | MAP2K1, MSH2, TP53,
SMAD4, TGFB1, RALGDS, CTNNB1, ACVR1C, ACVR1B, IGF1R, CCND1, BCL2,
PIK3R3 |
| hsa05200 | Pathways in
cancer | 27 | 0.01618 | E2F2, HSP90AA1,
MAP2K1, MSH2, RXRB, MITF, TP53, SMAD4, FOXO1, CDK6, ITGB1, PTEN,
RALGDS, TGFB1, ACVR1C, CTNNB1, IGF1R, VEGFC, ACVR1B, CCND1, CDKN1A,
EP300, BCL2, VEGFA, MDM2, PIK3R3, TRAF4 |
| hsa05218 | Melanoma | 11 | 0.09229 | E2F2, IGF1R,
CDKN1A, CCND1, MAP2K1, MITF, TP53, MDM2, CDK6, PIK3R3, PTEN |
| hsa03010 | Ribosome | 12 | 0.11107 | RPSA, RPL35A,
RPL30, RPL23, RPL18A, RPLP0, RPL5, RPL24, RPS2, RPS4X, RPS6,
RPS3 |
| hsa05214 | Glioma | 10 | 0.18967 | E2F2, IGF1R,
CDKN1A, CCND1, MAP2K1, TP53, MDM2, CDK6, PIK3R3, PTEN |
| hsa04110 | Cell cycle | 14 | 0.19870 | E2F2, TP53, SMAD4,
CDK6, MCM4, TGFB1, CCNB1, CCND1, CDKN1A, EP300, CCND2, BUB1B, MDM2,
STAG2 |
| hsa05219 | Bladder cancer | 8 | 0.39189 | E2F2, VEGFC,
CDKN1A, CCND1, MAP2K1, VEGFA, TP53, MDM2 |
RT-qPCR validation
To validate the association between miRNAs and their
target genes in the regulatory network, the OS tissues from 5
patients and 5 healthy controls were used. A total of 10
miRNA-target pairs were selected for RT-qPCR, including hsa-miR-22
and ESR1, hsa-miR-22 and MAOA, hsa-miR-22 and FOXP1, hsa-miR-346
and BTK, hsa-miR-346 and c-FLIP, hsa-miR-182 and TSC22D3,
hsa-miR-183 and EGR1, hsa-miR-183 and GAS1, hsa-miR-183 and SLC2A3,
and hsa-miR-301a and MEOX2. The RT-qPCR results indicated that
hsa-miR-346 was inversely associated with the target gene, c-FLIP
(Fig. 2). By contrast, the mRNA
expression of BTK, MAOA, ESR1, FOXP1, GAS1, SLC2A3, MEOX2, TSC22D3
and EGR1 were not consistent with the results of integrated
analysis (Fig. 2). Notably, the
expression of hsa-miR-22 in OS was significantly different to that
in the control, while the expression of target genes, MAOA, ESR1
and FOXP1, was not significantly different to that in the control;
and the expression of EGR1 changed while the expression of
hsa-miR-183 did not change. These results suggested that the mRNA
and miRNA relative levels between OS tissues and cell lines were a
little different. Another possible reason for this phenomenon was
that one single target mRNA can be regulated by several miRNAs.
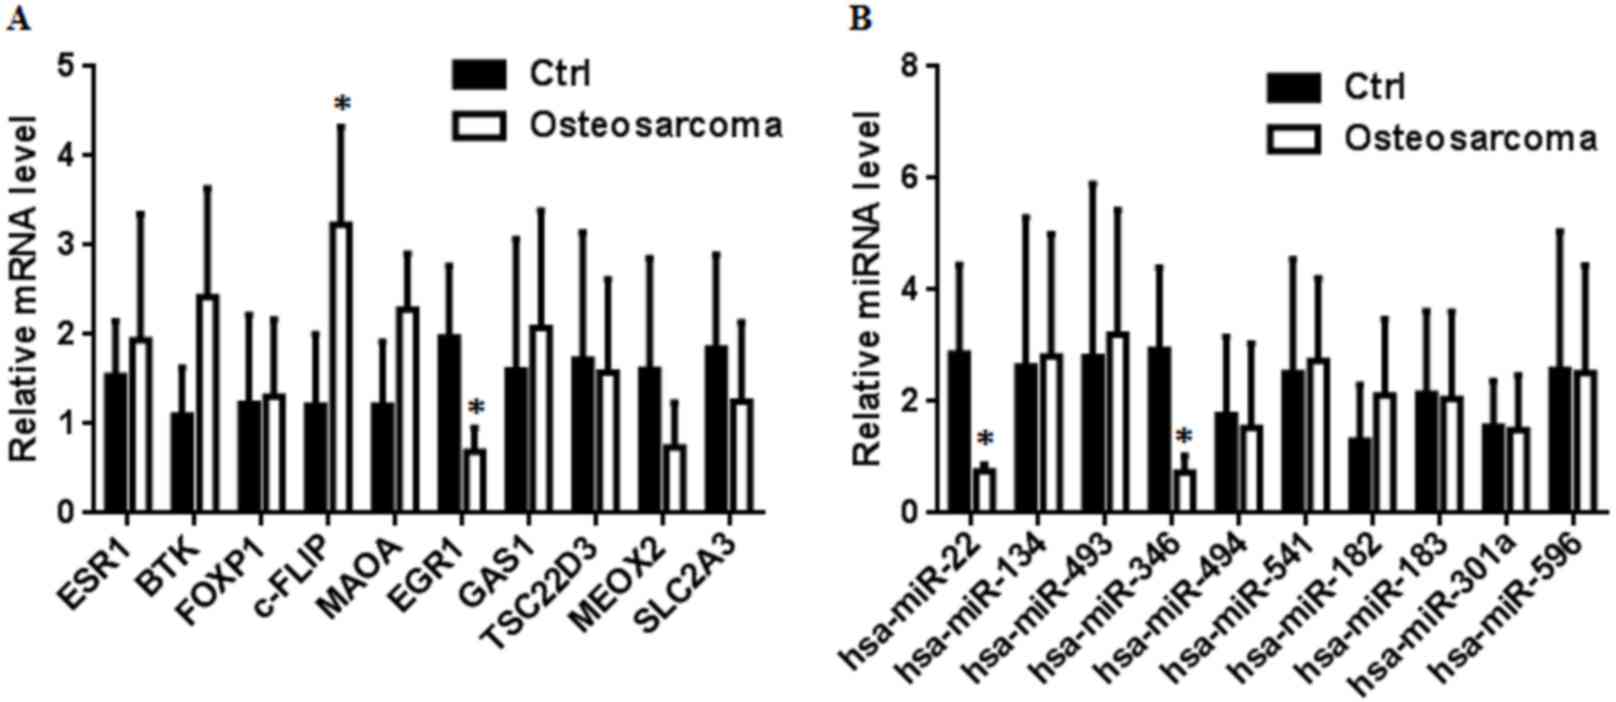 | Figure 2.Reverse transcription-quantitative
polymerase chain reaction validation of miRNAs-target genes. (A)
Relative mRNA expression of ESR1, BTK, FOXP1, c-FLIP, MAOA, EGR1,
GAS1, TSC22D3, MEOX2 and SLC2A3. The mRNA expression of c-FLIP was
upregulated in OS and the mRNA expression of EGR1 was downregulated
in OS. (B) Relative miRNA expression of hsa-miR-22, hsa-miR-134,
hsa-miR-493, hsa-miR-346, hsa-miR-494, hsa-miR-541, hsa-miR-182,
hsa-miR-183, hsa-miR-301a and hsa-miR-596, the miRNA expression of
hsa-miR-22 and hsa-miR-346 were downregulated in OS. *P<0.05 vs.
control. miRNA, microRNA; OS, osteosarcoma; ctrl, control. |
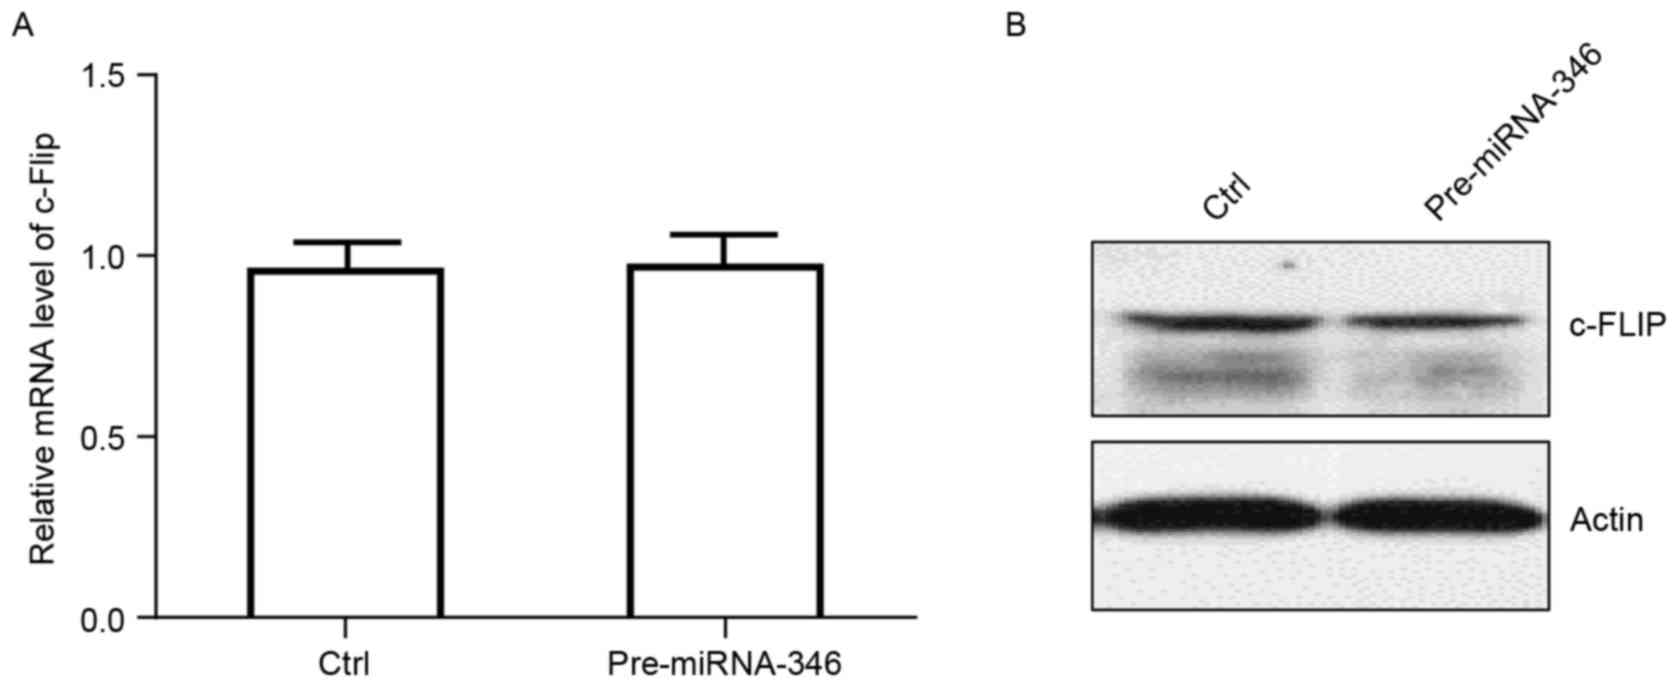
Validation of miRNA-346 and c-FLIP in
MG-63 cell lines
The association between miRNA-346 and c-FLIP was
verified in OS tissues obtained from 4 patients; however, the
association between miRNA-346 and c-FLIP requires further
investigation due to the limited number of OS tissues. Therefore,
the OS MG-63 cell line was used to verify the results.
Pre-miRNA-346 was used to produce mature miRNA-346. The mRNA
expression of c-FLIP did not differ significantly between control
and pre-miRNA-346 (Fig. 3). Western
blot analysis revealed that the protein content of c-FLIP was lower
in the pre-miRNA-346 than in the control (Fig. 3). These results indicated that
pre-miRNA-346 did not affect the mRNA level of c-FLIP, and that it
changed c-FLIP expression at the protein level.
Discussion
The development of suitable biomarkers is vital for
diagnosing cancer or predicting patient prognoses. miRNAs have
attracted a great deal of attention as they are highly stable and
may be a potential biomarker for tumors and other diseases
(22,23). The prognostic and diagnostic value of
miRNA expression in OS has been studied intensely in recent years
(24,25). However, due to the sample origin,
small sample size and application of different platforms, the miRNA
expression profiles have yielded inconsistent results (26). Therefore, it is necessary to
intersect the data to identify miRNAs that are significantly
associated with OS. The present study searched the GEO databases,
and only identified 4 mRNA expression profiling studies and 2 miRNA
expression profiling studies in the GEO database, while no data
associated with OS were identified in the TCGA database. In the
present study, 4 mRNA expression profiling studies and 2 miRNA
expression profiling studies obtained from the GEO database were
integrated and 15 differentially expressed miRNAs were identified.
In the miRNA-targets regulatory network, the top 5 upregulated and
top 10 downregulated miRNAs were identified. These 15
differentially expressed miRNAs may be associated with OS.
Compared with non-cancerous bone tissues, miR-22 was
downregulated in OS tissues. Patients with a lower miR-22
expression level exhibited a poorer overall survival and
disease-free survival (27).
Upregulation of miR-22 can cause DNA repair and impaired genomic
integrity by inhibiting MDC1 in OS cells (28). The present study confirmed the
downregulation of miR-22 in OS tissues. miR-22 may serve as a
promising biomarker for predicting the prognosis of OS. miR-346 has
been proven to be associated with numerous types of cancer. In the
tissues of patients with cancer, the expression of miR-346 is
upregulated and this is consistent with the results of the present
study, suggesting that this may be a target site for the OS
therapy.
miR-182 exhibits altered expression in various types
of cancer. miR-182 expression may have predictive value for
patients with cancer. In certain studies, miR-182 has been reported
to be downregulated in OS tissues and cell lines (29,30).
Overexpression of miR-182 inhibited tumor growth, migration and
invasion. However, in the present study, the expression of miR-182
was upregulated in OS tissues. This result is inconsistent with
those of previous studies, and may be caused by the small sample
size. Zhu et al (31)
revealed that the expression of miR-183 was significantly
downregulated in OS tissues and cells, and statistical analysis
demonstrated that the strong association between miR-183 expression
and pulmonary metastasis and local recurrence of OS. Therefore,
miR-183 serves an important role in the metastasis of OS.
The miR-301a serves an important role in various
biological and pathological processes, including inflammation,
cellular development and differentiation, apoptosis and cancer
(32–34). Upregulation of miR-301a contributed
toward chemoresistance of OS cells since miR-301a reduced
doxorubicin-induced cell apoptosis, whereas anti-miR-301a enhanced
apoptosis in OS cells (35).
Consistently, the results of the present study demonstrated that
miR-301a was upregulated in OS compared with the control. The
results of the present study suggested that miR-301a may be a
potential biomarker for OS.
In conclusion, in the regulatory network, hsa-miR-22
and hsa-miR-301a were inversely correlated with target genes ESR1
and MEOX2, respectively, and may be used as biomarkers for an
earlier diagnosis of OS.
Acknowledgements
The authors would like to thank Dr Cui for
assistance in performing the RT-qPCR and western blotting.
Funding
The present study was supported by the Hunan
Provincial Natural Science Foundation of China (Project number:
13jj3015).
Availability of data and materials
The datasets used and/or analyzed during the current
study are available from the corresponding author on reasonable
request.
Authors' contributions
CZ contributed to data analysis and the majority of
the experiments; JW contributed to the RT-qPCR assay; FL
contributed to the western blot assay; QL contributed to the data
analysis; and HH contributed to the project design.
Ethics approval and consent to
participate
The present study was approved by Ethics Committee
of Xiangya Hospital of Central South University (Changsha,
China).
Patient consent for publication
Consent for publication was obtained from all
patients.
Competing interests
The authors declare that they have no competing
interests.
References
|
1
|
Yang JY, Cheng FW, Wong KC, Lee V, Leung
WK, Shing MM, Kumta SM and Li CK: Initial presentation and
management of osteosarcoma, and its impact on disease outcome. Hong
Kong Med J. 15:434–439. 2009.PubMed/NCBI
|
|
2
|
Ottaviani G and Jaffe N: The epidemiology
of osteosarcoma. Cancer Treat Res. 152:3–13. 2009. View Article : Google Scholar : PubMed/NCBI
|
|
3
|
Liang W, Gao B, Fu P, Xu S, Qian Y and Fu
Q: The miRNAs in the pathgenesis of osteosarcoma. Front Biosci
(Landmark Ed). 18:788–794. 2013. View
Article : Google Scholar : PubMed/NCBI
|
|
4
|
Hu H, Zhang Y, Cai XH, Huang JF and Cai L:
Changes in microRNA expression in the MG-63 osteosarcoma cell line
compared with osteoblasts. Oncol Lett. 4:1037–1042. 2012.
View Article : Google Scholar : PubMed/NCBI
|
|
5
|
Ouyang L, Liu P, Yang S, Ye S, Xu W and
Liu X: A three-plasma miRNA signature serves as novel biomarkers
for osteosarcoma. Med Oncol. 30:3402013. View Article : Google Scholar : PubMed/NCBI
|
|
6
|
Sarver AL, Thayanithy V, Scott MC,
Cleton-Jansen AM, Hogendoorn PC, Modiano JF and Subramanian S:
MicroRNAs at the human 14q32 locus have prognostic significance in
osteosarcoma. Orphanet J Rare Dis. 8:72013. View Article : Google Scholar : PubMed/NCBI
|
|
7
|
Jianwei Z, Fan L, Xiancheng L, Enzhong B,
Shuai L and Can L: MicroRNA 181a improves proliferation and
invasion, suppresses apoptosis of osteosarcoma cell. Tumour Biol.
34:3331–3337. 2013. View Article : Google Scholar : PubMed/NCBI
|
|
8
|
Zhou G, Shi X, Zhang J, Wu S and Zhao J:
MicroRNAs in osteosarcoma: From biological players to clinical
contributors, a review. J Int Med Res. 41:1–12. 2013. View Article : Google Scholar : PubMed/NCBI
|
|
9
|
Ma W, Zhang X, Chai J, Chen P, Ren P and
Gong M: Circulating miR-148a is a significant diagnostic and
prognostic biomarker for patients with osteosarcoma. Tumour Biol.
35:12467–12472. 2014. View Article : Google Scholar : PubMed/NCBI
|
|
10
|
Pan W, Wang H, Jianwei R and Ye Z:
MicroRNA-27a promotes proliferation, migration and invasion by
targeting MAP2K4 in human osteosarcoma cells. Cell Physiol Biochem.
33:402–412. 2014. View Article : Google Scholar : PubMed/NCBI
|
|
11
|
Li E, Zhang J, Yuan T and Ma B: MiR-145
inhibits osteosarcoma cells proliferation and invasion by targeting
ROCK1. Tumour Biol. 35:7645–7650. 2014. View Article : Google Scholar : PubMed/NCBI
|
|
12
|
Xu JQ, Zhang WB, Wan R and Yang YQ:
MicroRNA-32 inhibits osteosarcoma cell proliferation and invasion
by targeting Sox9. Tumour Biol. 35:9847–9853. 2014. View Article : Google Scholar : PubMed/NCBI
|
|
13
|
Namløs HM, Meza-Zepeda LA, Baroy T,
Østensen IH, Kresse SH, Kuijjer ML, Serra M, Bürger H,
Cleton-Jansen AM and Myklebost O: Modulation of the osteosarcoma
expression phenotype by microRNAs. PLoS One. 7:e480862012.
View Article : Google Scholar : PubMed/NCBI
|
|
14
|
Gautier L, Cope L, Bolstad BM and Irizarry
RA: Affy-analysis of affymetrix genechip data at the probe level.
Bioinformatics. 20:307–315. 2004. View Article : Google Scholar : PubMed/NCBI
|
|
15
|
Huang DW, Sherman BT, Tan Q, Collins JR,
Alvord WG, Roayaei J, Stephens R, Baseler MW, Lane HC and Lempicki
RA: The DAVID gene functional classification tool: A novel
biological module-centric algorithm to functionally analyze large
gene lists. Genome Biol. 8:R1832007. View Article : Google Scholar : PubMed/NCBI
|
|
16
|
Livak KJ and Schmittgen TD: Analysis of
relative gene expression data using real-time quantitative PCR and
the 2(-Delta Delta C(T)) method. Methods. 25:402–408. 2001.
View Article : Google Scholar : PubMed/NCBI
|
|
17
|
Kawano M, Tanaka K, Itonaga I, Ikeda S,
Iwasaki T and Tsumura H: microRNA-93 promotes cell proliferation
via targeting of PTEN in Osteosarcoma cells. J Exp Clin Cancer Res.
5:762015. View Article : Google Scholar
|
|
18
|
Buddingh EP, Ruslan SEN, Reijnders CMA,
Szuhai K, Kuijjer ML, Roelofs H, Hogendoorn PCW, Maarten Egeler R,
Cleton-Jansen AM and Lankester AC: Mesenchymal stromal cells of
osteosarcoma patients do not show evidence of neoplastic changes
during long-term culture. Clin Sarcoma Res. 23:5–16. 2015.
|
|
19
|
Wang JY, Wu PK, Chen PC, Yen CC, Hung GY,
Chen CF, Hung SC, Tsai SF, Liu CL, Chen TH and Chen WM:
Manipulation therapy prior to diagnosis induced primary
osteosarcoma metastasis-from clinical to basic research. PLoS One.
7:e965712014. View Article : Google Scholar
|
|
20
|
Kresse SH, Rydbeck H, Skårn M, Namløs HM,
Barragan-Polania AH, Cleton-Jansen AM, Serra M, Liestøl K,
Hogendoorn PC, Hovig E, et al: Integrative analysis reveals
relationships of genetic and epigenetic alterations in
osteosarcoma. PLoS One. 7:e482622012. View Article : Google Scholar : PubMed/NCBI
|
|
21
|
Wang H, Tang M, Ou L, Hou M, Feng T, Huang
YE, Jin Y, Zhang H and Zuo G: Biological analysis of cancer
specific microRNAs on function modeling in osteosarcoma. Sci Rep.
7:53822017. View Article : Google Scholar : PubMed/NCBI
|
|
22
|
Grimaldi A, Zarone MR, Irace C, Zappavigna
S, Lombardi A, Kawasaki H, Caraglia M and Misso G: Non-coding RNAs
as a new dawn in tumor diagnosis. Semin Cell Dev Biol. 78:37–50.
2018. View Article : Google Scholar : PubMed/NCBI
|
|
23
|
Liu X, Liu X, Wu Y, Wu Q, Wang Q, Yang Z
and Li L: MicroRNAs in biofluids are novel tools for bladder cancer
screening. Oncotarget. 8:32370–32379. 2017.PubMed/NCBI
|
|
24
|
Hutanu D, Popescu R, Stefanescu H, Pirtea
L, Candea A, Sarau C, Boruga O, Mehdi L, Ciuca I and Tanasescu S:
The molecular genetic expression as a novel biomarker in the
evaluation and monitoring of patients with osteosarcoma-subtype
bone cancer disease. Biochem Genet. 55:291–299. 2017. View Article : Google Scholar : PubMed/NCBI
|
|
25
|
Smolle MA, Leithner A, Posch F, Szkandera
J, Liegl-Atzwanger B and Pichler M: MicroRNAs in different
histologies of soft tissue sarcoma: A comprehensive review. Int J
Mol Sci. 18(pii): E19602017. View Article : Google Scholar : PubMed/NCBI
|
|
26
|
Sampson VB, Yoo S, Kumar A, Vetter NS and
Kolb EA: MicroRNAs and potential targets in osteosarcoma: Review.
Front Pediatr. 3:692015. View Article : Google Scholar : PubMed/NCBI
|
|
27
|
Wang G, Shen N, Cheng L, Lin J and Li K:
Downregulation of miR-22 acts as an unfavorable prognostic
biomarker in osteosarcoma. Tumour Biol. 36:7891–7895. 2015.
View Article : Google Scholar : PubMed/NCBI
|
|
28
|
Lee JH, Park SJ, Jeong SY, Kim MJ, Jun S,
Lee HS, Chang IY, Lim SC, Yoon SP, Yong J and You HJ: MicroRNA-22
suppresses DNA repair and promotes genomic instability through
targeting of MDC1. Cancer Res. 75:1298–1310. 2015. View Article : Google Scholar : PubMed/NCBI
|
|
29
|
Hu J, Lv G, Zhou S, Zhou Y, Nie B, Duan H,
Zhang Y and Yuan X: The downregulation of MiR-182 is associated
with the growth and invasion of osteosarcoma cells through the
regulation of TIAM1 expression. PLoS One. 10:e01211752015.
View Article : Google Scholar : PubMed/NCBI
|
|
30
|
Liu Y, Li Y, Liu J, Wu Y and Zhu Q:
MicroRNA-132 inhibits cell growth and metastasis in osteosarcoma
cell lines possibly by targeting Sox4. Int J Oncol. 47:1672–1684.
2015. View Article : Google Scholar : PubMed/NCBI
|
|
31
|
Zhu J, Feng Y, Ke Z, Yang Z, Zhou J, Huang
X and Wang L: Down-regulation of miR-183 promotes migration and
invasion of osteosarcoma by targeting Ezrin. Am J Pathol.
180:2440–2451. 2012. View Article : Google Scholar : PubMed/NCBI
|
|
32
|
Ma F, Zhang J, Zhong L, Wang L, Liu Y,
Wang Y, Peng L and Guo B: Upregulated microRNA-301a in breast
cancer promotes tumor metastasis by targeting PTEN and activating
Wnt/β-catenin signaling. Gene. 535:191–197. 2014. View Article : Google Scholar : PubMed/NCBI
|
|
33
|
Wang M, Li C, Yu B, Su L, Li J, Ju J, Yu
Y, Gu Q, Zhu Z and Liu B: Overexpressed miR-301a promotes cell
proliferation and invasion by targeting RUNX3 in gastric cancer. J
Gastroenterol. 48:1023–1033. 2013. View Article : Google Scholar : PubMed/NCBI
|
|
34
|
Lee YH, Na HS, Jeong SY, Jeong SH, Park HR
and Chung J: Comparison of inflammatory microRNA expression in
healthy and periodontitis tissues. Biocell. 35:43–49.
2011.PubMed/NCBI
|
|
35
|
Zhang Y, Duan G and Feng S: MicroRNA-301a
modulates doxorubicin resistance in osteosarcoma cells by targeting
AMP-activated protein kinase alpha 1. Biochem Biophys Res Commun.
459:367–373. 2015. View Article : Google Scholar : PubMed/NCBI
|