Introduction
Glioma is the most common primary tumor of the
central nervous system (CNS) (1). It
was reported in 2014 that glioma accounts for ~30% of all CNS
tumors and ~80% of all malignant cerebral tumors (2). A study from the Central Brain Tumor
Registry of the United States also reported that the 5-year
survival rate of patients with glioma in the United States between
2006 and 2010 was ~33.8% (3).
According to the 2016 World Health Organization (WHO)
classification of CNS tumors, glial tumors are divided into four
distinct grades (I–IV) based on the histopathological and molecular
features. Grades I and II are classified as low, whereas grades III
and IV represent the high grades (4), which are associated with a more
aggressive tumor and poorer prognosis.
It has been demonstrated that glioma cell
invasiveness and tumor malignancy are positively correlated
(2,5). In addition, a number of genes, such as
matrix metalloproteinases (MMPs) are involved in the regulation of
tumor cell proliferation, migration, invasion, metastasis,
peritumoral angiogenesis and regulation of intercellular adhesion,
which are crucial for the malignancy of tumors (6,7). MMPs
are zinc-dependent proteases that promote extracellular matrix
remodeling and degradation, and serve key roles in the signal
transduction required for cancer metastasis (8,9). These
proteins are released from tumor cells and surrounding matrix, and
lead to the degradation of extracellular matrix and basement
membrane, which therefore promotes tumor cell invasion (10). In addition, it has been reported that
MMP-2 is overexpressed in glioma cells and is associated with tumor
invasion and angiogenesis (11–13).
Ephrin (Eph) kinases comprise the largest subfamily
of the receptor tyrosine kinase (RTK) superfamily and serve a key
role in regulating crucial cellular signaling pathways, including
those in cell proliferation, migration and differentiation
(14–16). Eph type-A receptor 2 (EphA2) kinase
is one of the most common Eph kinases and is associated with the
development of various types of cancer (17–19).
Non-phosphorylated EphA2 is overexpressed in certain human
epithelial malignancies, such as prostate epithelial cells, where
it is directly associated with tumor cell invasiveness (20,21).
Furthermore, it was reported that the PI3K/Akt signaling pathway is
associated with malignant glioma progression, whereas PI3K/Akt
activation leads to EphA2 phosphorylation, which ultimately
promotes glioma cell migration and invasion (22). EphA2 is also directly associated with
accelerated angiogenesis (23) and
neovascularization (24).
Magnetic resonance imaging (MRI) is a valuable
imaging technology that presents the advantages of being a
non-traumatic multi-plane imaging technique with non-ionizing
radiation (25). These
characteristics allow this technique to be one of the most powerful
tools for the diagnosis of CNS diseases. MRI scanners use strong
magnetic fields, magnetic field gradients and radio waves to
generate images of various parts of the body (26). MRI offers the unique advantage over
computed tomography (CT) of allowing neurological lesion detection.
This tool is characterized by a high degree of soft tissue
resolution; it can detect changes in water content of tissue
components with high sensitivity and can present vascular
structures without using contrast agents (27). At present, enhanced MRI is widely
used in the evaluation of glioma (28), assisting in determining glioma grade
status (29). The present study
aimed to determine the association between MMP-2 and EphA2
expression and MRI parameters and the pathological grade of glioma,
in order to facilitate the clinical evaluation, treatment
decision-making and prognosis of glioma. The results demonstrated
that MMP-2 and EphA2 expression levels were associated with glioma
invasiveness. In addition, the correlation between expression
levels of these proteins and the MRI parameters edema index (EI),
enhancement percentage (EP) and maximum tumor diameter was
investigated, indicating that the combined evaluation of MRI and
MMP-2 and EphA2 expression levels may be used for tumor malignancy
assessment and aid the clinical diagnosis and treatment.
Materials and methods
Patients
The present study included 43 patients with cerebral
glioma (27 men and 16 women, aged 18–65 years, (50.8±14.2) treated
at the Department of Neurosurgery of the Luoyang Central Hospital
(Luoyang, China) between November 2016 and December 2017. Patients
were divided into low-grade (grades I and II; n=21) and high-grade
(grades III and IV; n=22) groups, according to the diagnostic
criteria of gliomas from the 2016 WHO classification of CNS tumors
(4). Karnofsky performance status
(KPS) score was also performed for all patients. KPS score is a
performance status scale classifying patients into one out of 10
categories (Table I), ranging
between 0: Diseased and 100: Normal, no complaints, no evidence of
disease (30,31). The study protocol was approved by the
Ethics Committee of the Luoyang Central Hospital and written
informed consent was provided by all patients prior to
enrollment.
 | Table I.Definition of Karnofsky performance
status. |
Table I.
Definition of Karnofsky performance
status.
| Karnofsky
performance status | Definition |
|---|
| 0 | Deceased |
| 10 | Moribund; fatal
processes progressing rapidly |
| 20 | Very sick;
hospitalization necessary; active support treatment is
necessary |
| 30 | Severely disabled;
hospitalization is indicated, although death not imminent |
| 40 | Disabled; requires
special care and assistance |
| 50 | Require
considerable assistance and frequent medical care |
| 60 | Require occasional
assistance, but is able to care for most personal needs |
| 70 | Cares for self;
unable to carry on normal activity or do active work |
| 80 | Normal activity
with effort; some sign or symptoms of disease |
| 90 | Able to carry on
normal activity; minor signs or symptoms of disease |
| 100 | Normal; no
complaints; no evidence of disease |
Immunohistochemistry (IHC)
Fresh tumor specimens were obtained during tumor
resection surgery and fixed with 10% formalin solution in 4°C for
2–3 weeks. Tumor tissues were embedded in paraffin, cut into 10-µm
serial sections and placed onto glass slides. Before staining,
sections were deparaffinized with xylene, 5 min for three times.
Then, sections were rehydrated in descending alcohol series (95,
90, 80 and 70%) and antigen retrieval was performed by saline
sodium citrate (heated in microwave oven for 30 min). One slide was
routinely stained with hematoxylin and eosin in 25°C for 1–5 min.
After blocking in BSA solution 37°C for 30 min (cat. no. P0260;
Beyotime Institute of Biotechnology), the other slide was used for
IHC staining using mouse anti-human MMP-2 and mouse anti-human
EphA2 (Boster cat. no. M00286 and BM0833, both 1:200) monoclonal
antibodies detected by streptavidin-peroxidase or
3′-diaminobenzidine visualization kits (OriGene Technologies,
Inc.). The distribution, intensity and location of positively
stained cells were assessed. Sections incubated with PBS instead of
primary antibody were used as negative controls. IHC staining
results were examined by light microscopy (magnification ×400;
Olympus Corporation) and the Image-Pro Plus 6.0 software (Media
Cybernetics, Inc.) was used to analyze the percentage of positive
cells in each group.
MRI scanning
MRI scans were performed with a Philips Gyroscan
Intera 1.5T superconductor MRI scanner (Philips Medical Systems,
Inc.). A standard quadrature head coil was used. Spin-echo
sequences of MRI scans were included in the axial and sagittal
T1-weighted images (T1WIs) and axial T2-weighted images (T2WIs).
The contrast agent gadolinium (Gd)-DAPA was administered by fast
injection (1–2 min for completion) at the dose of 0.1 mM/kg in the
elbow vein to enhance axial and sagittal T1WI scans. The capture
settings were as follows: i) TlWI, repetition time (TR)/time to
echo (TE), 431/11 msec; ii) T2WI, TR/TE 4850/120 msec; iii)
field-of-view, 24×24 cm; iv) matrix, 256×256; v) number of
excitations, 2; vi) band width, 12.5 kHz; vii) slice thickness, 5
mm; and viii) interval, 1 mm. The enhanced scan parameters were
identical to those of T1WI.
MRI detection for intracranial EI
The edge clarity and uniformity of tumor signals
were evaluated by two experienced radiologists. The maximum
diameters of the tumor (vertical and coronal or sagittal) were
measured on the T1WI enhanced image. The volume of the tumor was
estimated by multiplying the vertical diameter with the coronal and
sagittal diameters. The same method was used to measure the total
volume occupied by the tumor on T2WI images. The volume of the
edema was estimated by removing the tumor volume from the total
volume, whereas EI was estimated as follows: EI=edema volume/tumor
volume.
MRI detection of intracranial lesion
EP
The largest tumor area was selected from T1WIs and
the tumor signal intensity was determined by separate non-enhanced
and enhanced scans. The EP was estimated as follows:
EP=[(difference between non-enhanced and enhanced scan signal
intensity)/(non-enhanced scan signal intensity) ×100%].
Quantitative image analysis
For statistical analysis of IHC staining, positively
stained cells were counted in each sample in five randomly selected
fields (magnification, ×20). The Image-Pro Plus software V6.0 was
used to quantify the optical density value of immunostaining.
Statistical analysis
Data are expressed as the mean ± standard deviation.
Statistical analyses were carried out using SPSS 19.0 software (IBM
Corp.). Comparisons of parameters among different groups were
performed using Student's t-test, Pearson's χ2 test or
Fisher's exact test. Correlation analysis was performed using the
Pearson's correlation method. P<0.05 was considered to indicate
a statistically significant difference.
Results
Demographic characteristics
The demographic characteristics of the patients with
glioma are presented in Table II.
Patients with low- (n=21) and high-grade glioma (n=22) were
included. The mean ages of the low- and high-grade groups were
49.3±13.2 and 52.1±13.9 years, respectively, and the mean body mass
indexes (BMIs) were 23.7±3.1 and 21.8±3.8 kg/m2,
respectively. No significant difference was observed between the
two groups regarding these parameters (both P>0.05).
Furthermore, the sex distribution revealed no significance. The
functional status of the patient was scored and results indicated a
KPS score of 80.4±21.6 and 58.9±18.8 for the low-grade and
high-grade groups, respectively, and the difference was
statistically significant (P<0.01).
| Table II.Demographic characteristics of
patients with glioma. |
Table II.
Demographic characteristics of
patients with glioma.
| Category | Low glioma
grade | High glioma
grade |
|---|
| Total cases, n | 21 | 22 |
| Sex, n |
|
|
|
Male | 14 | 13 |
|
Female | 7 | 9 |
| Age, years | 49.3±13.2 | 52.1±13.9 |
| BMI,
kg/m2 | 23.7±3.1 | 21.8±3.8 |
| KPS score | 80.4±21.6 |
58.9±18.8a |
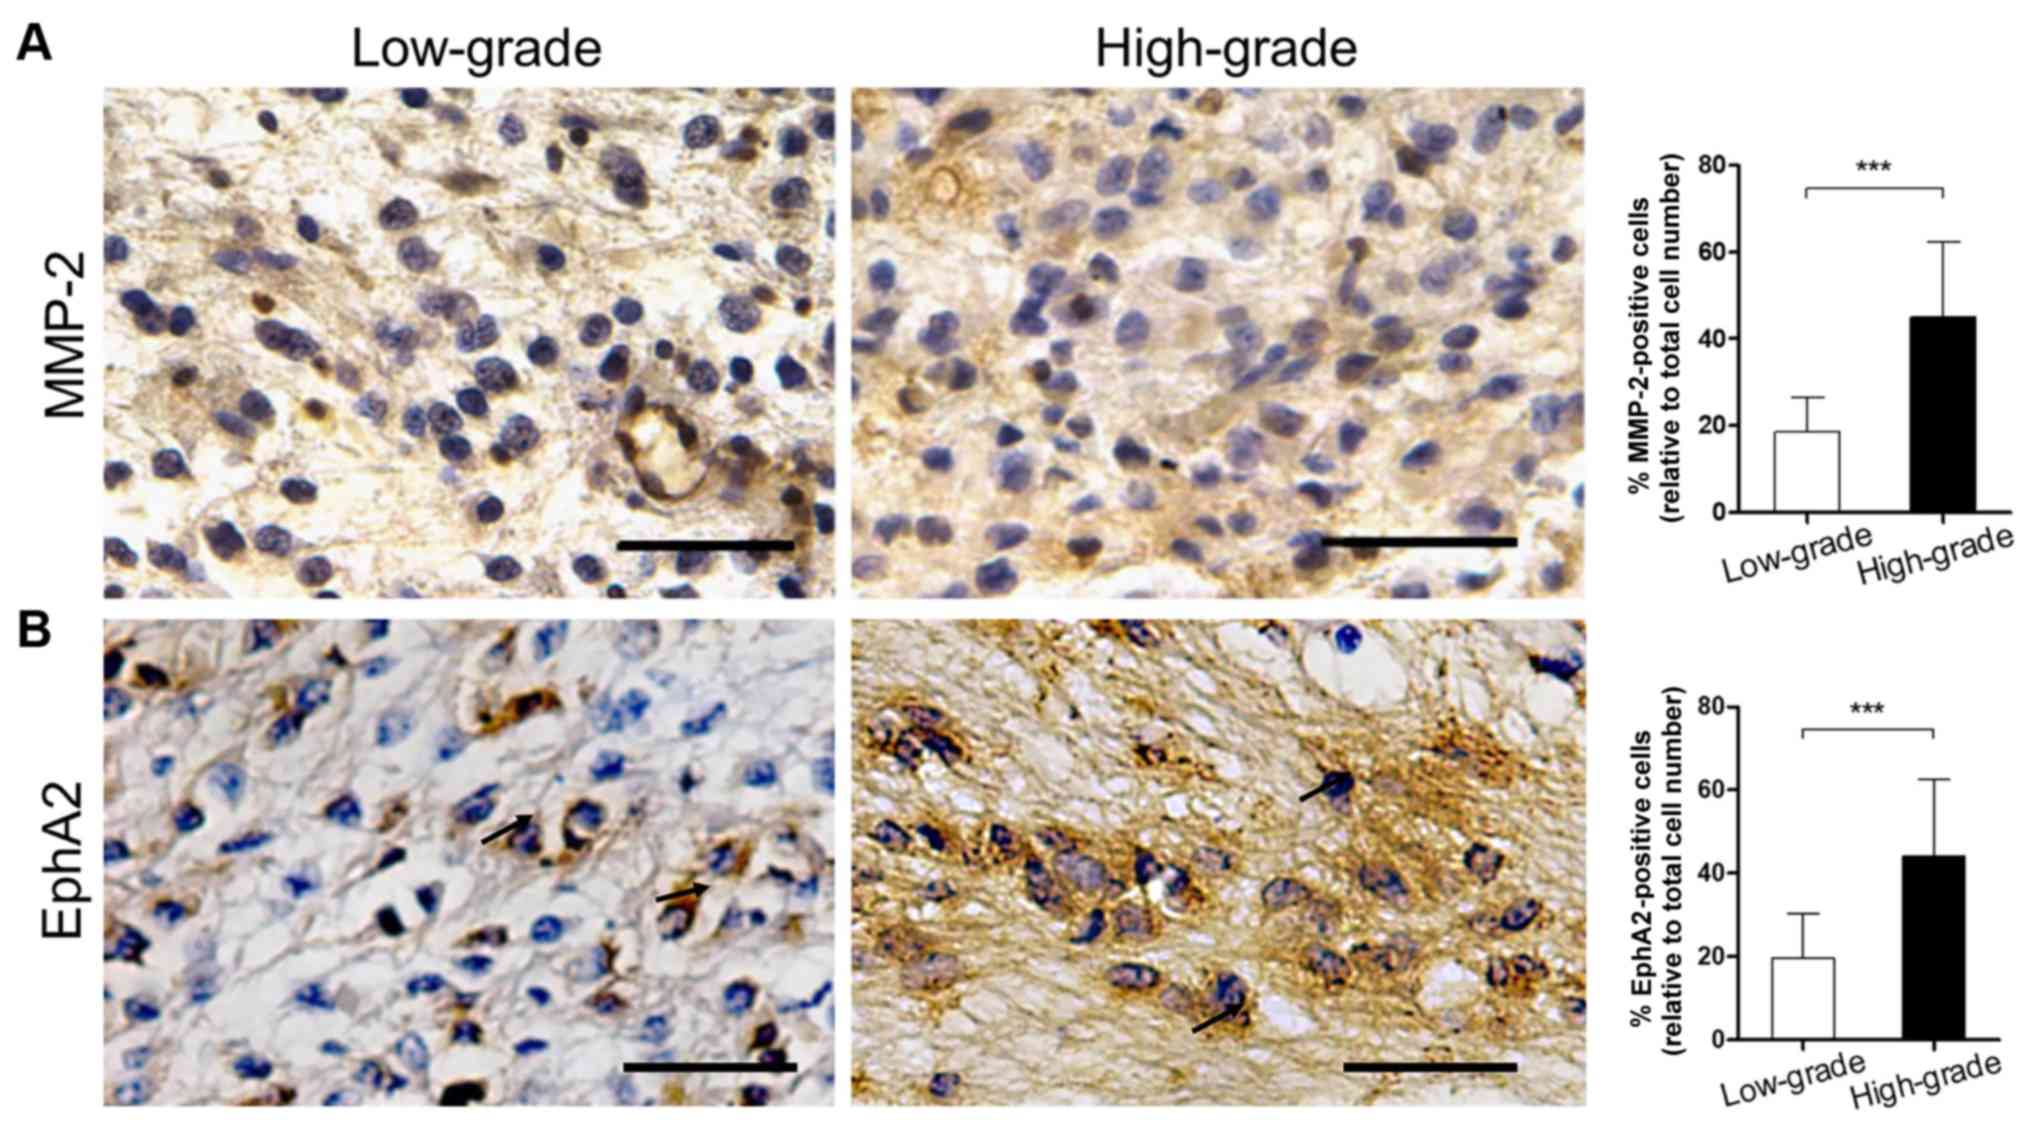
Expression levels of MMP-2 and EphA2
in glioma tissue sections
IHC staining was used to detect the expression
levels of MMP-2 and EphA2 in the low- and high-grade glioma tissue
sections. The results are listed in Table III. Positive staining for MMP-2 was
observed in the cytoplasm of glioma, vascular endothelial and basal
membrane cells. Furthermore, the percentage of MMP-2-positive
patients in the high-grade group reached 86.36% (19/22), which was
higher than in the low-grade group (57.14%, 12/21). This difference
was statistically significant (P<0.05). In addition, the
proportion of MMP-2-positive cells in the high-grade specimens was
significantly higher than in the low-grade tissues (Fig. 1A; 18.52±7.88 vs. 45.05±17.29%;
P<0.001).
| Table III.Expression of MMP-2 and EphA2 in
cerebral glioma samples, according to the pathological grade of the
tumor. |
Table III.
Expression of MMP-2 and EphA2 in
cerebral glioma samples, according to the pathological grade of the
tumor.
|
| Glioma grade |
|
|
|---|
|
|
|
|
|
|---|
| Category | Low (n=21) | High (n=22) | χ2 | P-value |
|---|
| MMP-2 |
|
| 4.38 | <0.05 |
|
Positive | 12 | 19 |
|
|
|
Negative | 9 | 3 |
|
|
| EphA2 |
|
| 28.56 | <0.01 |
|
Positive | 1 | 20 |
|
|
|
Negative | 20 | 2 |
|
|
The expression levels of EphA2 were examined in
glioma cells and in the necrotic and perivascular areas. The
percentage of EphA2-positive patients in the high-grade group was
90.91% (20/22), which was significantly higher than in the
low-grade group (4.76%, 1/21; P<0.01). In addition, the
proportion of EphA2-positive cells in the high-grade group was
significantly higher than in the low-grade group (Fig. 1B; 19.57±10.70 vs. 44.09±18.50%;
P<0.001).
MRI results of different grades of
glioma
The MRI scans of low-grade gliomas indicated that
the majority of the non-enhanced scan images (T1WIs) presented
uniform and/or low signals and that only a limited number of
signals were mixed. High or slightly higher signals were displayed
in T2WIs and the majority of the signals were uniform and well
defined. The enhanced scan revealed no enhancement or slight
enhancement, and only one case of bleeding was noted. MRI scans of
high-grade gliomas indicated that the majority of the non-enhanced
scan images (T1WIs) exhibited low or equal mixed signals, whereas a
limited number of signals were low, equal and high mixed. A uniform
signal with a high degree of mixing was displayed in T2WIs, with a
clear boundary. Enhanced scanning indicated significant uneven
enhancement with necrosis and hemorrhage.
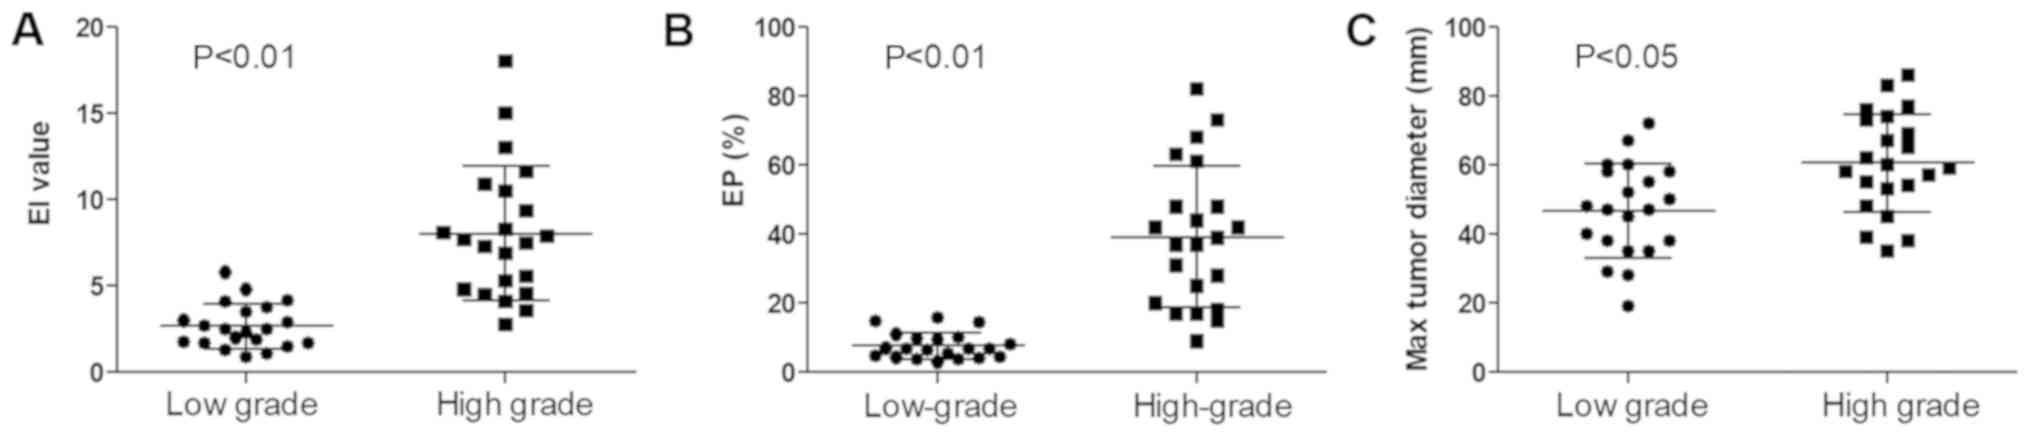
The EI around the tumor was significantly higher in
the high-grade group than in the low-grade group (Fig. 2A; 7.29±4.38 vs. 2.33±1.53;
P<0.01). The EP was also significantly higher in the high-grade
group than in the low-grade group (Fig.
2B; 39.27±19.94 vs. 6.88±4.65%; P<0.01). The maximum tumor
diameter exhibited a similar trend (Fig.
2C; 60.59±13.99 vs. 46.71±13.23 mm; P<0.05).
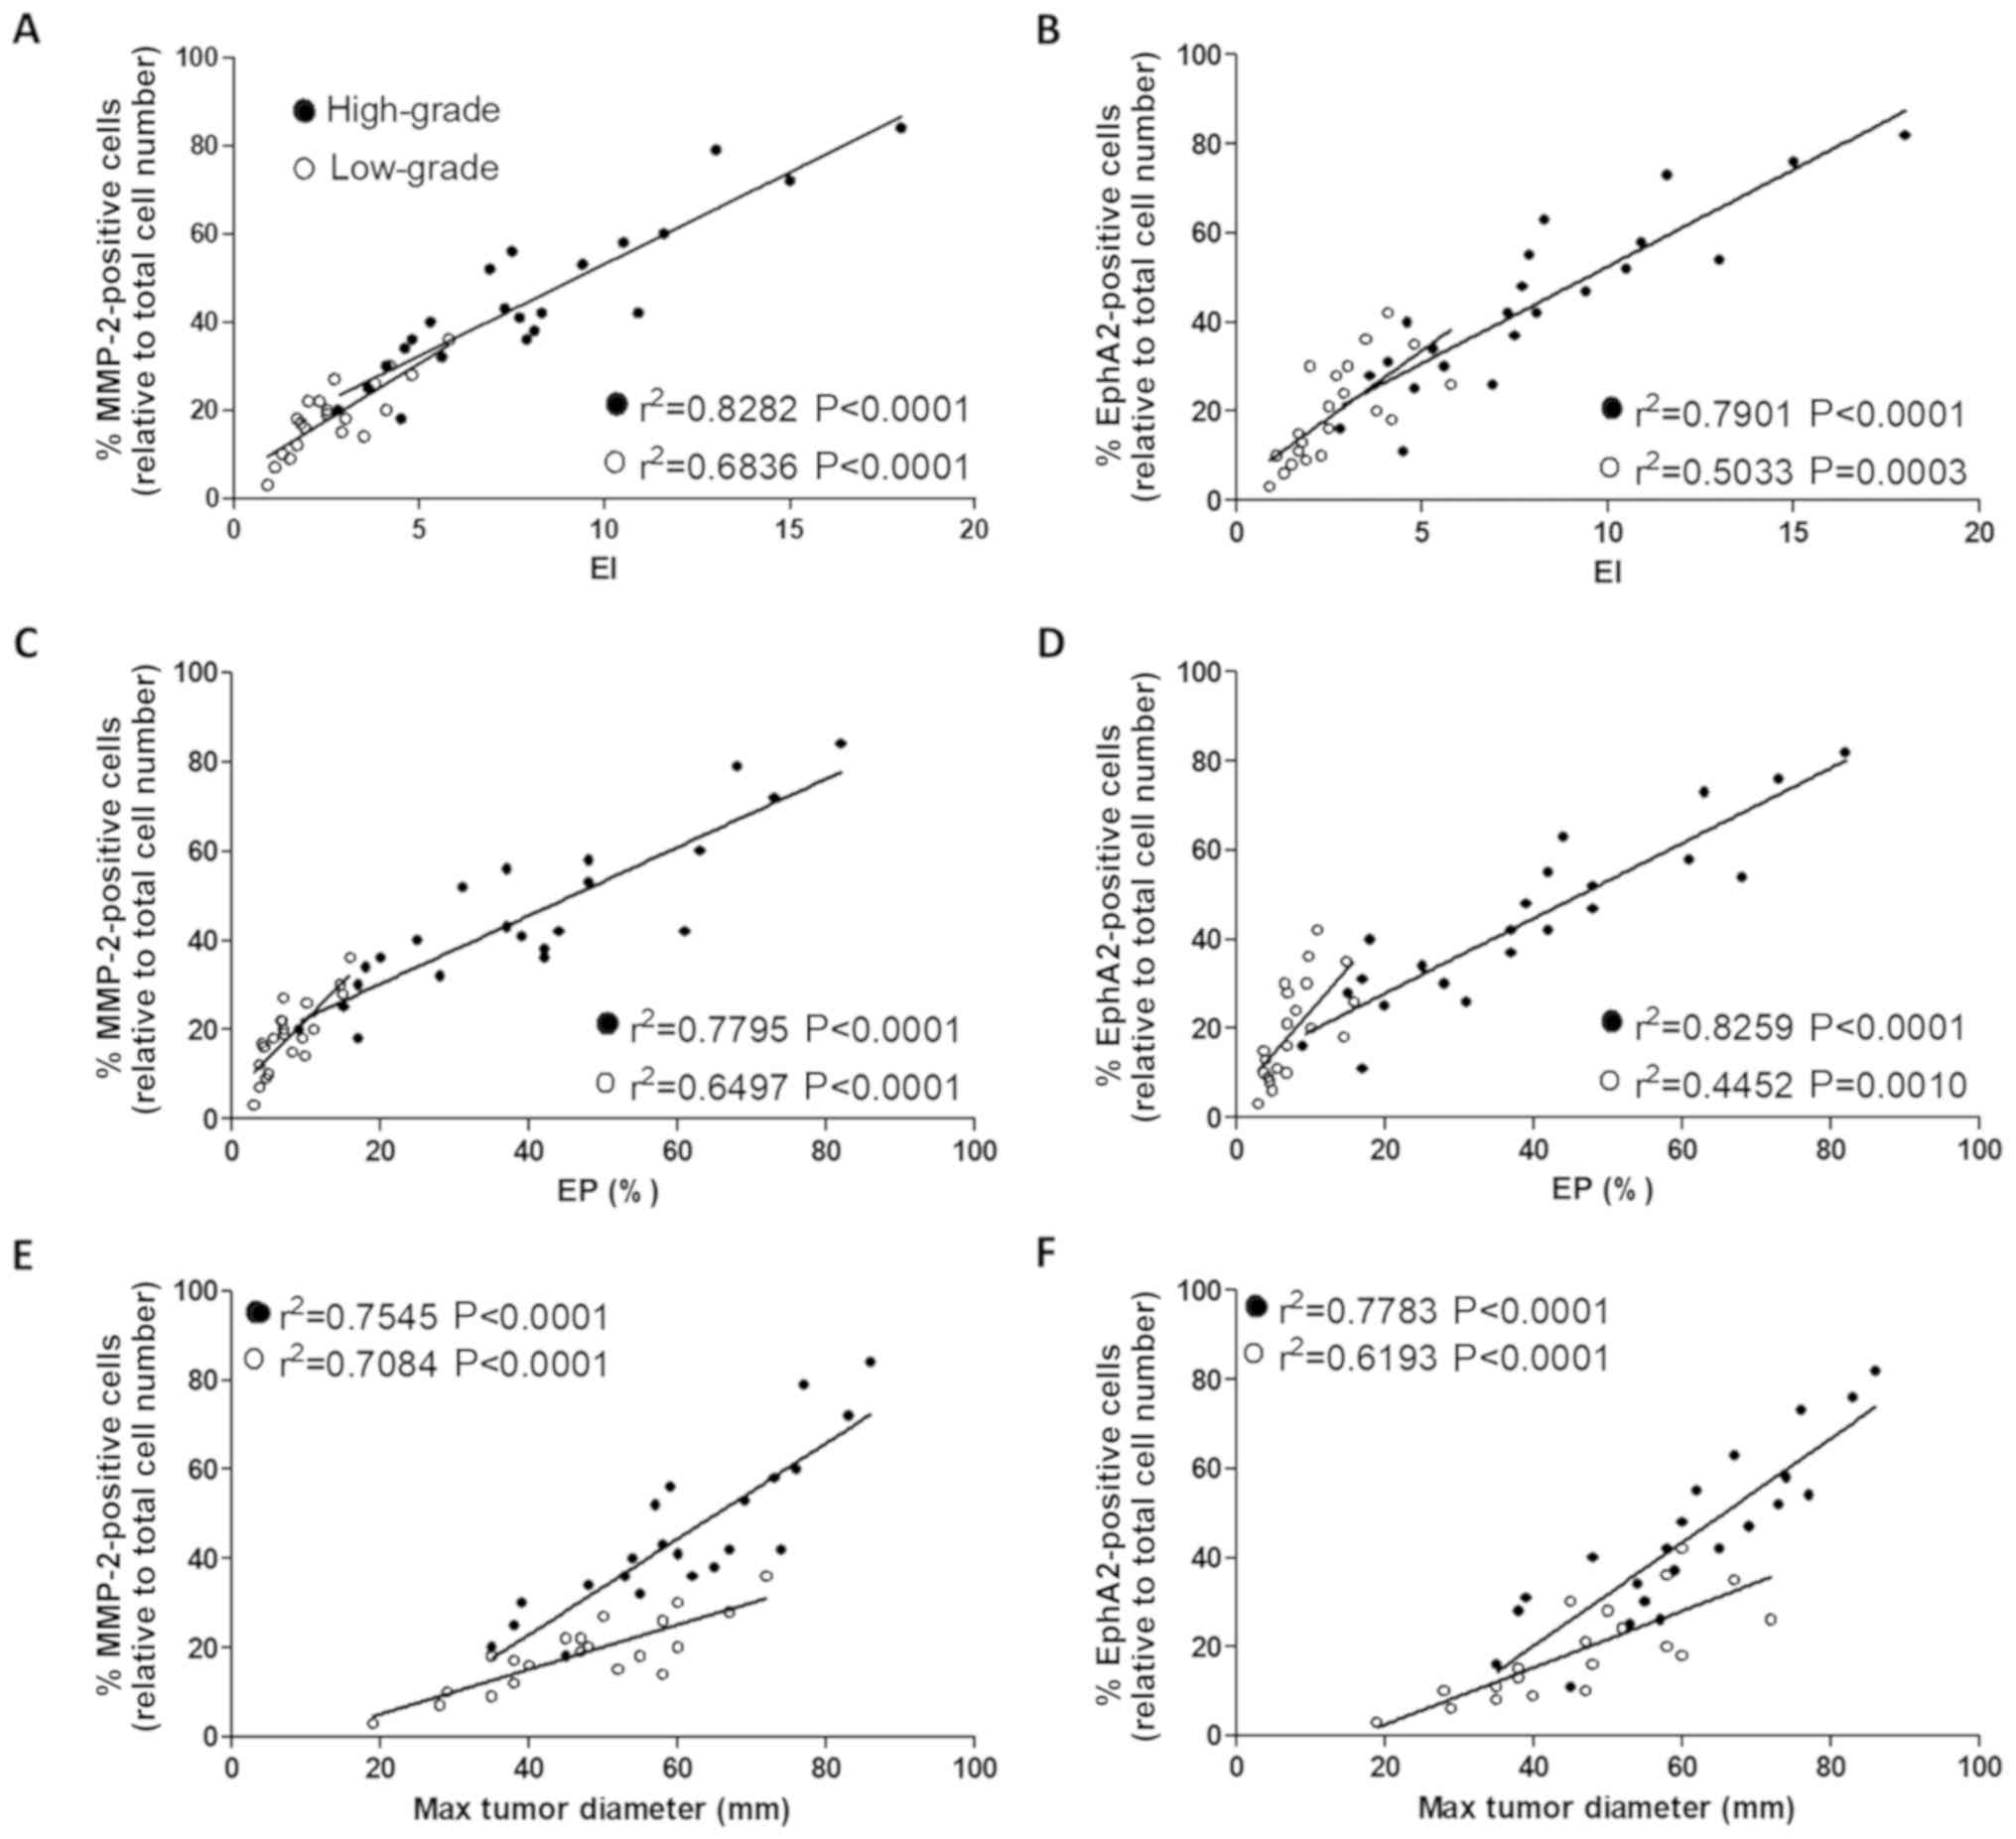
Correlation between the expression
levels of MMP-2 and EphA2 in glioma samples and the MRI
results
In order to investigate the association between
MMP-2 and EphA2 expression and the MRI parameters, Pearson's
correlation analysis was performed. The results indicated that the
expression level of MMP-2 was positively correlated with the EI, EP
and maximum tumor diameter in the low- and high-grade groups
(Fig. 3A, C and E, respectively; all
P<0.001). Furthermore, the expression level of EphA2 was also
positively correlated with all three MRI parameters (Fig. 3B, D and F; all P<0.01); in the
high-grade group.
Discussion
A previous study demonstrated that tumor matrix
destruction and neovascularization are key factors for tumor cell
migration and invasion (32). The
MMP-2 protein can degrade the extracellular matrix, causing damage
to the tumor vascular endothelial barrier and increasing vascular
permeability. This process provides a matrix and space allowing the
neovascularization of glioma, which accelerates tumor growth and
invasion (33,34). Furthermore, it was reported that
β-catenin downregulation in glioma cells directly reduces the
expression levels of epidermal growth factor receptor and MMP-2,
which results in a decrease in glioma invasiveness (35). These findings suggest that MMP-2 is
involved in tumor cell invasion. In addition, it has been
demonstrated that MMP-2 expression is associated with the malignant
progression of human glioma in vivo (36). RTK signaling pathways serve a crucial
role in tumor cell proliferation and migration (14). The Eph kinases represent the largest
subfamily of the RTK superfamily (14). Among the distinct subtypes of the Eph
kinases, EphA2 kinase is the most common subtype in human cancer
types and is overexpressed in various types of human malignancy,
including glioblastoma (37). Miao
et al (19) reported that Akt
could promote EphA2 kinase-induced migration and invasion of glioma
cells through phosphorylation of EphA2 serine residues. This
protein is therefore considered a key factor in the regulation of
malignant tumor progression (20).
The present study demonstrated that the number of MMP-2- and
EphA2-positive cells in the high-grade glioma tissues was
significantly higher than in the low-grade tissues, which was
consistent with previous studies (13,19). In
addition, the present findings demonstrated that the expression
levels of MMP-2 and EphA2 were significantly associated with the
progression of glioma, and that they may serve as potential targets
for the evaluation of glioma progression.
Glioma is the most common tumor of the CNS. The
accurate diagnosis and classification of glioma is crucial for the
development of effective treatment methods and outcome improvement.
At present, the gold standard for the diagnosis of glioma relies on
the pathological examination of tumor tissue excised surgically;
however, the disadvantages of this method are that it may induce
sampling errors and its invasiveness may cause injury. Preoperative
diagnosis and evaluation depend mainly on imaging examination
(29,38). Furthermore, novel treatments,
including antiangiogenic drugs and image-guided surgery, rely on
high-quality imaging during treatment plan evaluation and
post-treatment follow-up. CT and MRI are frequently used imaging
methods in the clinical setting (39). MRI is characterized by a higher soft
tissue resolution compared with CT, and can detect changes in the
water content of the tissue components with higher sensitivity. MRI
is therefore more effective in identifying early lesions (27). In addition, MRI provides abundant
imaging information for the identification of certain lesions due
to its ability to conduct multiple sequence imaging and to produce
multiple image types (26,27). This technique is considered as the
gold standard for glioma imaging diagnosis. This method facilitates
the precise identification of tumor size and location and the image
contrast is improved when paramagnetic contrast agents, including
Gd-DAPA for T1WI, are used (40,41). MRI
can therefore detect and diagnose malignant tumors more accurately,
and allow timely evaluation of the relevant treatment effect. At
present, enhanced MRI is widely used in the diagnosis of various
types of tumors, including liver cancer, cholangiocarcinoma and
glioma (42–44). In addition to conventional and
enhanced MRI, specific MRI scanning techniques, namely magnetic
resonance perfusion-weighted imaging (45,46) and
positron emission tomography/MRI (47) are also used for tumor diagnosis.
It has been demonstrated that tumor necrosis,
irregular margins and peritumoral edema are the most significant
indicators of tumor grade (48–50). The
MRI findings of glioma included typical alterations of MRI
characteristics with aggressive tumor progression, and an increase
in pathological grade (29). The
tumor volume gradually increases and its size became irregular,
resulting in an expanding area of peritumoral edema (50). Furthermore, the use of Gd contrast
agents significantly enhances tumor detection in the T1WI phase
(51), which is associated with
neovascularization extent. These indicators may be used to
establish the degree of glioma malignancy and provide an important
reference for the determination of treatment schedule and glioma
prognosis. The results from the present study demonstrated that the
EI, EP and maximum tumor diameter were significantly increased in
the high-grade glioma group compared with the low-grade glioma
group. These data suggest that MRI diagnosis may contribute to the
determination of the degree of malignancy in human glioma.
The correlation between MMP-2 and EPhA2 positivity
in tumor tissue and MRI parameters was further investigated. The
results revealed that the percentage of MMP-2- and EPhA2-positive
cells was positively correlated with the EI, EP and maximum tumor
diameter. In addition, high-grade glioma exhibited a stronger
correlation with MMP-2 and EphA2 positivity compared with low-grade
glioma, which suggests that MMP-2 and EphA2 expression levels may
gradually increase with the disease progression. These results were
consistent with the changes observed following histological
examination. The increase in tumor diameter, EI and EP reflected
the changes in the tumor anatomy. The expression levels of MMP-2
and EPhA2 may therefore represent a novel approach to evaluate the
glioma malignancy grade. The combination of MMP-2 and EPhA2
expression levels and MRI findings may be of clinical value in the
diagnosis, grade classification and prognosis of glioma.
In summary, the expression levels of MMP-2 and EphA2
in glioma tissues combined with EI, EP and tumor size assessed
following MRI examination may be considered as valuable indicators
to evaluate the degree of glioma malignancy. This combined
examination method may be more reliable than each technique
individually in the early diagnosis and prognosis of glioma, and in
the selection of the appropriate therapeutic methods.
Acknowledgements
Not applicable.
Funding
No funding was received.
Availability of data and materials
All data generated or analyzed during this study are
included in this published article.
Authors' contributions
FS performed the experiment, analyzed the data and
drafted the manuscript. BZ and FL assisted in the collection of
patient's samples and analyzed the data. ZD designed the present
study and revised the manuscript. All authors read and approved the
final manuscript.
Ethics approval and consent to
participate
The present study was approved by the Ethics
Committee of Luoyang Central Hospital (Luoyang, China; approval no.
2016100801), and written informed consent was provided by all
patients prior to enrollment.
Patient consent for publication
Written informed consent was obtained from all
patients in advance for the publication of this study.
Competing interests
The authors declare that they have no competing
interest.
Glossary
Abbreviations
Abbreviations:
|
MMP-2
|
matrix metalloproteinase 2
|
|
MRI
|
magnetic resonance imaging
|
|
EI
|
edema index
|
|
EP
|
enhancement percentage
|
|
CNS
|
central nervous system
|
|
RTK
|
receptor tyrosine kinase
|
References
|
1
|
Appin CL and Brat DJ: Molecular genetics
of gliomas. Cancer J. 20:66–72. 2014. View Article : Google Scholar : PubMed/NCBI
|
|
2
|
Goodenberger ML and Jenkins RB: Genetics
of adult glioma. Cancer Genet. 205:613–621. 2012. View Article : Google Scholar : PubMed/NCBI
|
|
3
|
Ostrom QT, Gittleman H, Farah P, Ondracek
A, Chen Y, Wolinsky Y, Stroup NE, Kruchko C and Barnholtz-Sloan JS:
CBTRUS statistical report: Primary brain and central nervous system
tumors diagnosed in the United States in 2006–2010. Neuro Oncol. 15
(Suppl 2):ii1–ii56. 2013. View Article : Google Scholar : PubMed/NCBI
|
|
4
|
Louis DN, Perry A, Reifenberger G, von
Deimling A, Figarella-Branger D, Cavenee WK, Ohgaki H, Wiestler OD,
Kleihues P and Ellison DW: The 2016 world health organization
classification of tumors of the central nervous system: A summary.
Acta Neuropathol. 131:803–820. 2016. View Article : Google Scholar : PubMed/NCBI
|
|
5
|
Wu W, Lamborn KR, Buckner JC, Novotny PJ,
Chang SM, O'Fallon JR, Jaeckle KA and Prados MD: Joint NCCTG and
NABTC prognostic factors analysis for high-grade recurrent glioma.
Neuro Oncol. 12:164–172. 2010. View Article : Google Scholar : PubMed/NCBI
|
|
6
|
Bauvois B: New facets of matrix
metalloproteinases MMP-2 and MMP-9 as cell surface transducers:
Outside-in signaling and relationship to tumor progression. Biochim
Biophys Acta. 1825:29–36. 2012.PubMed/NCBI
|
|
7
|
Yadav L, Puri N, Rastogi V, Satpute P,
Ahmad R and Kaur G: Matrix metalloproteinases and cancer-roles in
threat and therapy. Asian Pac J Cancer Prev. 15:1085–1091. 2014.
View Article : Google Scholar : PubMed/NCBI
|
|
8
|
Fingleton B: Matrix metalloproteinases:
Roles in cancer and metastasis. Front Biosci. 11:479–491. 2006.
View Article : Google Scholar : PubMed/NCBI
|
|
9
|
Martin MD and Matrisian LM: The other side
of MMPs: Protective roles in tumor progression. Cancer Metast Rev.
26:717–724. 2007. View Article : Google Scholar
|
|
10
|
Egeblad M and Werb Z: New functions for
the matrix metalloproteinases in cancer progression. Nat Rev
Cancer. 2:161–174. 2002. View
Article : Google Scholar : PubMed/NCBI
|
|
11
|
Cho HJ, Park JH, Nam JH, Chang YC, Park B
and Hoe HS: Ascochlorin Suppresses MMP-2-Mediated Migration and
Invasion by targeting FAK and JAK-STAT signaling cascades. J Cell
Biochem. 119:300–313. 2018. View Article : Google Scholar : PubMed/NCBI
|
|
12
|
Farina P, Tabouret E, Lehmann P, Barrie M,
Petrirena G, Campello C, Boucard C, Graillon T, Girard N and Chinot
O: Relationship between magnetic resonance imaging characteristics
and plasmatic levels of MMP2 and MMP9 in patients with recurrent
high-grade gliomas treated by Bevacizumab and Irinotecan. J
Neurooncol. 132:433–437. 2017. View Article : Google Scholar : PubMed/NCBI
|
|
13
|
Ou Y, Wu Q, Wu C, Liu X, Song Y and Zhan
Q: Migfilin promotes migration and invasion in glioma by driving
EGFR and MMP-2 signalings: A positive feedback loop regulation. J
Genet Genomics. 44:557–565. 2017. View Article : Google Scholar : PubMed/NCBI
|
|
14
|
van der Geer P, Hunter T and Lindberg RA:
Receptor protein-tyrosine kinases and their signal transduction
pathways. Annu Rev Cell Biol. 10:251–337. 1994. View Article : Google Scholar : PubMed/NCBI
|
|
15
|
Miao H and Wang B: Eph/ephrin signaling in
epithelial development and homeostasis. Int J Biochem Cell Biol.
41:762–770. 2009. View Article : Google Scholar : PubMed/NCBI
|
|
16
|
Kullander K and Klein R: Mechanisms and
functions of Eph and ephrin signalling. Nat Rev Mol Cell Biol.
3:475–486. 2002. View
Article : Google Scholar : PubMed/NCBI
|
|
17
|
Nakamoto M and Bergemann AD: Diverse roles
for the Eph family of receptor tyrosine kinases in carcinogenesis.
Microsc Res Tech. 59:58–67. 2002. View Article : Google Scholar : PubMed/NCBI
|
|
18
|
Pasquale EB: Eph-ephrin bidirectional
signaling in physiology and disease. Cell. 133:38–52. 2008.
View Article : Google Scholar : PubMed/NCBI
|
|
19
|
Miao H, Li DQ, Mukherjee A, Guo H, Petty
A, Cutter J, Basilion JP, Sedor J, Wu J, Danielpour D, et al: EphA2
mediates ligand-dependent inhibition and ligand-independent
promotion of cell migration and invasion via a reciprocal
regulatory loop with Akt. Cancer Cell. 16:9–20. 2009. View Article : Google Scholar : PubMed/NCBI
|
|
20
|
Ireton RC and Chen J: EphA2 receptor
tyrosine kinase as a promising target for cancer therapeutics. Curr
Cancer Drug Targets. 5:149–157. 2005. View Article : Google Scholar : PubMed/NCBI
|
|
21
|
Zeng G, Hu Z, Kinch MS, Pan CX, Flockhart
DA, Kao C, Gardner TA, Zhang S, Li L, Baldridge LA, et al:
High-level expression of EphA2 receptor tyrosine kinase in
prostatic intraepithelial neoplasia. Am J Pathol. 163:2271–2276.
2003. View Article : Google Scholar : PubMed/NCBI
|
|
22
|
Miao H, Gale NW, Guo H, Qian J, Petty A,
Kaspar J, Murphy AJ, Valenzuela DM, Yancopoulos G, Hambardzumyan D,
et al: EphA2 promotes infiltrative invasion of glioma stem cells in
vivo through cross-talk with Akt and regulates stem cell
properties. Oncogene. 34:558–567. 2015. View Article : Google Scholar : PubMed/NCBI
|
|
23
|
Cheng N, Brantley DM, Liu H, Lin Q,
Enriquez M, Gale N, Yancopoulos G, Cerretti DP, Daniel TO and Chen
J: Blockade of EphA receptor tyrosine kinase activation inhibits
vascular endothelial cell growth factor-induced angiogenesis. Mol
Cancer Res. 1:2–11. 2002. View Article : Google Scholar : PubMed/NCBI
|
|
24
|
Ogawa K, Pasqualini R, Lindberg RA, Kain
R, Freeman AL and Pasquale EB: The ephrin-A1 ligand and its
receptor, EphA2, are expressed during tumor neovascularization.
Oncogene. 19:6043–6052. 2000. View Article : Google Scholar : PubMed/NCBI
|
|
25
|
Khurshid SJ and Hussain AM: Nuclear
magnetic resonance imaging (MRI). J Pak Med Assoc. 41:259–264.
1991.PubMed/NCBI
|
|
26
|
Cavezian R, Cabanis EA, Pasquet G,
Iba-Zizen MT, Le Bihan D, Tamraz J and Roger B: Magnetic resonance
imaging. Physical principles, current biomedical applications,
maxillofacial perspectives. Actual Odontostomatol (Paris).
40:219–232. 1986.(In French). PubMed/NCBI
|
|
27
|
Guy RL, Benn JJ, Ayers AB, Bingham JB,
Lowy C, Cox TC and Sonksen PH: A comparison of CT and MRI in the
assessment of the pituitary and parasellar region. Clin Radiol.
43:156–161. 1991. View Article : Google Scholar : PubMed/NCBI
|
|
28
|
Qi S, Yu L, Li H, Ou Y, Qiu X, Ding Y, Han
H and Zhang X: Isocitrate dehydrogenase mutation is associated with
tumor location and magnetic resonance imaging characteristics in
astrocytic neoplasms. Oncol Lett. 7:1895–1902. 2014. View Article : Google Scholar : PubMed/NCBI
|
|
29
|
Puttick S, Bell C, Dowson N, Rose S and
Fay M: PET, MRI, and simultaneous PET/MRI in the development of
diagnostic and therapeutic strategies for glioma. Drug Discov
Today. 20:306–317. 2015. View Article : Google Scholar : PubMed/NCBI
|
|
30
|
Crooks V, Waller S, Smith T and Hahn TJ:
The use of the karnofsky performance scale in determining outcomes
and risk in geriatric outpatients. J Gerontol. 46:M139–M144. 1991.
View Article : Google Scholar : PubMed/NCBI
|
|
31
|
de Haan R, Aaronson N, Limburg M, Hewer RL
and Van Crevel H: Measuring quality of life in stroke. Stroke.
24:320–327. 1993. View Article : Google Scholar : PubMed/NCBI
|
|
32
|
Okada A: Roles of matrix
metalloproteinases and tissue inhibitor of metalloproteinase (TIMP)
in cancer invasion and metastasis. Gan To Kagaku Ryoho.
26:2247–2252. 1999.(In Japanese). PubMed/NCBI
|
|
33
|
Itoh T, Tanioka M, Yoshida H, Yoshioka T,
Nishimoto H and Itohara S: Reduced angiogenesis and tumor
progression in gelatinase A-deficient mice. Cancer Res.
58:1048–1051. 1998.PubMed/NCBI
|
|
34
|
Rao JS: Molecular mechanisms of glioma
invasiveness: The role of proteases. Nat Rev Cancer. 3:489–501.
2003. View
Article : Google Scholar : PubMed/NCBI
|
|
35
|
Yue X, Lan F, Yang W, Yang Y, Han L, Zhang
A, Liu J, Zeng H, Jiang T, Pu P and Kang C: Interruption of
β-catenin suppresses the EGFR pathway by blocking multiple
oncogenic targets in human glioma cells. Brain Res. 1366:27–37.
2010. View Article : Google Scholar : PubMed/NCBI
|
|
36
|
Chicoine MR and Silbergeld DL: The in
vitro motility of human gliomas increases with increasing grade of
malignancy. Cancer. 75:2904–2909. 1995. View Article : Google Scholar : PubMed/NCBI
|
|
37
|
Wykosky J, Gibo DM, Stanton C and Debinski
W: EphA2 as a novel molecular marker and target in glioblastoma
multiforme. Mol Cancer Res. 3:541–551. 2005. View Article : Google Scholar : PubMed/NCBI
|
|
38
|
Langer A: A systematic review of PET and
PET/CT in oncology: A way to personalize cancer treatment in a
cost-effective manner? BMC Health Serv Res. 10:2832010. View Article : Google Scholar : PubMed/NCBI
|
|
39
|
Ross R: Advances in the application of
imaging methods in applied and clinical physiology. Acta Diabetol.
40 (Suppl 1):S45–S50. 2003. View Article : Google Scholar : PubMed/NCBI
|
|
40
|
Caravan P, Ellison JJ, McMurry TJ and
Lauffer RB: Gadolinium(III) chelates as MRI contrast agents:
Structure, dynamics, and applications. Chem Rev. 99:2293–2352.
1999. View Article : Google Scholar : PubMed/NCBI
|
|
41
|
Zhou Z and Lu ZR: Gadolinium-based
contrast agents for magnetic resonance cancer imaging. Wiley
Interdiscip Rev Nanomed Nanobiotechnol. 5:1–18. 2013. View Article : Google Scholar : PubMed/NCBI
|
|
42
|
Ye F, Liu J and Ouyang H: Gadolinium
ethoxybenzyl diethylenetriamine pentaacetic acid
(Gd-EOB-DTPA)-enhanced magnetic resonance imaging and
multidetector-row computed tomography for the diagnosis of
hepatocellular carcinoma: A systematic review and meta-analysis.
Medicine (Baltimore). 94:e11572015. View Article : Google Scholar : PubMed/NCBI
|
|
43
|
Ying SH, Teng XD, Wang ZM, Wang QD, Zhao
YL, Chen F and Xiao WB: Gd-EOB-DTPA-enhanced magnetic resonance
imaging for bile duct intraductal papillary mucinous neoplasms.
World J Gastroenterol. 21:7824–7833. 2015. View Article : Google Scholar : PubMed/NCBI
|
|
44
|
Chung C, Metser U and Menard C: Advances
in magnetic resonance imaging and positron emission tomography
imaging for grading and molecular characterization of glioma. Semin
Radiat Oncol. 25:164–171. 2015. View Article : Google Scholar : PubMed/NCBI
|
|
45
|
Zuo N, Cheng J and Jiang T: Diffusion
magnetic resonance imaging for Brainnetome: A critical review.
Neurosci Bull. 28:375–388. 2012. View Article : Google Scholar : PubMed/NCBI
|
|
46
|
Jahng GH, Li KL, Ostergaard L and
Calamante F: Perfusion magnetic resonance imaging: A comprehensive
update on principles and techniques. Korean J Radiol. 15:554–577.
2014. View Article : Google Scholar : PubMed/NCBI
|
|
47
|
Ledezma CJ, Chen W, Sai V, Freitas B,
Cloughesy T, Czernin J and Pope W: 18F-FDOPA PET/MRI fusion in
patients with primary/recurrent gliomas: Initial experience. Eur J
Radiol. 71:242–248. 2009. View Article : Google Scholar : PubMed/NCBI
|
|
48
|
Chen W and Silverman DH: Advances in
evaluation of primary brain tumors. Semin Nucl Med. 38:240–250.
2008. View Article : Google Scholar : PubMed/NCBI
|
|
49
|
Costello JF: DNA methylation in brain
development and gliomagenesis. Front Biosci. 8 (Suppl):S175–S184.
2003. View Article : Google Scholar : PubMed/NCBI
|
|
50
|
Carlson MR, Pope WB, Horvath S, Braunstein
JG, Nghiemphu P, Tso CL, Mellinghoff I, Lai A, Liau LM, Mischel PS,
et al: Relationship between survival and edema in malignant
gliomas: Role of vascular endothelial growth factor and neuronal
pentraxin 2. Clin Cancer Res. 13:2592–2598. 2007. View Article : Google Scholar : PubMed/NCBI
|
|
51
|
Pope WB, Sayre J, Perlina A, Villablanca
JP, Mischel PS and Cloughesy TF: MR imaging correlates of survival
in patients with high-grade gliomas. AJNR Am J Neuroradiol.
26:2466–2474. 2005.PubMed/NCBI
|