Introduction
Lung adenocarcinoma (LUAD) is the most predominant
subtype of non-small cell lung cancer (NSCLC), with increased
incidence over the past decades worldwide (1,2). LUAD is
usually observed in the peripheral region of the lungs, with a poor
overall five-year survival rate of 15% worldwide in 2008 (3). Due to resistance to radiation therapy,
LUAD is often treated surgically (4). Nonetheless, approximately a third of
patients relapse within five years of surgical removal (5).
DNA methylation, a primary epigenetic modification
in the mammalian genome, often occurs at CpG islands, leading to
altered tumor suppressor gene transcription (6). Aberrant DNA methylation plays a key
role in the progression and metastasis of LUAD, reflecting
important biological features in the etiology (7). Zhu et al (8) identified a group of genes with
differentially methylated loci in LUAD. Han et al (9) found that methylated PTPRF
(protein tyrosine phosphatase, receptor type F), HOXD3
(homeobox D 3), HOXD13 and CACNA1A (calcium
voltage-gated channel subunit alpha1 A) may be potential markers of
LUAD, based on DNA methylation profiling analysis. Furthermore,
Sandoval et al (10)
suggested a prognostic signature based on five hypermethylated
genes for early stage NSCLC. Additionally, Kuo et al
(11) established a proof-of-concept
prognostic signature of eight methylated probes for survival
prediction in Asian and Caucasian populations with early-stage
LUAD. Despite these remarkable findings, there is a lack of a
prognostic DNA methylation signature for LUAD.
In the present study, genome-wide methylation
analysis was carried out on the methylation data of 425 patients
with LUAD, with corresponding clinicopathological features from The
Cancer Genome Atlas (TCGA). LUAD-associated co-methylation modules
were mined with the weighted correlation network analysis (WGCNA)
package. Furthermore, a group of differentially methylated genes
(DMGs) predictive of survival were identified for LUAD by
performing differential DNA methylation, correlation, univariate
Cox regression and L1 penalized (LASSO) Cox proportional hazards
(PH) regression analyses. These findings may potentially contribute
to a deeper insight into the epigenetic landscape of LUAD and
improve the prognostic evaluation of patients.
Materials and methods
Data resources
DNA methylation data and the corresponding survival
information of 425 LUAD tissue samples were downloaded from TCGA
portal (https://gdc-portal.nci.nih.gov/) on May 26th, 2018,
based on the Illumina Infinium Human Methylation 450 BeadChip
platform, and were used as the training set in the present study.
The GSE39279 dataset was downloaded from the National Center for
Biotechnology Information Gene Expression Omnibus (NCBI GEO)
database (http://www.ncbi.nlm.nih.gov/geo/), based on the
Illumina Infinium Human Methylation 450 BeadChip platform,
consisting of the gene methylation data of 443 NSCLC samples. Among
these samples, 155 LUAD samples with available survival information
were selected as the validation set. The clinicopathological
features of the training set and the validation set are shown in
Table I.
 | Table I.Clinicopathological characteristics
of patients in the training set and the validation set. |
Table I.
Clinicopathological characteristics
of patients in the training set and the validation set.
| Clinicopathological
characteristics | Training set
(n=425) | Validation set
(n=155) |
|---|
| Age, years (mean ±
SD) | 65.12±10.04 | 65.11±10.85 |
| Sex,
male/female | 198/227 | 76/79 |
| Death,
dead/alive/- | 120/305 | – |
| OS time, months
(mean ± SD) | 22.13±28.39 | – |
| RFS time, months
(mean ± SD) | 18.802±26.34 | 54.68±45.62 |
| Recurrence,
yes/no | 87/228 | 68/87 |
Differential DNA methylation
analysis
A bad prognosis was defined as patients who died or
who had a survival time <12 months, whereas a good prognosis
indicated living patients who survived >24 months. According to
the annotation profiles provided by the platform, only the DNA
methylation loci in CpGs were reserved. The comparison of samples
associated with good and bad prognosis from the TCGA set,
identified differentially methylated CpGs (DM CpGs), using the
limma package (12) of R language
(version 3.34.7; http://bioconductor.org/packages/release/bioc/html/limma.html).
A strict cut-off value was set at false discovery rate
(FDR)<0.05 and |Log2fold change (FC)|>0.1. The
genes mapped by the identified DM CpGs were defined as the
DMGs.
Co-methylation analysis
In order to analyze the inter-correlation among the
identified DM CpGs, co-methylation network analysis was carried out
using the WGCNA R package (version 1.63; http://cran.r-project.org/web/packages/WGCNA/index.html),
as previously described (13).
Briefly, a thresholding power function (β) of 5 was chosen to fit a
scale-free network. Topological overlap matrix (TOM) was then
calculated to measure the correlations between the methylation
levels of two genes. The resulting hierarchical clustering
dendrogram was obtained, followed by selection of the modules with
a minimum module size of 100 and a minimum cut height of 0.95,
using the Dynamic Tree Cut algorithm. These identified DM CpGs were
then mapped to the modules obtained by WGCNA analysis. The
enrichment of target DM CpGs in each module was assessed by
hypergeometric-based test (14),
using the following formula: f (k, N, M, n) = C (k, M) × C (n-k,
N-M)/C (n, N).
The modules with P<0.05 and fold enrichment >1
were further selected as LUAD-associated modules and subjected to
Gene ontology (GO) enrichment analysis using the DAVID 6.8 software
(15,16). This revealed the biological functions
of the DMGs clustered in these modules.
Correlation of DNA methylation level
with gene expression level
The genome-wide expression data of the LUAD samples
in the TCGA set was obtained. The correlation between the overall
methylation level and the overall gene expression level of the
DMGs, included in the LUAD-associated modules, was analyzed with
the cor.test function of R language by calculating the Pearson's
correlation coefficient (PCC) (17).
Subsequently, the PCC of the overall methylation level of each
individual gene, with its overall gene expression level was also
computed. The genes with negative PCC and P<0.05 were used for
further analysis.
Construction of a prognostic risk
scoring model based on the training set
Univariate Cox regression analysis was performed to
identify the prognosis-associated DMGs from the aforementioned
genes with negative PCC, using the survival package of R language
(18) (http://bioconductor.org/packages/survivalr/), with
log-rank P<0.05 as the cutoff.
A LASSO estimation-based Cox-PH model (19) was used to select the optimal panel of
genes predictive of prognosis from these prognosis-related DMGs by
the penalized package (version 0.9–50) (20) of R language. Combining the Cox-PH
coefficients of the optimal genes with their methylation levels, a
risk scoring model was constructed for predicting survival as
follows: Risk score = ∑ coefgene ×
methylationgene, where coefgene represents
the Cox-PH coefficient of a gene and methylationgene
represents the methylation level of a gene.
A risk score was assigned to each patient in TCGA
dataset and the median risk score for all patients was calculated
to divide patients into a low-risk group (risk score below the
median value) and a high-risk group (risk score above the median
value). To estimate the overall survival (OS) time and
recurrence-free survival (RFS) time of the patients in the two risk
groups, the Kaplan-Meier estimate (21) was used together with the Wilcoxon log
rank test. The areas under the receiver operating characteristic
(AUROC) curves were used to evaluate the prognostic ability of the
risk scoring model and tested in the validation set.
Results
DM CpGs between samples with good and
bad prognosis
With regard to the DNA methylation data of the TCGA
set, 15654 methylated loci in CpGs were retained, according to the
Illumina 450 K methylation platform. This set was comprised of 41
samples with bad prognosis and 72 samples with good prognosis. As
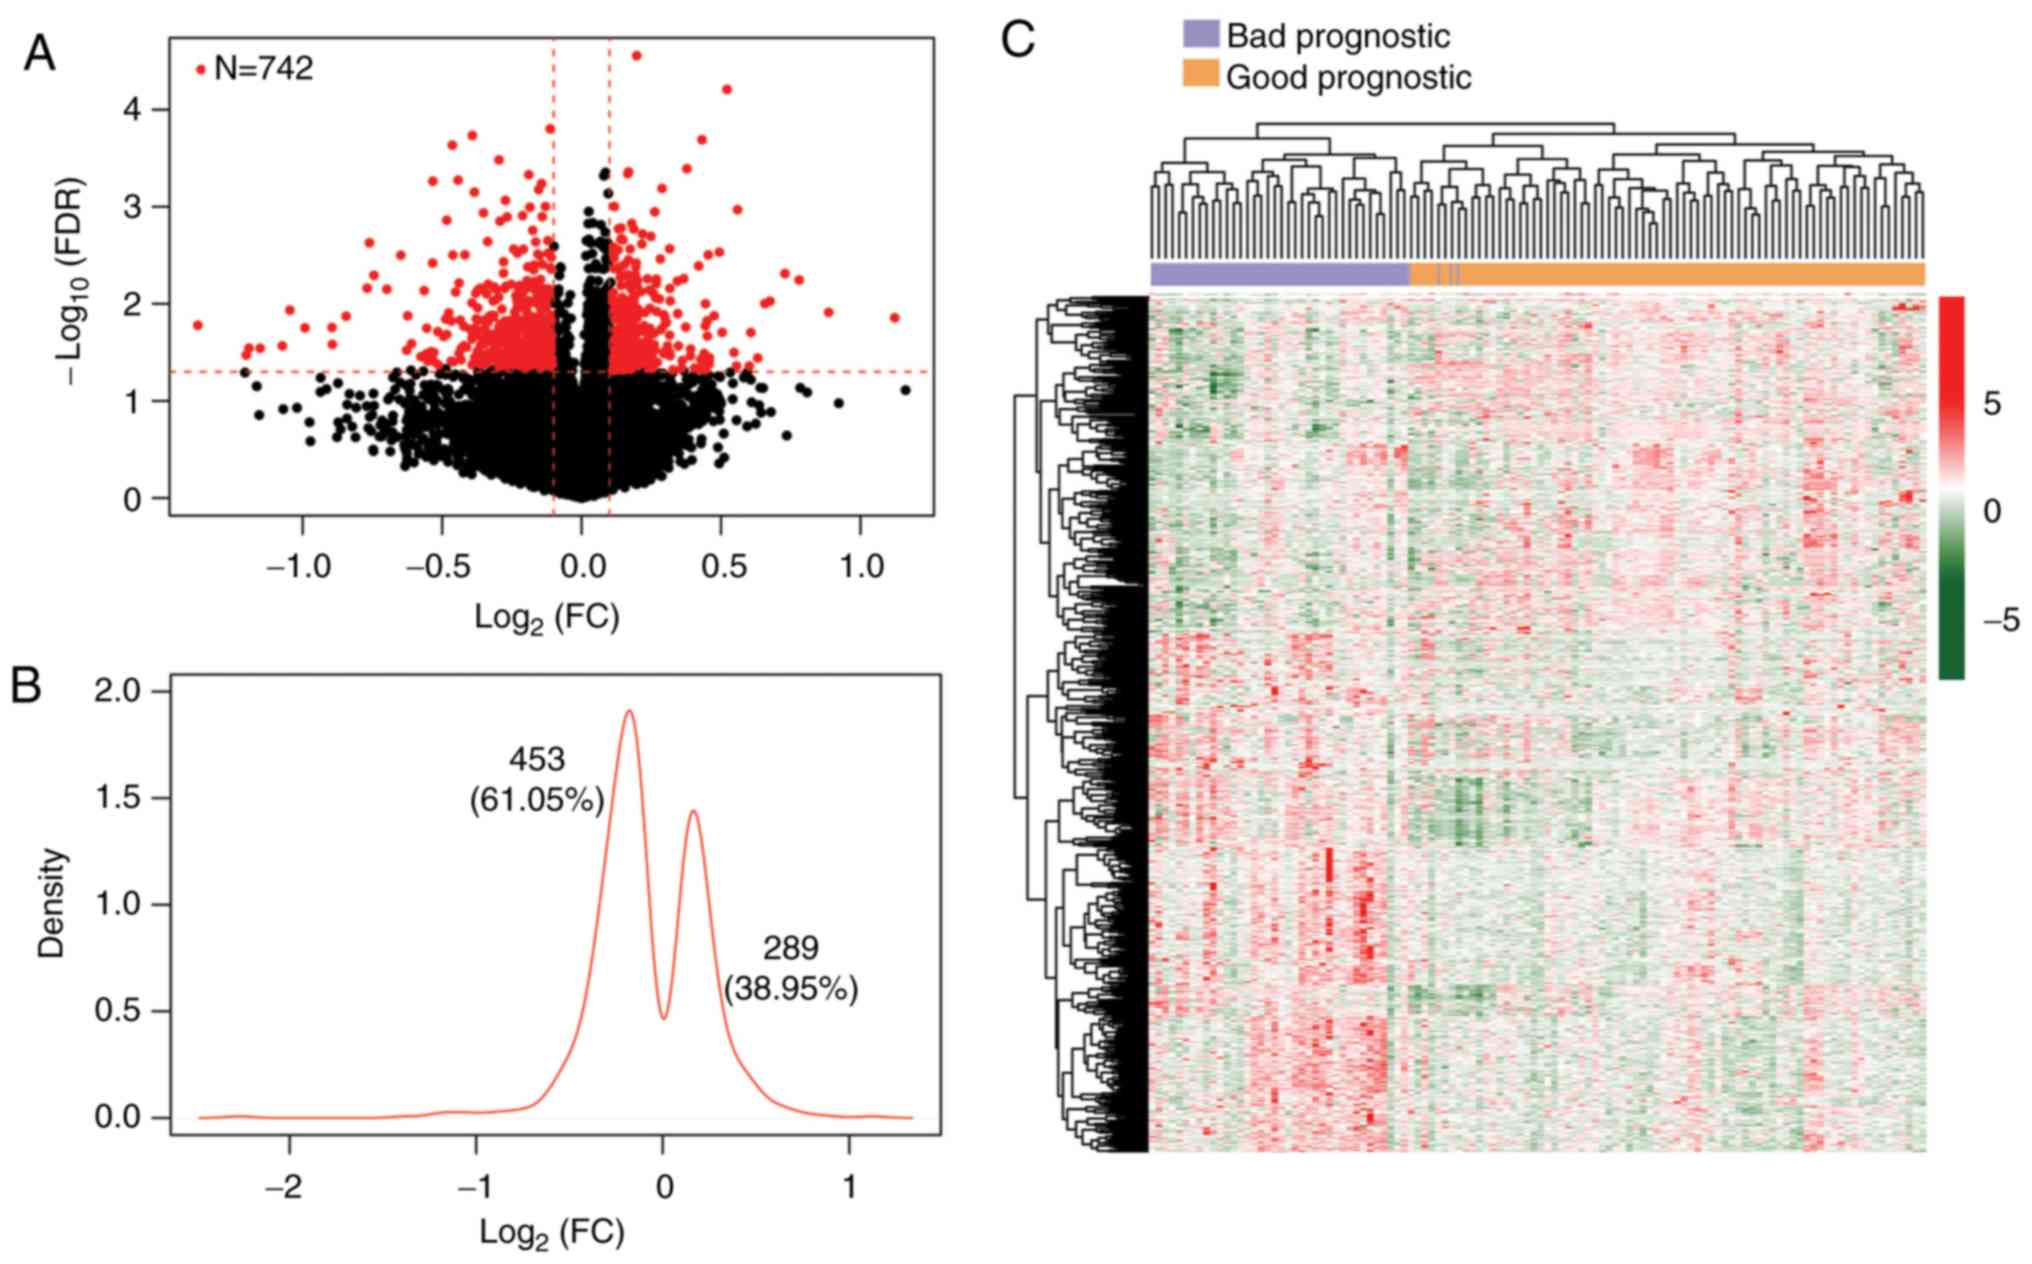
shown in Fig. 1A, a total of 742
DMGs (3.79×10⁻⁷ <P-nominal <6.84×10⁻⁴,
2.77×10⁻⁵ <FDR <0.05) were identified between the
samples with good and bad prognosis. Kernel density plotting of
log2FC showed that of the 742 DMGs, 289 were
hypermethylated, whereas 453 were hypomethylated in the samples
with good prognosis (Fig. 1B).
Two-way hierarchical clustering analysis based on the methylation
levels of these DMGs revealed that the subjects in the TCGA set
were clustered into two different groups (Fig. 1C). Furthermore, out of the CpGs of
the 742 identified DMGs, 447 were located in gene bodies, 155 in 5′
untranslated regions (UTRs), 98 in 3′UTRs and 42 in promoters. The
top 20 DMGs were chosen according to their FDR value and shown in
ascending order in Table II.
| Table II.Top 20 significant differentially
methylated genes. |
Table II.
Top 20 significant differentially
methylated genes.
| Methylated
loci | Chromosome | Gene | Position | Location | β-good | β-bad | Effect |
Pnominal | FDR |
|---|
| cg21644316 | 3 | QTRTD1 | 115260371 | 5′UTR | 0.7249 | 0.8314 | 0.1978 |
3.79×10⁻⁷ |
2.77×10⁻⁵ |
| cg10753610 | 17 | ITGB3 | 42690202 | Body | 0.2511 | 0.3604 | 0.5216 |
8.45×10⁻⁷ |
6.17×10⁻⁵ |
| cg02960016 | 3 | HRH1 | 11167068 | 5′UTR | 0.7498 | 0.6936 | −0.1125 |
2.15×10⁻⁶ |
1.57×10⁻⁴ |
| cg12240358 | 15 | HOMER2 | 81410528 | Body | 0.5326 | 0.4059 | −0.3918 |
2.52×10⁻⁶ |
1.84×10⁻⁴ |
| cg07684796 | 10 | DKK1 | 53744216 | 1stExon | 0.1152 | 0.1554 | 0.4317 |
2.78×10⁻⁶ |
2.03×10⁻⁴ |
| cg18440692 | 10 | FAM53B | 126298025 | 3′UTR | 0.4420 | 0.3205 | −0.4636 |
3.17×10⁻⁶ |
2.31×10⁻⁴ |
| cg23894219 | 1 | LOC441869 | 1346429 | Body | 0.5987 | 0.4876 | −0.2961 |
4.50×10⁻⁶ |
3.28×10⁻⁴ |
| cg23581793 | 14 | SCARNA13,
SNHG10 | 95069529 | Body | 0.3519 | 0.4572 | 0.3778 |
5.54×10⁻⁶ |
4.05×10⁻⁴ |
| cg01531333 | 7 | TMEM184A, MAFK | 1548749 | 3′UTR | 0.7444 | 0.8366 | 0.1685 |
5.97×10⁻⁶ |
4.36×10⁻⁴ |
| cg01289421 | 19 | B3GNT3 | 17769247 | 5′UTR | 0.6009 | 0.6740 | 0.1657 |
6.24×10⁻⁶ |
4.56×10⁻⁴ |
| cg07428439 | 17 | LOC284023 | 7759563 | Promoter | 0.1277 | 0.1120 | −0.1892 |
6.39×10⁻⁶ |
4.67×10⁻⁴ |
| cg01798157 | 1 | BTG2 | 201543219 | Promoter | 0.5384 | 0.3961 | −0.4427 |
7.28×10⁻⁶ |
5.32×10⁻⁴ |
| cg00259834 | 3 | RFTN1 | 16528504 | Promoter | 0.3736 | 0.2582 | −0.5332 |
7.45×10⁻⁶ |
5.44×10⁻⁴ |
| cg04481715 | 13 | ATP4B | 113351540 | 3′UTR | 0.9121 | 0.8259 | −0.1432 |
7.89×10⁻⁶ |
5.76×10⁻⁴ |
| cg26511108 | 10 | COMMD3, BMI1 | 22648958 | 3′UTR | 0.4687 | 0.5726 | 0.2886 |
8.86×10⁻⁶ |
6.47×10⁻⁴ |
| cg03366285 | 15 | FSD2 | 81271781 | 5′UTR | 0.724321 | 0.651058 | −0.15384 |
9.07×10⁻⁶ |
6.63×10⁻⁴ |
| cg03087607 | 6 | TCF21 | 134252361 | body | 0.427617 | 0.327662 | −0.38411 |
9.66×10⁻⁶ |
7.06×10⁻⁴ |
| cg07097184 | 4 | FHDC1 | 154119463 | 3′UTR | 0.433799 | 0.359003 | −0.27303 |
1.17×10⁻⁵ |
8.58×10⁻⁴ |
| cg02538597 | 12 | ARPC3 | 109372526 | Promoter | 0.099173 | 0.090652 | −0.12961 |
1.35×10⁻⁵ |
9.89×10⁻⁴ |
| cg24272980 | 3 | CIDECP | 10040206 | Body | 0.752599 | 0.816553 | 0.117666 |
1.36×10⁻⁵ |
9.92×10⁻⁴ |
LUAD-associated co-methylation
modules
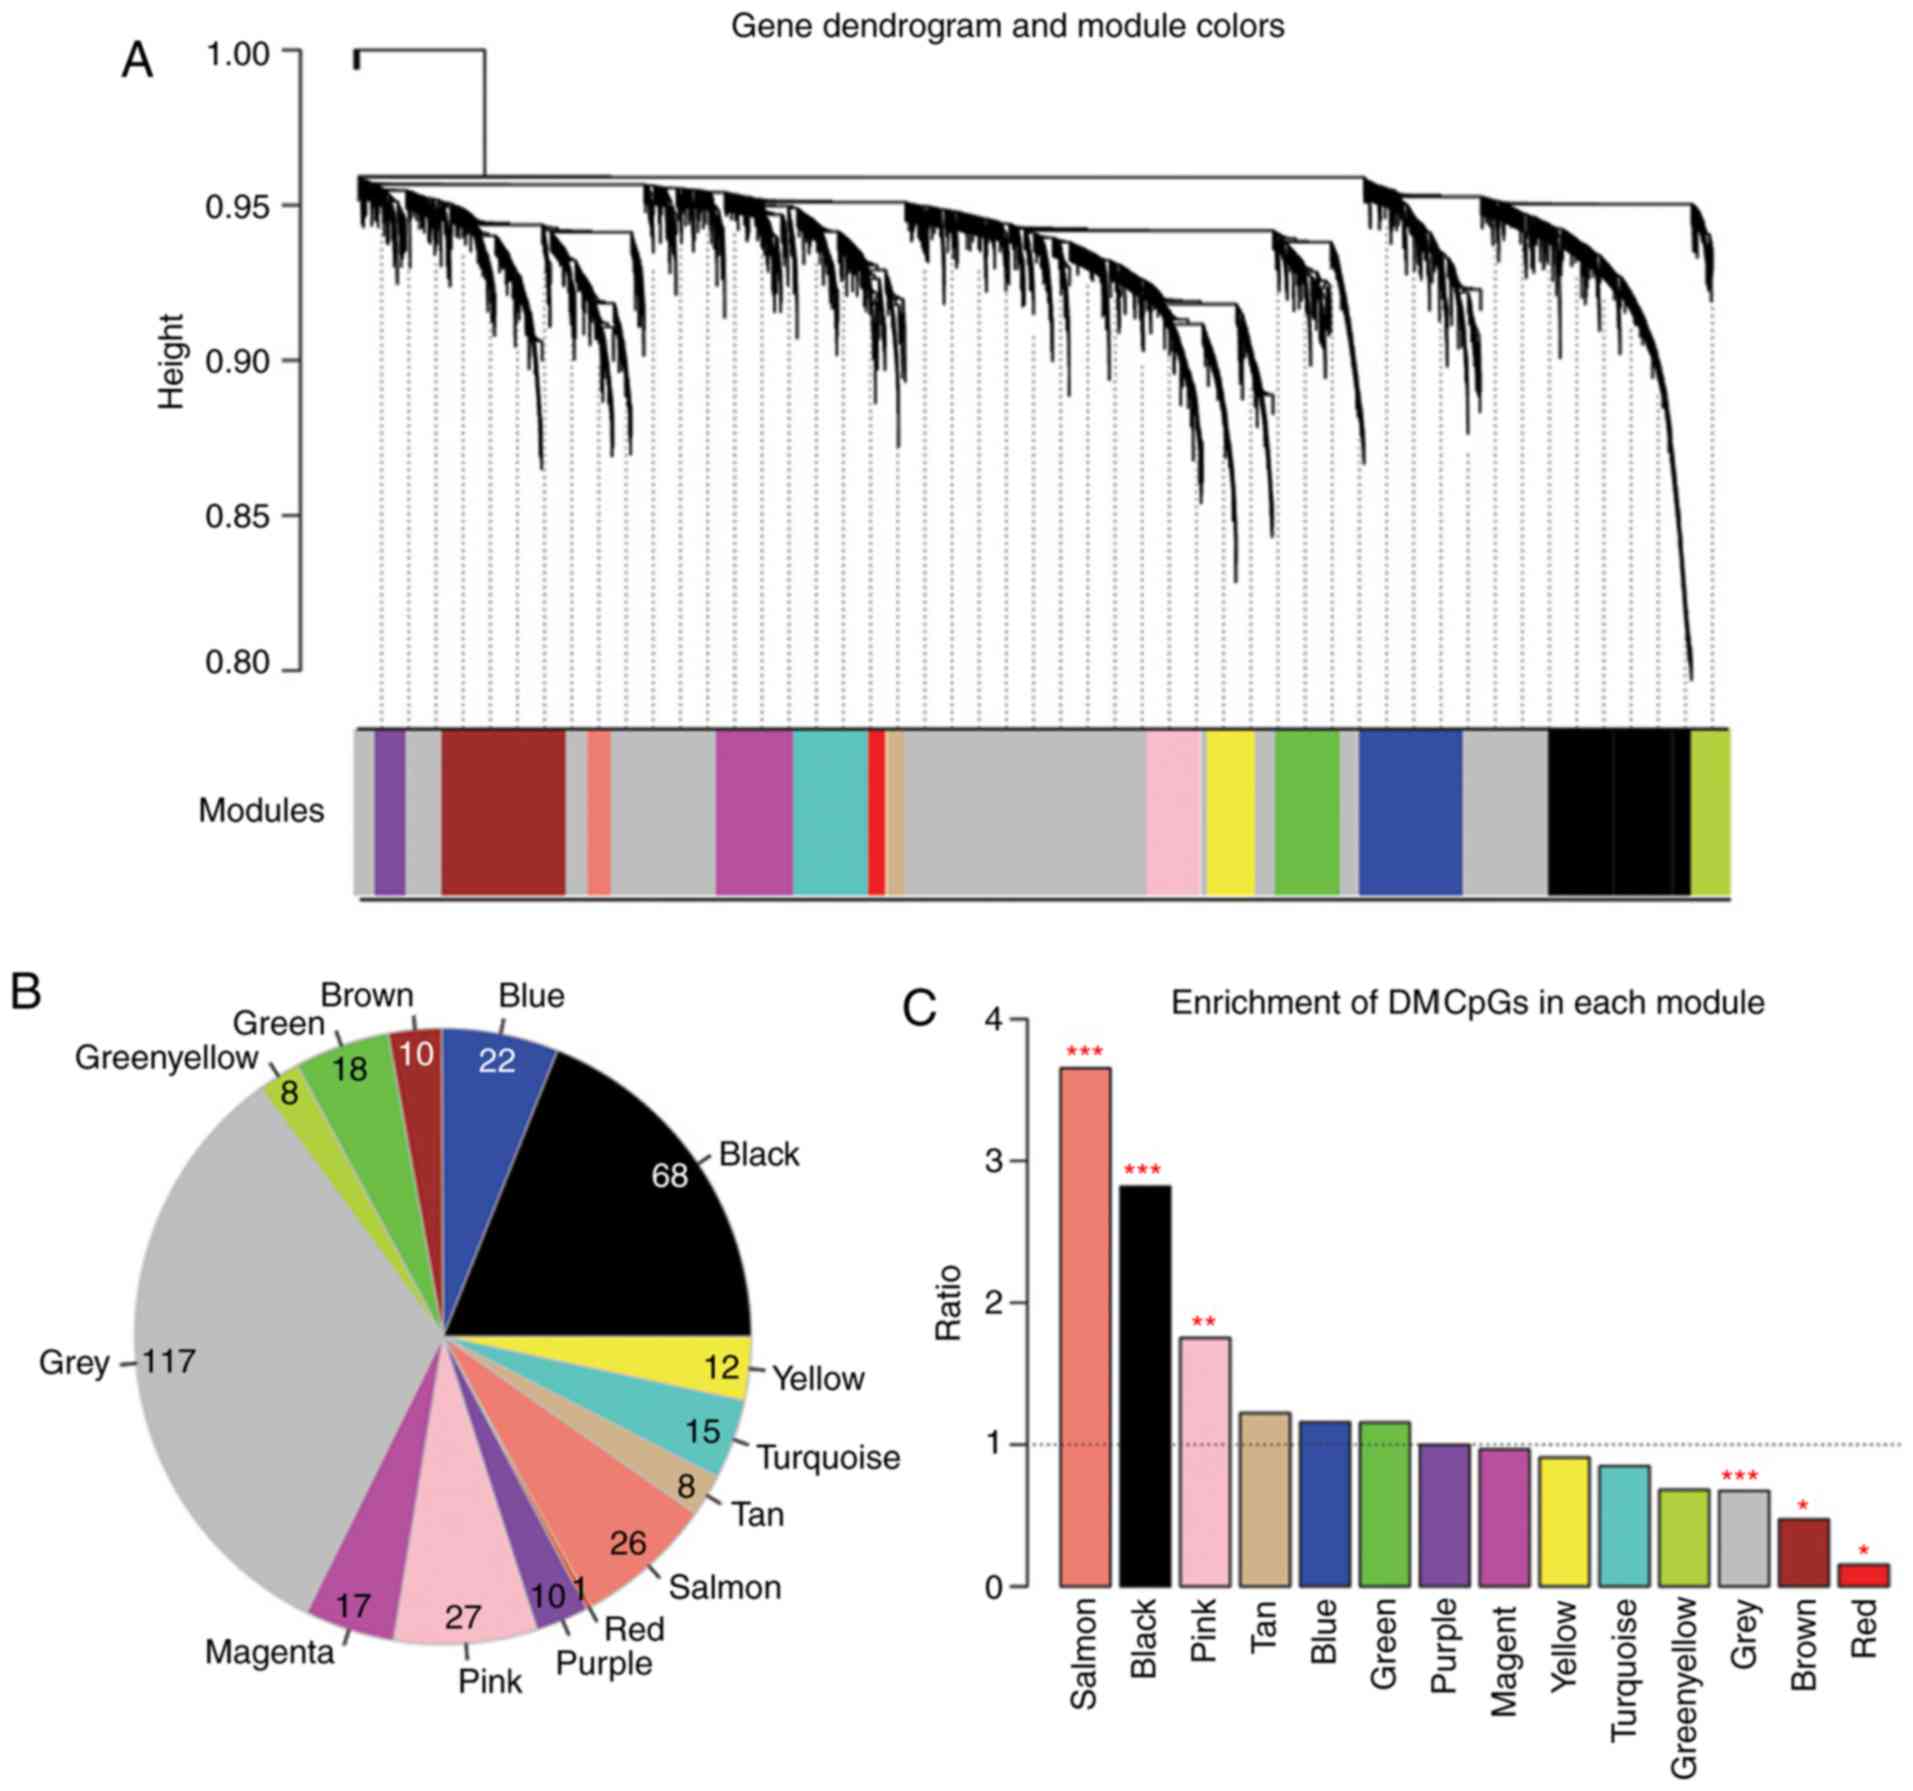
For the purpose of detecting LUAD-associated
co-methylation modules, a weighted gene co-methylation network was
constructed for the identified DMGs. As depicted in Fig. 2A and B, the DMGs with significantly
correlated methylation level (P<0.05) were assigned into 13
methylation modules (Table III).
The DMGs without significant correlation in their methylation level
were grouped into the grey module.
| Table III.Methylation modules from weighted
correlation network analysis. |
Table III.
Methylation modules from weighted
correlation network analysis.
| Module color | Count of CpGs | Correlation
efficient |
Pcorr | Count of DM
CpGs | Enrichment fold
(95% CI) |
Phyper |
|---|
| Black | 468 | 0.502 | 0.0024 | 68 | 2.818
(2.106–3.728) | <0.0001 |
| Blue | 368 | 0.609 | 0.0033 | 22 | 1.159
(0.709–1.811) | 0.4730 |
| Brown | 410 | 0.488 | 0.0047 | 10 | 0.473
(0.223–0.889) | 0.0176 |
| Green | 302 | 0.495 | 0.0027 | 18 | 1.156
(0.668–1.886) | 0.5110 |
| Yellow | 228 | 0.486 | 0.0023 | 8 | 0.681
(0.288–1.379) | 0.3560 |
| Grey | 3363 | 0.407 | 0.6550 | 117 | 0.674
(0.541–0.837) | 0.0002 |
| Magenta | 341 | 0.532 | 0.0007 | 17 | 0.967
(0.550–1.594) | 0.9680 |
| Pink | 299 | 0.469 | 0.0005 | 27 | 1.752
(1.119–2.644) | 0.0095 |
| Purple | 194 | 0.517 | 0.0068 | 10 | 0.999
(0.468–1.901) | 1.0000 |
| Red | 127 | 0.539 | 0.0005 | 1 | 0.153
(0.038–0.872) | 0.0214 |
| Salmon | 138 | 0.428 | 0.0039 | 26 | 3.653
(2.275–5.673) | <0.0001 |
| Tan | 127 | 0.471 | 0.0045 | 8 | 1.222
(0.512–2.509) | 0.5450 |
| Turquoise | 343 | 0.811 | 0.0029 | 15 | 0.848
(0.465–1.439) | 0.6160 |
| Yellow | 256 | 0.518 | 0.0007 | 12 | 0.909
(0.459–1.637) | 0.8850 |
The enrichment of the DMGs in each module was
analyzed using a hypergeometric-based test. Three modules with fold
enrichment >1 and P<0.05 were identified as LUAD-associated
methylation modules (black module, size=68; pink module, size=27;
salmon module, size=26; Fig. 2C).
Moreover, GO enrichment analysis found that the total of 121 DMGs
in the three modules were highly enriched in 16 biological
processes, primarily associated with cell death, cytoskeleton
organization and cell junction organization (Table IV).
| Table IV.Significant GO terms for the three
LUAD-associated modules. |
Table IV.
Significant GO terms for the three
LUAD-associated modules.
| GO term | Count of genes | Fold
enrichment | P-value |
|---|
| Cytoskeleton
organization | 8 | 2.821 | 0.0110 |
| Response to DNA
damage stimulus | 7 | 2.885 | 0.0165 |
| Spindle
organization | 3 | 10.248 | 0.0169 |
| Positive regulation
of cytoskeleton organization | 3 | 10.248 | 0.0169 |
| Regulation of
transcription from RNA polymerase II promoter | 10 | 2.115 | 0.0218 |
| Cell junction
organization | 3 | 8.091 | 0.0260 |
| Anterior/posterior
pattern formation | 4 | 4.392 | 0.0307 |
| Regulation of
cellular component biogenesis | 4 | 4.330 | 0.0318 |
| Microtubule
cytoskeleton organization | 4 | 4.183 | 0.0345 |
| Positive regulation
of transcription, DNA-dependent | 7 | 2.256 | 0.0433 |
| Positive regulation
of RNA metabolic process | 7 | 2.237 | 0.0446 |
| Cell death | 9 | 1.924 | 0.0454 |
| Apoptosis | 8 | 2.043 | 0.0462 |
| Death | 9 | 1.911 | 0.0468 |
| Programmed cell
death | 8 | 2.013 | 0.0490 |
| Positive regulation
of organelle organization | 3 | 5.556 | 0.0498 |
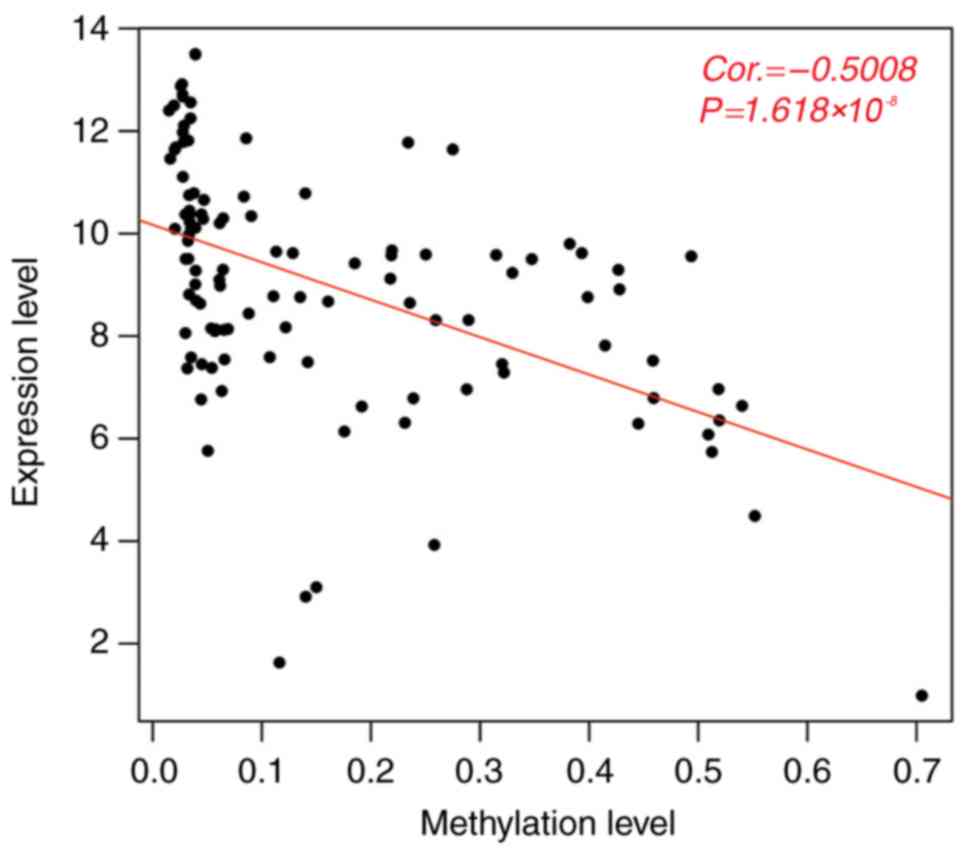
Development and validation of a
prognostic scoring model based on DMGs
The methylation levels of the 121 DMGs clustered in
the three LUAD-associated modules were negatively correlated with
their overall gene expression levels (PCC=−0.5008,
P=1.618×10⁻⁸; Fig. 3).
Furthermore, the negative correlation between the methylation level
of the individual gene and its gene expression level was observed
in 94 genes, of which 58 DMGs were found to be significantly
associated with survival via univariate Cox regression analysis
(P<0.05, Table V). Consequently,
a LASSO Cox PH model was fitted with the methylation level of the
58 prognosis-associated DMGs. When the cross-validated likelihood
(CVL) reached the maximal value of 1.537, the optimal λ value was
−691.265. As a result, the most powerful prognostic panel of genes
was selected, including C20orf56, BTG anti-proliferation
factor 2 (BTG2), C13orf16, deoxyribonuclease 1 Like 1
(DNASE1L1), zinc finger DHHC-type containing 3
(ZDHHC3), FH2 domain containing 1 (FHDC1), ADP
ribosylation factor 6 (ARF6), integrin subunit beta 3
(ITGB3) and intercellular adhesion molecule 4 (ICAM4)
(Table VI).
| Table V.Genes associated with survival
according to Cox regression analysis. |
Table V.
Genes associated with survival
according to Cox regression analysis.
| ID | Gene | P-value |
|---|
| cg03395898 | TGFB3 |
6.0×10⁻⁵ |
| cg01798157 | BTG2 |
4.2×10⁻⁴ |
| cg07097184 | FHDC1 |
5.1×10⁻⁴ |
| cg02334643 | DHX40 |
8.4×10⁻⁴ |
| cg05003322 | COL16A1 |
8.6×10⁻⁴ |
| cg27500918 | FLYWCH2 |
9.1×10⁻⁴ |
| cg00933153 | C20orf56 |
1.0×10⁻³ |
| cg20541456 | CYFIP2 |
1.1×10⁻⁴ |
| cg05898928 | YPEL1 |
1.2×10⁻⁴ |
| cg16194253 | C14orf21 |
1.5×10⁻⁴ |
| cg21494776 | ICAM4 |
1.6×10⁻⁴ |
| cg11013977 | QRICH1 |
1.7×10⁻⁴ |
| cg06620210 | AP1M1 |
2.1×10⁻⁴ |
| cg02016545 | MICA |
2.3×10⁻⁴ |
| cg03595580 | TECPR1 |
2.5×10⁻⁴ |
| cg18050194 | SEC22C |
4.0×10⁻³ |
| cg08517562 | PTPN1 |
5.6×10⁻⁴ |
| cg02156071 | C10orf84 |
5.7×10⁻⁴ |
| cg06877599 | SUPT5H |
5.7×10⁻⁴ |
| cg04902921 | EDEM3 |
6.3×10⁻⁴ |
| cg16740905 | SEC1 |
6.9×10⁻⁴ |
| cg04432377 | ZDHHC3 |
7.1×10⁻⁴ |
| cg10753610 | ITGB3 |
7.9×10⁻⁴ |
| cg05714082 | POLR1A |
8.5×10⁻⁴ |
| cg04446303 | TFAP4 |
9.4×10⁻⁴ |
| cg02282317 | AATF | 0.011 |
| cg08100565 | SLC25A36 | 0.011 |
| cg01889020 | MEGF11 | 0.014 |
| cg02181309 | MRPL52 | 0.014 |
| cg01498883 | SNRPB | 0.014 |
| cg06677352 | STAG3L3 | 0.014 |
| cg24122247 | CIDECP | 0.015 |
| cg24135606 | PFN1 | 0.016 |
| cg24612420 | ACLY | 0.017 |
| cg19759282 | GPR155 | 0.017 |
| cg13939431 | MEAF6 | 0.017 |
| cg01963754 | C13orf16 | 0.018 |
| cg04324559 | DNASE1L1 | 0.019 |
| cg24951800 | MEF2A | 0.019 |
| cg00567190 | C1orf97 | 0.020 |
| cg12811419 | TMEM214 | 0.024 |
| cg00399374 | CHMP4C | 0.025 |
| cg01779512 | IFT88 | 0.027 |
| cg16931807 | KIAA0195 | 0.032 |
| cg15599146 | ZDHHC14 | 0.033 |
| cg07459266 | RNF213 | 0.034 |
| cg08125503 | PIGL | 0.035 |
| cg07057042 | RAB5A | 0.035 |
| cg21994174 | ETFB | 0.036 |
| cg06421633 | LUC7L3 | 0.036 |
| cg03270167 | RAMP1 | 0.037 |
| cg05006947 | SLC38A7 | 0.040 |
| cg10156217 | ARF6 | 0.042 |
| cg07097417 | LPGAT1 | 0.042 |
| cg02146453 | PROSC | 0.043 |
| cg17286258 | SF3B1 | 0.043 |
| cg18085070 | PSRC1 | 0.044 |
| cg27229100 | C20orf199 | 0.046 |
| Table VI.A panel of nine differentially
methylated genes predictive of prognosis. |
Table VI.
A panel of nine differentially
methylated genes predictive of prognosis.
| ID | Gene | Chromosome | Position | Location | Coefficient | Hazard ratio | P-value |
|---|
| cg00933153 | C20orf56 | 20 | 22498129 | Body | 0.8529 | 3.177 | 0.0010 |
| cg01798157 | BTG2 | 1 | 201543218 | Promoter | 0.9931 | 2.606 | 0.0004 |
| cg01963754 | C13orf16 | 13 | 110775249 | Body | −0.5670 | 0.499 | 0.0180 |
| cg04324559 | DNASE1L1 | X | 153290455 | 5′UTR | −0.1602 | 0.712 | 0.0190 |
| cg04432377 | ZDHHC3 | 3 | 44992301 | Promoter | 0.6870 | 2.894 | 0.0071 |
| cg07097184 | FHDC1 | 4 | 154119462 | 3′UTR | 1.0356 | 5.175 | 0.0005 |
| cg10156217 | ARF6 | 14 | 49432104 | Promoter | −0.9612 | 0.260 | 0.0420 |
| cg10753610 | ITGB3 | 17 | 42690201 | Body | −0.4113 | 0.489 | 0.0079 |
| cg21494776 | ICAM4 | 19 | 10258780 | Body | 0.4918 | 2.065 | 0.0016 |
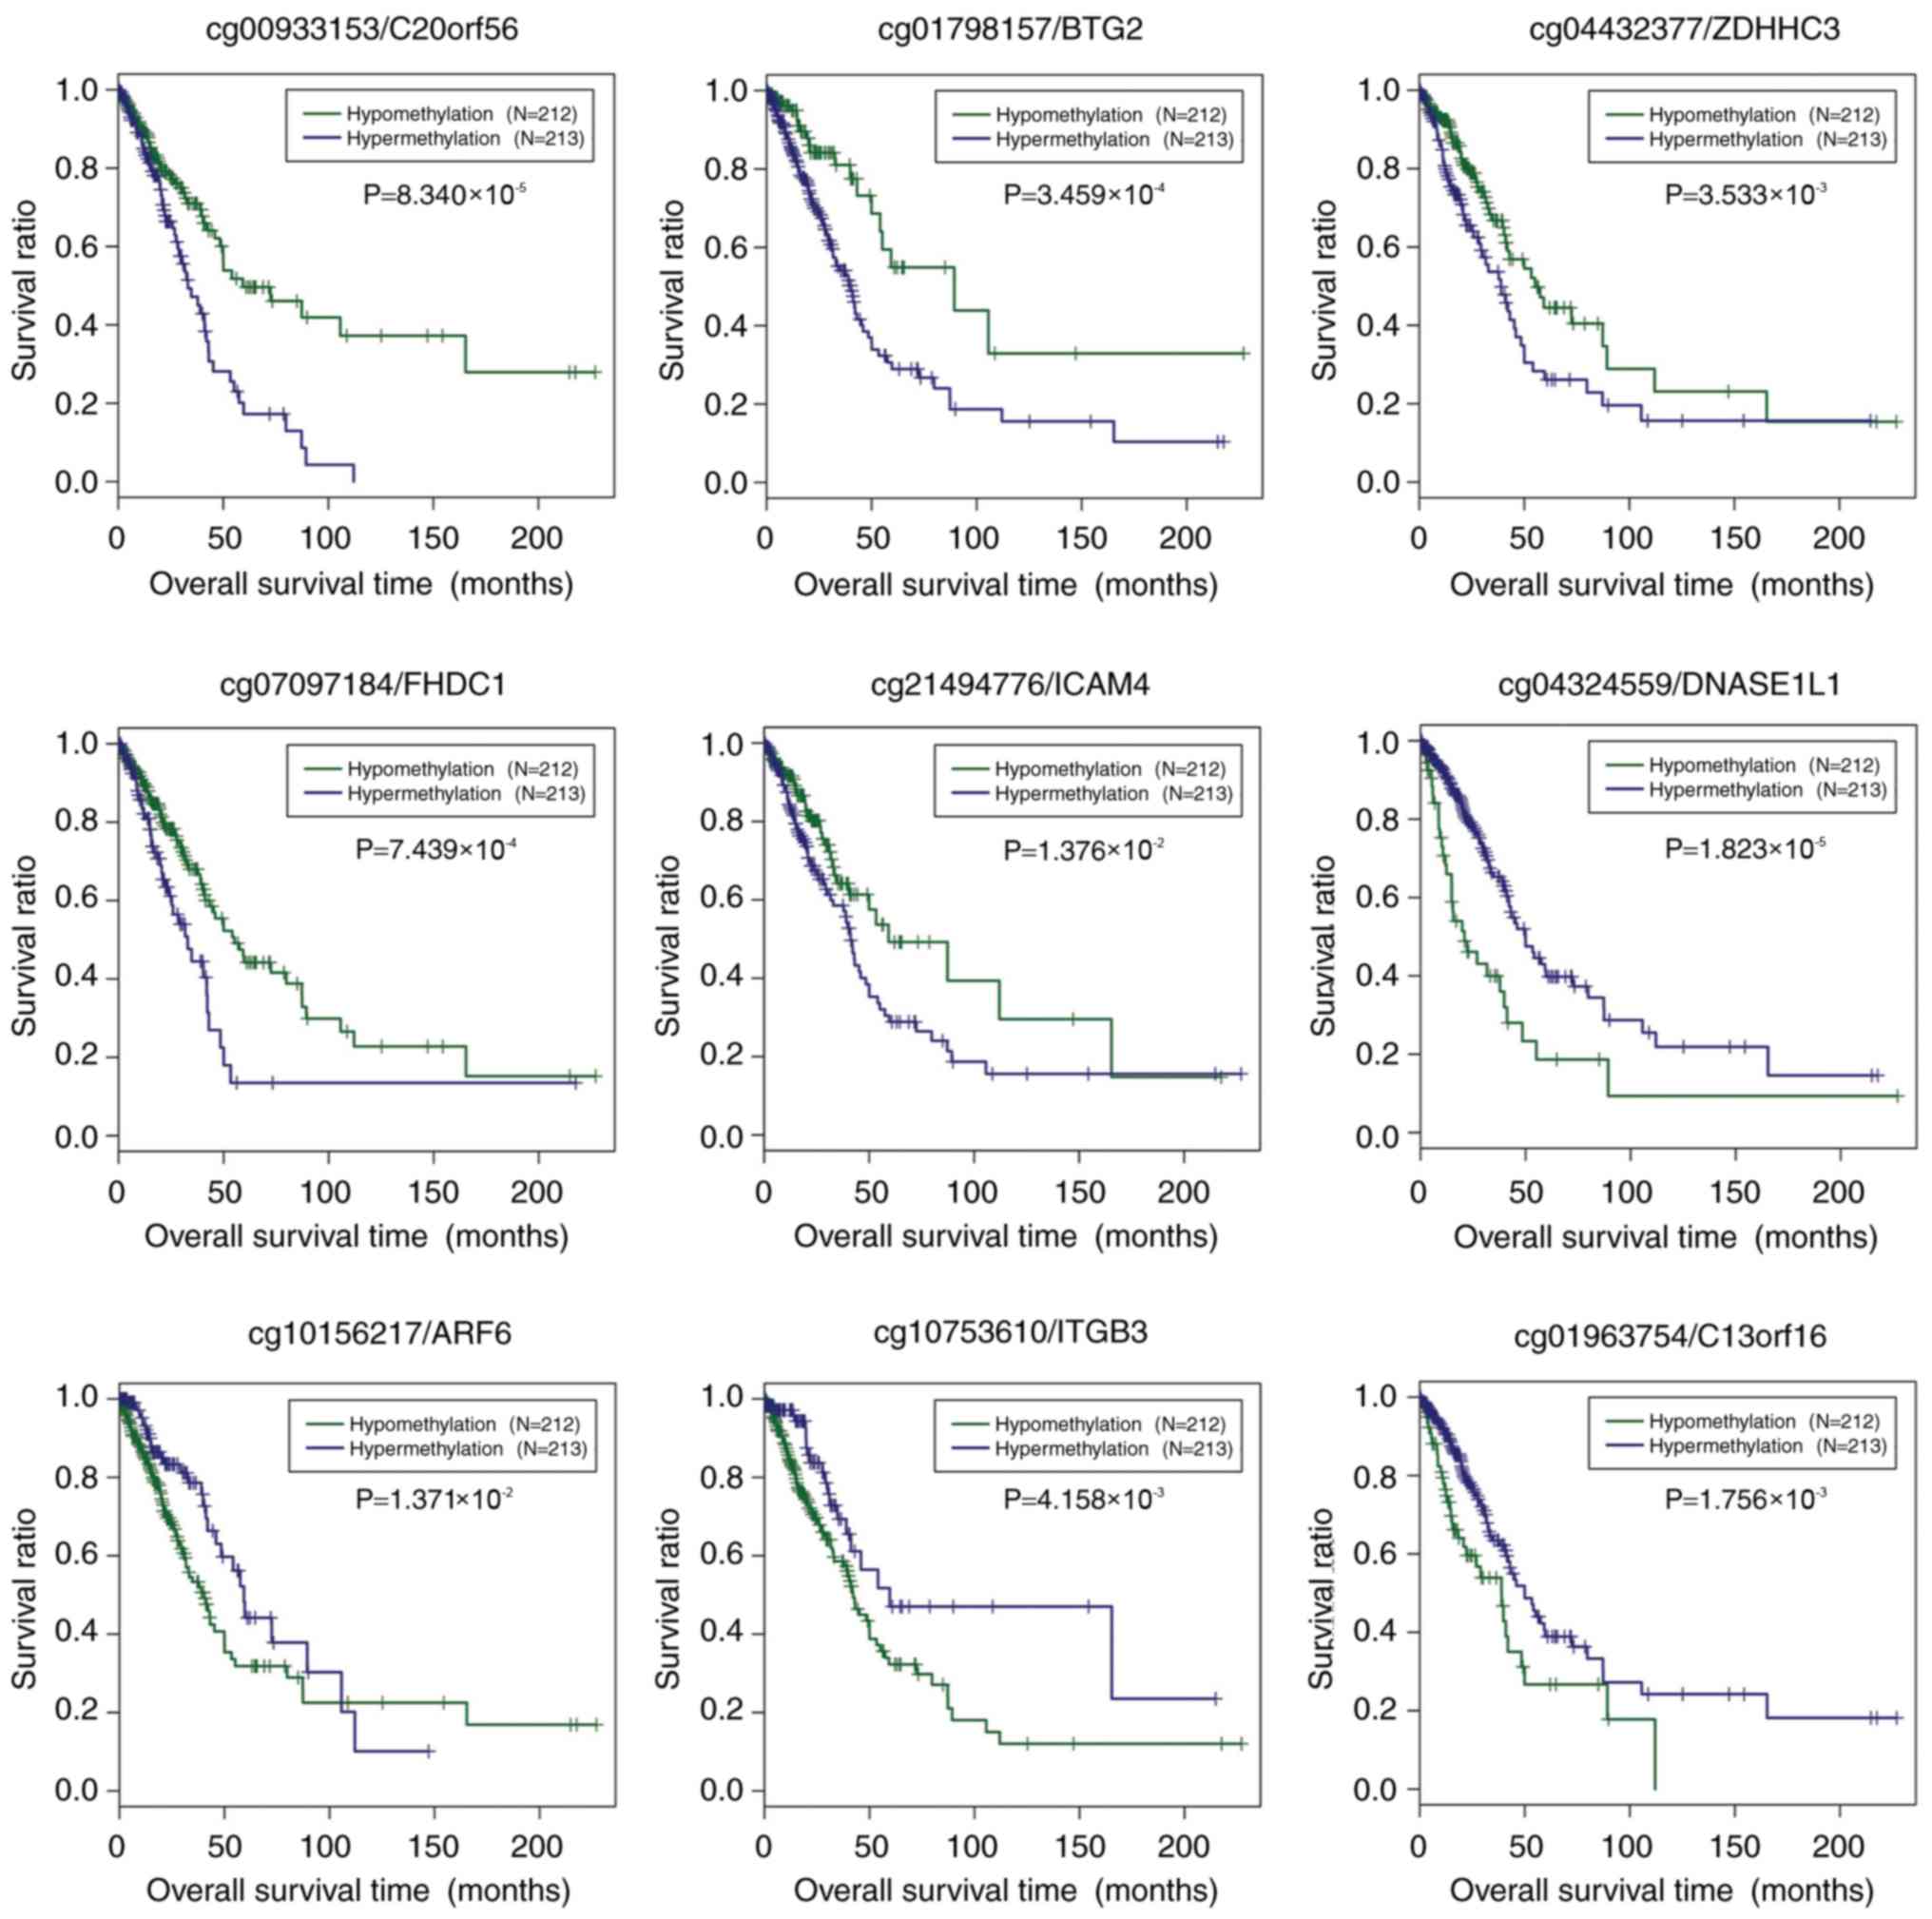
The association of the methylation level of the nine
prognostic genes and survival was investigated. All samples in the
TCGA set were dichotomized into hypermethylated group and
hypomethylated group, based on the median methylation level of each
prognostic gene, separately (Fig.
4). For C20orf56, BTG2, ZDHHC3, FHDC1 and ICAM4,
the hypomethylated samples showed better prognosis compared with
the hypermethylated samples (P<0.05). By contrast, DNASE1L1,
ARF6, ITGB3 and C13orf16 had significantly longer OS
time in the hypermethylated samples relative to the hypomethylated
samples.
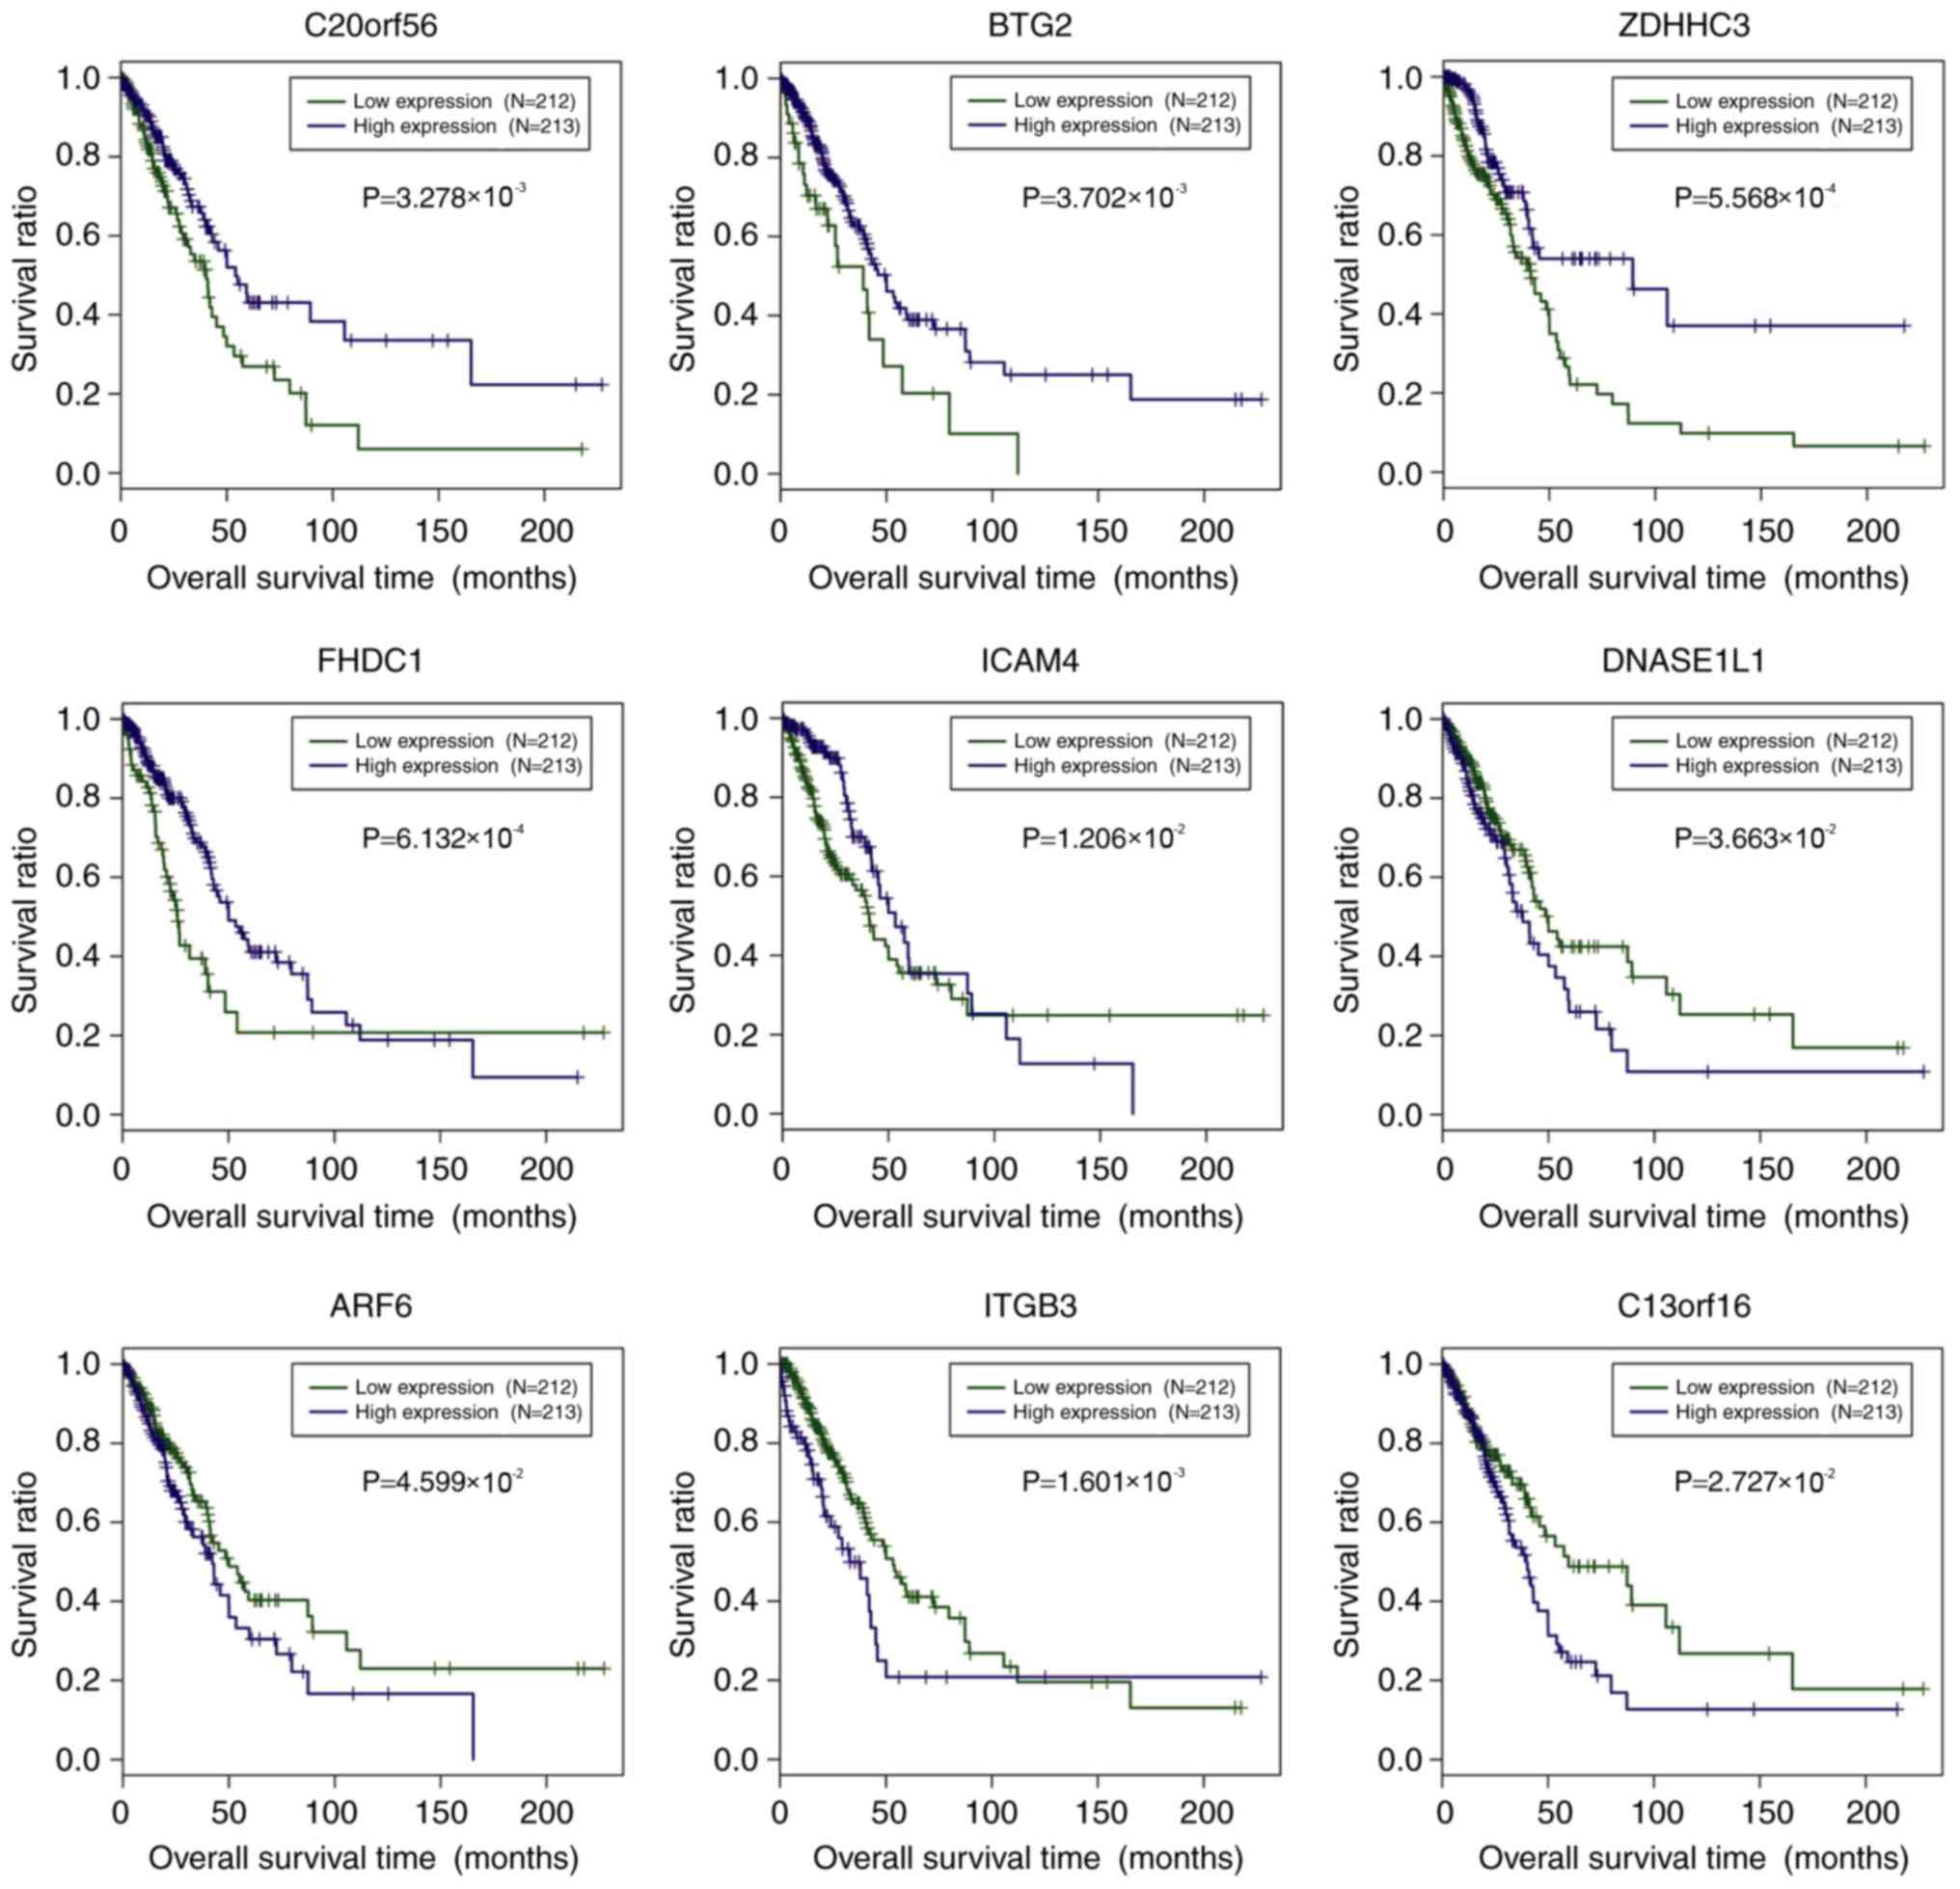
The association between the gene expression level of
the nine predictive genes and prognosis was also underscored.
Specifically, all samples in the training set were divided into a
high- and low-expression group, according to the median expression
level of each gene, separately. High expression of C20orf56,
BTG2, ZDHHC3, FHDC1 and ICAM4 showed significantly
improved prognosis in comparison with low expression samples
(Fig. 5). Concerning DNASE1L1,
ARF6, ITGB3 and C13orf16, improved survival was reported
in the low-expression samples relative to high-expression samples
(Fig. 5). For prognosis
stratification, a prognostic scoring system was developed as
follows: Risk score = (0.8529) × methylationcg00933153 +
(0.9931) × methylationcg01798157 + (−0.5670) ×
methylationcg01963754 + (−0.1602) ×
methylationcg04324559 + (0.6870) ×
methylationcg04432377 + (1.0356) ×
methylationcg07097184 + (−0.9612) ×
Methylationcg10156217 + (−0.4113) ×
methylationcg10753610 + (0.4918) ×
methylationcg21494776.
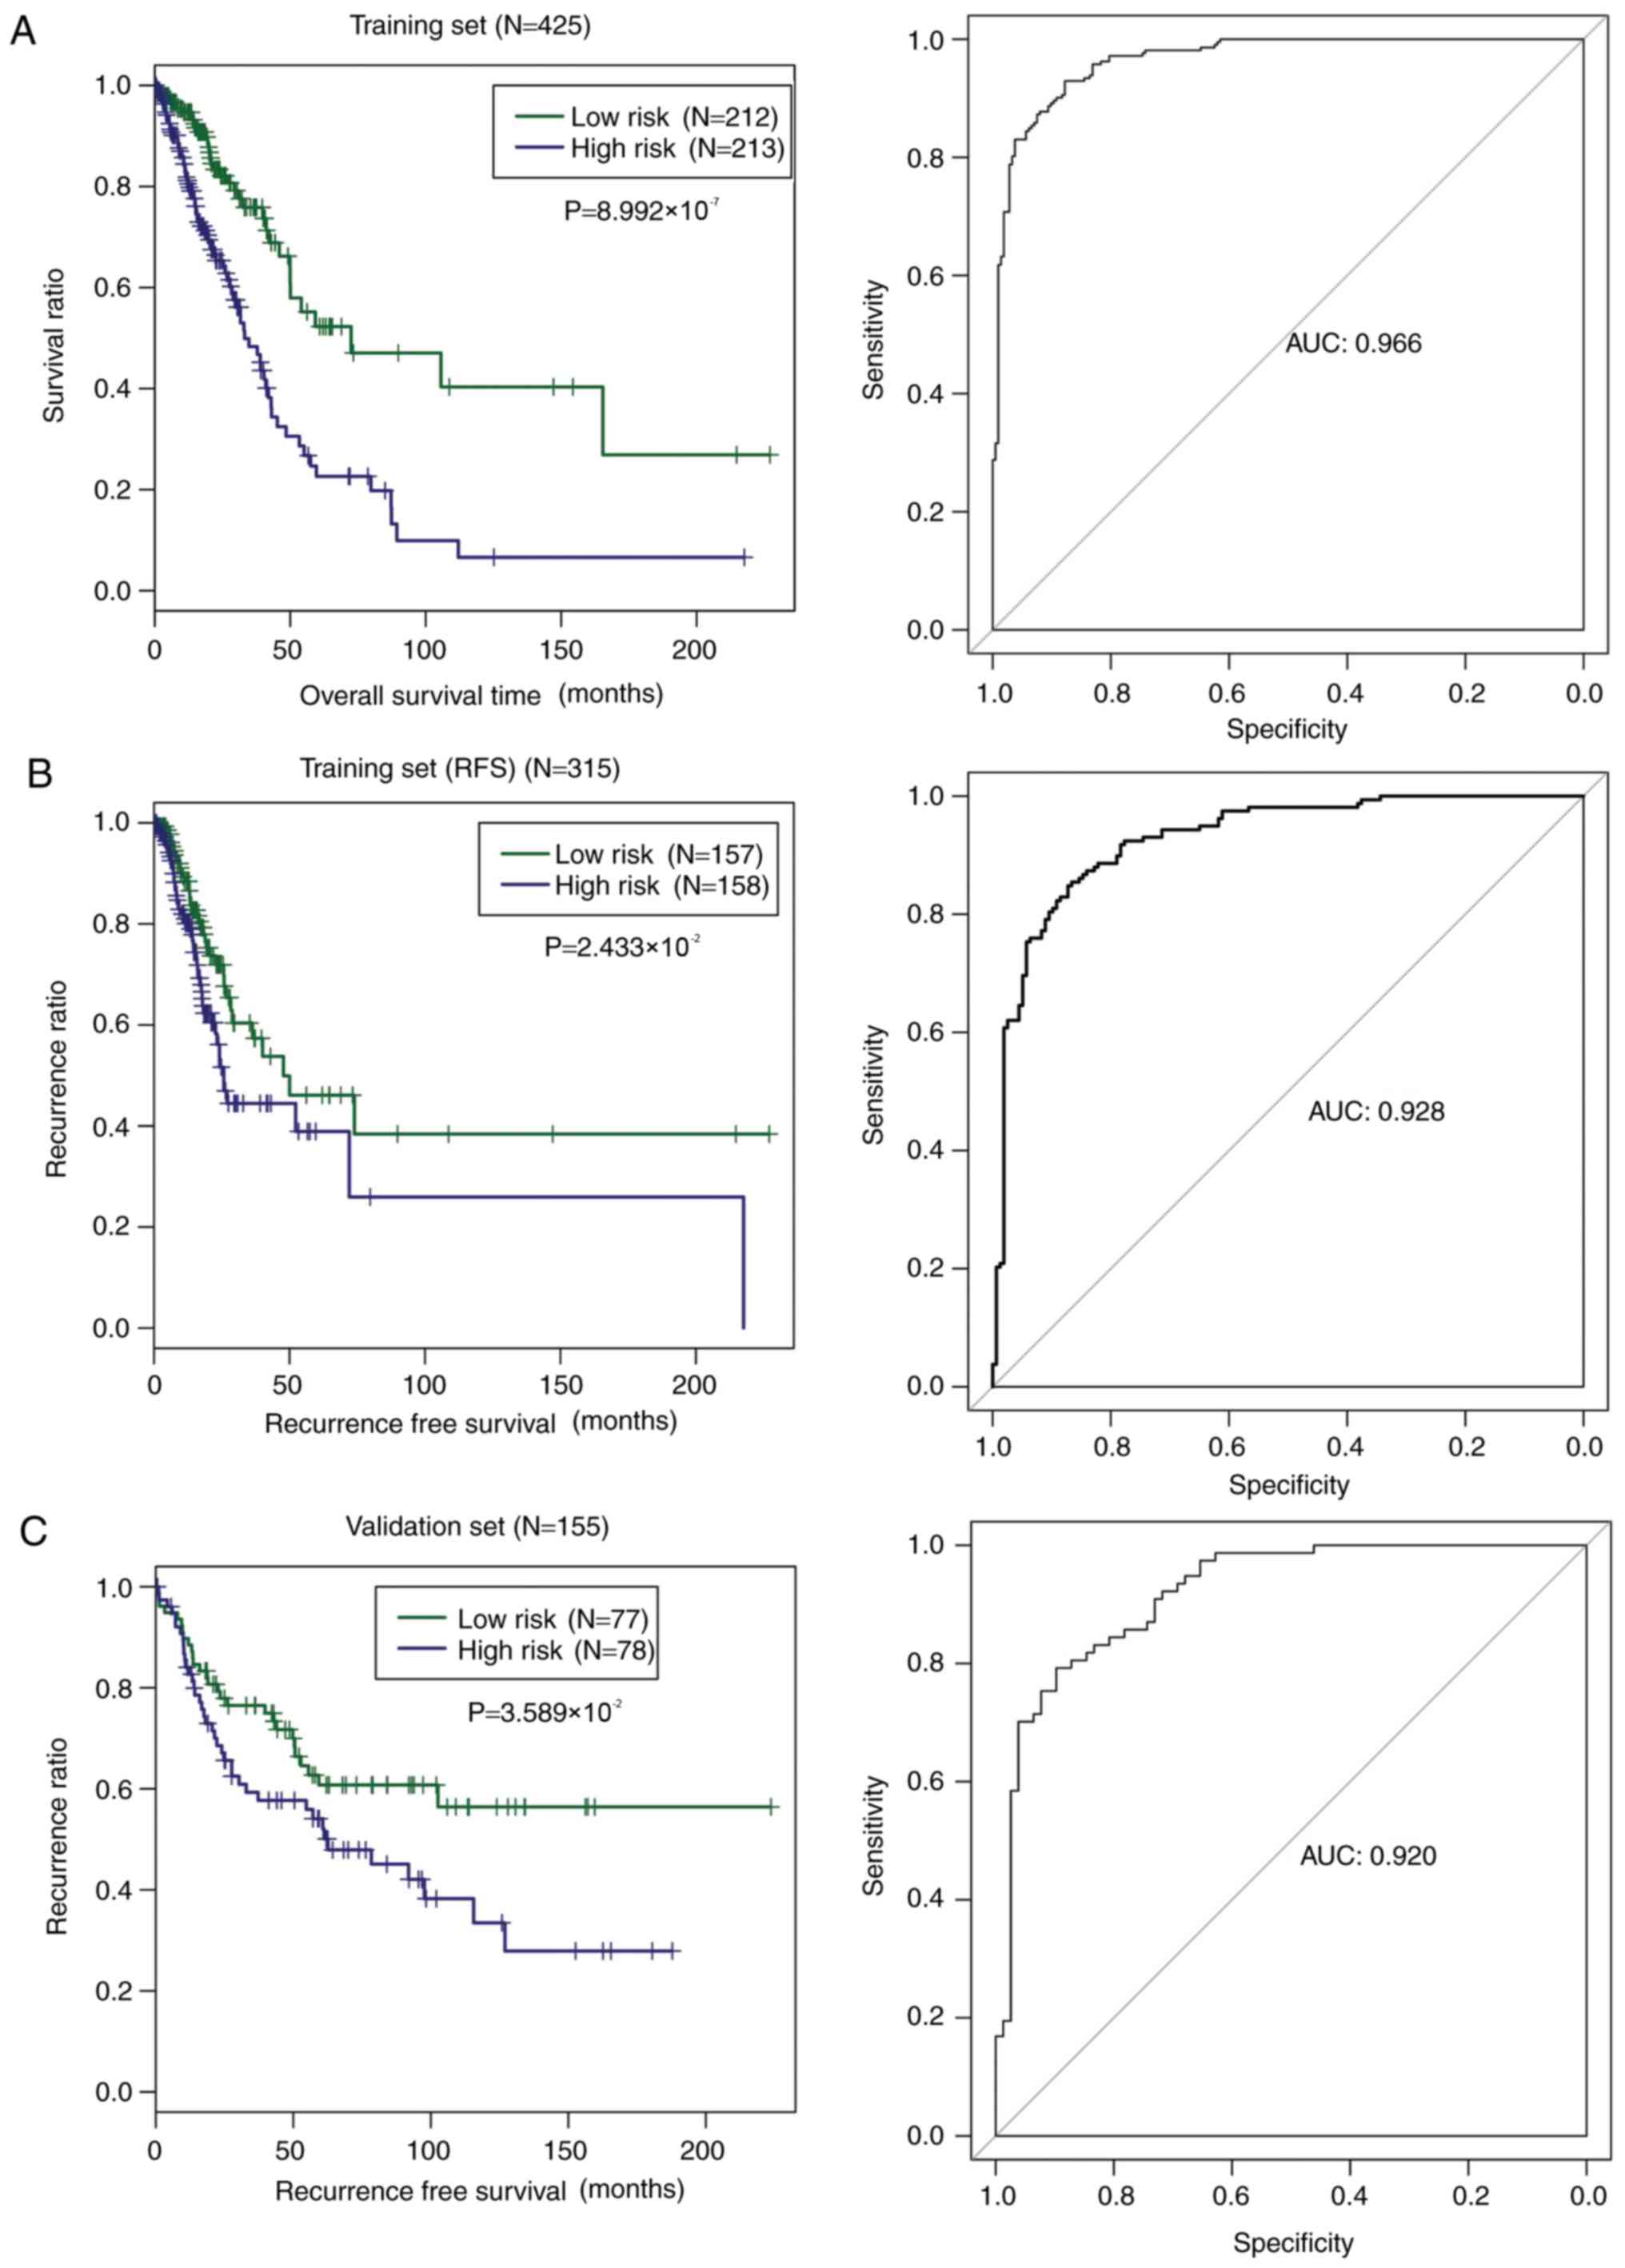
The risk score was calculated for each individual
patient in the TCGA set accordingly. All patients in the TCGA set
were classified into a high- and low-risk group by risk score using
the median risk score of all patients as the cut-off value. As
shown in Fig. 6A, low-risk patients
had significantly longer OS time compared with the high-risk
patients (P=8.992×10⁻⁷), with an AUC value of 0.966. The
nine-gene methylation signature was also applied to predict the
patients' probability of recurrence in the training set. The
low-risk patients had visibly longer RFS time in comparison with
the high-risk patients, with an AUC value of 0.928 (Fig. 6B). In order to test the capability of
the nine-gene methylation signature, all samples in the validation
set were classified by risk score into high- and low-risk groups.
Similarly, low-risk patients had a dramatically longer RFS time
relative to high-risk patients. The AUC value was 0.920 (Fig. 6C), confirming the prognostic power of
the nine-gene methylation signature.
Discussion
LUAD is clinicopathologically and molecularly
heterogeneous, making the prediction of patient outcome a necessity
(22,23). Gene silencing at the epigenetic level
by DNA methylation was acknowledged as an important mechanism
underlying tumorigenesis (24). The
present study placed a special focus on DNA methylation alterations
in LUAD and their implications for prognosis. A total of 742 DMGs
were identified, showing significantly different methylations in
CpGs between the samples designated as good and bad prognosis.
There were three LUAD-associated DNA co-methylation modules mined
by WGCNA. The 121 DMGs in the 3 modules were significantly
associated with 16 GO terms. Notably, three GO terms were
associated with cytoskeleton organization, two GO terms with
transcription and four GO terms with cell apoptosis or death. These
findings provided some insight into the underlying mechanisms of
DNA methylation alterations in LUAD.
The present study identified a nine-gene methylation
signature from the genes included in the three LUAD-associated DNA
methylation modules. Moreover, risk score derived from the sum of
each candidate methylation marker multiplied by the corresponding
regression coefficient successfully classified patients into two
risk groups, with significantly different OS or RFS time. The
prognostic performance of this nine-gene signature was successfully
verified for RFS time in the validation set. These findings
indicate that the nine genes were valuable methylation markers for
prognostic evaluation in LUAD patients.
The nine novel candidate methylation markers for
prognosis prediction included C20orf56, BTG2, C13orf16,
DNASE1L1, ZDHHC3, FHDC1, ARF6, ITGB3 and ICAM4.
Moreover, the present study found that hypomethylation/high
expression of ICAM4, ZDHHC3, C20orf56, BTG2 and FHDC1
was associated with significantly improved survival outcome
compared with hypermethylation/low expression. In contrast,
hypermethylation/low expression of DNASE1L1, ARF6, ITGB3 and
C13orf16 corresponded with significantly improved survival
in comparison with when these genes were hypomethylated/highly
expressed.
BTG2 is involved in various biological
activities, such as cell differentiation, proliferation and
apoptosis, and has been acknowledged as a tumor suppressor in
several types of cancer in humans, including laryngeal carcinoma,
gastric cancer, clear cell renal cell carcinoma and breast
carcinoma (25–29). More importantly, there is evidence
that BTG2 overexpression suppressed the growth and
proliferation of lung cancer cells (30). It can be speculated that aberrant
BTG2 methylation participated in the regulation of genes
involved in LUAD tumor growth. In addition, the present study
implicated two possible functions for BTG2: Response to DNA
damage stimulus and anterior/posterior pattern formation in LUAD.
These findings offer useful information concerning the role of
BTG2 through the regulation of methylation in LUAD.
ARF6 is a member of the human ARF gene
family and plays a role in vesicular trafficking. Increasing
evidence demonstrated an association between ARF6 and tumor
cell invasion (31,32). Moreover, in the present study, GO
analysis showed that ARF6 was significantly implicated in
the positive regulation of cytoskeleton organization, regulation of
cellular component biogenesis, cell death, apoptosis and positive
regulation of organelle organization. Thus, aberrant ARF6
methylation may play a role in the regulation expression of genes
associated with these biological processes in LUAD.
ITGB3, also known as CD61, is a protein encoded by
ITGB3 and participates in cell adhesion and signaling
mediated by the cell surface (33,34). The
present study found that ITGB3 was significantly enriched in
cell junction organization in LUAD. Based on these observations, it
can be inferred that alteration of ITGB3 methylation exerted
an effect on the expression of genes involved in cell junction
organization, thus modulating cell adhesion and cell
surface-mediated signaling. ICAM4 is a member of the ICAMs
family and is critical for inflammation and immune responses
(35). DNASE1L1 is an enzyme encoded
by DNASE1L1, a member of the human DNase family. To the best
of our knowledge, there are few reports regarding the function of
ZDHHC3, C13orf16, C20orf56, FHDC1, ICAM4 and DNASE1L1
in LUAD.
The limitations of the present study include minimal
information on the OS time in the validation set, as other DNA
methylation dataset of LUAD with survival information could not be
located in NCBI GEO. Furthermore, only correlations between DNA
methylation and the gene expression levels were investigated, based
on data of LUAD downloaded from TCGA. Thus, protein expression of
the nine novel candidate methylation markers for prognostic
prediction should be also studied in the future. The aim of the
present study was to provide novel prognostic DNA methylation
biomarkers of LUAD, since the modern precise medicine for the
treatment of LUAD required additional biomarkers and novel
therapeutic targets of interest. However, the findings of the
present study require validation in prospective clinical trials
before the prognostic multigene methylation signature can be
applied. Therefore, Chinese-population-based validation could be
considered in the future.
In conclusion, the present study focused on the DNA
methylation changes associated with LUAD and identified a
prognostic nine-gene methylation signature for LUAD. The findings
shed light on the DNA methylation landscape in LUAD and its
implications on the development of optimized and individualized
management of this condition.
Acknowledgements
Not applicable.
Funding
No funding was received.
Availability of data and materials
The datasets used and/or analyzed during the present
study are available from the corresponding author on reasonable
request.
Authors' contributions
RW and HZ analyzed and interpreted the sequencing
data. MXY conceived and designed the study. CRZ checked the data
analysis results and was a major contributor in writing the
manuscript. All authors read and approved the final manuscript.
Ethics approval and consent to
participate
Not applicable.
Patient consent for publication
Not applicable.
Competing interests
The authors declare that they have no competing
interests.
Glossary
Abbreviations
Abbreviations:
|
LUAD
|
lung adenocarcinoma
|
|
DMGs
|
differentially methylated genes
|
|
WGCNA
|
weighted correlation network
analysis
|
|
OS
|
overall survival
|
|
RFS
|
recurrence-free survival
|
|
NSCLC
|
non-small-cell lung cancer
|
|
TCGA
|
The Cancer Genome Atlas
|
|
PH
|
proportional hazards
|
|
TOM
|
topological overlap matrix
|
|
PCC
|
Pearson correlation coefficient
|
References
|
1
|
Zhou C: Lung cancer molecular epidemiology
in China: Recent trends. Transl Lung Cancer Res. 3:270–279.
2014.PubMed/NCBI
|
|
2
|
Stewart BW and Wild CP: World Cancer
Report 2014IARC; Lyon: 2014
|
|
3
|
Imielinski M, Berger AH, Hammerman PS,
Hernandez B, Pugh TJ, Hodis E, Cho J, Suh J, Capelletti M,
Sivachenko A, et al: Mapping the hallmarks of lung adenocarcinoma
with massively parallel sequencing. Cell. 150:1107–1120. 2012.
View Article : Google Scholar : PubMed/NCBI
|
|
4
|
Reck M, Heigener DF, Mok T, Soria JC and
Rabe KF: Management of non-small-cell lung cancer: Recent
developments. Lancet. 382:709–719. 2013. View Article : Google Scholar : PubMed/NCBI
|
|
5
|
Goodgame B, Viswanathan A, Miller CR, Gao
F, Meyers B, Battafarano RJ, Patterson A, Cooper J, Guthrie TJ,
Bradley J, et al: A clinical model to estimate recurrence risk in
resected stage I non-small cell lung cancer. Am J Clin Oncol.
31:22–28. 2008. View Article : Google Scholar : PubMed/NCBI
|
|
6
|
Robertson KD: DNA methylation and human
disease. Nat Rev Genet. 6:597–610. 2005. View Article : Google Scholar : PubMed/NCBI
|
|
7
|
Kerr KM, Galler JS, Hagen JA, Laird PW and
Laird-Offringa IA: The role of DNA methylation in the development
and progression of lung adenocarcinoma. Dis Markers. 23:5–30. 2007.
View Article : Google Scholar : PubMed/NCBI
|
|
8
|
Zhu XF, Zhu BS, Wu FM and Hu HB: DNA
methylation biomarkers for the occurrence of lung adenocarcinoma
from TCGA data mining. J Cell Physiol. 233:6777–6784. 2018.
View Article : Google Scholar : PubMed/NCBI
|
|
9
|
Han L, Xu G, Xu C, Liu B and Liu D:
Potential prognostic biomarkers identified by DNA methylation
profiling analysis for patients with lung adenocarcinoma. Oncol
Lett. 15:3552–3557. 2018.PubMed/NCBI
|
|
10
|
Sandoval J, Mendez-Gonzalez J, Nadal E,
Chen G, Carmona FJ, Sayols S, Moran S, Heyn H, Vizoso M, Gomez A,
et al: A prognostic DNA methylation signature for stage I
non-small-cell lung cancer. J Clin Oncol. 31:4140–4147. 2013.
View Article : Google Scholar : PubMed/NCBI
|
|
11
|
Kuo IY, Jen J, Hsu LH, Hsu HS, Lai WW and
Wang YC: A prognostic predictor panel with DNA methylation
biomarkers for early-stage lung adenocarcinoma in Asian and
Caucasian populations. J Biomed Sci. 23:582016. View Article : Google Scholar : PubMed/NCBI
|
|
12
|
Ritchie ME, Phipson B, Wu D, Hu Y, Law CW,
Shi W and Smyth GK: Limma powers differential expression analyses
for RNA-sequencing and microarray studies. Nucleic Acids Res.
43:e472015. View Article : Google Scholar : PubMed/NCBI
|
|
13
|
Langfelder P and Horvath S: WGCNA: An R
package for weighted correlation network analysis. BMC
Bioinformatics. 9:5592008. View Article : Google Scholar : PubMed/NCBI
|
|
14
|
Cao J and Zhang S: A bayesian extension of
the hypergeometric test for functional enrichment analysis.
Biometrics. 70:84–94. 2014. View Article : Google Scholar : PubMed/NCBI
|
|
15
|
Huang da W, Sherman BT and Lempicki RA:
Bioinformatics enrichment tools: Paths toward the comprehensive
functional analysis of large gene lists. Nucleic Acids Res.
37:1–13. 2009. View Article : Google Scholar : PubMed/NCBI
|
|
16
|
Huang da W, Sherman BT and Lempicki RA:
Systematic and integrative analysis of large gene lists using DAVID
bioinformatics resources. Nat Protoc. 4:44–57. 2009. View Article : Google Scholar : PubMed/NCBI
|
|
17
|
Eberly LE: Correlation and simple linear
regression. Methods Mol Biol. 404:143–164. 2007. View Article : Google Scholar : PubMed/NCBI
|
|
18
|
Wang P, Wang Y, Hang B, Zou X and Mao JH:
A novel gene expression-based prognostic scoring system to predict
survival in gastric cancer. Oncotarget. 7:55343–55351.
2016.PubMed/NCBI
|
|
19
|
Tibshirani R: The lasso method for
variable selection in the Cox model. Stat Med. 16:385–395. 1997.
View Article : Google Scholar : PubMed/NCBI
|
|
20
|
Goeman JJ: L1 penalized estimation in the
Cox proportional hazards model. Biom J. 52:70–84. 2010.PubMed/NCBI
|
|
21
|
Goel MK, Khanna P and Kishore J:
Understanding survival analysis: Kaplan-Meier estimate. Int J
Ayurveda Res. 1:274–278. 2010. View Article : Google Scholar : PubMed/NCBI
|
|
22
|
Chen Z, Fillmore CM, Hammerman PS, Kim CF
and Wong KK: Non-small-cell lung cancers: A heterogeneous set of
diseases. Nat Rev Cancer. 14:535–546. 2014. View Article : Google Scholar : PubMed/NCBI
|
|
23
|
Greulich H: The genomics of lung
adenocarcinoma: Opportunities for targeted therapies. Genes Cancer.
1:1200–1210. 2010. View Article : Google Scholar : PubMed/NCBI
|
|
24
|
Momparler RL and Bovenzi V: DNA
methylation and cancer. J Cell Physiol. 183:145–154. 2015.
View Article : Google Scholar
|
|
25
|
Mao B, Zhang Z and Wang G: BTG2: A rising
star of tumor suppressors (review). Int J Oncol. 46:459–464. 2015.
View Article : Google Scholar : PubMed/NCBI
|
|
26
|
Liu M, Wu H, Liu T, Li Y, Wang F, Wan H,
Li X and Tang H: Regulation of the cell cycle gene, BTG2, by miR-21
in human laryngeal carcinoma. Cell Res. 19:828–837. 2009.
View Article : Google Scholar : PubMed/NCBI
|
|
27
|
Struckmann K, Schraml P, Simon R,
Elmenhorst K, Mirlacher M, Kononen J and Moch H: Impaired
expression of the cell cycle regulator BTG2 is common in clear cell
renal cell carcinoma. Cancer Res. 64:1632–1638. 2004. View Article : Google Scholar : PubMed/NCBI
|
|
28
|
Takahashi F, Chiba N, Tajima K, Hayashida
T, Shimada T, Takahashi M, Moriyama H, Brachtel E, Edelman EJ,
Ramaswamy S and Maheswaran S: Breast tumor progression induced by
loss of BTG2 expression is inhibited by targeted therapy with the
ErbB/HER inhibitor lapatinib. Oncogene. 30:3084–3095. 2011.
View Article : Google Scholar : PubMed/NCBI
|
|
29
|
Zhang L, Huang H, Wu K, Wang M and Wu B:
Impact of BTG2 expression on proliferation and invasion of gastric
cancer cells in vitro. Mol Biol Rep. 37:2579–2586. 2010. View Article : Google Scholar : PubMed/NCBI
|
|
30
|
Wei S, Hao C, Xin L, Zhao H, Chen J and
Zhou Q: Effects of BTG2 on proliferation inhibition and
anti-invasion in human lung cancer cells. Tumour Biol.
33:1223–1230. 2012. View Article : Google Scholar : PubMed/NCBI
|
|
31
|
Tague SE, Muralidharan V and
D'Souza-Schorey C: ADP-ribosylation factor 6 regulates tumor cell
invasion through the activation of the MEK/ERK signaling pathway.
Proc Natl Acad Sci USA. 101:9671–9676. 2004. View Article : Google Scholar : PubMed/NCBI
|
|
32
|
Muralidharan-Chari V, Hoover H, Clancy J,
Schweitzer J, Suckow MA, Schroeder V, Castellino FJ, Schorey JS and
D'Souza-Schorey C: ADP-ribosylation factor 6 regulates tumorigenic
and invasive properties in vivo. Cancer Res. 69:2201–2209. 2009.
View Article : Google Scholar : PubMed/NCBI
|
|
33
|
Seguin L, Desgrosellier JS, Weis SM and
Cheresh DA: Integrins and cancer: Regulators of cancer stemness,
metastasis, and drug resistance. Trends Cell Biol. 25:234–240.
2015. View Article : Google Scholar : PubMed/NCBI
|
|
34
|
Desgrosellier JS and Cheresh DA: Integrins
in cancer: Biological implications and therapeutic opportunities.
Nat Rev Cancer. 10:9–22. 2010. View Article : Google Scholar : PubMed/NCBI
|
|
35
|
Gahmberg CG, Tolvanen M and Kotovuori P:
Leukocyte adhesion-structure and function of human leukocyte
beta2-integrins and their cellular ligands. Eur J Biochem.
245:215–232. 1997. View Article : Google Scholar : PubMed/NCBI
|