Introduction
Gastric cardia adenocarcinoma (GCA) is characterized
by short disease duration and poor prognosis (1). GCA has a high incidence rate (~3.3 new
cases per 100,000 per year) worldwide (2), and is much higher in China, with 49.59
new cases per 100,000 per year (3).
GCA presents with non-specific symptoms at the early stages of the
disease, and the majority of patients are diagnosed at an advanced
stage; consequently, patients with GCA have a low survival rate
(4,5). Previous studies have revealed that
early diagnosis and treatment of GCA improves patient outcomes and
results in a more favorable prognosis (6,7). The
currently available methods for the early diagnosis of GCA include
barium X-ray radiography (8,9), endoscopy (10,11),
abdominal ultrasound (12), spiral
computed tomography (13,14) and proton nuclear magnetic resonance
(15,16). However, these methods are invasive
and not cost-effective (17).
Therefore, there is a requirement for a non-invasive,
cost-effective and efficient method to diagnose early GCA and
improve patient prognosis.
Systems biology and high-throughput screening
methods have revealed that the incidence of GCA is associated with
mutations in tumor protein P53 (18,19) and
the vitamin D receptor (20), as
well as polymorphisms in the Fas ligand gene (21) and thymidylate synthase (22). In addition, proteins such as cancer
antigen 125 and minichromosome maintenance 5 serve as potential
biomarkers for the early diagnosis of GCA (23,24).
However, the aforementioned genes and proteins lack specificity and
sensitivity, and previous studies have revealed that a single
biomarker is unlikely to accurately diagnose GCA (23,25).
Laser capture microdissection-based proteome analysis on human GCA
tissues revealed that 23 proteins are abnormally expressed in
patients with GCA compared with healthy controls (26). Metabolomics has been widely applied
for the diagnosis for several types of cancer, including colorectal
(27,28), liver (29), pancreatic (30,31) and
gastric (32,33) cancer. However, a limited number of
studies have investigated a metabolomics-based approach for the
diagnosis of GCA (34,35). Cai et al (34) have suggested that the metabolites and
proteins associated with glycolysis may serve as potential
biomarkers for the diagnosis of GCA; however, an established
diagnostic model has not been reported.
The present study aims to identify potential
biomarkers for the early detection of GCA. The ultra-performance
liquid chromatography/quadrupole-time-of-flight mass spectrometry
(UPLC/Q-TOF MS) was utilized to establish the metabolic
fingerprints of patients with GCA and healthy controls, and the
specific biomarkers associated with GCA were screened to develop an
early diagnostic model. Furthermore, metabolic pathway analysis was
performed to investigate the pathways associated with the
pathogenesis of GCA.
Materials and methods
Chemicals
Isopropanol [high-performance liquid chromatography
(HPLC)-grade], acetonitrile (HPLC-grade), methanol (HPLC-grade) and
formic acid (98%) were purchased from J.T. Baker; Avantor, Inc. The
internal standard L-2 chlorophenylalanine was obtained from Ark
Pharm, Inc. and ultrapure water was purchased from EMD
Millipore.
Clinical samples
The present study was approved by the Ethics
Committee of the People's Hospital of Yangzhong City (Yangzhong,
China) and all participants provided written informed consent.
Plasma samples were obtained from 21 patients with GCA (14 males
and 7 females; mean age, 66 years; age range, 60–80 years) and 48
healthy volunteers (14 males and 34 females; mean age, 52.15 years;
age range, 40–68 years) at the People's Hospital of Yangzhong City
between July and December 2015. Patients with GCA were diagnosed by
gastroscopy and had not received chemotherapy or other therapy,
including surgery and radiotherapy. A mucosal biopsy was performed
to classify patients according to the Tumor-Node-Metastasis (TNM)
Classification of Malignant Tumors (36). The clinical information of the
participants is summarized in Table
I.
 | Table I.Clinical information of the enrolled
subjects. |
Table I.
Clinical information of the enrolled
subjects.
|
Characteristics | Healthy | GCA |
|---|
| Sex
(male/female) | 14/34 | 14/7 |
| Age, years | 52.15±6.96 | 66.00±8.48 |
| TNMa stage |
|
|
| IA | – | 2 |
| IB | – | 1 |
| IIA | – | 1 |
| IIIA | – | 7 |
| IIIC | – | 9 |
| IV | – | 1 |
A total of 5 ml peripheral venous blood was obtained
from the participants and collected in anticoagulation tubes
containing heparin sodium. The blood was centrifuged at 670 × g for
15 min at 4°C, and the supernatant was collected and stored at
−80°C until further analysis.
Sample preparation
Plasma samples were thawed on ice prior to analysis.
A total of 100 µl plasma was added to 300 µl methanol and
acetonitrile mixture (1:1) containing 5 µg/ml L-2
chlorophenylalanine internal standard, which was used to check the
integrity of the automated integration and to assess instrument
performance throughout the batch analysis. The mixture was vortexed
for 30 sec and maintained at 4°C for 1 h, vortexed again for 30 sec
and maintained at 4°C for 3 h. The mixture was vortexed and
centrifuged at 37,730 × g for 10 min at 4°C. Subsequently, 300 µl
of the supernatant was centrifuged at 37,730 × g for 10 min at 4°C,
and 200 µl supernatant was decanted into a vial with an inner
cannula.
To monitor the robustness of sample preparation and
the stability of instrument analysis, a quality control (QC) sample
was prepared by pooling 10 µl plasma from all samples.
UPLC-Q/TOF MS analysis
The UPLC analysis was performed in a Waters Acquity™
Ultra-performance LC system coupled with a Waters Micromass™ Q/TOF
MS (Waters Corporation). The chromatographic separation was
performed on an ACQUITY BEH-C18 column (2.1×100 mm; 1.7 µm; Waters
Corporation). The mobile phase is composed of (A) 0.1% formic acid
and (B) isopropanol, acetonitrile and methanol [20:40:40 (v/v)] in
0.1% formic acid, and the gradient was used as follows: 98–50% (A)
and 2–50% (B) for 0–3.5 min; 50–0% (A) and 50–100% (B) for 3.5–20
min. The flow rate was 0.4 ml/min. The temperature of the
autosampler and the chromatographic column was maintained at 4 and
50°C, respectively. A total of 5 µl sample solution was injected
per run. The MS scan ranged from 50–1,000 m/z in the positive and
negative ion mode. The cone and capillary voltages were set at 35 V
and 3.0 kV for positive ionization mode, and 35 V and 2.8 kV for
negative ionization mode. The collision energy was set at 4 eV. A
desolvation gas flow rate of 600 l/h at 115°C was used. The data
acquisition rate was set to 0.3 spec/sec. Data acquisition was
performed using Waters MassLynx software (version 4.1; Waters
Corporation).
Data processing
Prior to statistical analysis, raw data were
imported into the Progenesis QI software package (version 2.0;
Waters Corporation) for data standardization. The orthogonal
partial least squares discriminant analysis (OPLS-DA) model was
performed using SIMCA software (version 14.1; Umetrics Ltd.).
Potential biomarkers were identified from loading plots constructed
following analysis with OPLS-DA, and the biomarkers were selected
based on the variable importance in the projection (VIP) value. The
model parameters of R2Y(cum) is used to estimate the ‘goodness of
fit’ of the model, and Q2 (cum) estimates the ability of
prediction. The S-plot is used to visualize both the covariance and
the correlation structure between the X-variables and the
predictive score t[1]. Thus, the S-plot is a scatter plot of the
p[1] vs. p(corr)[1] vectors of the predictive component. A response
permutation test with 200 iterations was performed to assess the
risk that the current OPLS-DA model is spurious. The structure of
the differential metabolites was identified using the Human
Metabolome Database (HMDB; version 4.0; www.hmdb.ca/spectra/ms/search) and The LIPID MAPS
Lipidomics Gateway (updated March 9th, 2016; www.lipidmaps.org) based on secondary mass
spectrometry information.
Statistical analysis
Statistical analyses were performed using SPSS
software (version 19.0; IBM Crop.). Student's t-test was performed
to compare the differences in metabolite levels between healthy
subjects and patients with GCA. P<0.05 was considered to
indicate a statistically significant difference. The diagnostic
abilities of the biomarkers were assessed by systematic cluster
analysis, receiver operating characteristic (ROC) curves and binary
logistic regression. In addition, the pathway analysis module of
MetaboAnalyst software (version 4.0; www.metaboanalyst.ca) (37) was used to analyze significant
metabolic pathways, which has pathway impact value of no less than
0.1 and -log(p) value of no less than 2.
Results
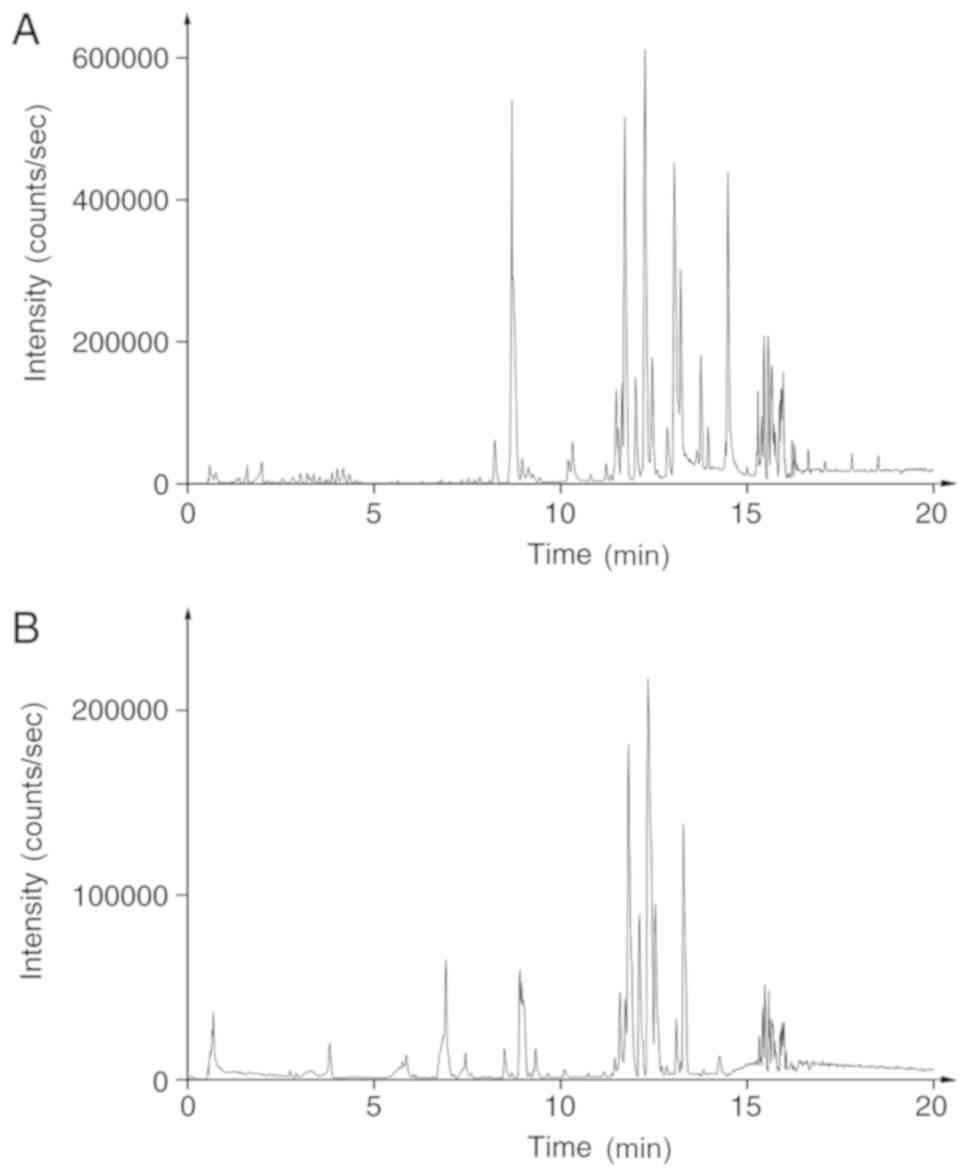
UPLC-Q/TOF MS analysis of plasma
samples
A total of 69 samples were analyzed in a random
order, and QCs were inserted into the analysis sequence to monitor
and correct changes in the instrument response. To identify and
remove probable characteristic peaks caused by source contaminants,
test tube components or solvent impurities, blank samples were
inserted every 10 runs. Analyses were performed in the positive and
negative ion mode (Fig. 1).
The method validation was performed based on
precision and stability testing, which permitted <10% relative
standard deviation. The results demonstrated the stability of the
instrument and the samples (Tables
SI–SIV).
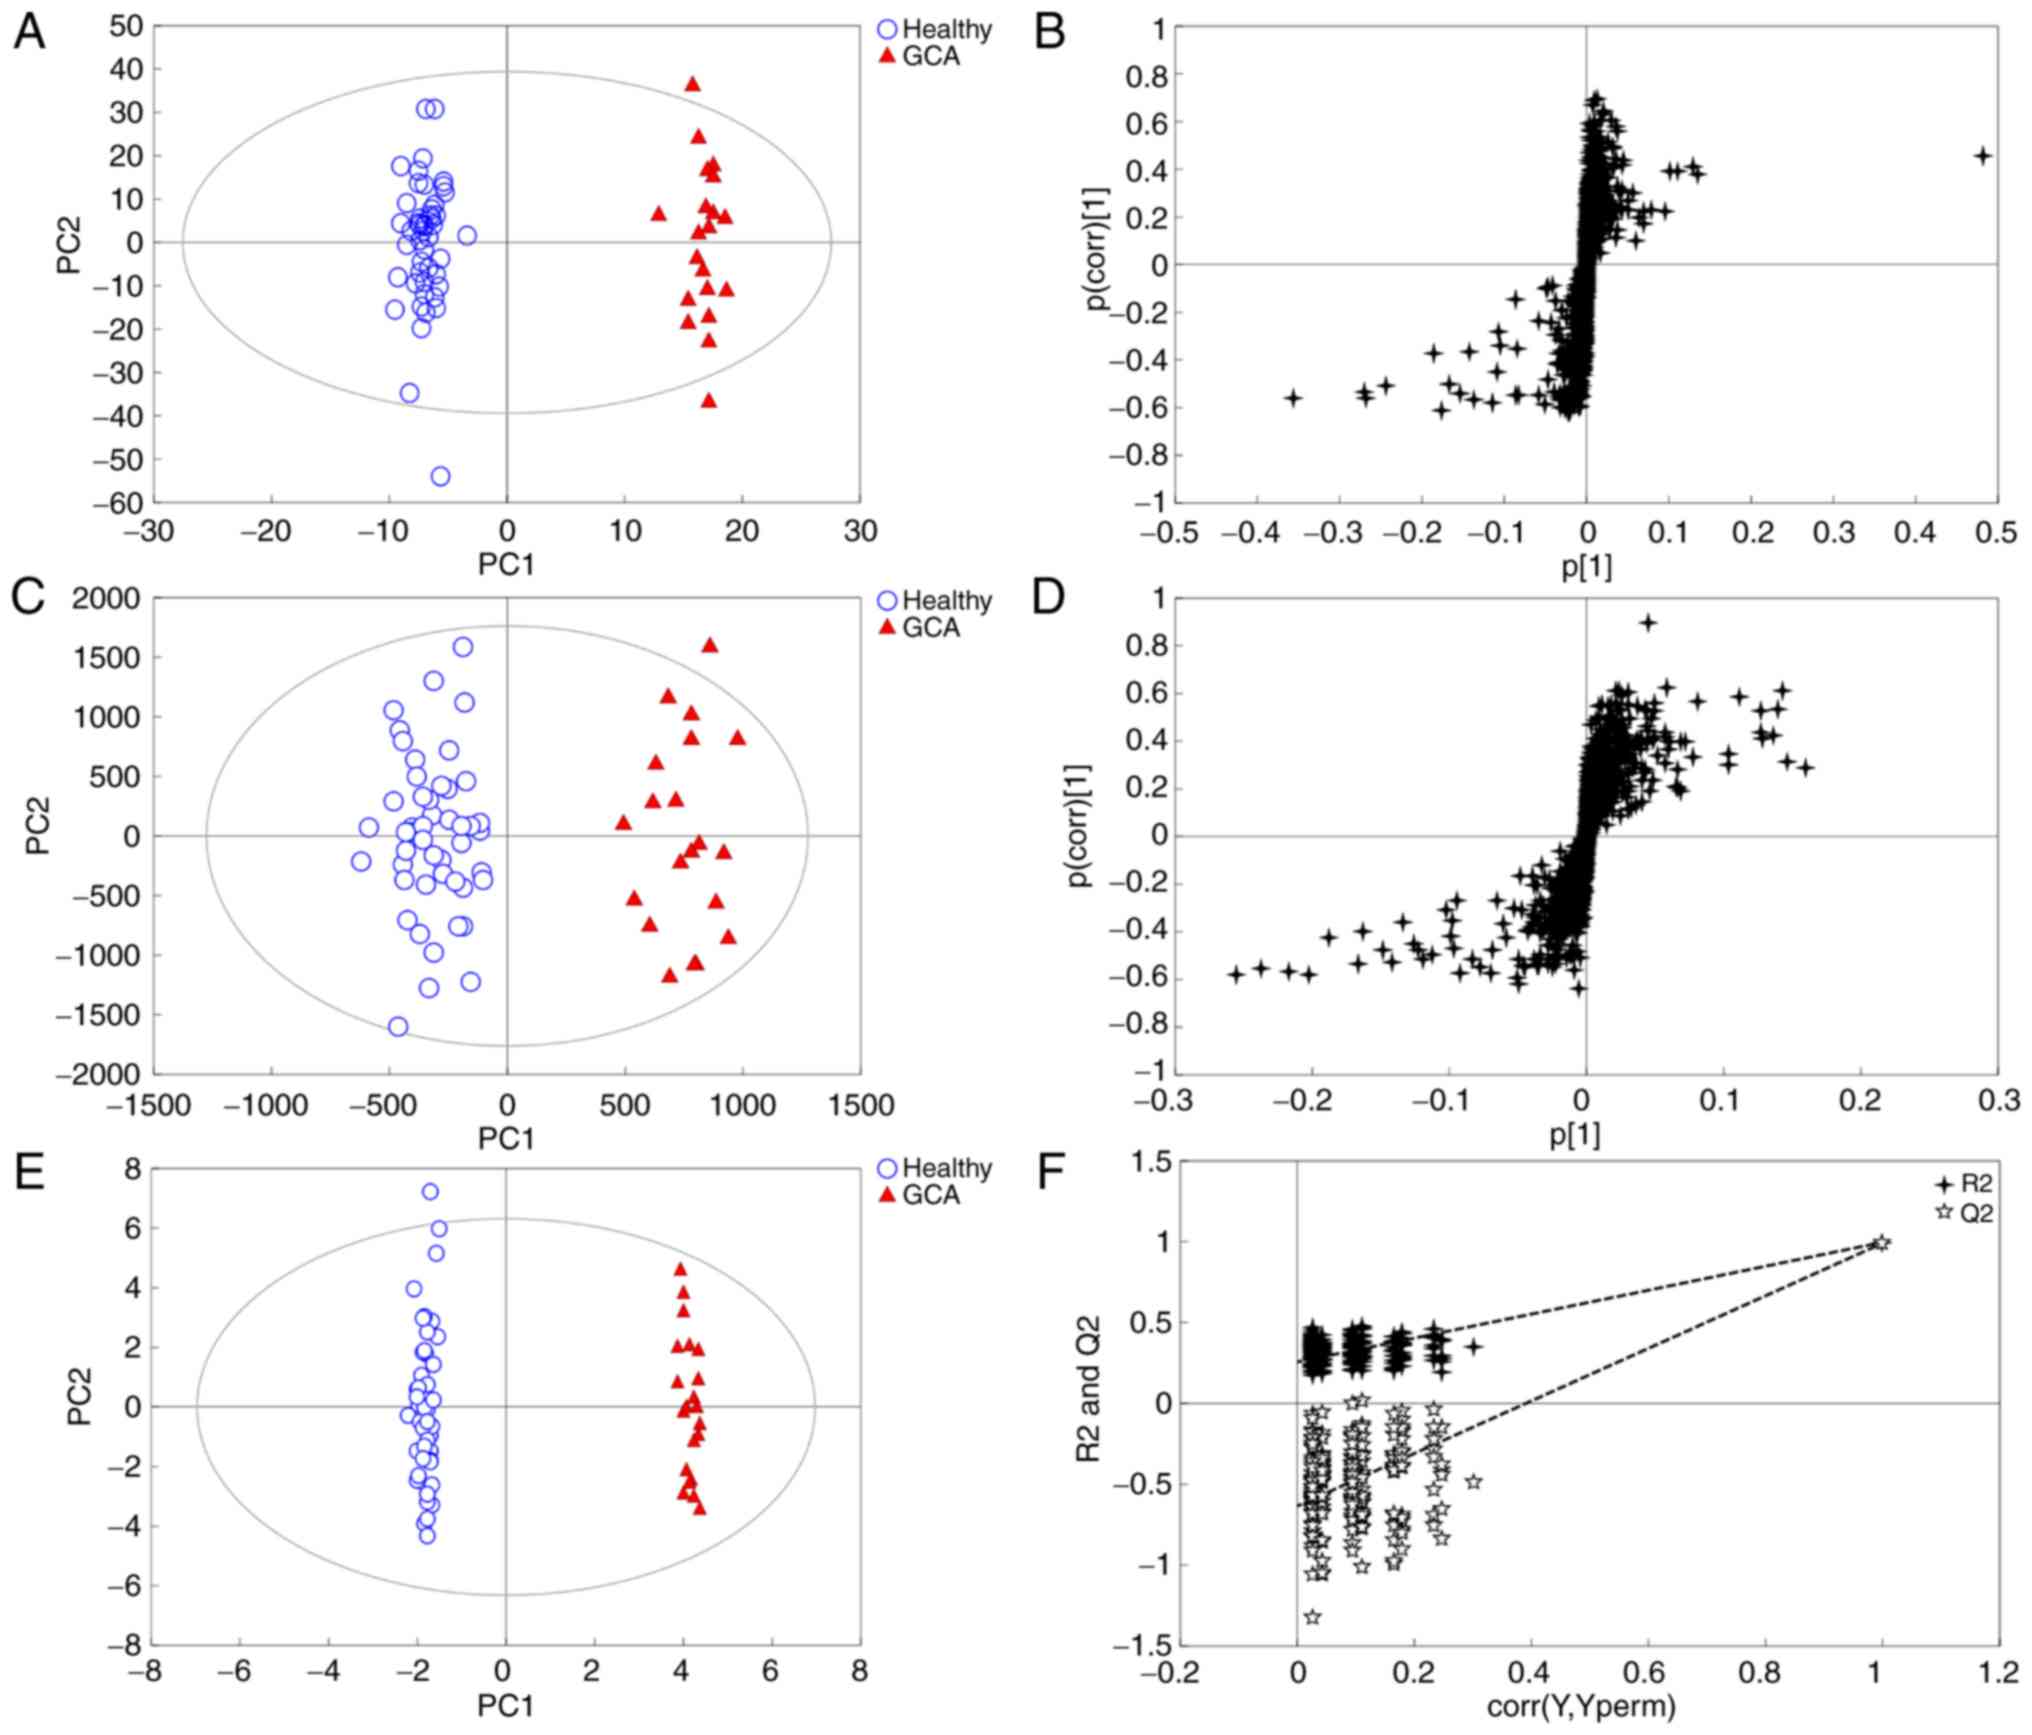
Multivariate statistical analysis
In the present study, multivariate statistical
analysis and pattern recognition methods, principal component
analysis (PCA) and OPLS-DA, were used to analyze the metabolomics
data. PCA resulted in poor distinction between patients and healthy
subjects (Fig. S1). The OPLS-DA
model was subsequently applied to the metabolomics data to
eliminate interference from various non-experimental factors,
including sex and age. The model exhibited a trend for
distinguishing between patients with GCA and controls (Fig. 2A and B). The model parameters of
R2Y(cum) and Q2 (cum) were 89.6 and 62.1% in the negative pattern
and 73.1 and 55.4% in positive pattern, respectively, which
indicated that the model had a good fit and predictive ability.
Identification of potential
biomarkers
A total of 27 differential metabolites based on VIP
>1 with S-plot (Fig. 2C and D)
and P<0.05 (Table II), including
L-acetylcarnitine, arachidonic acid, phosphorylcholine and
glycocholic acid, were identified and used to establish the OPLS-DA
model (Fig. 2E). This model was able
to clearly distinguish patients with GCA from healthy subjects
(99.7 and 99.2% for R2Y and Q2, respectively), and compared with
Fig. 2A and B, the clustering effect
was improved. Following the 200 iterations of the permutation test,
the results revealed that the OPLS-DA model did not result in
overfitting as the left replacement R2 and Q2 values were lower
than the original point on the right, and the Q2 intercept was
<0 (Fig. 2F). Therefore, the
identified 27 differential metabolites may serve as potential
biomarkers for the diagnosis of GCA.
| Table II.Potential biomarkers identified using
variable importance in the projection >1 and P<0.05 as
cut-off values. |
Table II.
Potential biomarkers identified using
variable importance in the projection >1 and P<0.05 as
cut-off values.
|
|
|
|
|
|
| Relative
content |
|---|
|
|
|
|
|
|
|
|
|---|
| No. | Retention time,
min | Transitions,
m/z | Metabolite | Compound ID | Formula | Healthy | GCA | Tendency |
|---|
| 1 | 0.705 | 204.1238 |
L-Acetylcarnitine | HMDB00201 |
C9H17NO4 | 10772.0±3213.5 | 17417.0±9987.9 | Up |
| 2 | 2.311 | 203.0824 | L-Tryptophan | HMDB00929 |
C11H12N2O2 | 10400.0±1889.4 | 7700.6±2411.7 | Up |
| 3 | 2.805 | 165.0553 |
Phosphorylcholine | HMDB01565 |
C5H15NO4P+ | 2323.9±1578.1 | 62.7±107.2 | Down |
| 4 | 2.908 | 239.0917 | N-Acetyl-L-aspartic
acid | HMDB00812 |
C6H9NO5 | 1883.9±1057.6 | 774.6±639.0 | Down |
| 5 | 3.804 | 464.3020 | Glycocholic
acid | HMDB00138 |
C26H43NO6 | 1875.3±2860.8 | 243.2±430.6 | Down |
| 6 | 3.959 | 316.2488 |
Decanoylcarnitine | HMDB00651 |
C17H33NO4 | 3228.3±2037.3 | 1535.4±1076.9 | Down |
| 7 | 4.309 | 448.3076 |
Glycoursodeoxycholic acid | HMDB00708 |
C26H43NO5 | 6251.0±7940.5 | 1462.8±1572.0 | Down |
| 8 | 5.575 | 502.2943 | LysoPE
(18:0/0:0) | HMDB11130 |
C23H48NO7P | 2441.3±1604.9 | 1232.6±1170.7 | Down |
| 9 | 5.647 | 512.2998 | LysoPC (14:0) | HMDB10379 |
C22H46NO7P | 2085.0±1076.3 | 927.0±695.2 | Down |
| 10 | 5.863 | 494.3253 | LysoPC
(16:1(9Z)) | HMDB10383 |
C24H48NO7P | 7636.3±3484.4 | 4788.1±3245.4 | Down |
| 11 | 6.059 | 476.2783 | LysoPE
[18:2(9Z,12Z)/0:0] | HMDB11507 |
C23H44NO7P | 1907.3±584.3 | 1107.1±615.8 | Down |
| 12 | 6.306 | 530.3256 | LysoPE
(0:0/20:0) | HMDB11481 |
C25H52NO7P | 1435.2±734.00 | 615.1±489.4 | Down |
| 13 | 6.636 | 522.3590 | LysoPC
(18:1(9Z)) | HMDB02815 |
C26H52NO7P | 17304.0±3917.6 | 13519.0±5793.0 | Down |
| 14 | 6.749 | 452.2790 | LysoPE
(16:0/0:0) | HMDB11503 |
C21H44NO7P | 9912.0±3133.2 | 7441.4±2151.0 | Down |
| 15 | 6.749 | 454.2938 | PC (13:0/0:0) | LMGP01050001 |
C21H44NO7P | 5164.7±1852.0 | 3637.4±1291.2 | Down |
| 16 | 6.831 | 506.3347 |
Glucosylsphingosine | HMDB00596 |
C24H47NO7 |
87740.0±24187.0 |
65800.0±32818.0 | Down |
| 17 | 7.377 | 508.3429 | LysoPE
(20:0/0:0) | HMDB11511 |
C25H52NO7P | 15944.0±3227.1 | 11173.0±3174.6 | Down |
| 18 | 7.479 | 279.2357 | Linoleic acid | HMDB00673 |
C18H32O2 |
30629.0±12293.0 | 48714.0±20640 | Up |
| 19 | 7.48 | 325.2127 | Eicosapentaenoic
acid | HMDB01999 |
C20H30O2 | 6963.6±1390.8 | 9555.2±1956.8 | Up |
| 20 | 7.635 | 482.3253 | LysoPC (15:0) | HMDB10381 |
C23H48NO7P | 8755.0±2666.9 | 6452.4±2019.7 | Down |
| 21 | 7.963 | 255.2328 | Palmitic acid | HMDB00220 |
C16H32O2 | 9627.4±2268.2 | 11912.0±2825.9 | Up |
| 22 | 8.057 | 305.2453 | Oleic acid | HMDB00207 |
C18H34O2 | 3682.3±1394.0 | 6233.2±2806.1 | Up |
| 23 | 8.067 | 349.2362 | Arachidonic
acid | HMDB01043 |
C20H32O2 | 10783.0±1696.6 | 13668.0±1853.6 | Up |
| 24 | 9.538 | 774.5313 | PC
[14:1(9Z)/18:1(9Z)] | HMDB07906 |
C40H76NO8P | 4350.9±1504.6 | 2188.9±1750.0 | Down |
| 25 | 10.424 | 834.6118 | Cholic acid | HMDB00619 |
C24H40O5 |
115535.0±41829.0 |
77787.0±26499.0 | Down |
| 26 | 13.534 | 182.9840 |
Selenohomocysteine | HMDB04119 |
C4H8NO2Se | 16307.0±1652.6 | 17852.0±2159.8 | Up |
| 27 | 14.811 | 118.0863 | L-valine | HMDB00883 |
C5H11NO2 | 17456.0±2332.0 | 19214.0±2771.1 | Up |
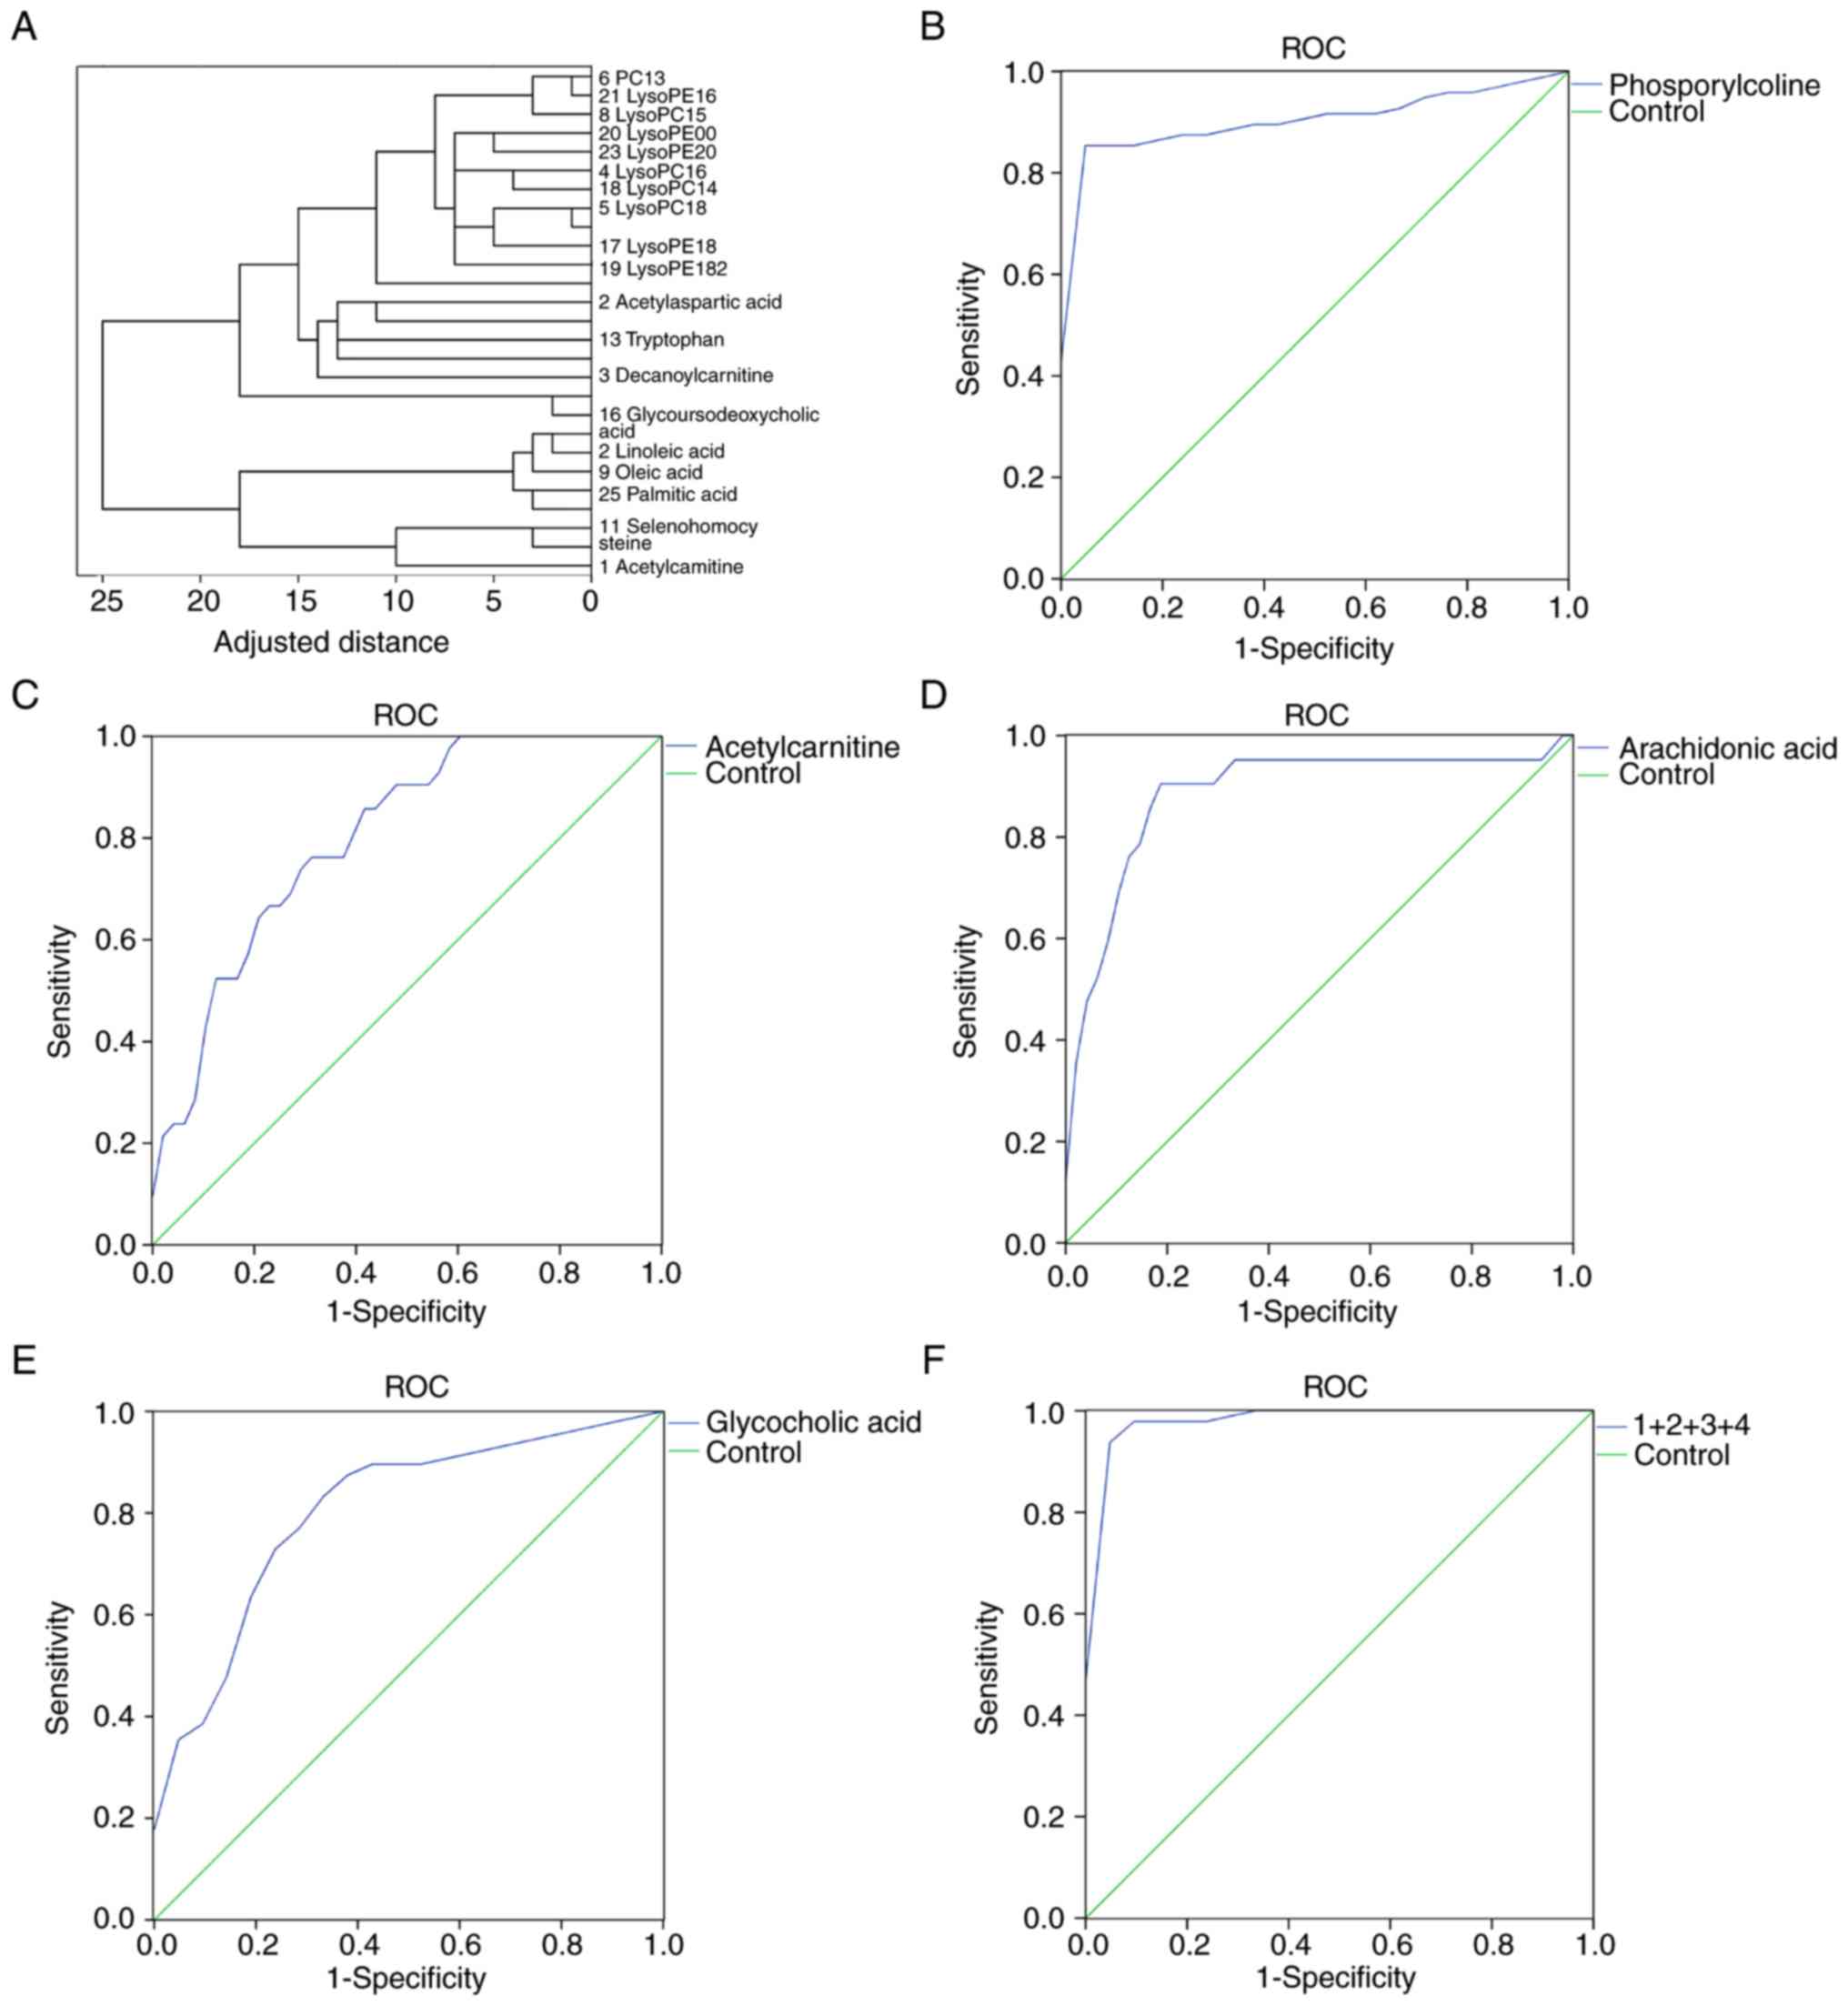
Cluster analysis revealed that the 27 potential
biomarkers could be divided into four categories: i) Phospholipids
(including phosphorylcholine); ii) cholic acid (including
glycocholic acid); iii) unsaturated fatty acids (including
arachidonic acid); and iv) amino acids (including
L-acetylcarnitine; Fig. 3A). ROC
curve analysis was performed for the candidate biomarkers, and the
area under the curve (AUC), sensitivity and specificity were
determined (Tables III and
SV). Phosphorylcholine, glycocholic
acid, arachidonic acid and L-acetylcarnitine had the largest AUC
values (0.913, 0.808, 0.887 and 0.803, respectively), and were thus
selected for binary logistic regression to establish a joint index
and plot ROC curves (Fig. 3F). The
AUC value of this four biomarker model was 0.990 for the
discrimination between patients with GCA and healthy subjects. In
addition, the sensitivity and specificity of the model for GCA
diagnosis were 97.7 and 95.2%, respectively. Compared with single
biomarker models using phosphorylcholine, glycocholic acid,
arachidonic acid and L-acetylcarnitine individually, a model
comprising the aforementioned four metabolites exhibited improved
AUC values, sensitivity and specificity (Fig. 3B-F).
| Table III.Receiver operating characteristic
curve analysis of the four biomarkers (phosphorylcholine,
L-acetylcarnitine, arachidonic acid and glycocholic acid) and the
combined model. |
Table III.
Receiver operating characteristic
curve analysis of the four biomarkers (phosphorylcholine,
L-acetylcarnitine, arachidonic acid and glycocholic acid) and the
combined model.
|
|
|
| 95% CI |
|
|
|---|
|
|
|
|
|
|
|
|---|
| Metabolite | AUC | Standard error | Lower | Upper | Sensitivity | Specificity |
|---|
|
Phosphorylcholine | 0.913 | 0.035 | 0.843 | 0.982 | 0.854 | 1.000 |
|
L-Acetylcarnitine | 0.803 | 0.054 | 0.698 | 0.907 | 0.762 | 0.708 |
| Arachidonic
acid | 0.887 | 0.050 | 0.789 | 0.985 | 0.905 | 0.833 |
| Glycocholic
acid | 0.808 | 0.056 | 0.697 | 0.918 | 0.729 | 0.810 |
| Four metabolites
modela | 0.990 | 0.008 | 0.000 | 1.000 | 0.979 | 0.952 |
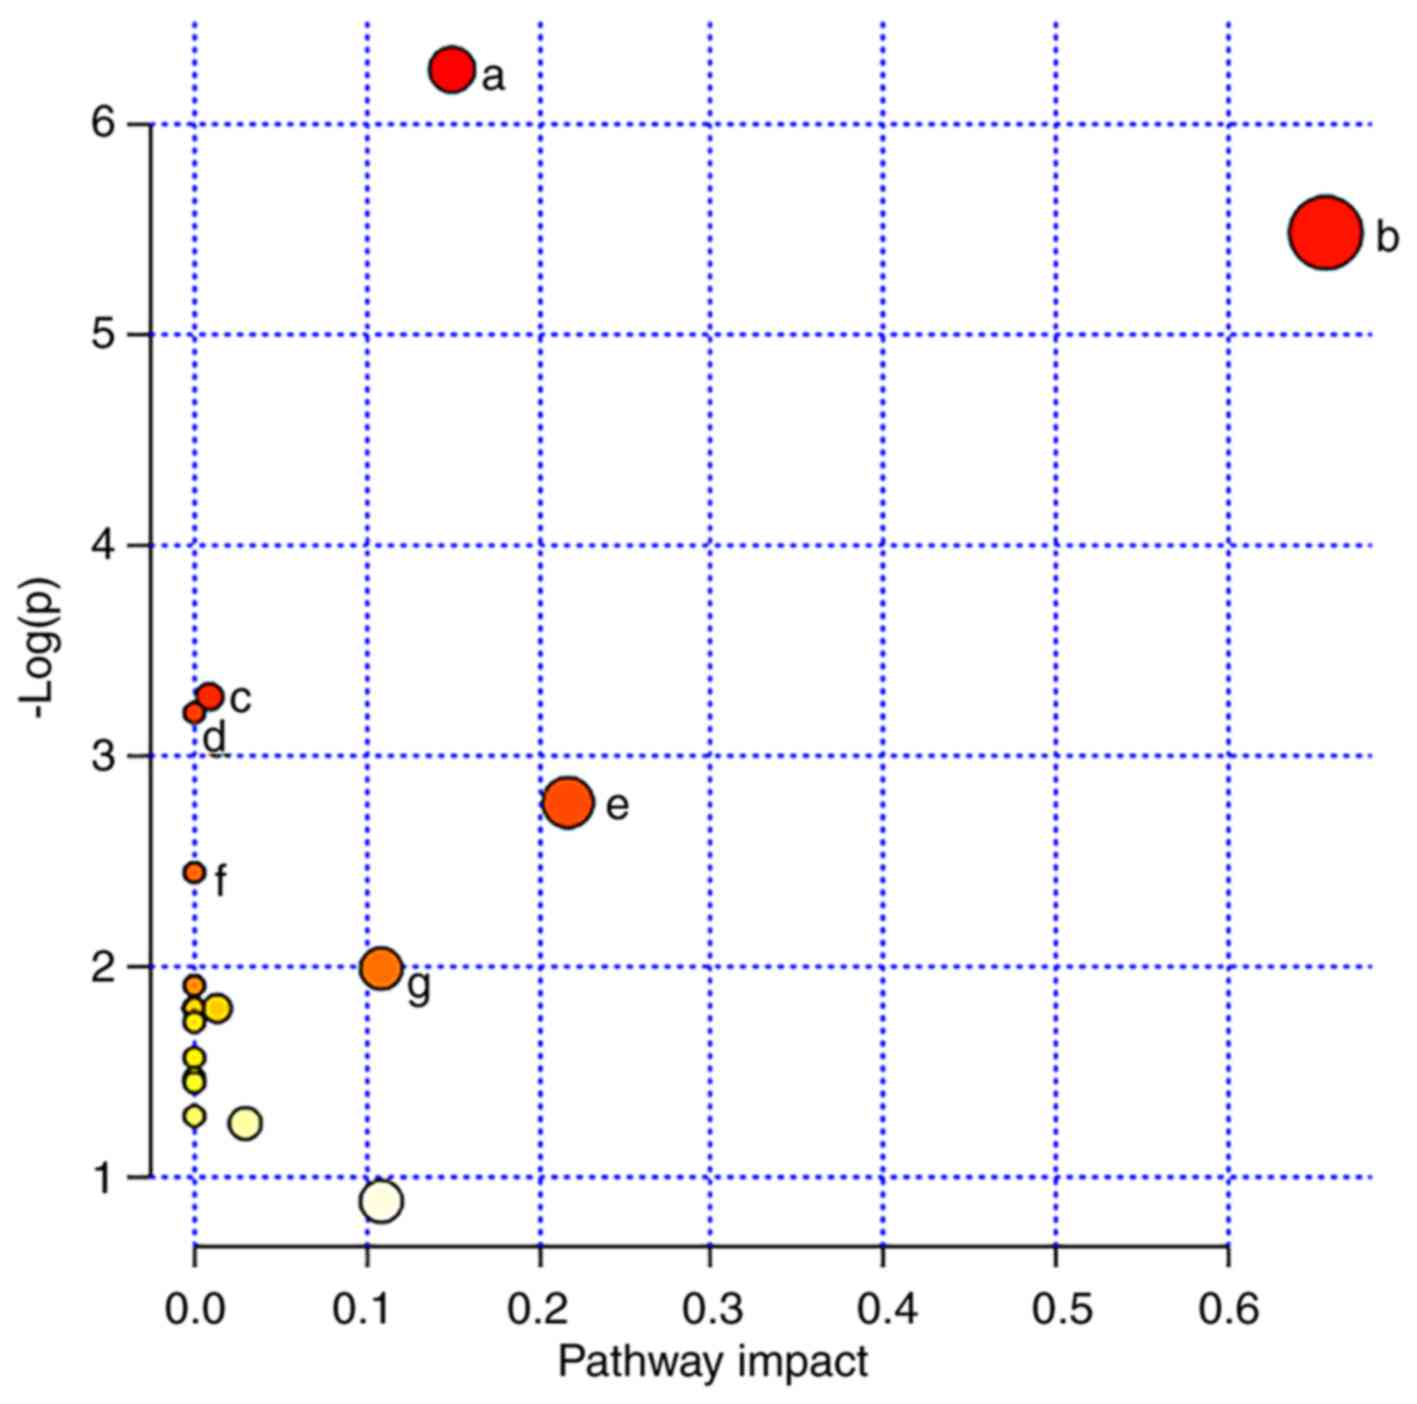
Metabolic pathway analysis
To gain a deeper understanding of the biological
significance of the potential biomarkers identified in the present
study, MetaboAnalyst software (version 4.0) was used for metabolic
pathway analysis. The results demonstrated that
‘glycerophospholipid metabolism’, ‘linoleic acid metabolism’,
‘primary bile acid biosynthesis’, ‘fatty acid synthesis’,
‘arachidonic acid metabolism’, ‘seleno amino acid metabolism’ and
‘aminoacyl-tRNA biosynthesis’ pathways were closely associated with
GCA (Figs. 4 and 5). These pathways are mainly associated
with energy metabolism, inflammatory reactions and immune
responses.
Discussion
The lack of an effective diagnostic model is the
major cause contributing to the high mortality of GCA (38). To date, a limited number of
biomarkers for GCA diagnosis have been identified (23,25,39). The
present study identified 27 biomarkers and established a combined
diagnostic model comprising phosphorylcholine, glycocholic acid,
arachidonic acid and L-acetylcarnitine for the early diagnosis of
GCA. Metabolic pathway enrichment analysis was performed based on
all 27 biomarkers identified in the present study. The results
revealed that disruptions in glycerophospholipid and linoleic acid
metabolism and fatty acid and primary bile acid biosynthesis were
significantly associated with the development of GCA. These
metabolic disturbances may help understand the underlying
pathogenesis of the disease.
The present study used UPLC-Q/TOF MS plasma
metabolomics analysis to determine the characteristic metabolic
fingerprints in the plasma of patients with GCA. An OPLS-DA model
based on plasma metabolomics data exhibited sufficient sensitivity
and specificity to distinguish between patients with GCA and
healthy controls. Using the cut-off criteria of VIP >1 and
P<0.05, 27 potential biomarkers for the diagnosis of GCA were
identified. Systematic cluster analysis and area under ROC curve
values were used to establish a combined diagnostic model
consisting of phosphorylcholine, glycocholic acid, arachidonic acid
and L-acetylcarnitine for the early diagnosis of GCA. Compared with
a single indicator diagnostic model, the combined diagnostic model
exhibited significantly improved sensitivity and specificity for
the diagnosis of GCA. Additionally, the four key biomarkers and
associated metabolic pathways were investigated to shed new light
on the pathogenesis of GCA.
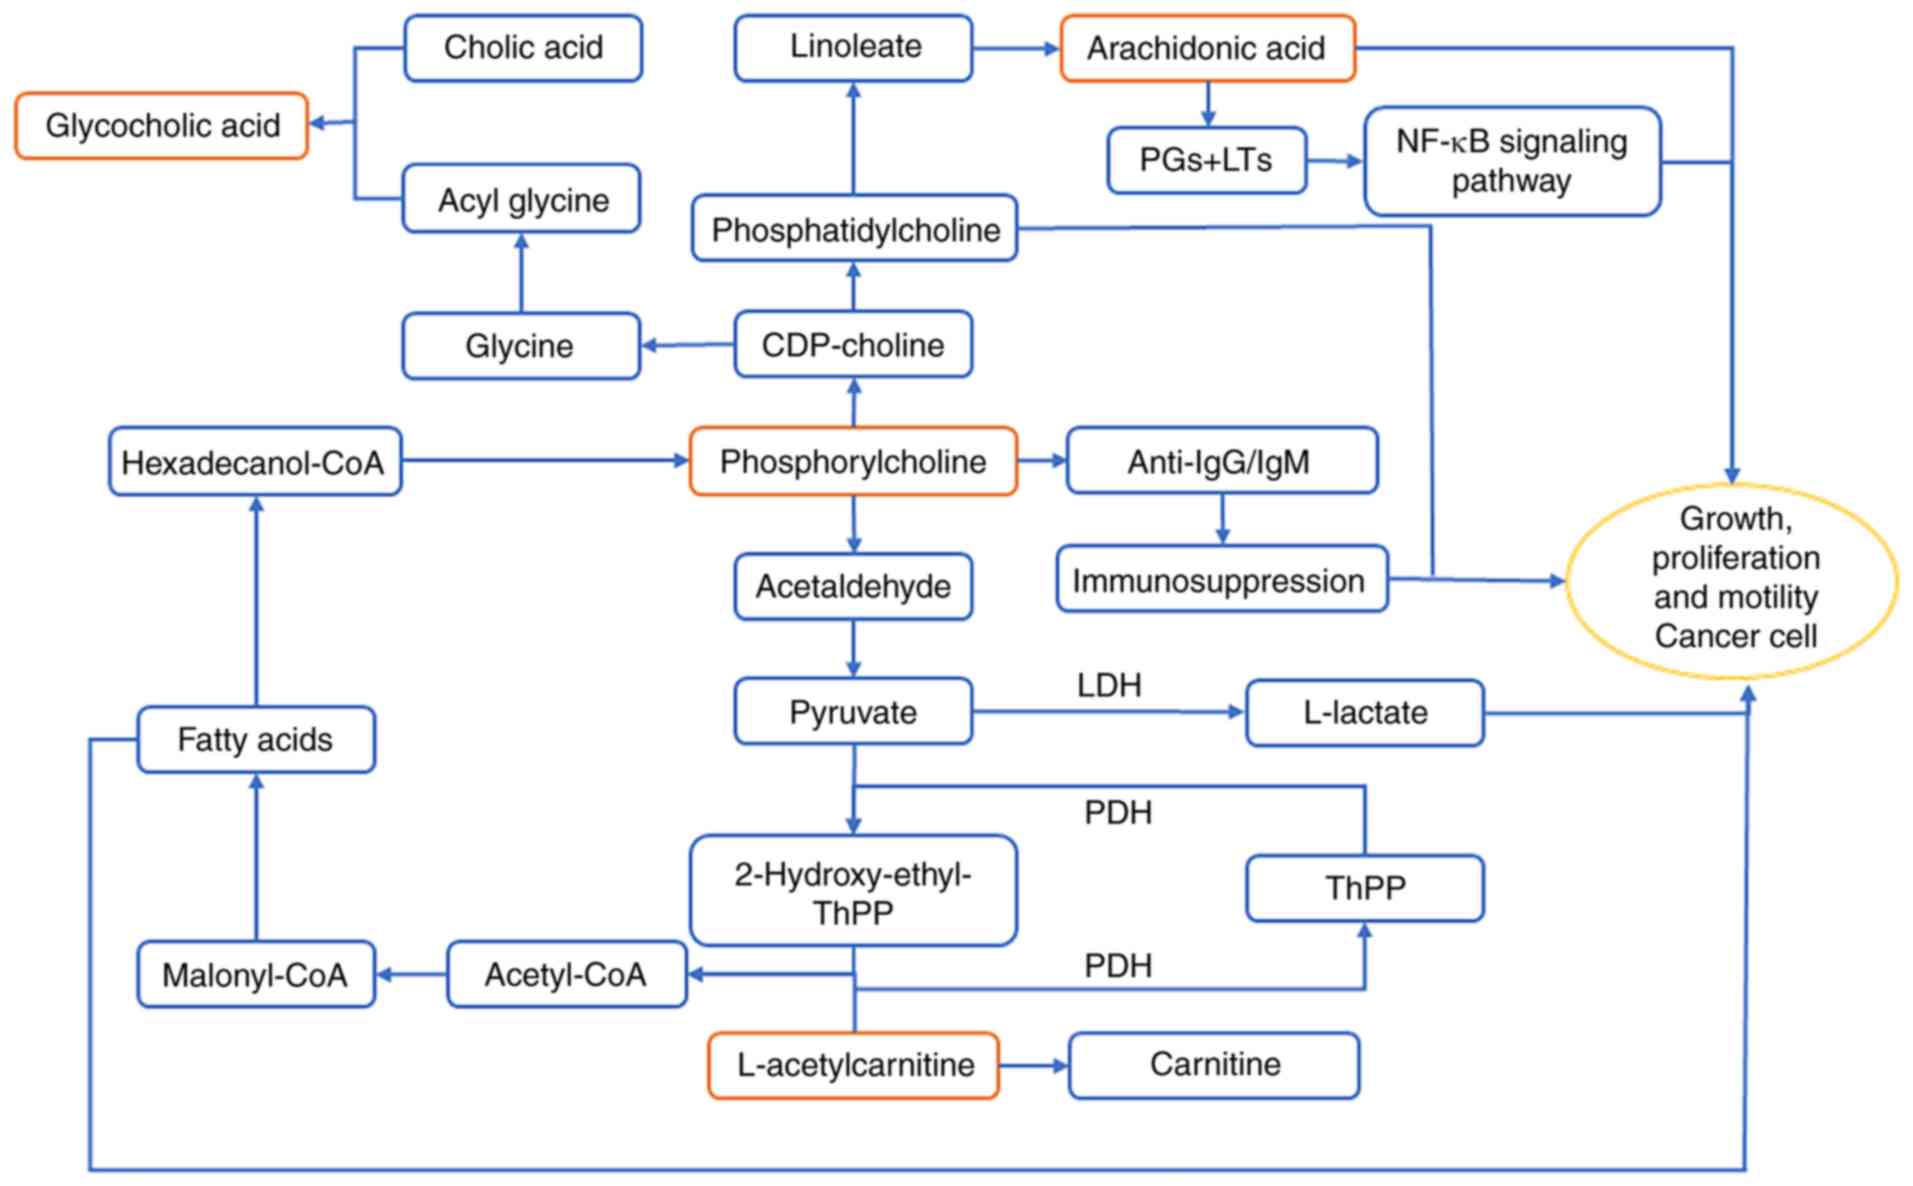
L-acetylcarnitine serves as an acetyl carrier and
provides an acetyl group for coenzyme A (CoA) (40). Acetyl-CoA is required for the de
novo synthesis of fatty acids (41). Hexadecanol-CoA, a product of fatty
acid metabolism, is metabolized to produce phosphorylcholine and
glycerophospholipid. Acetaldehyde, which is produced from
phosphorylcholine, is the link between the glycerophospholipid and
pyruvate metabolic pathways (42).
Additionally, acetyl-CoA synthesis is catalyzed by pyruvate
dehydrogenase (43). Increased
L-acetylcarnitine levels in patients with GCA are associated with
excessive fatty acids and previous studies have revealed that fatty
acids, particularly unsaturated fatty acids, are a major source of
energy for cancer cells (44,45).
Previous studies have demonstrated that
phosphorylcholine metabolism is closely associated with the immune
response (46,47). Phosphorylcholine is taken up by
lymphoid B cells, which produce anti-phosphorylcholine
immunoglobulin G and M antibodies that target cancer cells
(48). However, in the present
study, the phosphorylcholine levels in patients with GCA were
significantly reduced compared with healthy subjects, suggesting a
weakened immune response. Phosphorylcholine synthesizes cytidine
5′-diphosphocholine, a reaction catalyzed by phosphate
cytidylyltransferase 1 (49).
Phosphatidylcholine is subsequently produced by ethanolamine
phosphotransferase 1 or choline phosphotransferase 1 (50). Phosphatidylcholine promotes apoptosis
in the human gastric cancer cell line BGC823, downregulates the
expression of ATP binding cassette subfamily F member 2 and reduces
the number of cancer stem cells (51,52).
Therefore, decreased phosphorylcholine levels in patients with GCA
may provide a favorable environment for the proliferation of GCA
cells.
Phosphatidylcholine is used to synthesize linoleic
acid through the linoleic acid metabolic pathway, which can be
further used in the synthesis of arachidonic acid (53). The present study revealed that the
levels of arachidonic acid in patients with GCA were significantly
increased compared with healthy subjects. Eicosanoids, including
prostaglandins (PGs) and leukotrienes (LTs) are synthesized by
cyclooxygenase-2 (COX-2) and 5-lipoxygenase (5-LOX) from
arachidonic acid (54). In turn, PGs
and LTs upregulate the expression of COX-2 and 5-LOX via a positive
feedback amplification mechanism (55,56). PGs
and LTs promote cancer cell proliferation and tumor growth by
activating the mitogen-activated protein kinase/nuclear factor-κB
signaling pathway (57,58). In addition, PGs and LTs increase the
survival, proliferation, invasion and migration and decrease
apoptosis of tumor epithelial cells by regulating multiple
signaling pathways (56), such as
protein kinase C/extracellular signal regulated kinase pathway and
Ras-Raf-Erk pathway (59,60). Therefore, the arachidonic acid
content in patients with GCA may increase to allow the
proliferation of tumor cells.
Bile acids, particularly unconjugated bile acids,
are implicated in gastroduodenal reflux (61). Long-term gastroduodenal reflux may
result in chronic inflammation (62), which may lead to muscle atrophy in
the stomach tissue, intestinal erosion and the development of
cancer (63). The accumulation of
bile salts can contribute towards progressive liver damage and
fibrosis; therefore, the levels of bile acids in the blood and
tissues are highly regulated (64).
Glycocholic acid, which is a combination of acetyl glycine
(produced by cytidine 5′-diphosphocholine) and bile acid, serves as
a detergent and promotes the absorption of fat as well as its own
absorption, thereby preventing cholestasis (65). The present study revealed a
significant decrease in glycocholic acid levels in patients with
GCA compared with healthy subjects, consistent with the
aforementioned studies.
A large sample size is often required for clinical
research due to individual variations. However, the present study
implemented strict inclusion/exclusion criteria and required
informed consent for each patient, which resulted in only 21
patients being available for sampling. One limitation of this study
is the low number of samples, which does not allow further
analysis, for example, to identify the biomarkers for TNM staging
of GCA, which would require a large number of additional clinical
samples. Future studies will continue to collect clinical samples
and perform in-depth analysis. Additionally, digestive tract
diseases are closely associated with imbalances in the intestinal
flora (66). As a limited number of
studies have investigated the association between GCA and the
intestinal flora, future studies are warranted. The multi-omics
fusion of metabolomics, proteomics, genomics and metagenomics may
aid the optimization of the early diagnostic model of GCA described
in the current study and elucidate the underlying mechanisms of the
disease. The present study identified four biomarkers and
established a combined diagnostic model for early diagnosis of GCA,
which may achieve progress in the prevention and treatment of GCA.
Further metabolic pathway analysis is required to better understand
the molecular pathogenesis of GCA.
Supplementary Material
Supporting Data
Acknowledgements
Not applicable.
Funding
The present study was supported by the Hangzhou
Science and Technology Commission (grant no. 20140633B41) and the
Medical Innovation Project of PLA Nanjing Military Area Command
(grant no. 2013MS150).
Availability of data and materials
The datasets used and/or analyzed during the present
study are available from the corresponding author on reasonable
request.
Authors' contributions
YS analyzed the data and wrote the manuscript. SL
analyzed the data and edited the manuscript. JL acquired and
analyzed the data. XX analyzed the data and edited the manuscript.
ZH collected the clinical samples and acquired the data. XW
designed the study. SY designed the study and reviewed and edited
the manuscript. All authors read and approved the final version of
the manuscript.
Ethics approval and consent to
participate
The present study was approved by Institutional
Review Board of the 903rd Hospital of PLA (approval no. 20140501;
Hangzhou, China) and Institutional Review Board of People's
Hospital of Yangzhong City (approval no. IRB201404; Yangzhong,
China). Written informed consent was obtained from all
participants.
Patient consent for publication
Not applicable.
Competing interests
The authors declare that they have no competing
interests.
Glossary
Abbreviations
Abbreviations:
|
GCA
|
gastric cardia adenocarcinoma
|
|
UPLC/Q-TOF MS
|
ultra-performance liquid
chromatography/quadrupole-time-of- flight mass spectrometry
|
|
OPLS-DA
|
orthogonal partial least squares
discrimination analysis
|
|
ROC
|
receiver operating characteristic
|
References
|
1
|
Colquhoun A, Arnold M, Ferlay J, Goodman
KJ, Forman D and Soerjomataram I: Global patterns of cardia and
non-cardia gastric cancer incidence in 2012. Gut. 64:1881–1888.
2015. View Article : Google Scholar : PubMed/NCBI
|
|
2
|
Wang LD, Zheng S, Zheng ZY and Casson AG:
Primary adenocarcinomas of lower esophagus, esophagogastric
junction and gastric cardia: In special reference to China. World J
Gastroenterol. 9:1156–1164. 2003. View Article : Google Scholar : PubMed/NCBI
|
|
3
|
Huang Q, Li R, Xu GF, Zhou D, Fan XS and
Zou XP: Emerging evidence supports grouping by location of early
gastric carcinoma for appropriate clinical management in Chinese
patients. J Dig Dis. 19:730–736. 2018. View Article : Google Scholar : PubMed/NCBI
|
|
4
|
Abdi E, Latifi-Navid S, Zahri S, Yazdanbod
A and Pourfarzi F: Risk factors predisposing to cardia gastric
adenocarcinoma: Insights and new perspectives. Cancer Med.
8:6114–6126. 2019. View Article : Google Scholar : PubMed/NCBI
|
|
5
|
Ze-Long Y, Guo-Hui M, Lin Z, Wei-Hong Y,
Ke-Cheng Z and Yan-Wen J: Survival trends of patients with
surgically resected gastric cardia cancer from 1988 to 2015 a
population-based study in the United States. Am J Clin Oncol.
42:581–587. 2019. View Article : Google Scholar : PubMed/NCBI
|
|
6
|
Kutup A, Yekebas EF and Izbicki JR:
Current diagnosis and future impact of micrometastases for
therapeutic strategies in adenocarcinoma of the esophagus, gastric
cardia, and upper gastric third. Recent Results Cancer Res.
182:115–125. 2010. View Article : Google Scholar : PubMed/NCBI
|
|
7
|
An JY, Baik YH, Choi MG, Noh JH, Sohn TS,
Bae JM and Kim S: The prognosis of gastric cardia cancer after R0
resection. Am J Surg. 199:725–729. 2010. View Article : Google Scholar : PubMed/NCBI
|
|
8
|
Nishimata H, Maruyama M, Shimaoka S,
Nishimata Y, Ohi H, Niihara T, Nioh T, Matsuda A, Tashiro K and
Torimaru H: Early gastric carcinomas in the cardiac region:
Diagnosis with double-contrast x-ray studies. Abdom Imaging.
28:486–491. 2003. View Article : Google Scholar : PubMed/NCBI
|
|
9
|
Togo R, Yamamichi N, Mabe K, Takahashi Y,
Takeuchi C, Kato M, Sakamoto N, Ishihara K, Ogawa T and Haseyama M:
Detection of gastritis by a deep convolutional neural network from
double-contrast upper gastrointestinal barium X-ray radiography. J
Gastroenterol. 54:321–329. 2019. View Article : Google Scholar : PubMed/NCBI
|
|
10
|
Carandang N, Schuman BM and Priest RJ: The
gastrocamera in the diagnosis of stomach disease. JAMA.
204:717–722. 1968. View Article : Google Scholar : PubMed/NCBI
|
|
11
|
Fujiyoshi T, Miyahara R, Funasaka K,
Furukawa K, Sawada T, Maeda K, Yamamura T, Ishikawa T, Ohno E,
Nakamura M, et al: Utility of linked color imaging for endoscopic
diagnosis of early gastric cancer. World J Gastroenterol.
25:1248–1258. 2019. View Article : Google Scholar : PubMed/NCBI
|
|
12
|
Shen L, Zhou C, Liu L, Zhang L, Lu D, Cai
J, Zhao L, Chu R, Zhou J and Zhang J: Application of oral contrast
trans-abdominal ultrasonography for initial screening of gastric
cancer in rural areas of China. Dig Liver Dis. 49:918–923. 2017.
View Article : Google Scholar : PubMed/NCBI
|
|
13
|
Dai CL, Yang ZG, Xue LP and Li YM:
Application value of multi-slice spiral computed tomography for
imaging determination of metastatic lymph nodes of gastric cancer.
World J Gastroenterol. 19:5732–5737. 2013. View Article : Google Scholar : PubMed/NCBI
|
|
14
|
Jiang M, Wang X, Shan X, Pan D, Jia Y, Ni
E, Hu Y and Huang H: Value of multi-slice spiral computed
tomography in the diagnosis of metastatic lymph nodes and N-stage
of gastric cancer. J Int Med Res. 47:281–292. 2019. View Article : Google Scholar : PubMed/NCBI
|
|
15
|
Chan AW, Mercier P, Schiller D, Bailey R,
Robbins S, Eurich DT, Sawyer MB and Broadhurst D: (1)H-NMR urinary
metabolomic profiling for diagnosis of gastric cancer. Br J Cancer.
114:59–62. 2016. View Article : Google Scholar : PubMed/NCBI
|
|
16
|
Tatsubayashi T, Tanizawa Y, Miki Y,
Tokunaga M, Bando E, Kawamura T, Sugiura T, Kinugasa Y, Uesaka K
and Terashima M: Treatment outcomes of hepatectomy for liver
metastases of gastric cancer diagnosed using contrast-enhanced
magnetic resonance imaging. Gastric Cancer. 20:387–393. 2017.
View Article : Google Scholar : PubMed/NCBI
|
|
17
|
Van Vliet EP, Hermans JJ, De Wever W,
Eijkemans MJ, Steyerberg EW, Faasse C, van Helmond EP, de Leeuw AM,
Sikkenk AC, de Vries AR, et al: Radiologist experience and CT
examination quality determine metastasis detection in patients with
esophageal or gastric cardia cancer. Eur Radiol. 18:2475–2484.
2008. View Article : Google Scholar : PubMed/NCBI
|
|
18
|
Li L, Pang X, Zhu Z, Lu L, Yang J, Cao J
and Fei S: GTPBP4 promotes gastric cancer progression via
regulating P53 activity. Cell Physiol Biochem. 45:667–676. 2018.
View Article : Google Scholar : PubMed/NCBI
|
|
19
|
Zhou F, Xu Y, Shi J, Lan X, Zou X, Wang L
and Huang Q: Expression profile of E-cadherin, estrogen receptors,
and P53 in early-onset gastric cancers. Cancer Med. 5:3403–3411.
2016. View
Article : Google Scholar : PubMed/NCBI
|
|
20
|
Yin J, Pan H, Long T, Lv L, Zhai P, Liu C,
Shao A, Shi Y, Sun Y, Zhu J, et al: Polymorphisms of VDR gene and
risk of gastric cardiac adenocarcinoma in Chinese population.
Oncotarget. 8:45531–45543. 2017. View Article : Google Scholar : PubMed/NCBI
|
|
21
|
Zhou RM, Wang N, Chen ZF, Duan YN, Sun DL
and Li Y: Polymorphisms in promoter region of FAS and FASL gene and
risk of cardia gastric adenocarcinoma. J Gastroenterol Hepatol.
25:555–561. 2010. View Article : Google Scholar : PubMed/NCBI
|
|
22
|
Zhang J, Cui Y, Kuang G, Li Y, Wang N,
Wang R, Guo W, Wen D, Wei L, Yu F and Wang S: Association of the
thymidylate synthase polymorphisms with esophageal squamous cell
carcinoma and gastric cardiac adenocarcinoma. Carcinogenesis.
25:2479–2485. 2004. View Article : Google Scholar : PubMed/NCBI
|
|
23
|
Luo T, Chen W, Wang L and Zhao H: CA125 is
a potential biomarker to predict surgically incurable gastric and
cardia cancer: A retrospective study. Medicine (Baltimore).
95:e52972016. View Article : Google Scholar : PubMed/NCBI
|
|
24
|
Williams GH, Swinn R, Prevost AT, de
Clive-Lowe P, Halsall I, Going JJ, Hales CN, Stoeber K and
Middleton SJ: Diagnosis of oesophageal cancer by detection of
minichromosome maintenance 5 protein in gastric aspirates. Br J
Cancer. 91:714–719. 2004. View Article : Google Scholar : PubMed/NCBI
|
|
25
|
Liu M, Li JS, Tian DP, Huang B, Rosqvist S
and Su M: MCM2 expression levels predict diagnosis and prognosis in
gastric cardiac cancer. Histol Histopathol. 28:481–492.
2013.PubMed/NCBI
|
|
26
|
Cheng Y, Zhang J, Li Y, Wang Y and Gong J:
Proteome analysis of human gastric cardia adenocarcinoma by laser
capture microdissection. BMC Cancer. 7:1912007. View Article : Google Scholar : PubMed/NCBI
|
|
27
|
Liu HN, Liu TT, Wu H, Chen YJ, Tseng YJ,
Yao C, Weng SQ, Dong L and Shen XZ: Serum microRNA signatures and
metabolomics have high diagnostic value in colorectal cancer using
two novel methods. Cancer Sci. 109:1185–1194. 2018. View Article : Google Scholar : PubMed/NCBI
|
|
28
|
Zhang A, Sun H, Yan G, Wang P, Han Y and
Wang X: Metabolomics in diagnosis and biomarker discovery of
colorectal cancer. Cancer Lett. 345:17–20. 2014. View Article : Google Scholar : PubMed/NCBI
|
|
29
|
Wang X, Zhang A and Sun H: Power of
metabolomics in diagnosis and biomarker discovery of hepatocellular
carcinoma. Hepatology. 57:2072–2077. 2013. View Article : Google Scholar : PubMed/NCBI
|
|
30
|
Kobayashi T, Nishiumi S, Ikeda A, Yoshie
T, Sakai A, Matsubara A, Izumi Y, Tsumura H, Tsuda M, Nishisaki H,
et al: A novel serum metabolomics-based diagnostic approach to
pancreatic cancer. Cancer Epidemiol Biomarkers Prev. 22:571–579.
2013. View Article : Google Scholar : PubMed/NCBI
|
|
31
|
Zhang G, He P, Tan H, Budhu A, Gaedcke J,
Ghadimi BM, Ried T, Yfantis HG, Lee DH, Maitra A, et al:
Integration of metabolomics and transcriptomics revealed a fatty
acid network exerting growth inhibitory effects in human pancreatic
cancer. Clin Cancer Res. 19:4983–4993. 2013. View Article : Google Scholar : PubMed/NCBI
|
|
32
|
Abbassi-Ghadi N, Kumar S, Huang J, Goldin
R, Takats Z and Hanna GB: Metabolomic profiling of
oesophago-gastric cancer: A systematic review. Eur J Cancer.
49:3625–3637. 2013. View Article : Google Scholar : PubMed/NCBI
|
|
33
|
Wang X, Yan SK, Dai WX, Liu XR, Zhang WD
and Wang JJ: A metabonomic approach to chemosensitivity prediction
of cisplatin plus 5-fluorouracil in a human xenograft model of
gastric cancer. Int J Cancer. 127:2841–2850. 2010. View Article : Google Scholar : PubMed/NCBI
|
|
34
|
Cai Z, Zhao JS, Li JJ, Peng DN, Wang XY,
Chen TL, Qiu YP, Chen PP, Li WJ, Xu LY, et al: A combined
proteomics and metabolomics profiling of gastric cardia cancer
reveals characteristic dysregulations in glucose metabolism. Mol
Cell Proteomics. 9:2617–2628. 2010. View Article : Google Scholar : PubMed/NCBI
|
|
35
|
Zhen C: Glucose metabolic pathway in
gastric cardia cancer and the role of microcilia in tumorogenesis
[Chinese]. Shanghai Institutes for Biological Sciences; 2011
|
|
36
|
Patriarca S, Ferretti S and Zanetti R: TNM
Classification of malignant tumours-Eighth edition: Which news?
Epidemiol Prev. 41:140–143. 2017.(In Italian). PubMed/NCBI
|
|
37
|
Chong J, Soufan O, Li C, Caraus I, Li S,
Bourque G, Wishart DS and Xia J: MetaboAnalyst 4.0: towards more
transparent and integrative metabolomics analysis. Nucleic Acids
Res. 46:W486–W494. 2018. View Article : Google Scholar : PubMed/NCBI
|
|
38
|
Amini N, Spolverato G, Kim Y, Squires MH,
Poultsides GA, Fields R, Schmidt C, Weber SM, Votanopoulos K,
Maithel SK and Pawlik TM: Clinicopathological features and
prognosis of gastric cardia adenocarcinoma: A multi-institutional
US study. J Surg Oncol. 111:285–292. 2015. View Article : Google Scholar : PubMed/NCBI
|
|
39
|
Wang J, Zhang H, Zhou X, Wang T, Zhang J,
Zhu W, Zhu H and Cheng W: Five serum-based miRNAs were identified
as potential diagnostic biomarkers in gastric cardia
adenocarcinoma. Cancer Biomark. 23:193–203. 2018. View Article : Google Scholar : PubMed/NCBI
|
|
40
|
von Glutz G and Walter P: Compartmentation
of acetyl-coA in rat-liver mitochondria. Eur J Biochem. 60:147–152.
1975. View Article : Google Scholar : PubMed/NCBI
|
|
41
|
Svensson RU, Parker SJ, Eichner LJ, Kolar
MJ, Wallace M, Brun SN, Lombardo PS, Van Nostrand JL, Hutchins A,
Vera L, et al: Inhibition of acetyl-CoA carboxylase suppresses
fatty acid synthesis and tumor growth of non-small-cell lung cancer
in preclinical models. Nat Med. 22:1108–1119. 2016. View Article : Google Scholar : PubMed/NCBI
|
|
42
|
Scholz R, Olson MS, Schwab AJ, Schwabe U,
Noell C and Braun W: The effect of fatty acids on the regulation of
pyruvate dehydrogenase in perfused rat liver. Eur J Biochem.
86:519–530. 1978. View Article : Google Scholar : PubMed/NCBI
|
|
43
|
Ke J, Behal RH, Back SL, Nikolau BJ,
Wurtele ES and Oliver DJ: The role of pyruvate dehydrogenase and
acetyl-coenzyme A synthetase in fatty acid synthesis in developing
arabidopsis seeds. Plant Physiol. 123:497–508. 2000. View Article : Google Scholar : PubMed/NCBI
|
|
44
|
Lucenteforte E, Bosetti C, Gallus S,
Bertuccio P, Pelucchi C, Tavani A, La Vecchia C and Negri E:
Macronutrients, fatty acids and cholesterol intake and stomach
cancer risk. Ann Oncol. 20:1434–1438. 2009. View Article : Google Scholar : PubMed/NCBI
|
|
45
|
Wen YA, Xing XP, Harris JW, Zaytseva YY,
Mitov MI, Napier DL, Weiss HL, Mark Evers B and Gao T: Adipocytes
activate mitochondrial fatty acid oxidation and autophagy to
promote tumor growth in colon cancer. Cell Death Dis. 8:e25932017.
View Article : Google Scholar : PubMed/NCBI
|
|
46
|
Caligiuri G, Khallou-Laschet J, Vandaele
M, Gaston AT, Delignat S, Mandet C, Kohler HV, Kaveri SV and
Nicoletti A: Phosphorylcholine-targeting immunization reduces
atherosclerosis. J Am Coll Cardiol. 50:540–546. 2007. View Article : Google Scholar : PubMed/NCBI
|
|
47
|
Claflin JL, Lieberman R and Davie JM:
Clonal nature of the immune response to phosphorylcholine. I.
Specificity, class, and idiotype of phosphorylcholine-binding
receptors on lymphoid cells. J Exp Med. 139:58–73. 1974. View Article : Google Scholar : PubMed/NCBI
|
|
48
|
Sigal NH, Pickard AR, Metcalf ES, Gearhart
PJ and Klinman NR: Expression of phosphorylcholine-specific B cells
during murine development. J Exp Med. 146:933–948. 1977. View Article : Google Scholar : PubMed/NCBI
|
|
49
|
Feldman DA, Rounsifer ME and Weinhold PA:
The stimulation and binding of CTP: Phosphorylcholine
cytidylyltransferase by phosphatidylcholine-oleic acid vesicles.
Biochim Biophys Acta. 833:429–437. 1985. View Article : Google Scholar : PubMed/NCBI
|
|
50
|
Gasull T, Sarri E, DeGregorio-Rocasolano N
and Trullas R: NMDA receptor overactivation inhibits phospholipid
synthesis by decreasing choline-ethanolamine phosphotransferase
activity. J Neurosci. 23:4100–4107. 2003. View Article : Google Scholar : PubMed/NCBI
|
|
51
|
Mori N, Wildes F, Kakkad S, Jacob D,
Solaiyappan M, Glunde K and Bhujwalla ZM: Choline kinase-alpha
protein and phosphatidylcholine but not phosphocholine are required
for breast cancer cell survival. NMR Biomed. 28:1697–1706. 2015.
View Article : Google Scholar : PubMed/NCBI
|
|
52
|
Zhang H, Song H, Yuan R, Zhang X, Yu H,
Zhao Y and Jiang T: Polyene phosphatidylcholine overcomes
oxaliplatin resistance in human gastric cancer BGC823 cells.
Biochem Biophys Res Commun. 497:108–114. 2018. View Article : Google Scholar : PubMed/NCBI
|
|
53
|
Bereziat G, Chambaz J, Trugnan G, Pepin D
and Polonovski J: Turnover of phospholipid linoleic and arachidonic
acids in human platelets from plasma lecithins. J Lipid Res.
19:495–500. 1978.PubMed/NCBI
|
|
54
|
Wang D and Dubois RN: Eicosanoids and
cancer. Nat Rev Cancer. 10:181–193. 2010. View Article : Google Scholar : PubMed/NCBI
|
|
55
|
Nieves D and Moreno JJ: Effect of
arachidonic and eicosapentaenoic acid metabolism on RAW 264.7
macrophage proliferation. J Cell Physiol. 208:428–434. 2006.
View Article : Google Scholar : PubMed/NCBI
|
|
56
|
Yarla NS, Bishayee A, Sethi G, Reddanna P,
Kalle AM, Dhananjaya BL, Dowluru KS, Chintala R and Duddukuri GR:
Targeting arachidonic acid pathway by natural products for cancer
prevention and therapy. Semin Cancer Biol. 40-41:48–81. 2016.
View Article : Google Scholar : PubMed/NCBI
|
|
57
|
Poligone B and Baldwin AS: Positive and
negative regulation of NF-kappaB by COX-2: roles of different
prostaglandins. J Biol Chem. 276:38658–38664. 2001. View Article : Google Scholar : PubMed/NCBI
|
|
58
|
Bortuzzo C, Hanif R, Kashfi K,
Staiano-Coico L, Shiff SJ and Rigas B: The effect of leukotrienes B
and selected HETEs on the proliferation of colon cancer cells.
Biochim Biophys Acta. 1300:240–246. 1996. View Article : Google Scholar : PubMed/NCBI
|
|
59
|
Yu L, Wu WK, Li ZJ, Li HT, Wu YC and Cho
CH: Prostaglandin E-2 promotes cell proliferation via protein
kinase C/extracellular signal regulated kinase pathway-dependent
induction of c-Myc expression in human esophageal squamous cell
carcinoma cells. Int J Cancer. 125:2540–2546. 2009. View Article : Google Scholar : PubMed/NCBI
|
|
60
|
Ul Islam S, Shehzad A and Lee YS:
Prostaglandin E-2 inhibits resveratrol-induced apoptosis through
activation of survival signaling pathways in HCT-15 cell lines.
Anim Cells Syst. 19:374–384. 2015. View Article : Google Scholar
|
|
61
|
Kauer WK, Peters JH, DeMeester TR,
Feussner H, Ireland AP, Stein HJ and Siewert RJ: Composition and
concentration of bile acid reflux into the esophagus of patients
with gastroesophageal reflux disease. Surgery. 122:874–881. 1997.
View Article : Google Scholar : PubMed/NCBI
|
|
62
|
Fitzgerald RC, Abdalla S, Onwuegbusi BA,
Sirieix P, Saeed IT, Burnham WR and Farthing MJ: Inflammatory
gradient in Barrett's oesophagus: Implications for disease
complications. Gut. 51:316–322. 2002. View Article : Google Scholar : PubMed/NCBI
|
|
63
|
Tatsugami M, Ito M, Tanaka S, Yoshihara M,
Matsui H, Haruma K and Chayama K: Bile acid promotes intestinal
metaplasia and gastric carcinogenesis. Cancer Epidemiol Biomarkers
Prev. 21:2101–2107. 2012. View Article : Google Scholar : PubMed/NCBI
|
|
64
|
Messner CJ, Mauch L and Suter-Dick L: Bile
salts regulate CYP7A1 expression and elicit a fibrotic response and
abnormal lipid production in 3D liver microtissues. Toxicol In
Vitro. 60:261–271. 2019. View Article : Google Scholar : PubMed/NCBI
|
|
65
|
Heubi JE, Setchell KD, Jha P, Buckley D,
Zhang WJ, Rosenthal P, Potter C, Horslen S and Suskind D: Treatment
of bile acid amidation defects with glycocholic acid. Hepatology.
61:268–274. 2015. View Article : Google Scholar : PubMed/NCBI
|
|
66
|
Abreu MT and Peek RM Jr: Gastrointestinal
malignancy and the microbiome. Gastroenterology. 146:1534–1166.
2014. View Article : Google Scholar : PubMed/NCBI
|
|
67
|
Hu H, Krasinskas A and Willis J:
Perspectives on current tumor-node-metastasis (TNM) staging of
cancers of the colon and rectum. Semin Oncol. 38:500–510. 2011.
View Article : Google Scholar : PubMed/NCBI
|