Introduction
Thyroid cancer (TC) is a common endocrine malignancy
for all age groups worldwide and affects three times as many women
as men (1). In the past decade, the
incidence of TC has rapidly increased in numerous countries,
particularly the USA, Croatia, Korea and China (2). In 2018, an estimated 562,000 patients
with TC were newly diagnosed in 185 countries (3). The most common pathological type of TC
is papillary thyroid carcinoma (PTC), which accounts for >90% of
all cases (4,5). Although the 10-year survival rate of TC
is 90% (6,7), lymph node metastasis (LNM) occurs in
24–63% of patients with TC and is considered as an independent risk
factor for recurrence and distant metastases (6–11).
However, to the best of our knowledge, the fundamental
pathophysiology of LNM in TC has not been completely elucidated,
which is a major obstacle for clinical diagnosis and treatment. It
is therefore crucial to identify the key genes associated with LNM
in TC.
In the last decade, microarray technology has been
widely applied to identify TC-associated genes, including those
involved in LNM. For example, high expression levels of Cbp/P300
interacting transactivator with Glu/Asp rich carboxy-terminal
domain 1 and γ-aminobutyric acid type A receptor β 2 have been
identified as promoters of PTC migration (12,13).
However, to obtain a more accurate result, the present study
performed a subgroup analysis according to T stage, including
T1N0M0 vs. T1N1M0, T2N0M0 vs. T2N1M0, T3N0M0 vs. T3N1M0 and T4N0M0
vs. T4N1M0 comparisons, by using the novel stable analysis method
Robust Rank Aggregation.
The present study used the expression profiling data
from The Cancer Genome Atlas (TCGA) database (14) to identify the DEGs between N1M0 and
N0M0 in each individual T1-4 stage of TC. Combined with the results
of Gene Ontology (GO), Kyoto Encyclopedia of Genes and Genomes
(KEGG) and protein-protein interaction (PPI) network analyses, the
hub genes and pathways involved in TC with LNM were identified.
Materials and methods
Identification of DEGs
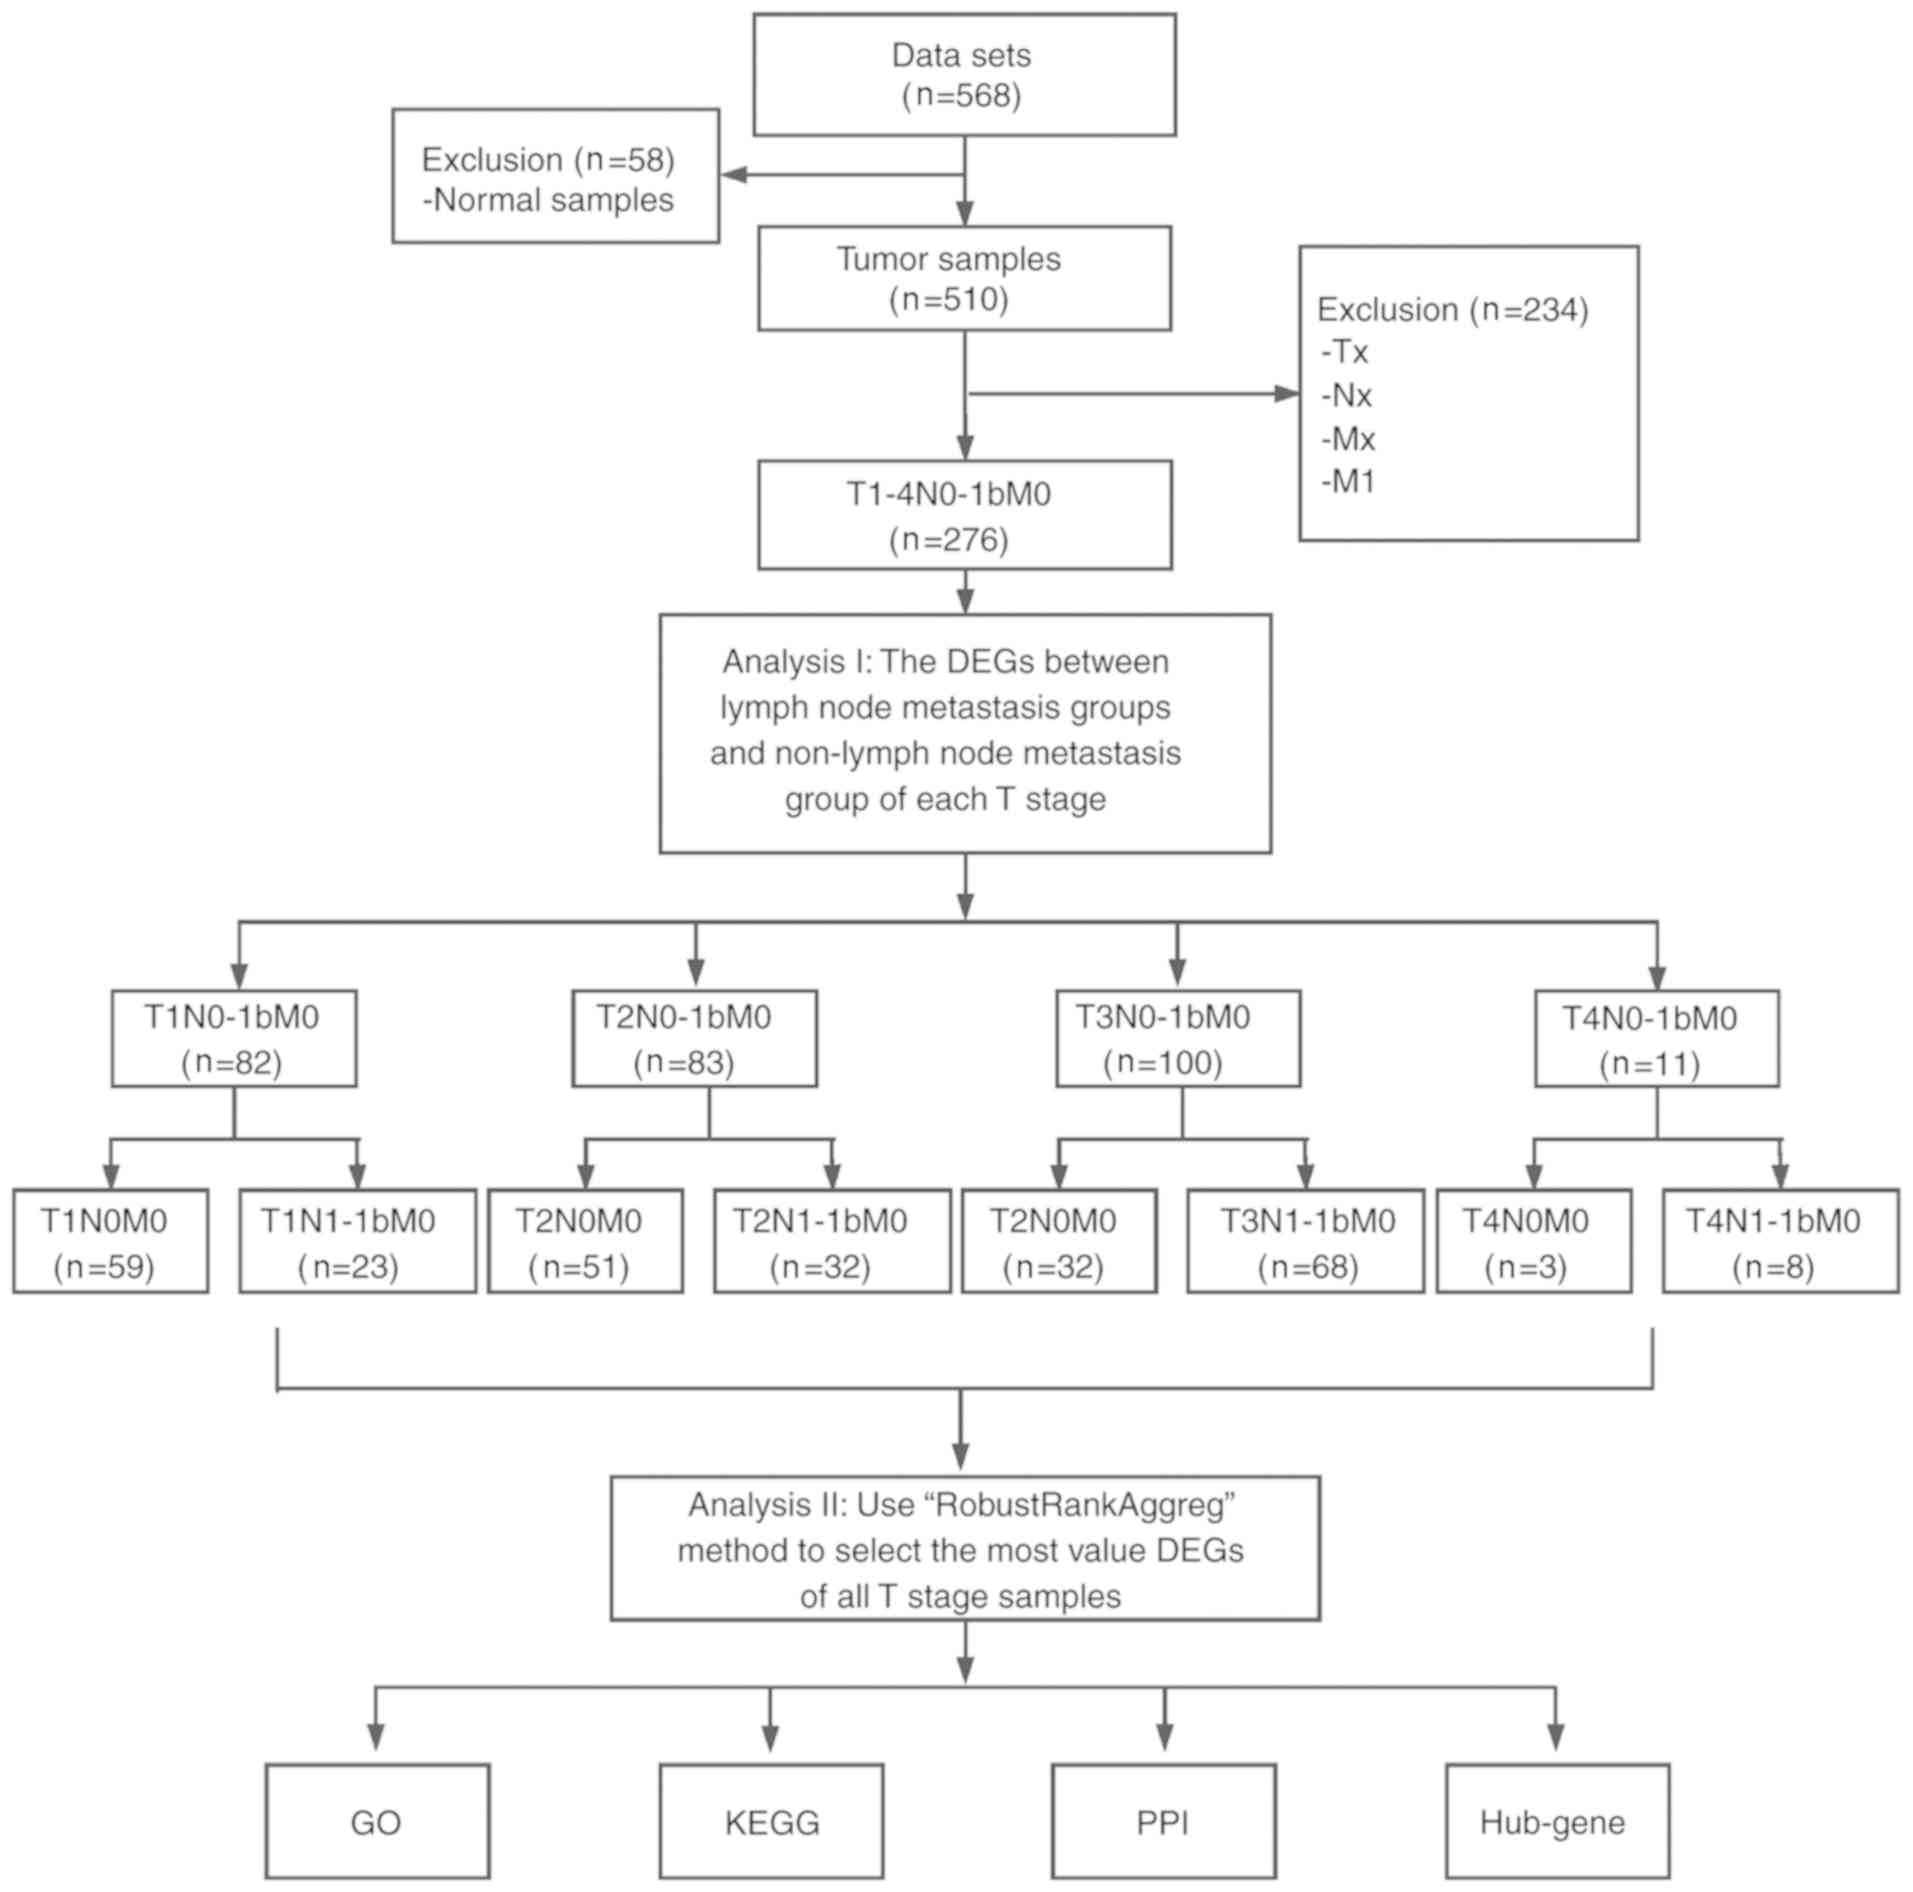
The present study analyzed the RNA-sequencing
(RNA-seq) data from TC and normal tissues that were downloaded from
the publicly available TCGA database (https://cancergenome.nih.gov). The RNA-seq data were
from 568 samples, including 510 TC samples and 58 normal samples. A
total of 276 TC samples with T1-4N0-1M0 information were selected.
N0 and M0 represent patients with TC without regional nodes and
distant metastasis, respectively. Similarly, N1 and M1 represent
patients with TC with regional nodes and distant metastasis,
respectively (14). According to
different T and N status, the samples were divided into 8
subgroups, including T1N0M0 vs. T1N1M0, T2N0M0 vs. T2N1M0, T3N0M0
vs. T3N1M0 and T4N0M0 vs. T4N1M0 (Fig.
1), and made differentially expressed analyses using ‘edgeR’
package (15). Genes that met the
conditions of log2 fold change [log fold change (FC)] ≥0.4 and
P<0.05 were considered as DEGs. Subsequently, the variable DEGs
lists of the different groups were integrated using probabilistic
models and a significance score for each gene was calculated using
RobustRankAggreg (RRA) package (16)
in order to identify the integrated DEGs (iDEGs). Due to the
limited size of gene symbol and figure, only the top 40 genes were
presented. In addition to the RRA method, Venn diagram was used to
determine an intersection among genes in Bioinformatics and
Evolutionary Genomics (http://bioinformatics.psb.ugent.be/webtools/Venn/).
GO and KEGG enrichment analysis of the
DEGs
GO (http://geneontology.org; release 2019-10-07) terms
were used to describe the biological process (BP) of genes. The
iDEGs list was uploaded to the Database for Annotation,
Visualization and Integrated Discovery (https://david.ncifcrf.gov/) (17) for GO enrichment analysis. The results
were visualized in the GOplot package (18). KEGG (https://www.genome.jp/kegg; release 92.0), which is a
comprehensive knowledge database, can be used for functional
interpretation and application of genomic information. In the
present study, KEGG pathway analysis was performed using the
clusterProfiler package (19).
P<0.05 was considered to indicate a statistically significant
difference.
Construction and assessment of a PPI
network
The Search Tool for the Retrieval of Interacting
Genes/Proteins (STRING) database (https://string-db.org/) is an online server used for
evaluating the interactions among proteins, including 9,643,763
proteins from 2,031 organisms (20).
To assess the interactions among DEGs, DEGs were mapped into STRING
in order to construct a PPI network. Only the interactions with a
combined score >0.4 were considered as significant. The PPI
network was visualized using Cytoscape software (version 3.5.1)
(21). The weight of each gene was
ranked using the cytoHubba plug-in (22). The top 30 genes identified in the 12
topological algorithms were used for interaction analysis. Only
genes that overlapped in at least nine algorithms were identified
as hub genes. In addition, overall survival analysis for all the
seven hub genes (IL6, ACTN2, COL1A1, ACTA1, CALB2, THBS1 and PTH)
was performed in 276 patients with TC using Kaplan Meier method and
the statistical significance was evaluated using the log-rank test.
Median expression level was defined as the cut-off value, above
this value was defined as high expression, and below this value was
defined as low expression.
Analysis of hub genes
To verify the value of the seven aforementioned hub
genes, multivariable logistic regression analysis was used to
construct a predictive model of LNM in TC and the different T
stages. The response variable of this model was the status of lymph
node metastasis, with 1 representing LNM and 0 representing LNM,
whereas predictive variables were the expression levels of seven
hub genes. The prediction efficiency of this model was assessed by
determining the area under curve (AUC) of receiver operating
characteristic (ROC) curves using the pROC package (23).
Results
Overview of the expression levels of
the DEGs
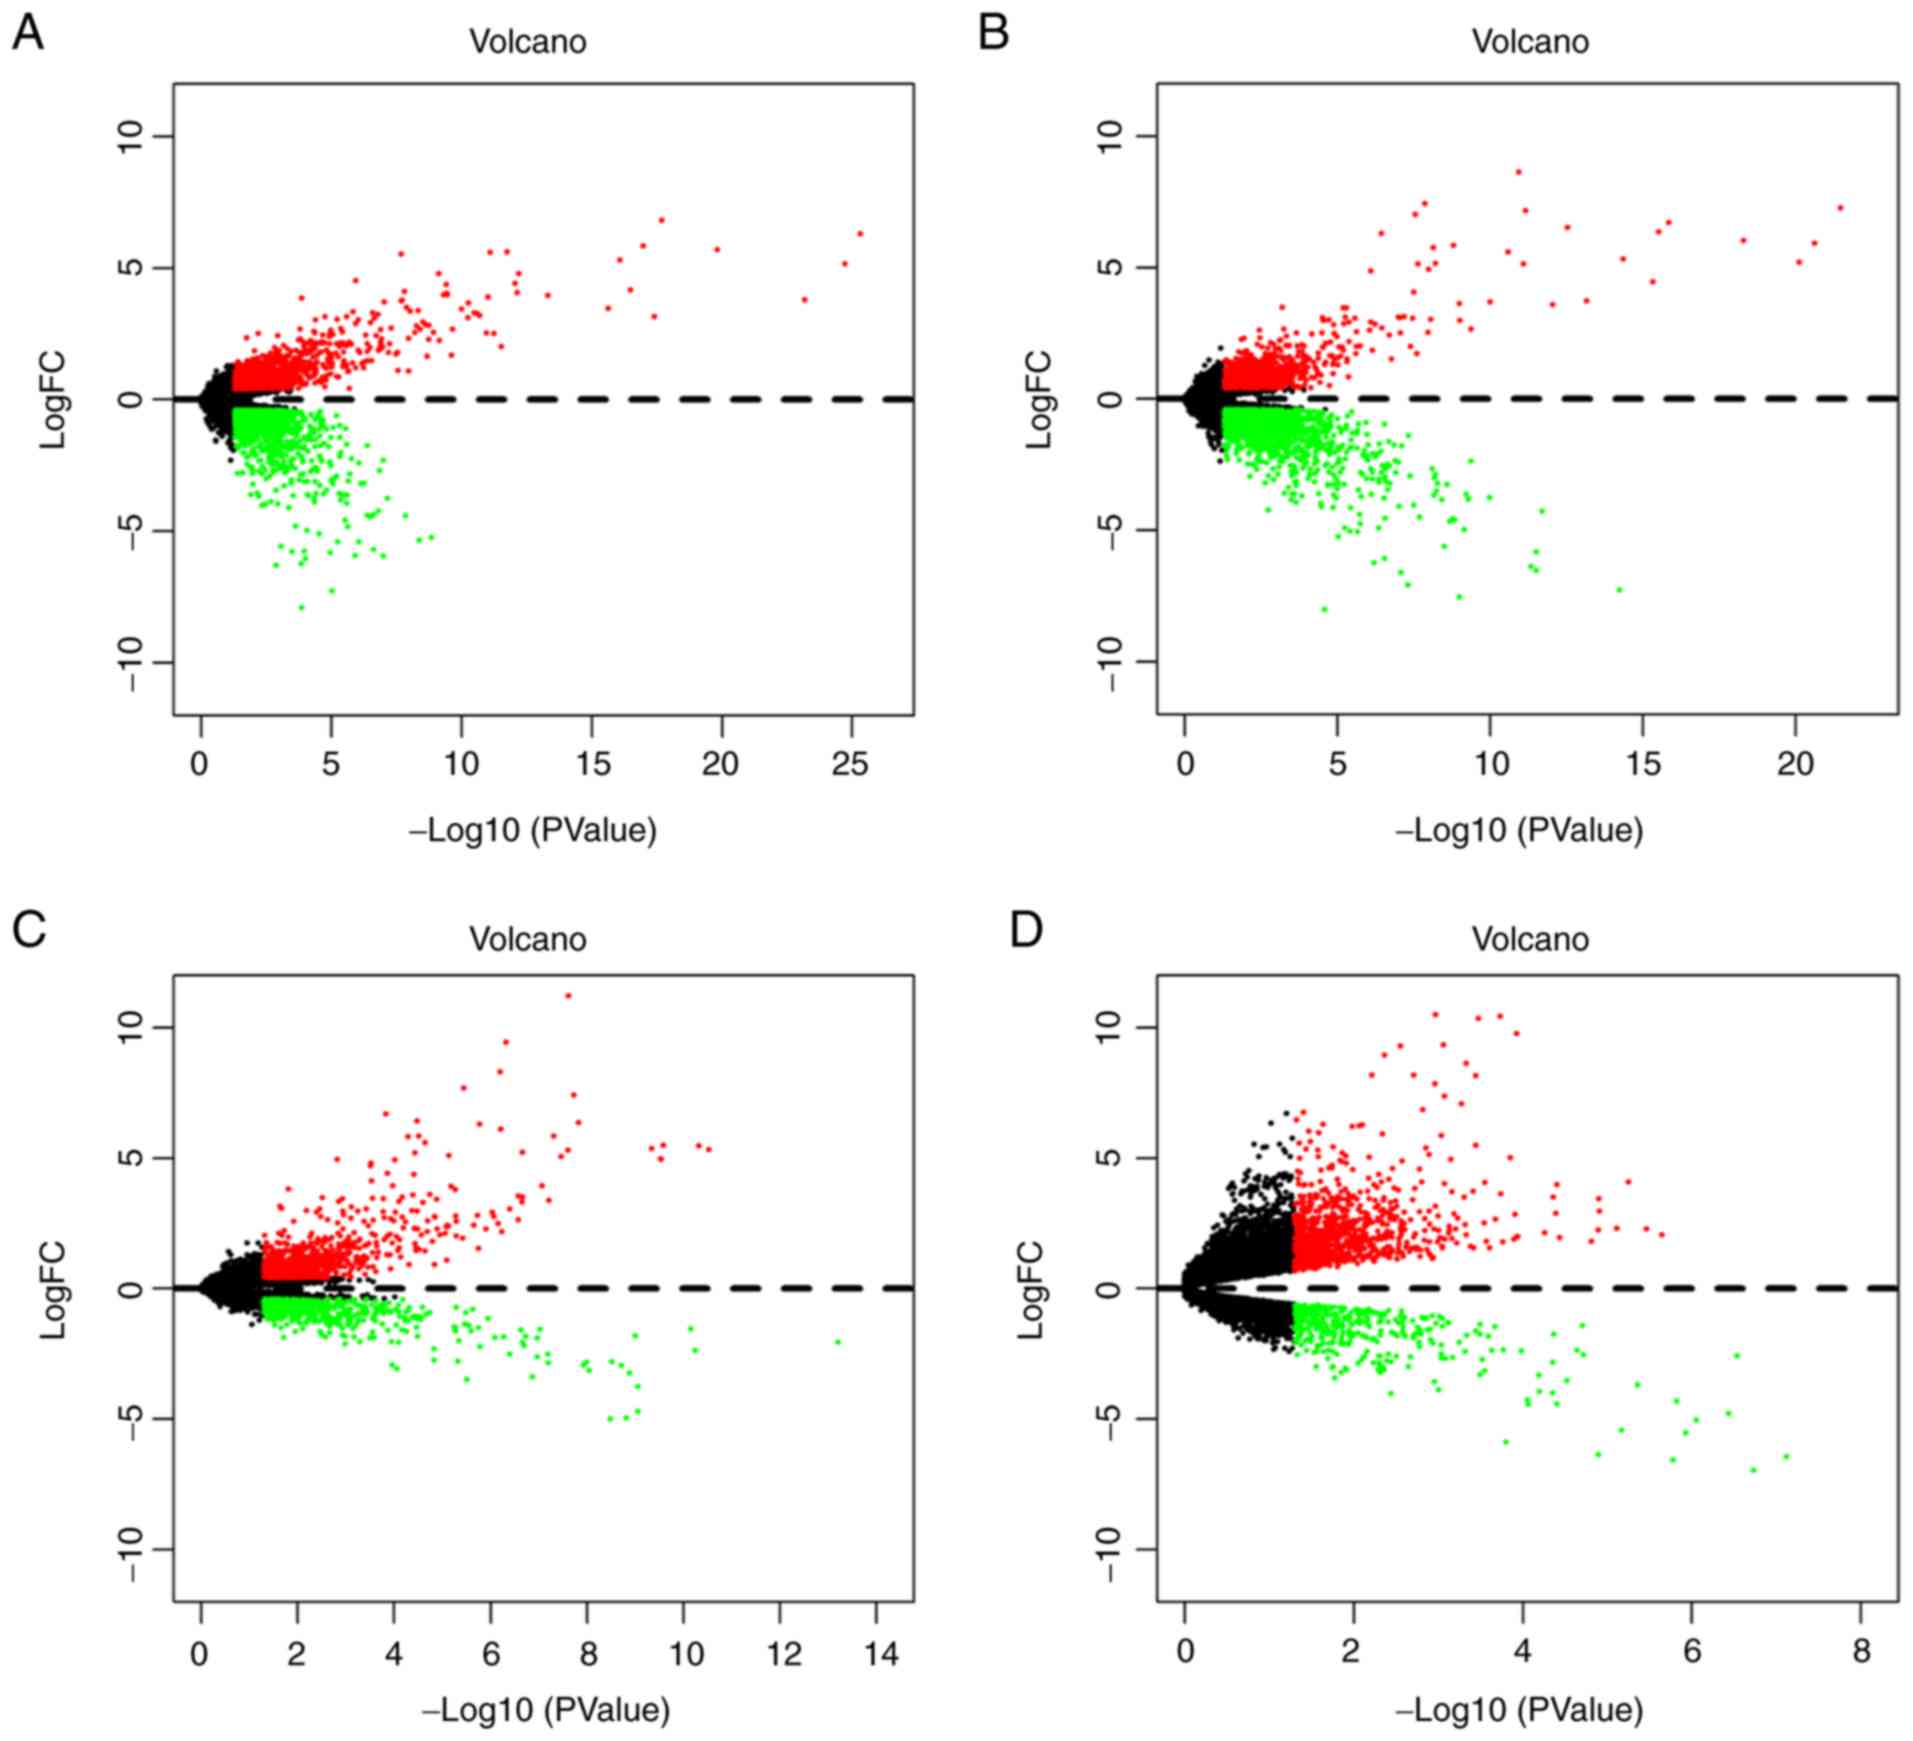
In order o identify gene signatures present during
the development of TC, the present study compared the expression
profiles between TC, LNM and non-metastasis samples in T1-4 disease
stages. Based on the criteria of P<0.05 and logFC ≥0.4, the
present study identified 2,369 DEGs (1,057 upregulated and 1,312
downregulated) in T1N0M0 vs. T1N1M0, 2,581 DEGs (968 upregulated
and 1,613 downregulated) in T2N0M0 vs. T2N1M0, 1,394 DEGs (872
upregulated and 522 downregulated) in T3N0M0 vs. T3N1M0 and 1,281
DEGs (889 upregulated and 392 downregulated) in T4N0M0 vs. T4N1M0
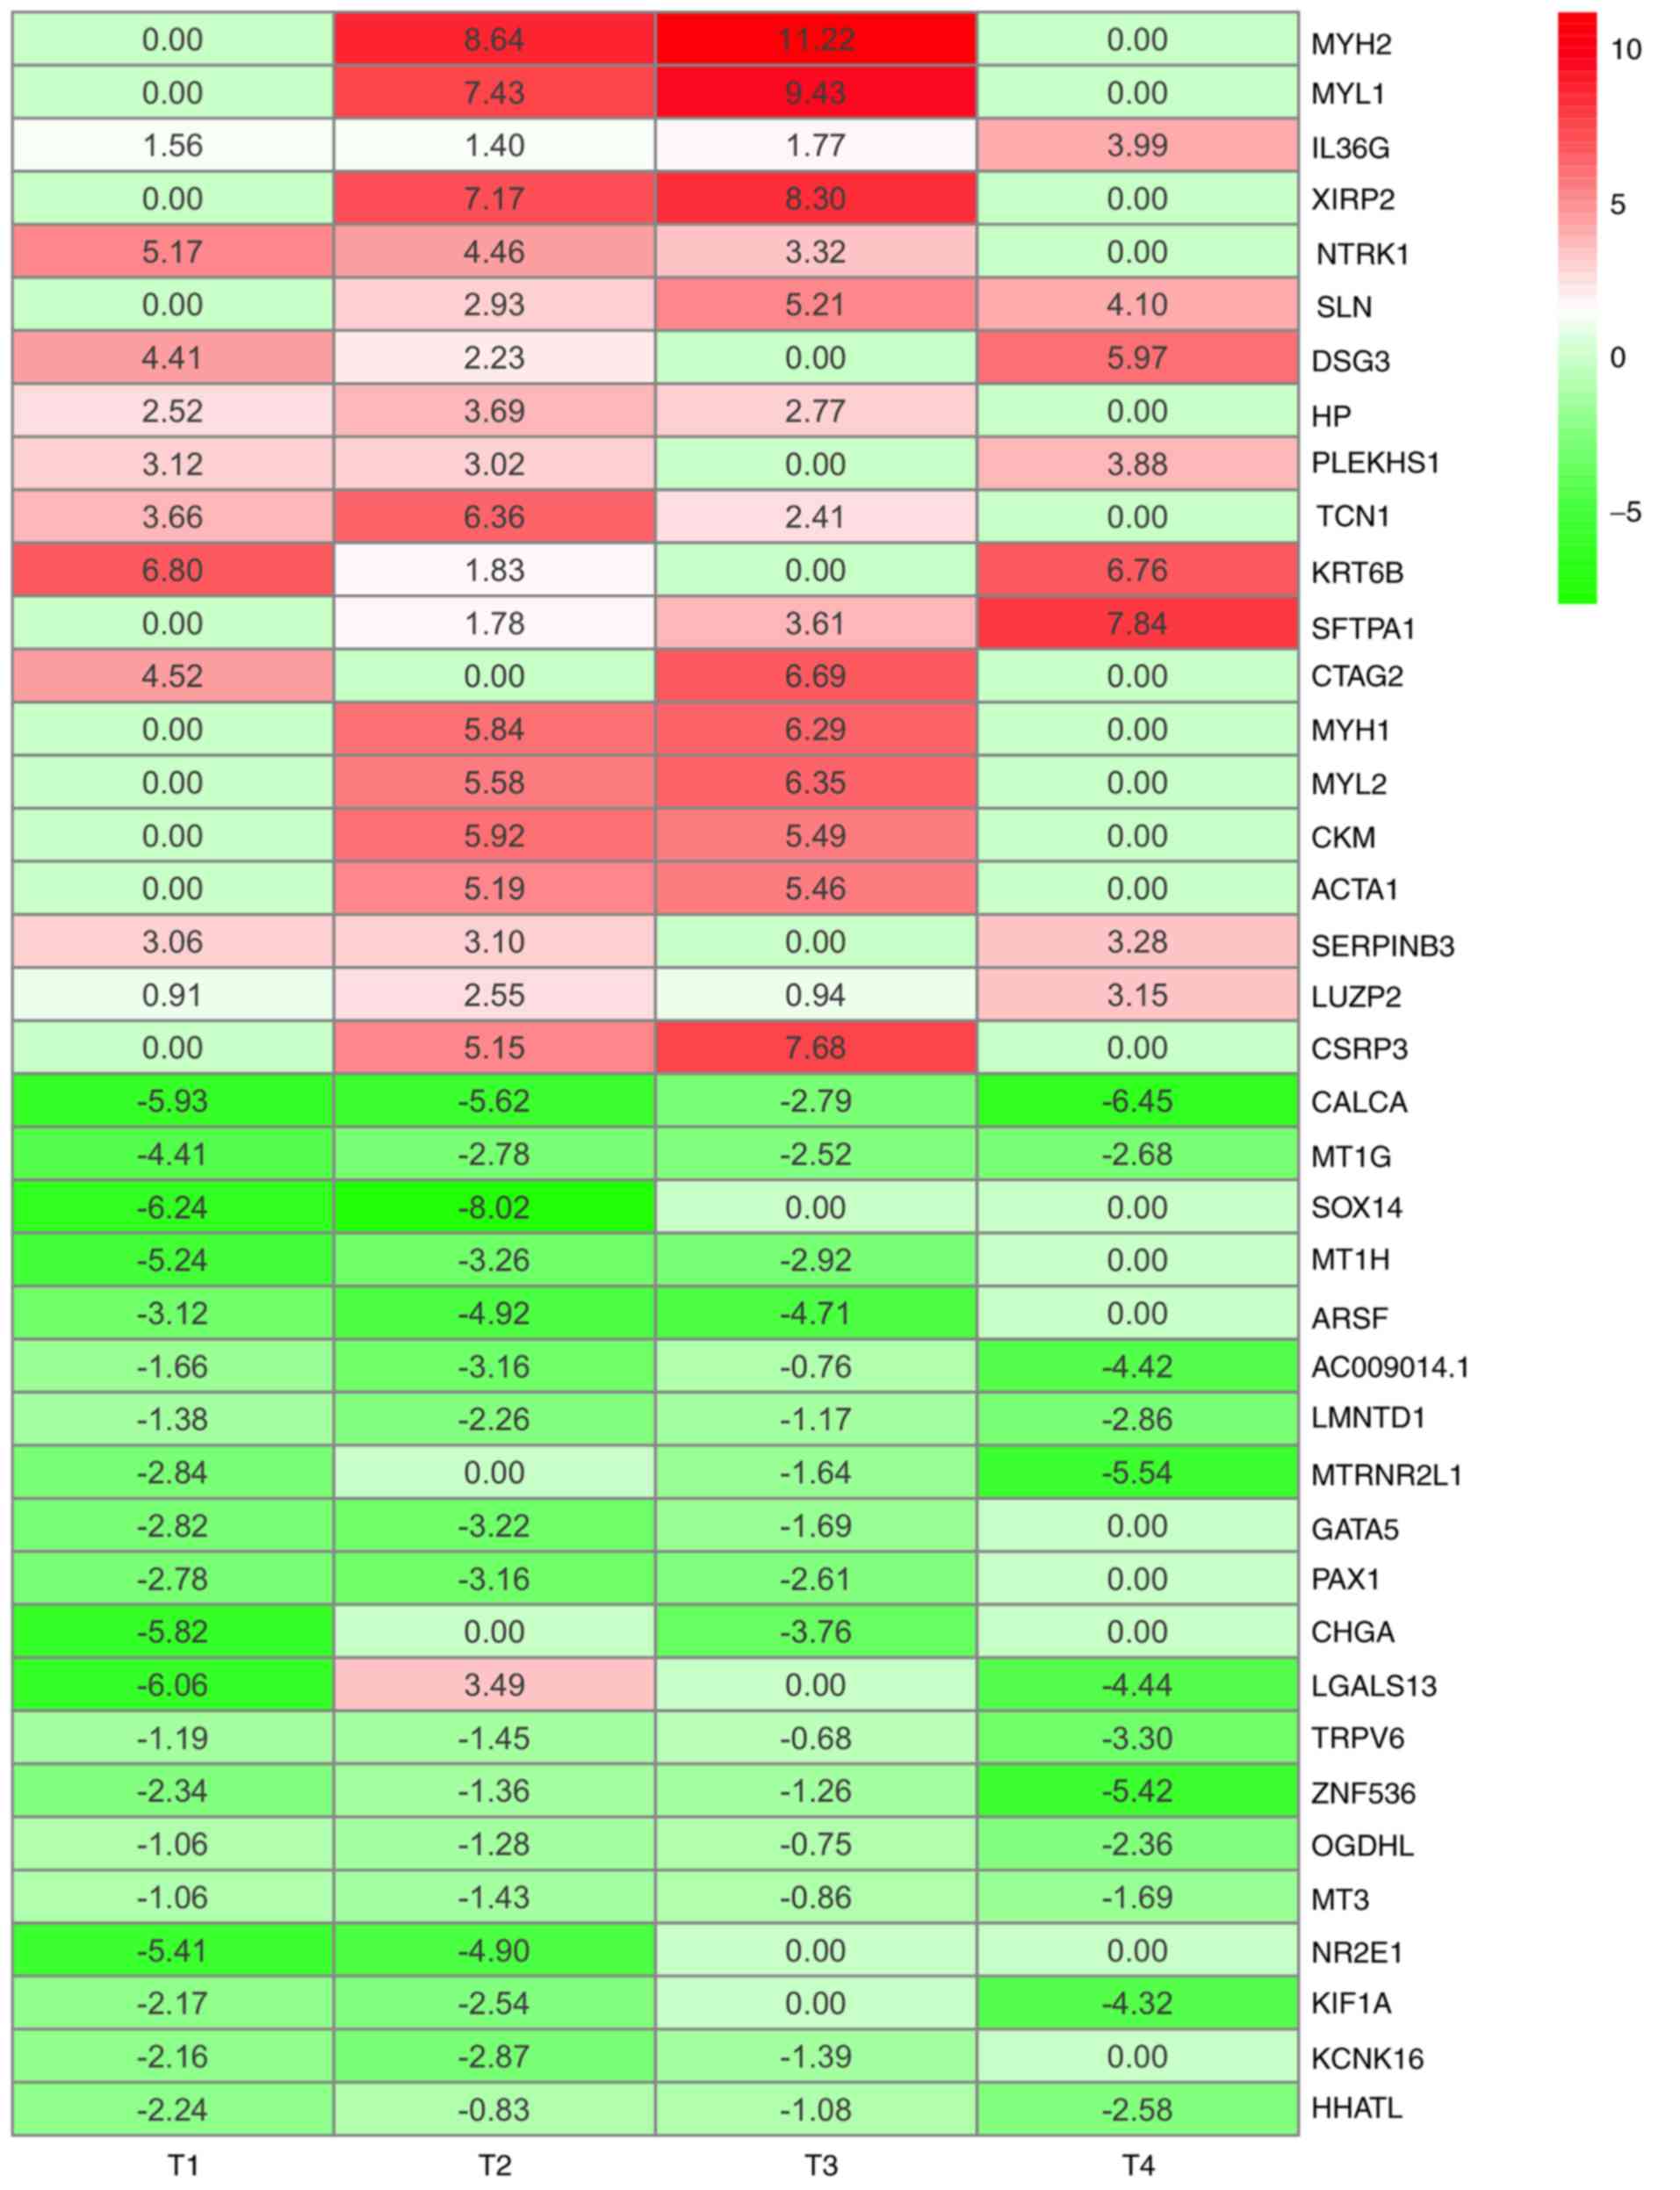
(Fig. 2). According to the
significance score for each gene, a total of 493 iDEGs were
eventually identified, including 246 upregulated genes and 247
downregulated genes. Among these iDEGs, details of the top 20
upregulated (Table I) and
downregulated genes (Table II) are
presented (Fig. 3). In addition, by
using the Venn diagram method, six upregulated genes and 24
downregulated genes were identified (Fig. S1A and B). These genes have all been
contained in RRA result (Fig. S1C and
D). These results indicated that LNM process in TC may involve
the interaction of multiple genes.
 | Table I.Top 20 upregulated integrated
differentially expressed genes identified using the robust rank
aggregation method. |
Table I.
Top 20 upregulated integrated
differentially expressed genes identified using the robust rank
aggregation method.
| Gene symbol | LogFC | P-value |
|---|
| MYH2 | 4.9649980 |
8.87×10⁷ |
| MYL1 | 4.2157600 |
3.55×10⁶ |
| IL36G | 2.1786312 |
4.56×10⁶ |
| XIRP2 | 3.8684034 |
1.42×10⁵ |
| NTRK1 | 3.2382082 |
1.50×10⁵ |
| SLN | 3.0614500 |
2.43×10⁵ |
| DSG3 | 3.1533312 |
3.24×10⁵ |
| HP | 2.2461089 |
4.03×10⁵ |
| PLEKHS1 | 2.5055146 |
4.38×10⁵ |
| TCN1 | 3.1083532 |
8.73×10⁵ |
| KTR6B | 3.8472305 |
9.31×10⁵ |
| SFTPA1 | 3.3075095 | 0.000105 |
| CTAG2 | 2.8039948 | 0.000127 |
| MYH1 | 3.0319229 | 0.000127 |
| MYL2 | 2.9843667 | 0.000173 |
| CKM | 2.8526071 | 0.000199 |
| ACTA1 | 2.6647653 | 0.000226 |
| SERPINB3 | 2.3597234 | 0.000229 |
| LUZP2 | 1.8885731 | 0.000236 |
| CSRP3 | 3.2079334 | 0.000255 |
| Table II.Top 20 downregulated integrated
differentially expressed genes identified using the robust rank
aggregation method. |
Table II.
Top 20 downregulated integrated
differentially expressed genes identified using the robust rank
aggregation method.
| Gene symbol | LogFC | P-value |
|---|
| CALCA | −5.1963956 |
3.58×10⁻¹⁰ |
| MT1G | −3.0975483 |
4.64×10⁻⁷ |
| SOX14 | −3.5652297 |
1.42×10⁻⁵ |
| MT1H | −2.8551229 |
2.43×10⁻⁵ |
| ARSF | −3.1873280 |
2.43×10⁻⁵ |
| AC009014.1 | −2.5009319 |
2.53×10⁻⁵ |
| LMNTD1 | −1.9169332 |
4.03×10⁻⁵ |
| MTRNR2L1 | −2.5038958 |
4.03×10⁻⁵ |
| GATA5 | −1.9320512 |
4.38×10⁻⁵ |
| PAX1 | −2.1391495 |
5.13×10⁻⁵ |
| CHGA | −2.3957941 |
5.66×10⁻⁵ |
| LGALS13 | −1.7503245 |
8.85×10⁻⁵ |
| TRPV6 | −1.6544989 | 0.000106 |
| ZNF536 | −2.5953115 | 0.000137 |
| OGDHL | −1.3620672 | 0.000214 |
| MT3 | 1.2591934 | 0.000220 |
| NR2E1 | −2.5790365 | 0.000255 |
| KIF1A | −2.2569354 | 0.000286 |
| KCNK16 | −1.6063756 | 0.000293 |
| HHATL | −1.6816666 | 0.000299 |
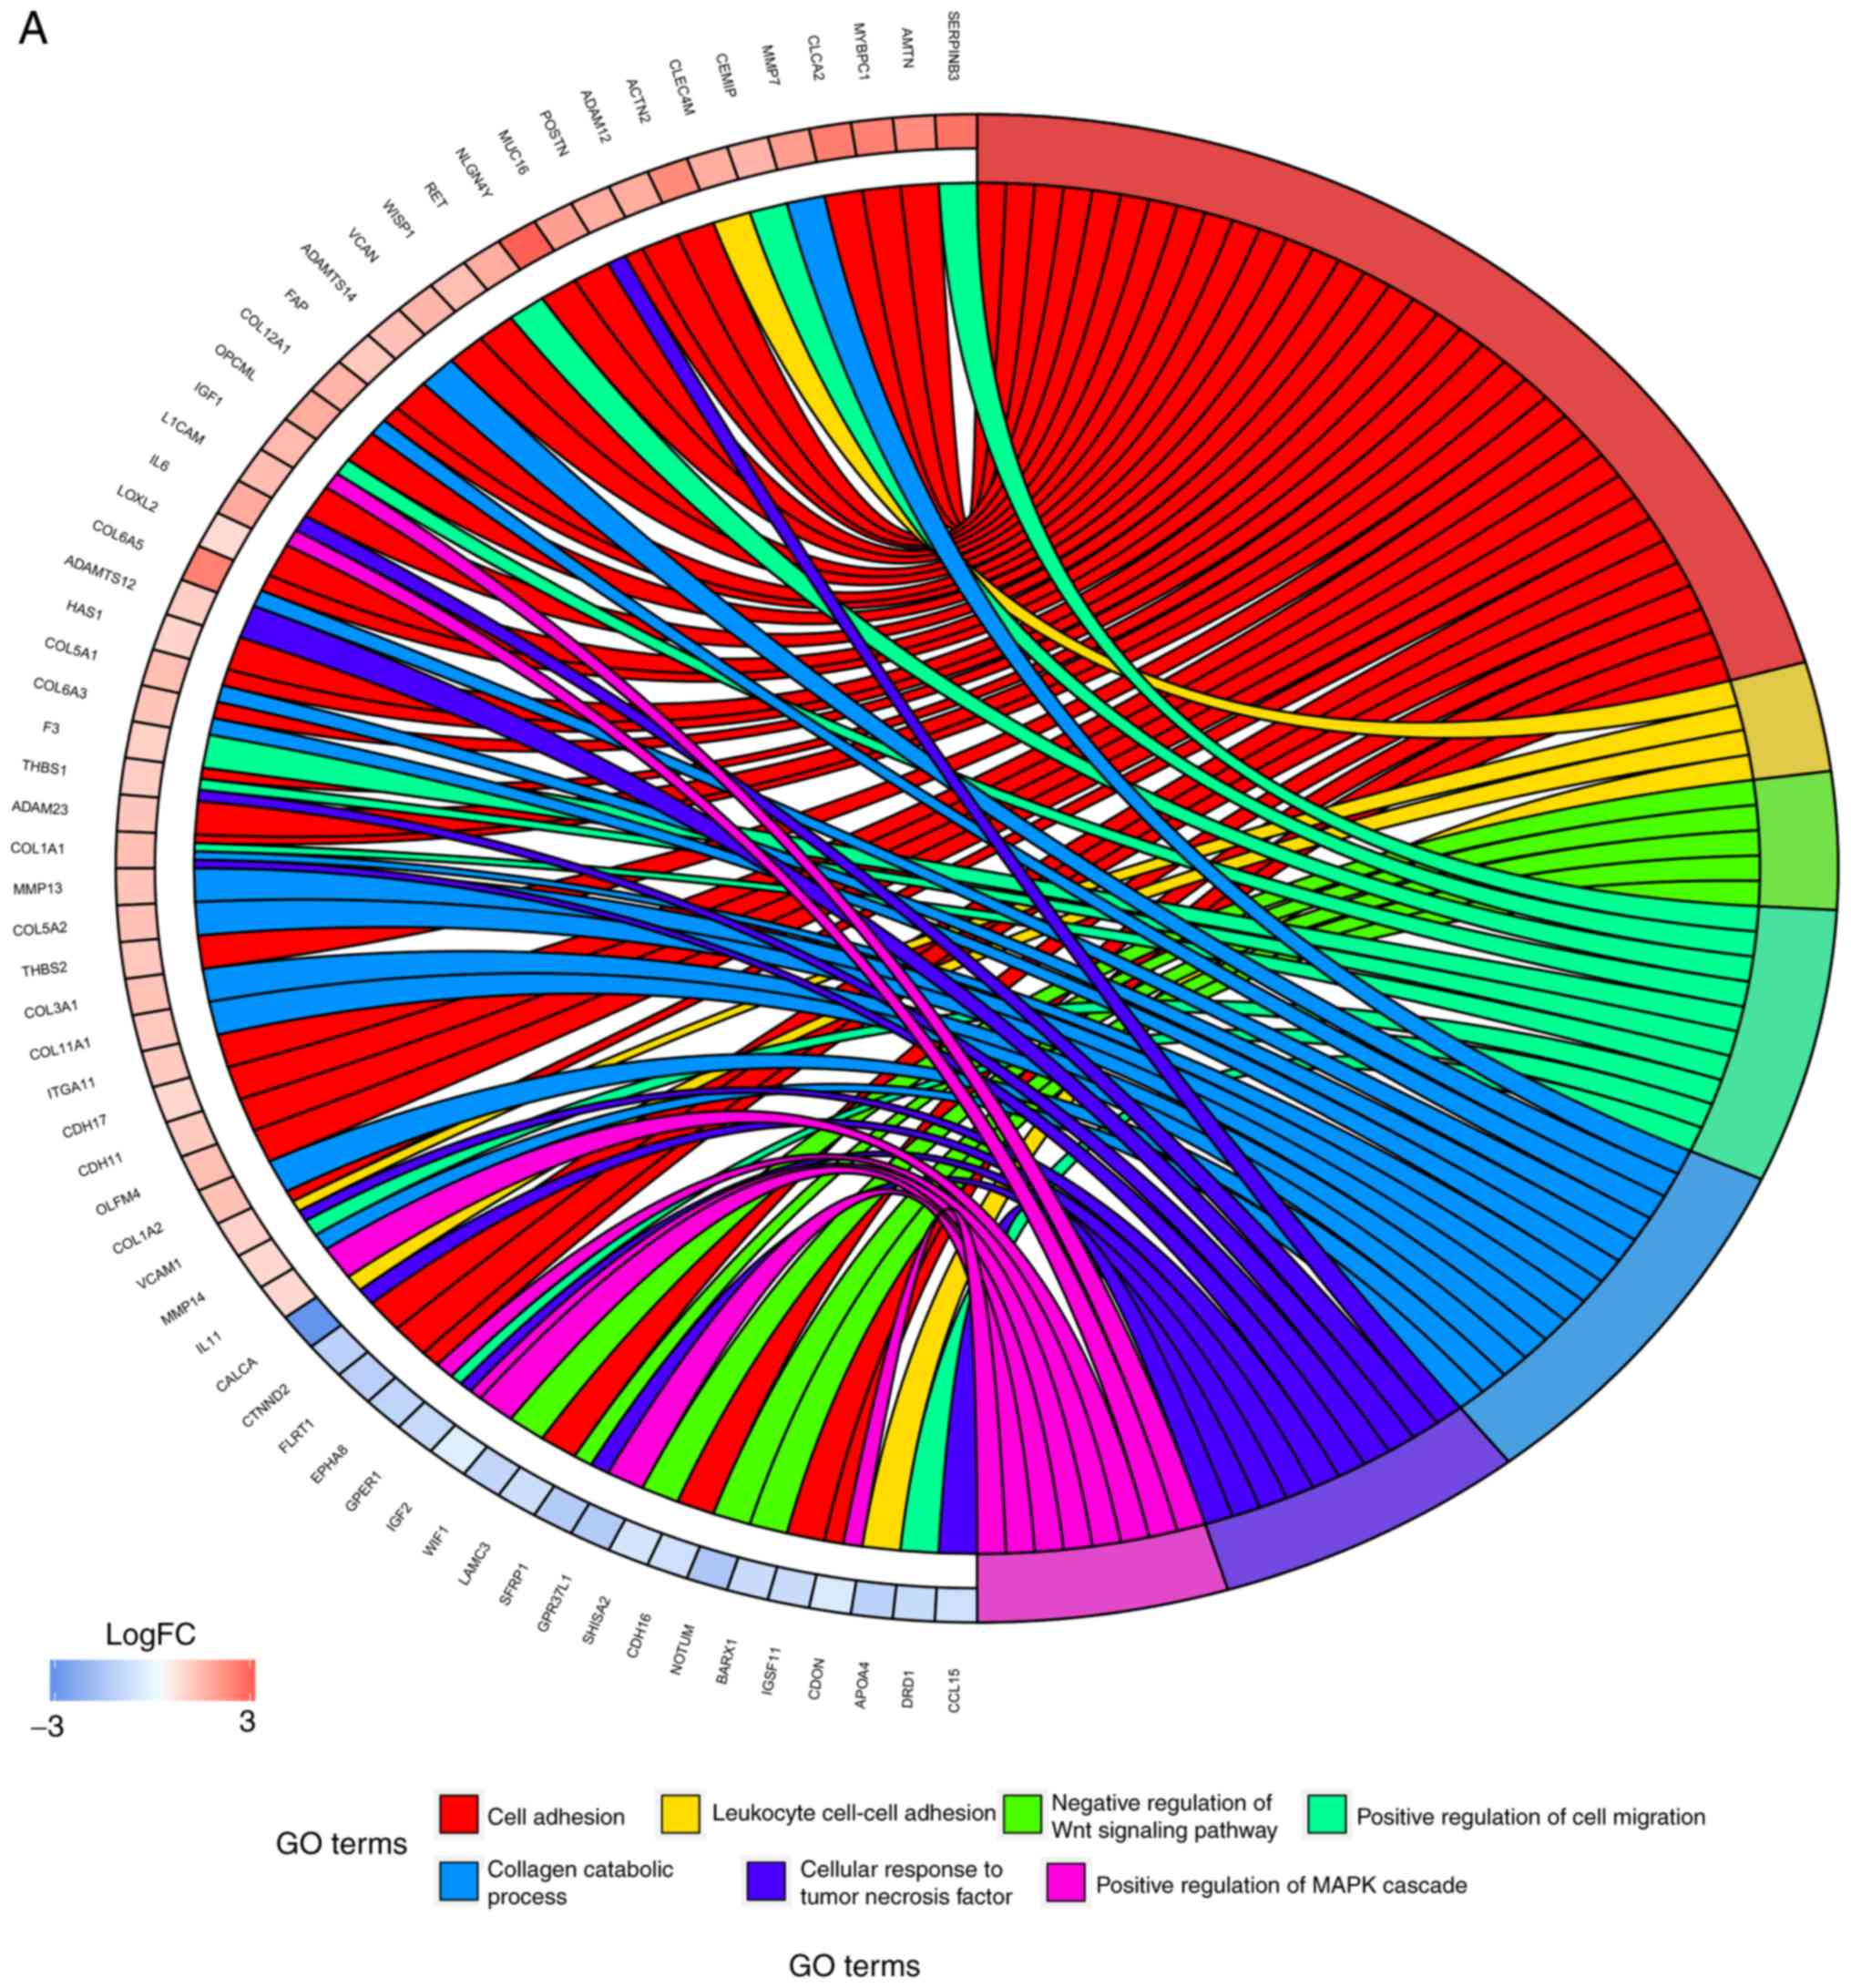
Enrichment analysis of iDEGs
In order to further investigate the potential
mechanisms of LNM in TC, GO functional annotation and KEGG pathway
enrichment analyses were performed. As presented in Fig. 4A, numerous biological processes were
identified, including ‘cell adhesion’, ‘positive regulation of cell
migration’, ‘cellular response to tumor necrosis factor’ and
‘positive regulation of MAPK cascade’. The results from KEGG
pathway enrichment analyses demonstrated that the DEGs were
predominantly involved in the pathways ‘PI3K-Akt signaling
pathway’, ‘protein digestion and absorption’, ‘focal adhesion’ and
‘ECM-receptor interaction’ (Fig.
4B). These results indicated that the iDEGs were associated
with LNM and require further investigation.
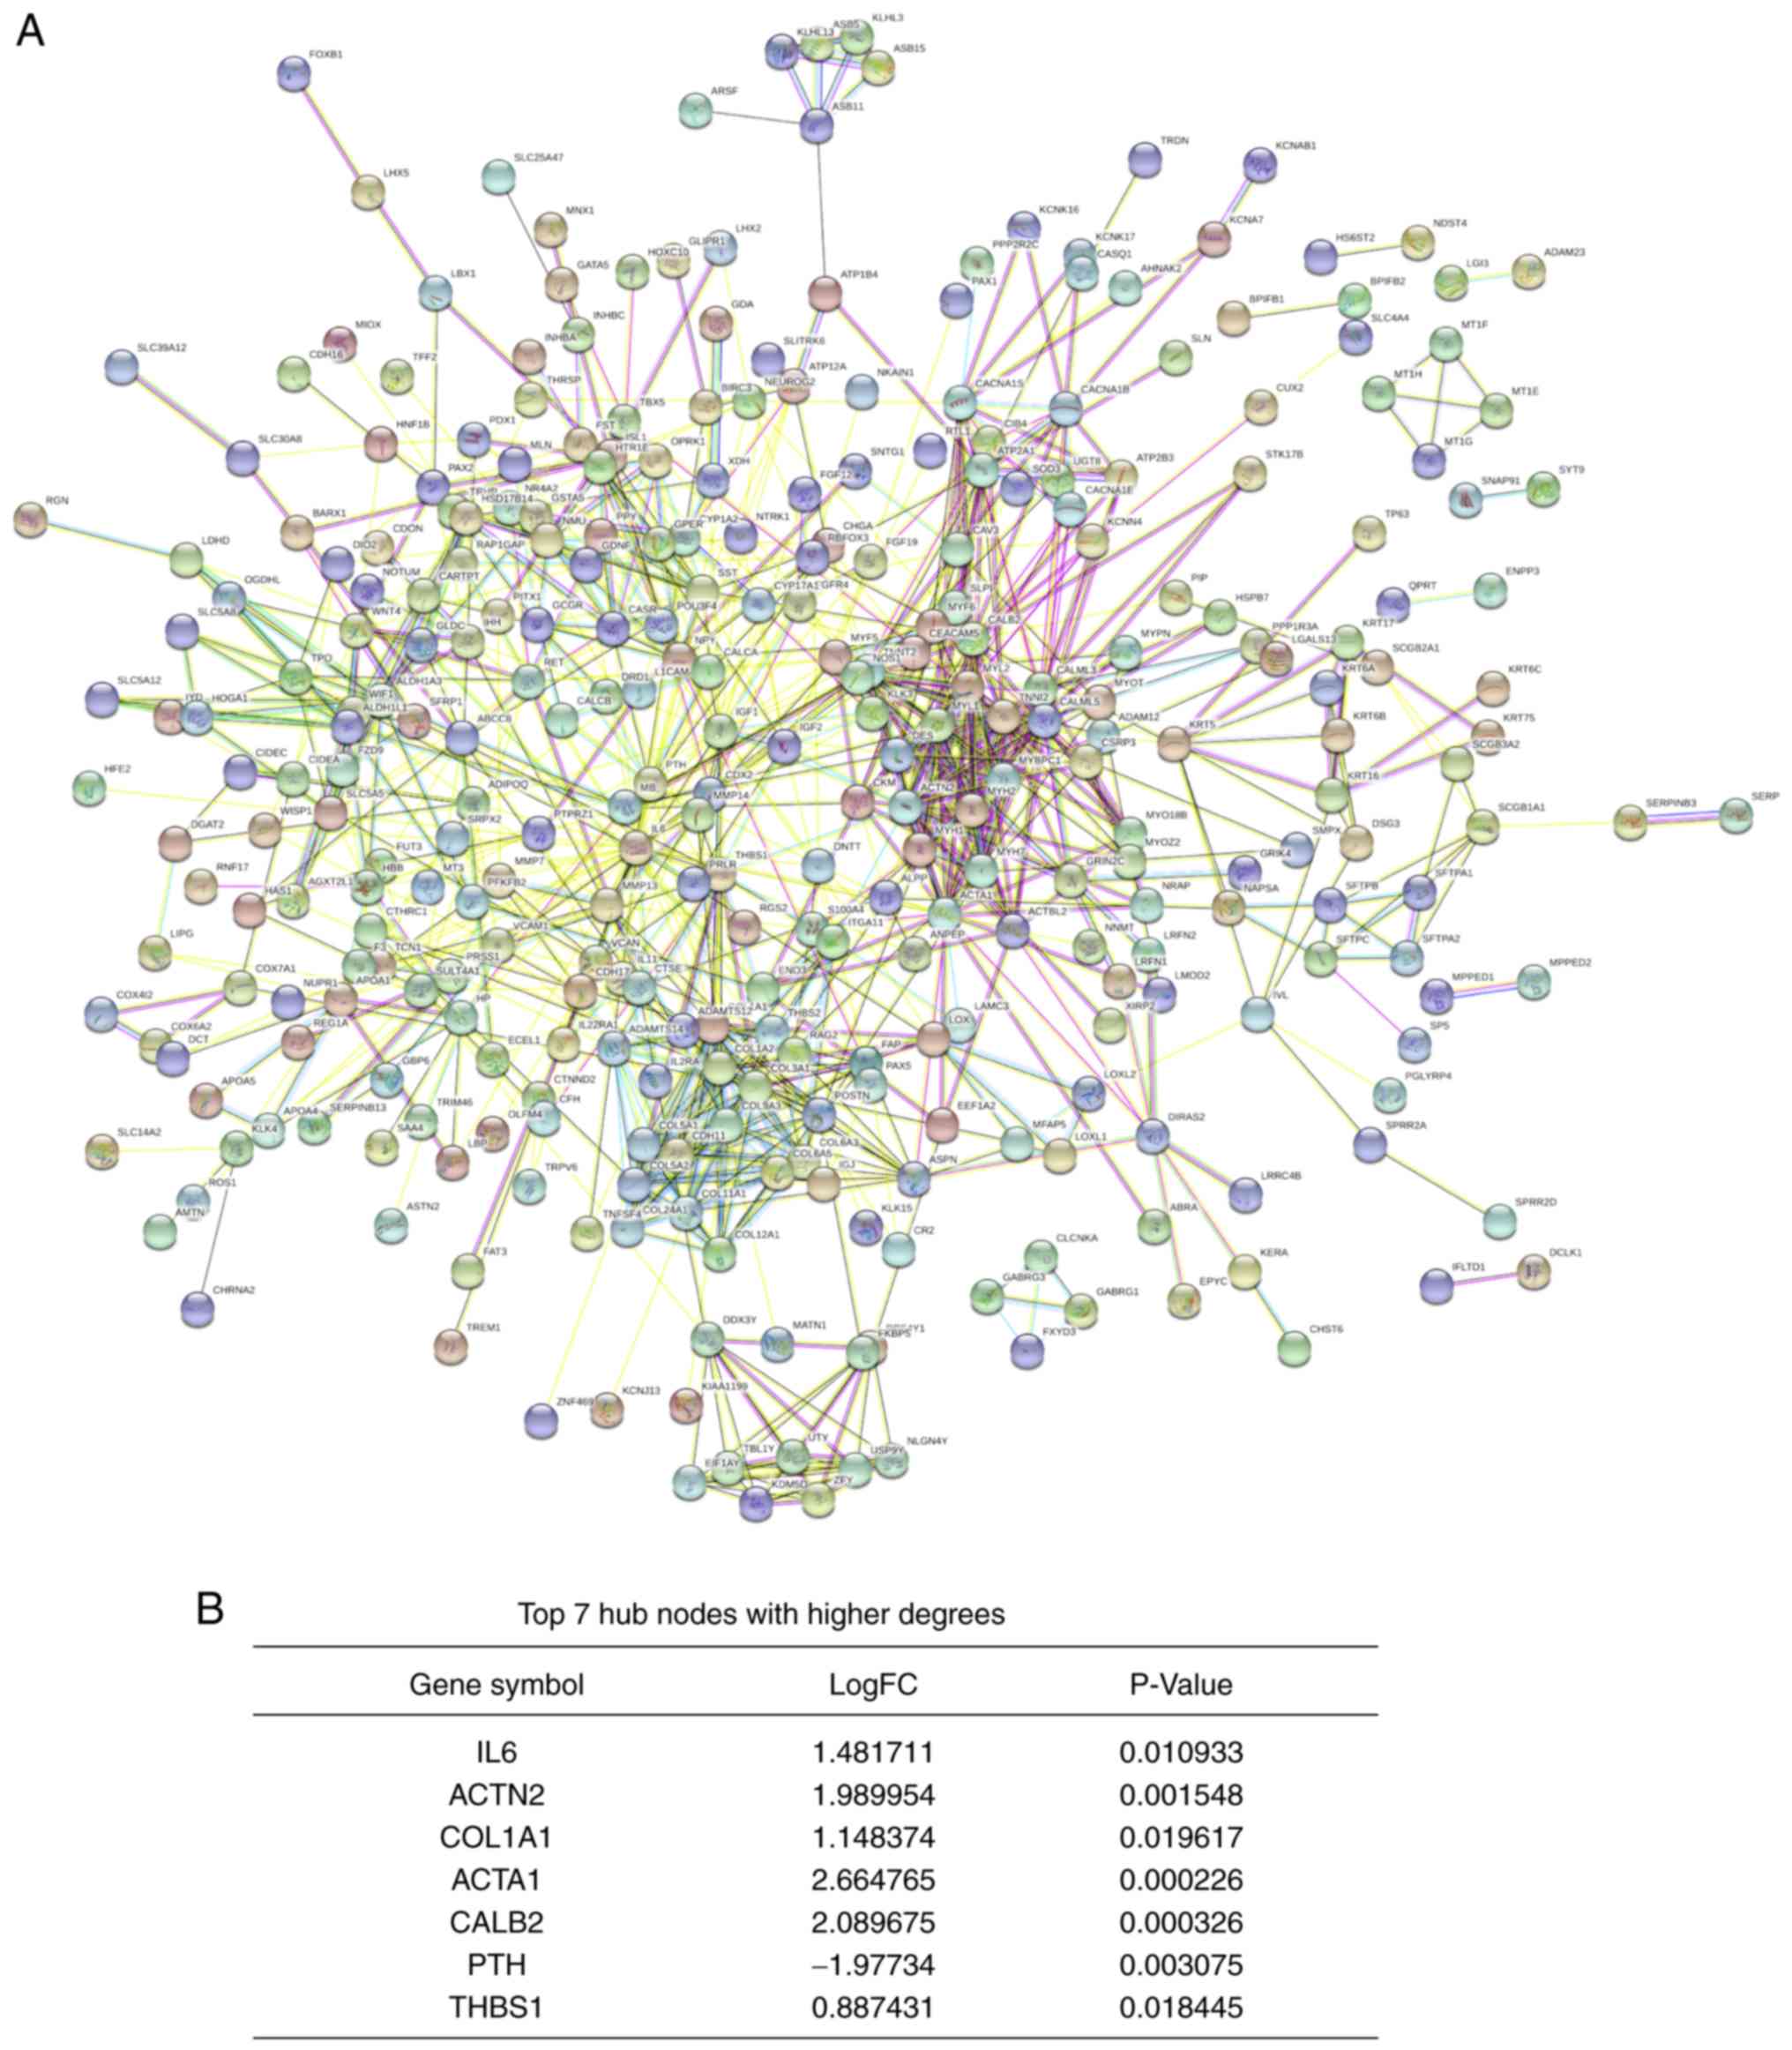
PPI network and hub genes
identification
A PPI network was constructed using the STRING
database. The network consisted of 988 edges and 483 nodes
(Fig. 5A). According to the
significance score of each node, seven hub genes were identified
using the cytoHubba plug-in. These genes included the upregulated
genes interleukin 6 (IL6), actinin α2 (ACTN2), collagen type I α 1
chain (COL1A1), actin α1 (ACTA1), calbindin 2 (CALB2) and
thrombospondin 1 (THBS1), and the downregulated gene parathyroid
hormone (PTH; Fig. 5B).
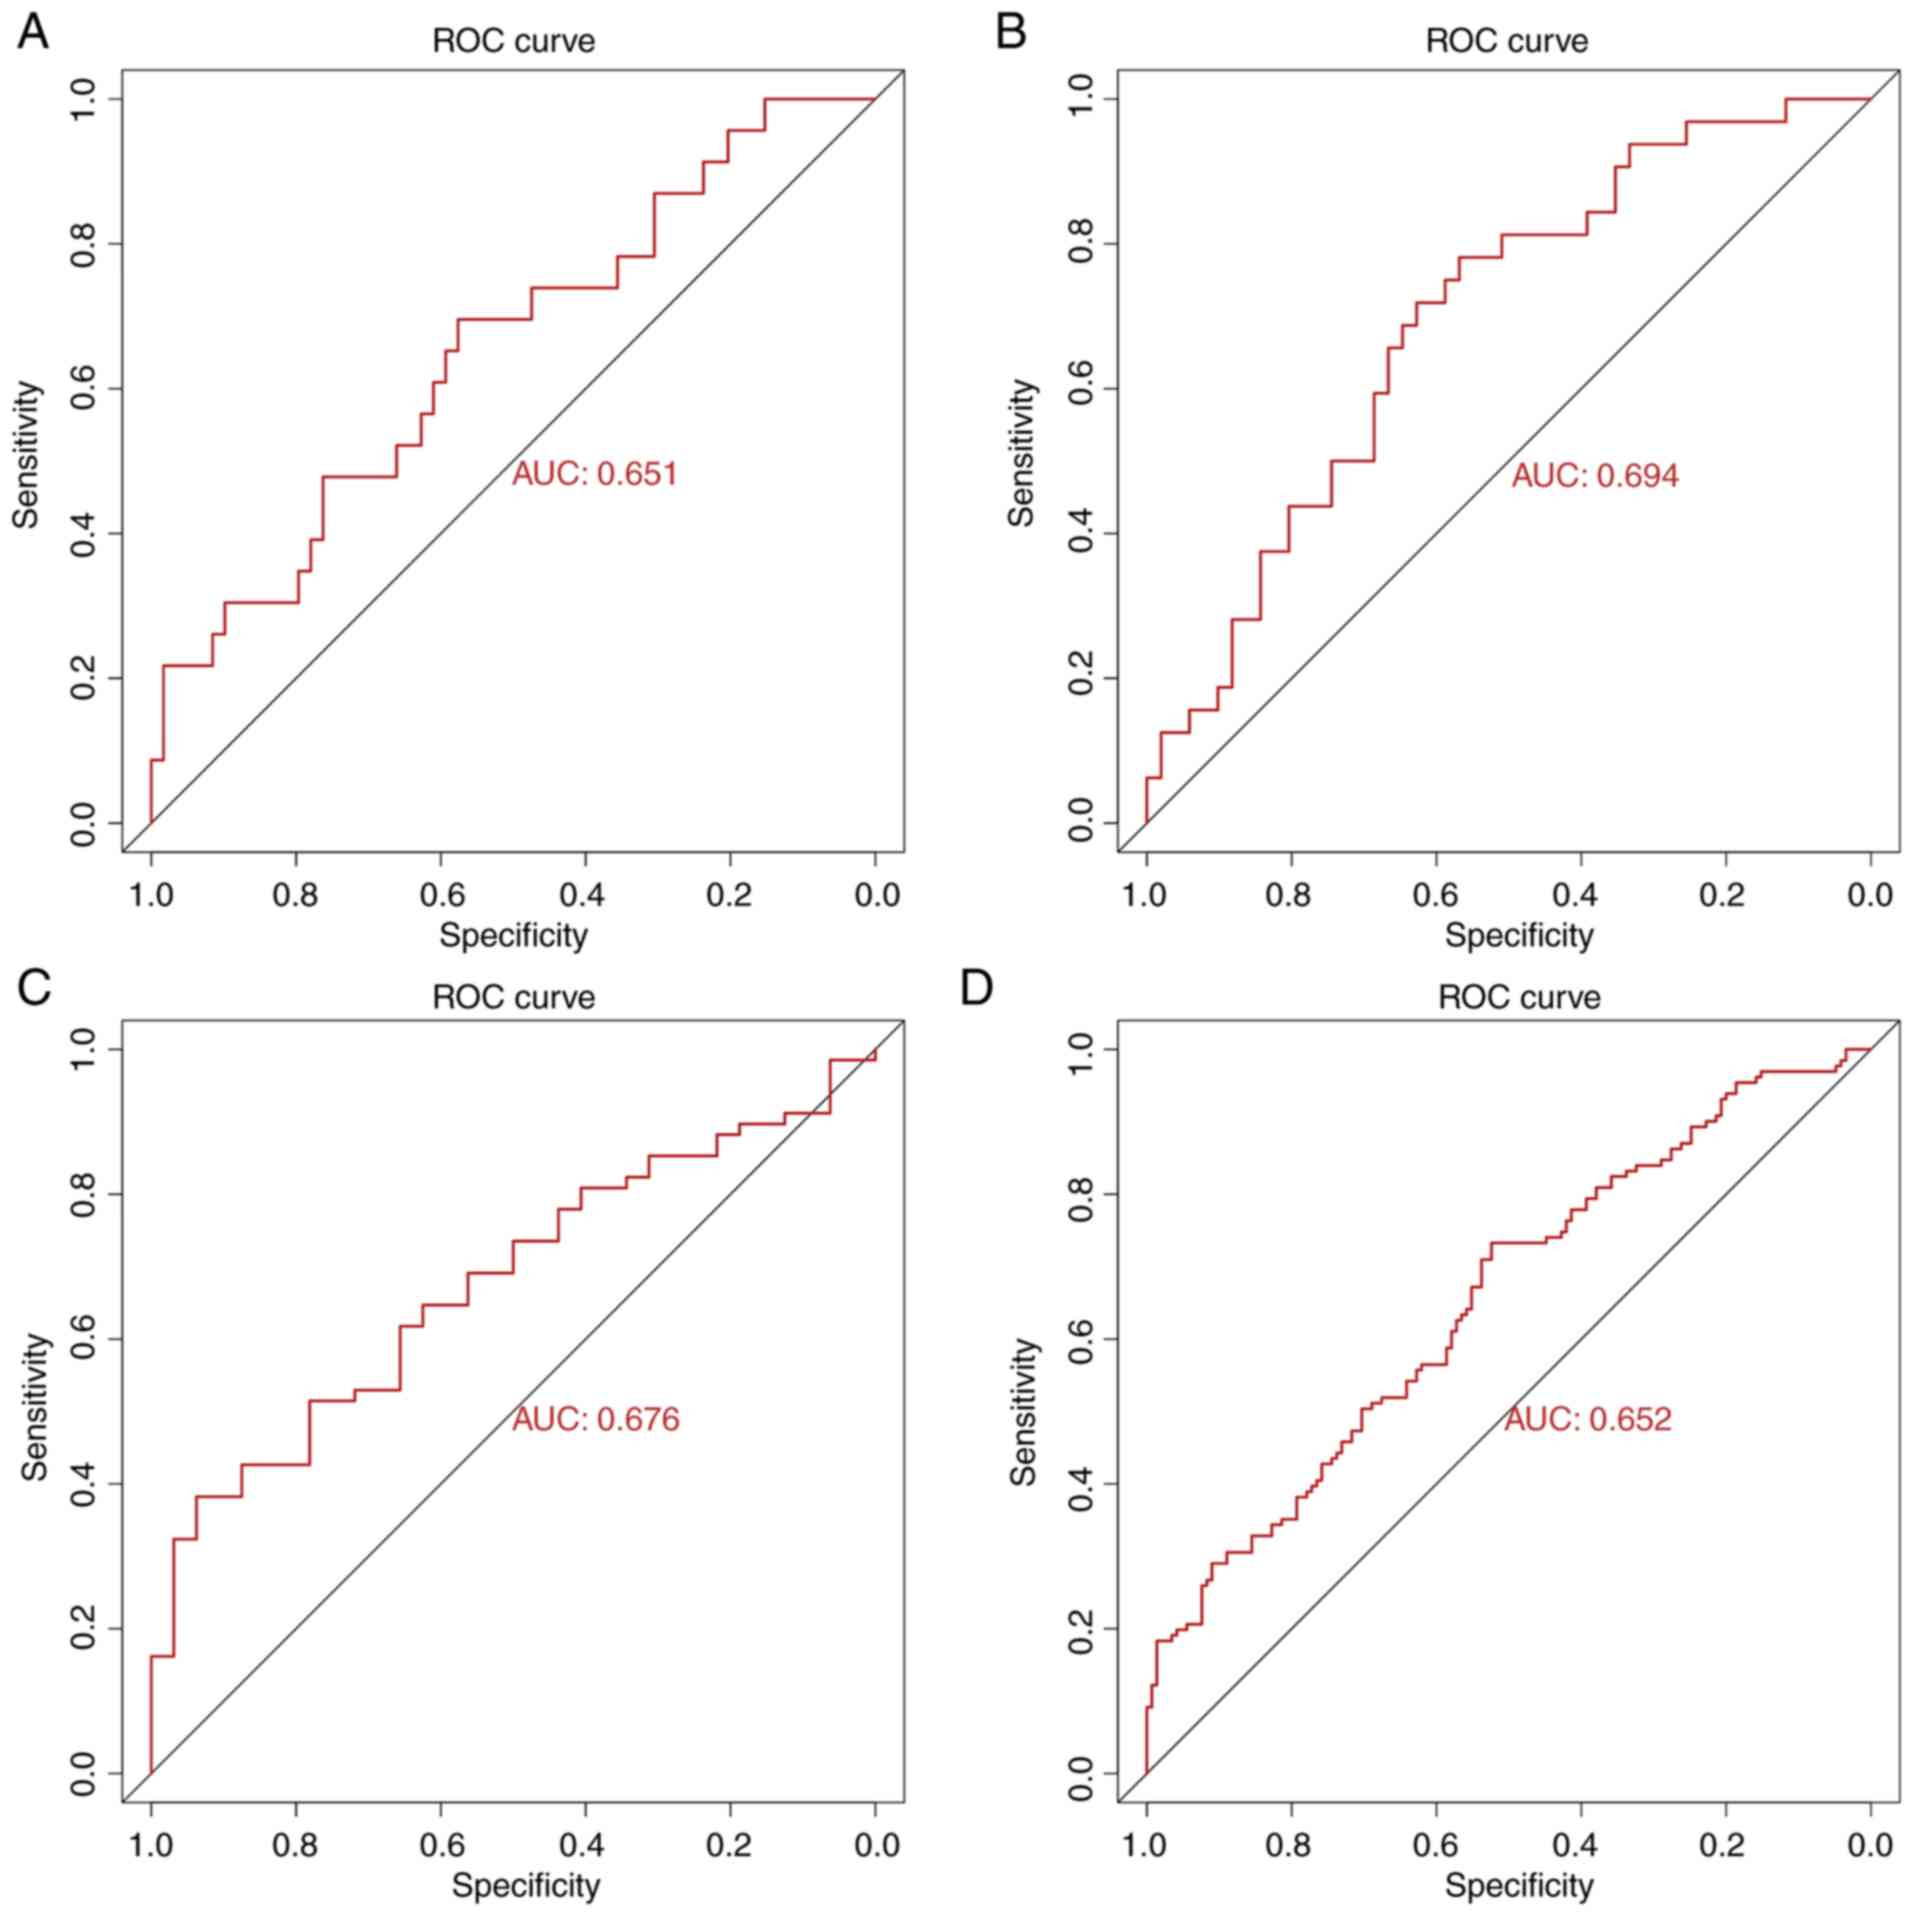
Analysis of hub genes
To validate the predictive power of the seven
identified hub genes, ROC curve analysis for each T-stage subgroup
and total ROC curve analysis for all samples were performed (due to
the small sample size of the T4 subgroup, the ROC curve could not
be presented). The AUC values for each subgroup were 0.651 (T1),
0.694 (T2), 0.676 (T3) and 0.652 (all samples; Fig. 6). These results indicated that the
seven hub genes may serve crucial role in the prediction of LNM in
TC. In addition, among these hub genes, high expression of ACTN2
indicated a worse prognosis for patients with TC (Fig. S2). To the best of our knowledge, the
present study was the first to investigate the prognosis value of
hub genes in TC.
Discussion
In the present study, 493 iDEGs were identified from
four subgroups of TC using the RRA method. Compared with the
results from the Venn diagram, all genes were included in RRA
result. These iDEGs were predominantly enriched in the pathways
‘PI3K-Akt signaling pathway’, ‘focal adhesion’, ‘ECM-receptor
interaction’ and the ‘calcium signaling pathway’ (24–26). A
total of 7 hub genes were identified from the PPI network, which
was composed of 493 iDEGs. ROC curve analysis revealed that the
combination of these 7 hub genes was a good predictive model for
LNM in TC.
Among the identified hub genes, IL6, COL1A1 and
THBS1 have been reported to participate in the process of LNM. For
example, CXCR7 may induce COL1A1 upregulation and subsequently
accelerate the LNM of PTC via the PI3K/AKT pathway (27). Furthermore, COL1A1 expression level
is higher in poorly differentiated thyroid cancer (PDTC) and
anaplastic thyroid cancer (ATC) compared with PTC (10). Both PDTC and ATC are known as
invasive pathological types of TC (10). Similarly, the present study
demonstrated that COL1A1 expression was increased in TC tissues
from the LNM group. In addition, the results from enrichment
analysis suggested that COL1A1 may promote LNM in TC through
‘ECM-receptor interaction’, ‘focal adhesion’, ‘PI3K-Akt signaling
pathway’ and ‘positive regulation of cell migration’.
The role of THBS1 in tumor metastasis remains
unclear. THBS1 is a multifunctional molecule that can affect
biological activities both positively and negatively. Duquette
et al (28) reported that
THBS1 high expression could promote ATC cell metastasis; however,
THBS1 knockdown can decrease the levels of thrombospondin 1,
integrin (ITG)α3, ITGα6 and ITGβ1 in the tumor microenvironment,
thus inhibiting ATC cell migration. In other types of cancer,
including breast cancer, gastric cancer and melanoma, it was
demonstrated that the occurrence of LNM is significantly higher in
THBS1-positive samples compared with THBS1-negative samples, which
was meditated by the PI3K/Akt/mTOR signaling pathway and
epithelial-to-mesenchymal transition (EMT) (29–32). In
the present study, THBS1 was also highly expressed and involved in
cell adhesion and positive regulation of cell migration, according
to the GO analysis. However, it has been reported that importin-11
overexpression could promote the invasion, migration and
progression of bladder cancer via the upregulation of THBS1
(33–35). Heterogeneity among the types of
cancer may explain these differences.
In addition, IL-6 overexpression can accelerate LNM
in cervical cancer, colorectal cancer and lung cancer by
stimulating cell proliferation, migration or EMT (36–38).
This is consistent with the results from the present study, which
demonstrated that IL-6 was upregulated and enriched in the PI3K-Akt
signaling pathway, indicating that IL-6 may promote LNM progression
in TC. In addition, ACTN2 downregulation was demonstrated to cause
pancreatic endocrine neoplasms metastasis in IGF-signaling cascade,
leading to cell separation and migration (39,40). The
other hub genes identified in the present study, including ACTA1,
CALB2 and PTH, may serve important role in TC with LNM; however,
this has not yet been reported. The results from the present
bioinformatics analyses require further experimental
confirmation.
In summary, the hub genes identified in this study
may exhibit crucial functions in LNM of TC via numerous mechanisms,
including ECM-receptor interaction, focal adhesion and PI3K-Akt
signaling pathway. The present study provided novel insights on the
prediction of LNM in TC, and may serve at determining the
appropriate extent of surgical resection needed to decrease
recurrence rate.
Supplementary Material
Supporting Data
Acknowledgements
Not applicable.
Funding
The present study was supported by The Zhejiang
Xinmiao Innovative Program (grant no. 2018R410053), The Key Project
of Scientific and Technological Innovation in Hangzhou (grant no.
20131813A08) and The Science Research Program of Hangzhou (grant
no. 20160533B05).
Availability of data and materials
The datasets analyzed during the present study are
available in The Cancer Genome Atlas (cancergenome.nih.gov/).
Authors' contributions
DL and WH conceived and conducted the study. SL and
RZ partially responsible for the design of study and drafted the
manuscript. JS and YZ made substantial contributions to the
acquisition and interpretation of data. JJS and CX programmed R
codes and analyzed the data. JC and RL contributed to the design of
the study and revised the manuscript. All authors read and approved
the final version of the manuscript.
Ethics approval and consent to
participate
Not applicable.
Patient consent for publication
Not applicable.
Competing interests
The authors declare that they have no competing
interests.
References
|
1
|
Siegel RL, Miller KD and Jemal A: Cancer
statistics, 2019. CA Cancer J Clin. 69:7–34. 2019. View Article : Google Scholar : PubMed/NCBI
|
|
2
|
Lim H, Devesa SS, Sosa JA, Check D and
Kitahara CM: Trends in thyroid cancer incidence and mortality in
the United States, 1974–2013. JAMA. 317:1338–1348. 2017. View Article : Google Scholar : PubMed/NCBI
|
|
3
|
Bray F, Ferlay J, Soerjomataram I, Siegel
RL, Torre LA and Jemal A: Global cancer statistics 2018: GLOBOCAN
estimates of incidence and mortality worldwide for 36 cancers in
185 countries. CA Cancer J Clin. 68:394–424. 2018. View Article : Google Scholar : PubMed/NCBI
|
|
4
|
Davies L and Welch HG: Current thyroid
cancer trends in the United States. JAMA Otolaryngol Head Neck
Surg. 140:317–322. 2014. View Article : Google Scholar : PubMed/NCBI
|
|
5
|
Morris LG, Sikora AG, Tosteson TD and
Davies L: The increasing incidence of thyroid cancer: The influence
of access to care. Thyroid. 23:885–891. 2013. View Article : Google Scholar : PubMed/NCBI
|
|
6
|
Zhang L, Wei WJ, Ji QH, Zhu YX, Wang ZY,
Wang Y, Huang CP, Shen Q, Li DS and Wu Y: Risk factors for neck
nodal metastasis in papillary thyroid microcarcinoma: A study of
1066 patients. J Clin Endocrinol Metab. 97:1250–1257. 2012.
View Article : Google Scholar : PubMed/NCBI
|
|
7
|
Adam MA, Pura J, Goffredo P, Dinan MA,
Reed SD, Scheri RP, Hyslop T, Roman SA and Sosa JA: Presence and
number of lymph node metastases are associated with compromised
survival for patients younger than age 45 years with papillary
thyroid cancer. J Clin Oncol. 33:2370–2375. 2015. View Article : Google Scholar : PubMed/NCBI
|
|
8
|
Zhang Q, Wang Z, Meng X, Duh QY and Chen
G: Predictors for central lymph node metastases in CN0 papillary
thyroid microcarcinoma (mPTC): A retrospect analysis of 1304 cases.
Asian J Surg. 42:571–576. 2019. View Article : Google Scholar : PubMed/NCBI
|
|
9
|
Pisanu A, Saba A, Podda M, Reccia I and
Uccheddu A: Nodal metastasis and recurrence in papillary thyroid
microcarcinoma. Endocrine. 48:575–581. 2014. View Article : Google Scholar : PubMed/NCBI
|
|
10
|
Jin WX, Ye DR, Sun YH, Zhou XF, Wang OC,
Zhang XH and Cai YF: Prediction of central lymph node metastasis in
papillary thyroid microcarcinoma according to clinicopathologic
factors and thyroid nodule sonographic features: A case-control
study. Cancer Manag Res. 10:3237–3243. 2018. View Article : Google Scholar : PubMed/NCBI
|
|
11
|
Xia E, Wang Y, Bhandari A, Niu J, Yang F,
Yao Z and Wang O: CITED1 gene promotes proliferation, migration and
invasion in papillary thyroid cancer. Oncol Lett. 16:105–112.
2018.PubMed/NCBI
|
|
12
|
Jin Y, Jin W, Zheng Z, Chen E, Wang Q,
Wang Y, Wang O and Zhang X: GABRB2 plays an important role in the
lymph node metastasis of papillary thyroid cancer. Biochem Biophys
Res Commun. 492:323–330. 2017. View Article : Google Scholar : PubMed/NCBI
|
|
13
|
Collins A: The cancer genome atlas (TCGA)
pilot project. Cancer Res. 67:2007.
|
|
14
|
Perrier ND, Brierley JD and Tuttle RM:
Differentiated and anaplastic thyroid carcinoma: Major changes in
the American joint committee on cancer eighth edition cancer
staging manual. CA Cancer J Clin. 68:55–63. 2018. View Article : Google Scholar : PubMed/NCBI
|
|
15
|
McCarthy DJ, Chen Y and Smyth GK:
Differential expression analysis of multifactor RNA-Seq experiments
with respect to biological variation. Nucleic Acids Res.
40:4288–4297. 2012. View Article : Google Scholar : PubMed/NCBI
|
|
16
|
Kolde R, Laur S, Adler P and Vilo J:
Robust rank aggregation for gene list integration and
meta-analysis. Bioinformatics. 28:573–580. 2012. View Article : Google Scholar : PubMed/NCBI
|
|
17
|
Huang da W, Sherman BT and Lempicki RA:
Systematic and integrative analysis of large gene lists using DAVID
bioinformatics resources. Nat Protoc. 4:44–57. 2009. View Article : Google Scholar : PubMed/NCBI
|
|
18
|
Walter W, Sánchez-Cabo F and Ricote M:
GOplot: An R package for visually combining expression data with
functional analysis. Bioinformatics. 31:2912–2914. 2015. View Article : Google Scholar : PubMed/NCBI
|
|
19
|
Yu G, Wang LG, Han Y and He QY:
clusterProfiler: An R package for comparing biological themes among
gene clusters. OMICS. 16:284–287. 2012. View Article : Google Scholar : PubMed/NCBI
|
|
20
|
Szklarczyk D, Gable AL, Lyon D, Junge A,
Wyder S, Huerta-Cepas J, Simonovic M, Doncheva NT, Morris JH, Bork
P, et al: STRING v11: Protein-protein association networks with
increased coverage, supporting functional discovery in genome-wide
experimental datasets. Nucleic Acids Res. 47(D1): D607–D613. 2019.
View Article : Google Scholar : PubMed/NCBI
|
|
21
|
Shannon P, Markiel A, Ozier O, Baliga NS,
Wang JT, Ramage D, Amin N, Schwikowski B and Ideker T: Cytoscape: A
software environment for integrated models of biomolecular
interaction networks. Genome Res. 13:2498–2504. 2003. View Article : Google Scholar : PubMed/NCBI
|
|
22
|
Chin CH, Chen SH, Wu HH, Ho CW, Ko MT and
Lin CY: cytoHubba: Identifying hub objects and sub-networks from
complex interactome. BMC Syst Biol. 8 (Suppl 4):S112014. View Article : Google Scholar : PubMed/NCBI
|
|
23
|
Robin X, Turck N, Hainard A, Tiberti N,
Lisacek F, Sanchez JC and Müller M: pROC: An open-source package
for R and S+ to analyze and compare ROC curves. BMC Bioinformatics.
12:772011. View Article : Google Scholar : PubMed/NCBI
|
|
24
|
Wang N, Li Y, Wei J, Pu J, Liu R, Yang Q,
Guan H, Shi B, Hou P and Ji M: TBX1 functions as a tumor suppressor
in thyroid cancer through inhibiting the activities of the PI3K/AKT
and MAPK/ERK pathways. Thyroid. 29:378–394. 2019. View Article : Google Scholar : PubMed/NCBI
|
|
25
|
Choi C, Thi Thao Tran N, Van Ngu T, Park
SW, Song MS, Kim SH, Bae YU, Ayudthaya PDN, Munir J, Kim E, et al:
Promotion of tumor progression and cancer stemness by MUC15 in
thyroid cancer via the GPCR/ERK and integrin-FAK signaling
pathways. Oncogenesis. 7:852018. View Article : Google Scholar : PubMed/NCBI
|
|
26
|
Vitale G, Dicitore A, Pepe D, Gentilini D,
Grassi ES, Borghi MO, Gelmini G, Cantone MC, Gaudenzi G, Misso G,
et al: Synergistic activity of everolimus and
5-aza-2′-deoxycytidine in medullary thyroid carcinoma cell lines.
Mol Oncol. 11:1007–1022. 2017. View Article : Google Scholar : PubMed/NCBI
|
|
27
|
Zhang H, Teng X and Liu Z, Zhang L and Liu
Z: Gene expression profile analyze the molecular mechanism of CXCR7
regulating papillary thyroid carcinoma growth and metastasis. J Exp
Clin Cancer Res. 34:162015. View Article : Google Scholar : PubMed/NCBI
|
|
28
|
Duquette M, Sadow PM, Lawler J and Nucera
C: Thrombospondin-1 silencing down-regulates integrin expression
levels in human anaplastic thyroid cancer cells with BRAF(V600E):
New insights in the host tissue adaptation and homeostasis of tumor
microenvironment. Front Endocrinol (Lausanne). 4:1892013.
View Article : Google Scholar : PubMed/NCBI
|
|
29
|
Yee KO, Connolly CM, Duquette M,
Kazerounian S, Washington R and Lawler J: The effect of
thrombospondin-1 on breast cancer metastasis. Breast Cancer Res
Treat. 114:85–96. 2009. View Article : Google Scholar : PubMed/NCBI
|
|
30
|
Huang T, Wang L, Liu D, Li P, Xiong H,
Zhuang L, Sun L, Yuan X and Qiu H: FGF7/FGFR2 signal promotes
invasion and migration in human gastric cancer through upregulation
of thrombospondin-1. Int J Oncol. 50:1501–1512. 2017. View Article : Google Scholar : PubMed/NCBI
|
|
31
|
Borsotti P, Ghilardi C, Ostano P, Silini
A, Dossi R, Pinessi D, Foglieni C, Scatolini M, Lacal PM, Ferrari
R, et al: Thrombospondin-1 is part of a Slug-independent motility
and metastatic program in cutaneous melanoma, in association with
VEGFR-1 and FGF-2. Pigment Cell Melanoma Res. 28:73–81. 2015.
View Article : Google Scholar : PubMed/NCBI
|
|
32
|
Jayachandran A, Anaka M, Prithviraj P,
Hudson C, McKeown SJ, Lo PH, Vella LJ, Goding CR, Cebon J and
Behren A: Thrombospondin 1 promotes an aggressive phenotype through
epithelial-to-mesenchymal transition in human melanoma. Oncotarget.
5:5782–5797. 2014. View Article : Google Scholar : PubMed/NCBI
|
|
33
|
Zhao J, Shi L, Zeng S, Ma C, Xu W, Zhang
Z, Liu Q, Zhang P, Sun Y and Xu C: Importin-11 overexpression
promotes the migration, invasion, and progression of bladder cancer
associated with the deregulation of CDKN1A and THBS1. Urol Oncol.
36:311.e1–311.e13. 2018. View Article : Google Scholar
|
|
34
|
Teraoku H, Morine Y, Ikemoto T, Saito Y,
Yamada S, Yoshikawa M, Takasu C, Higashijima J, Imura S and Shimada
M: Role of thrombospondin-1 expression in colorectal liver
metastasis and its molecular mechanism. J Hepatobiliary Pancreat
Sci. 23:565–573. 2016. View
Article : Google Scholar : PubMed/NCBI
|
|
35
|
Tzeng HT, Tsai CH, Yen YT, Cheng HC, Chen
YC, Pu SW, Wang YS, Shan YS, Tseng YL, Su WC, et al: Dysregulation
of Rab37-mediated cross-talk between cancer cells and endothelial
cells via thrombospondin-1 promotes tumor neovasculature and
metastasis. Clin Cancer Res. 23:2335–2345. 2017. View Article : Google Scholar : PubMed/NCBI
|
|
36
|
Han J, Meng Q, Xi Q, Zhang Y, Zhuang Q,
Han Y, Jiang Y, Ding Q and Wu G: Interleukin-6 stimulates aerobic
glycolysis by regulating PFKFB3 at early stage of colorectal
cancer. Int J Oncol. 48:215–224. 2016. View Article : Google Scholar : PubMed/NCBI
|
|
37
|
Luan S, An Z, Bi S, Chen L and Fan J:
Interleukin 6 receptor (IL-6R) was an independent prognostic factor
in cervical cancer. Histol Histopathol. 33:269–276. 2018.PubMed/NCBI
|
|
38
|
Shang GS, Liu L and Qin YW: IL-6 and TNF-α
promote metastasis of lung cancer by inducing
epithelial-mesenchymal transition. Oncol Lett. 13:4657–4660. 2017.
View Article : Google Scholar : PubMed/NCBI
|
|
39
|
Hansel DE, Rahman A, House M, Ashfaq R,
Berg K, Yeo CJ and Maitra A: Met proto-oncogene and insulin-like
growth factor binding protein 3 overexpression correlates with
metastatic ability in well-differentiated pancreatic endocrine
neoplasms. Clin Cancer Res. 10:6152–6158. 2004. View Article : Google Scholar : PubMed/NCBI
|
|
40
|
Guvakova MA, Adams JC and Boettiger D:
Functional role of alpha-actinin, PI 3-kinase and MEK1/2 in
insulin-like growth factor I receptor kinase regulated motility of
human breast carcinoma cells. J Cell Sci. 115:4149–4165. 2002.
View Article : Google Scholar : PubMed/NCBI
|