Introduction
Cancer is considered as one of the four major
non-communicable diseases (1). Due
to a delay in diagnosis, its poor prognosis and high recurrence
rate, cancer is becoming one of the leading causes of mortality
worldwide (2,3). Cancer incidence and mortality rates
have increased over the last decade. The global cancer burden is
estimated to have risen to 18.1 million new cancer cases, and 9.6
million cancer-associated mortalities were reported in 2018
(4), compared with 12.7 million and
7.6 million, respectively, in 2008 (5). Therefore, there is an urgent need to
explore novel potential cancer biomarkers that will have beneficial
prognostic and therapeutic implications.
Biglycan (BGN; also known as proteoglycan-1 and
dermatan sulfate PG-1) is a single-copy gene localized on the long
arm of human X chromosome Xq13-qter (6). This gene contains at least two introns
and it spans ~6 kb in length (7).
BGN is a key member of the small leucine-rich proteoglycan family
that resides at the cell surface or in the pericellular space of
tissues (8). BGN is typically
expressed in the nerve, bone, cartilage, skin and muscles,
modulating the morphology, growth, adhesion, bone mineralization,
inflammation, migration and differentiation of epithelial cells
(9). The upregulation of BGN has
been reported in multiple types of solid cancer, including ovarian
carcinoma (10), prostate cancer
(11), pancreatic cancer (12), gastric cancer (13) and colon cancer (14). Overexpressed BGN has been reported to
be associated with the aggressive growth and metastasis of tumors
(13,14), and with a worse prognosis for
patients with gastric cancer (15)
and pancreatic adenocarcinoma (16).
These findings suggest that the BGN gene may act as either a
potential therapeutic target or prognostic biomarker in multiple
types of cancer. However, the transcriptional expression and
prognostic value of the BGN gene in human cancers requires
further investigation.
The present study investigated the mRNA expression
levels of BGN in human normal and cancer tissues, using the
Oncomine database. In addition, the prognostic value of BGN mRNA
expression in patients with cancer was also assessed using the
UALCAN, OncoLnc and the Kaplan-Meier Plotter databases. Finally,
co-expression gene analysis was conducted using the protein-protein
interaction (PPI) networks of BGN.
Materials and methods
Analysis of BGN expression in multiple
cancers using Oncomine
Oncomine is a cancer microarray database and
web-based data-mining platform aimed at facilitating discovery from
genome-wide expression analyses, as well as comparing the
transcriptome data in multiple types of cancer, respective to
normal tissues (17). To date, the
Oncomine database contains 19 cancer types, 715 datasets and 86,733
samples, corresponding to ~48 million gene expression measurements.
Differential mRNA level analyses of BGN were compared between
normal tissues and malignant human tissues in different types of
cancer, using the Oncomine database. In the present study, the
thresholds were set at 2-fold change, P<1×10⁻⁴ and
the top 10% gene rank.
Analysis using the Kaplan-Meier (KM)
plotter, UALCAN and OncoLnc databases
The prognostic significance of the mRNA expression
levels of BGN in various types of cancer was evaluated using KM
plotter (http://www.kmplot.com), UALCAN
(http://ualcan.path.uab.edu) and OncoLnc
(http://oncolnc.org). These online databases can be
used to assess the effect of gene expression on cancer prognosis.
The three databases of KM plotter, OncoLnc and UALCAN contain the
same RNA-seq data (from TCGA) for 20 http://www.kmplot.com/analysis/index.php?p=service&cancer=pancancer_rnaseq,
21 (18) and 35 (19) types and subtypes of cancer,
respectively. KM plotter also contain the gene chip data [from GEO
(breast cancer: GSE12276, GSE16391, GSE12093, GSE11121, GSE9195,
GSE7390, GSE6532, GSE5327, GSE4922, GSE3494, GSE2990, GSE2034,
GSE1456; ovarian cancer: GSE14764, GSE15622, GSE19829, GSE3149,
GSE9891, GSE18520, GSE26712; lung cancer: GSE4573, GSE14814,
GSE8894, GSE19188, GSE3141, GSE31210, GSE29013, GSE37745; gastric
cancer: GSE44740, GSE51725, GSE13911, GSE43346, and GSE3526)]
(20–23) for breast cancer (BC), lung cancer
(LC), gastric cancer (GC) and ovarian cancer (OC). Therefore, the
prognostic significance of the mRNA expression levels of BGN in
various types of carcinomas, including BC, LC, GC and OC was
evaluated using RNA-seq data and confirmed by gene chip data. The
overall survival rate (OS) in patients with other types and
subtypes of carcinomas was estimated using RNA-seq by KM plotter,
OncoLnc or UALCAN databases.
The KM plotter is able to assess the effect of
54,675 genes on survival using 10,461 cancer samples. In this
database, the types and subtypes of cancer samples were observed
from RNA-sequencing (RNA-seq) data while the lung (22), ovarian (21), gastric (23), and breast (20) cancer samples were also analyzed from
gene chip microarrays.
Patient samples were divided into two cohorts
according to the median expression of the BGN gene (high vs.
low expression). The present study analyzed the overall survival
(OS) in patients using a Kaplan-Meier survival plot. Briefly, the
BGN gene was uploaded into the respective databases to
obtain the Kaplan-Meier survival plots, in which the number-at-risk
was presented below the main plot. Affymetrix ID (or RNA-seq ID),
log rank P-value and hazard ratio (HR) with 95% confidence
intervals were calculated and displayed on the webpage. P<0.05
was considered to indicate a statistically significant
difference.
UALCAN, is an interactive web resource for analyzing
cancer transcriptome data, built on PERL-common gateway interface
with high quality graphics using JavaScript and Cascading Style
Sheets. UALCAN was used to construct an algorithm based on The
Cancer Genome Atlas (TCGA) level 3 RNA-seq database (https://portal.gdc.cancer.gov/). UALCAN can
provide publication quality graphs and plots depicting gene
expressions and patient survival information based on gene
expression (19). P<0.05 was
considered to indicate a statistically significant difference.
OncoLnc is a tool for interactively exploring
survival correlations. OncoLnc contains survival data for 8,647
patients from 21 cancer studies performed by TCGA, along with
RNA-seq expression for mRNAs and microRNAs from TCGA and long
non-coding RNA expressions from MiTranscriptome (β release)
(http://www.mitranscriptome.com/).
OncoLnc stores precomputed survival analyses, allowing users to
quickly explore survival correlations for up to 21 types of cancer
in a single click (18). The
BGN gene was uploaded into the database to obtain the
patient survival information. P<0.05 was considered to indicate
a statistically significant difference.
Co-expression and PPI network
construction
The present study extracted the top 50 co-expressed
genes that have similar expression pattern with BGN gene,
based on Pearson correlation score across all tumor samples from
the GEPIA database (http://gepia.cancerpku.cn/index.html). Then, the 11.0
Search Tool for the Retrieval of Interacting Genes/Proteins
database (http://string-db.org/), was used to
construct a PPI network with these co-expressed genes (24). The PPI pairs were extracted with a
combined score of 0.4. Subsequently, the PPI network was visualized
using the Cytoscape 3.7.0 software (http://www.cytoscape.org/).
Results
Increased expression of BGN in
multiple types of solid cancer
As illustrated in Fig.
1, Oncomine contained a total of 421 research studies for the
BGN gene. In 78 analyses, BGN exhibited statistically
significant differences, 5 of which revealed lower mRNA expression
levels in solid tumors compared with normal tissues, while 73
analyses indicated the opposite result (Fig. 1). BGN gene expression was the
most upregulated in bladder, brain and central nervous system
(CNS), breast, colorectal, gastric, head and neck, pancreatic
cancer and other cancer, followed by esophageal, kidney, liver,
ovarian cancer, and lung cancer (Fig.
1). Results in the investigation of BGN gene expression
have been inconsistent in a number of studies (25–33),
including kidney, liver, pancreatic, and prostate cancer. The
expression levels of BGN in cervical cancer and melanoma were not
significantly changed (Fig. 1). The
BGN gene expression status in lymphoma, leukemia, sarcoma
and myeloma was not analyzed in this study as they are not
classified as solid cancers (34).
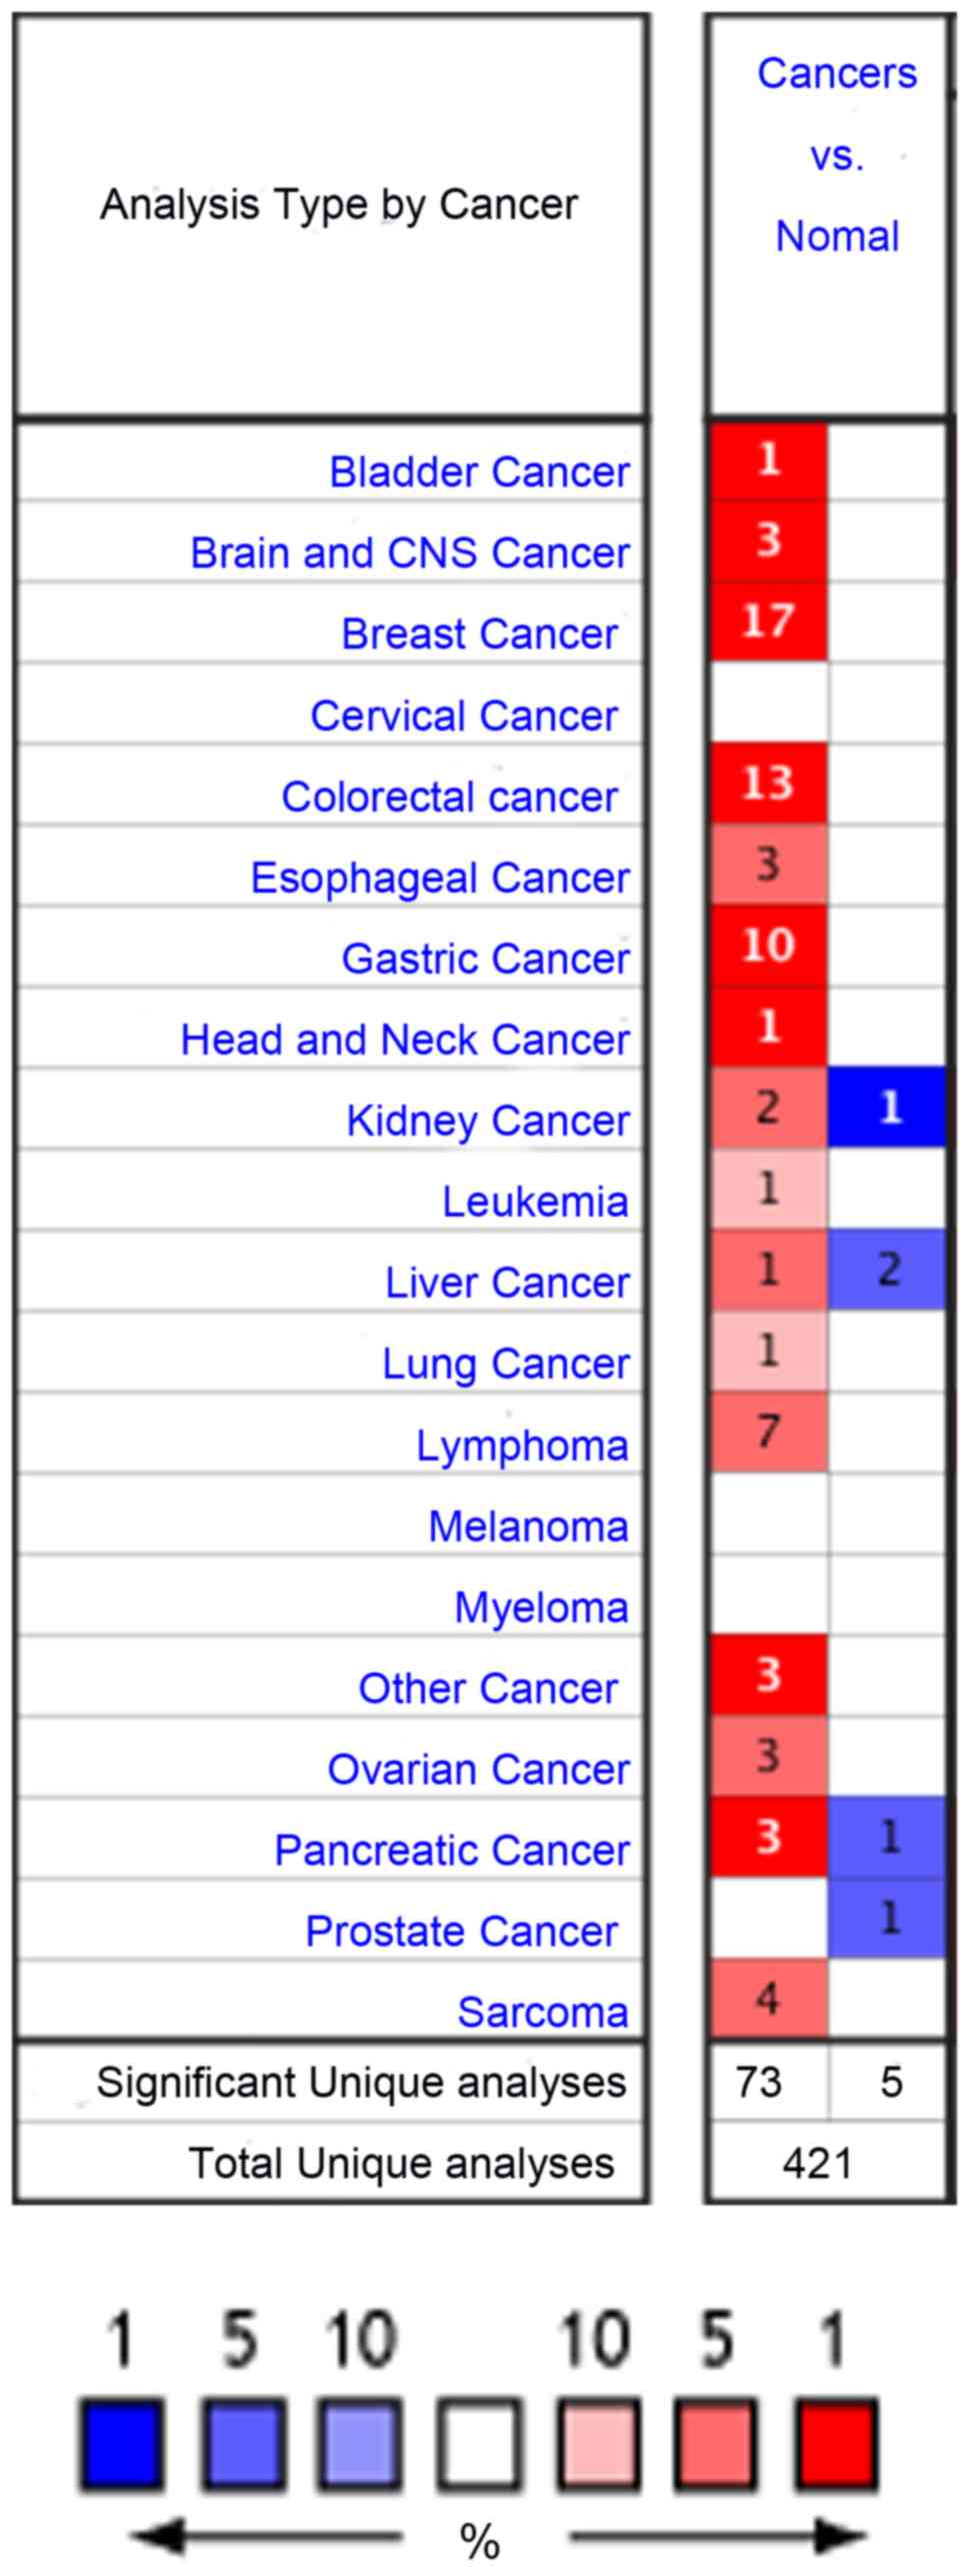 | Figure 1.mRNA expression levels of BGN in
different types of cancer from the Oncomine database. The schematic
reveals the numbers of datasets with statistically significant mRNA
overexpression (red) or underexpression (blue) of the target gene.
Darker red indicates higher BGN expression, Darker blue
indicates lower BGN expression. The color is determined by
the best gene rank percentile for the analyses within the cell. The
number in each cell represents the number of analyses that met the
thresholds of: Gene, BGN; analysis type, cancer vs. normal; and
data type, mRNA. The thresholds were set at 2-fold change,
P<1×10⁻⁴ and the top 10% gene rank. For cervical
cancer, melanoma, myeloma and prostate cancer, there was no
analysis (white cell) that met the aforementioned thresholds. The
gene rank was analyzed using the percentile of target gene in the
top of all genes measured in each analysis. BGN, biglycan; CNS,
central nervous system. |
Solid cancers, in which BGN was reported to be
upregulated consistently in different studies, were examined
further in the various cancer subtypes using the Oncomine datasets.
The data summarized in Table I
revealed that there was a significant increase in expression of BGN
in BLC, including subtype of IBLCA) (n=53), when compared with that
in normal tissues (n=3) in the study by Blaveri et al
(35). The BGN mRNA expression was
significantly elevated in brain and CNS cancer, including subtype
of GBM (n=130) when compared with normal tissues (n=30) in the
study conducted by Bredel et al (36). The mRNA expression of BGN was
significantly elevated in BC, including subtypes BRCA, DBC, DCIS,
IDBC, IDBCs, IDC, IDC-L, ILBC, ILC, LBC, MBC and TBC (n=2,540)
compared with that in normal tissues (n=240), which was performed
by Ma et al (37), Curtis
et al (38), Karnoub et
al (39), Perou et al
(40), Zhao et al (41) and TCGA studies (42,43) The
mRNA expression of BGN was also significantly upregulated in CC,
including subtypes COAD, CMA, RSA, CeAC and READ (n=463), when
compared with that in normal tissues (n=150), which was reported in
the studies conducted by Kaiser et al (44), Skrzypczak et al (45), Graudens et al (46), TCGA (47), Gaedcke et al (48), and Hong et al (49). BGN mRNA expression was also
significantly upregulated in EC, including subtype ESCC (n=84),
when compared with that in normal tissues (n=80), which was
reported in the studies of Su et al (50), Hu et al (51) and Hao et al (52). BGN mRNA expression was also
significantly higher in GC, including subtypes ITGA, DGAC and GMA
(n=265), when compared with that in normal tissues (n=171), as
reported by Chen et al (53),
Cho et al (54), Wang et
al (55), D'Errico et al
(56) and Cui et al (57). The mRNA expression of BGN was also
significantly increased in HNC, including subtype SGACC (n=16)
compared with that in normal tissues (n=6) in the study by Frierson
et al (58). The mRNA
expression of BGN was significantly higher in LC, including subtype
SCC (n=34) compared with that in normal tissues (n=28) in the study
by Talbot et al (59). The
mRNA expression of BGN was increased significantly in OC, including
subtypes SSPC and OSC (n=799) compared with that in normal tissues
(n=22), as reported by Welsh et al (60), and Bonome et al (61), and studies listed in TCGA (62). The mRNA expression of BGN was
increased significantly in other types of cancer, including subtype
SBCC (n=15) compared with that in normal tissues (n=4), as reported
by Riker et al (63).
Therefore, the expression of BGN was significantly increased in
human solid cancers, including 10 types and 28 subtypes of
carcinoma. These results indicate that the mRNA expression of BGN
is elevated in a wide range of tumors, when compared with that in
normal tissues.
 | Table I.Significant changes of biglycan mRNA
expression between different subtypes of bladder, brain and CNS,
breast, colorectal, esophageal, gastric, head and neck, lung,
ovarian, other types of cancer and 28 subtypes cancer. |
Table I.
Significant changes of biglycan mRNA
expression between different subtypes of bladder, brain and CNS,
breast, colorectal, esophageal, gastric, head and neck, lung,
ovarian, other types of cancer and 28 subtypes cancer.
| Type of cancer | Cancer Subtype
(n) | Normal, n | Fold change | t-test | P-value | Rank, % | (Refs.) |
|---|
| Bladder | Infiltrating
Bladder Urothelial Carcinoma (IBLCA) (53) | 3 | 2.391 | 6.799 |
7.02×10⁻⁷ | 1 | (35) |
| Brain and CNS | Glioblastoma (GBM)
(27) | 4 | 3.055 | 13.066 |
6.77×10⁻¹⁴ | 1 | (36) |
|
| Glioblastoma (GBM)
(22) | 3 | 13.32 | 7.773 |
4.92×10⁻⁵ | 4 |
|
|
| Glioblastoma (GBM)
(81) | 23 | 2.163 | 7.599 |
7.14×10⁻¹¹ | 7 |
|
| Breast | Ductal Breast
Carcinoma in Situ Stroma (DCIS) (11) | 14 | 13.191 | 7.155 |
2.28×10⁻¹¹ |
| (37) |
|
| Invasive Ductal
Breast Carcinoma Stroma (IDC) (9) | 14 | 7.232 | 5.357 |
1.27×10⁻⁶ | 1 |
|
|
| Invasive Lobular
Breast Carcinoma (ILC) (36) | 61 | 3.312 | 13.142 |
1.58×10⁻²² | 1 | (42,43) |
|
| Invasive Breast
Carcinoma (BRCA) (76) | 61 | 3.131 | 14.001 |
1.22×10⁻²⁷ | 1 |
|
|
| Male Breast
Carcinoma (MBC) (3) | 61 | 4.661 | 10.406 |
3.76×10⁻⁵ | 4 |
|
|
| Mixed Lobular and
Ductal Breast Carcinoma (IDC-L) (7) | 61 | 2.780 | 5.576 |
8.56×10⁻⁵ | 4 |
|
|
| Invasive Ductal
Breast Carcinoma (IDC) (389) | 61 | 2.714 | 14.829 |
5.11×10⁻²⁵ | 5 |
|
|
| Tubular Breast
Carcinoma (TBC) (67) | 144 | 3.014 | 18.174 |
4.05×10−41 | 1 | (38) |
|
| Invasive Lobular
Breast Carcinoma (ILBC) (148) | 144 | 3.087 | 19.715 |
8.92×10−56 | 1 |
|
|
| Invasive Ductal and
Invasive Lobular Breast | 144 | 2.885 | 14.973 |
4.81×10⁻³³ | 1 |
|
|
| Carcinoma (IDC and
ILC) (90) |
|
|
|
|
|
|
|
| Breast Carcinoma
(BC) (14) | 144 | 2.884 | 5.505 |
3.00×10⁻⁵ | 4 |
|
|
| Invasive Ductal
Breast Carcinoma (IDC) (1556) | 144 | 2.988 | 26.199 |
1.50×10−62 | 5 |
|
|
| Medullary Breast
Carcinoma (MBC) (32) | 144 | 2.256 | 6.302 |
1.13×10⁻⁷ | 9 |
|
|
| Invasive Ductal
Breast Carcinoma Stroma (IDBCs) (7) | 15 | 3.546 | 6.337 |
2.70×10⁻⁶ | 1 | (39) |
|
| Ductal Breast
Carcinoma (DBC) (36) | 3 | 3.337 | 9.550 |
7.02×10⁻⁶ | 2 | (40) |
|
| Lobular Breast
Carcinoma (LBC) (21) | 3 | 3.337 | 10.925 |
1.22×10⁻⁷ | 1 | (41) |
|
| Invasive Ductal
Breast Carcinoma (IDBC) (38) | 3 | 6.756 | 12.230 |
1.80×10⁻⁶ | 5 |
|
| Colorectal | Colon
Adenocarcinoma (COAD) (41) | 5 | 3.200 | 13.125 |
1.74×10⁻¹⁵ | 1 | (44) |
|
| Colon Mucinous
Adenocarcinoma (CMA) (13) | 5 | 2.942 | 9.781 | 6.65
×10−8 | 1 |
|
|
| Rectosigmoid
Adenocarcinoma (RSA) (10) | 5 | 3.799 | 7.377 |
4.85×10⁻⁶ | 2 |
|
|
| Cecum
Adenocarcinoma (CeAC) (17) | 5 | 3.039 | 6.529 |
1.17×10⁻⁶ | 4 |
|
|
| Colorectal
Carcinoma (CC) (36) | 24 | 4.795 | 8.671 |
3.32×10⁻¹² | 1 | (45) |
|
| Colorectal
Carcinoma (CC) (18) | 12 | 2.563 | 5.442 |
5.94×10⁻⁶ | 4 | (46) |
|
| Colon Carcinoma
(cc) (5) | 10 | 7.740 | 15.965 |
3.60×10⁻¹⁰ | 2 | (45) |
|
| Colon
Adenocarcinoma (COAD) (5) | 10 | 4.099 | 14.219 |
6.23×10⁻⁹ | 2 |
|
|
| Colon Mucinous
Adenocarcinoma (CMA) (101) | 22 | 2.324 | 11.956 |
3.48×10⁻¹⁹ | 3 | (47) |
|
| Rectal
Adenocarcinoma (READ) (22) | 22 | 3.772 | 10.097 |
4.62×10⁻¹¹ | 3 |
|
|
| Rectal
Adenocarcinoma (READ) (60) | 22 | 2.065 | 8.557 |
3.90×10⁻¹³ | 7 |
|
|
| Rectal
Adenocarcinoma (READ) (65) | 65 | 2.068 | 11.751 |
2.16×10⁻¹⁹ | 6 | (48) |
|
| Colorectal
Carcinoma (CC) (70) | 12 | 3.508 | 9.208 |
4.02×10⁻⁹ | 7 | (49) |
| Esophageal | Esophageal Squamous
Cell Carcinoma (ESCC) (53) | 53 | 2.795 | 10.666 |
3.73×10⁻¹⁷ | 2 | (50) |
|
| Esophageal Squamous
Cell Carcinoma (ESCC) (17) | 17 | 2.964 | 5.524 |
3.47×10⁻⁶ | 5 | (51) |
|
| Esophageal
Adenocarcinoma (EA) (14) | 10 | 10.158 | 8.460 |
8.51×10⁻⁵ | 5 | (52) |
| Gastric | Gastric Intestinal
Type Adenocarcinoma(ITGA) (62) | 29 | 4.852 | 18.317 |
4.31×10⁻³² | 1 | (53) |
|
| Diffuse Gastric
Adenocarcinoma (DGAC) (13) | 29 | 6.483 | 23.103 |
1.13×10⁻¹⁷ | 1 |
|
|
| Gastric mixed
Adenocarcinoma (GMA) (8) | 29 | 9.700 | 11.684 |
1.63×10⁻⁶ | 1 |
|
|
| Diffuse Gastric
Adenocarcinoma (DGAC) (31) | 19 | 3.287 | 8.446 |
2.38×10⁻¹¹ | 1 | (54) |
|
| Gastric Intestinal
Type Adenocarcinoma (ITGA) (20) | 19 | 3.038 | 6.251 |
4.01×10⁻⁷ | 1 |
|
|
| Gastric Cancer (GC)
(15) | 12 | 5.721 | 5.853 |
2.49×10⁻⁶ | 1 | (55) |
|
| Diffuse Gastric
Adenocarcinoma (DGAC) (6) | 31 | 6.207 | 5.794 |
9.36×10⁻⁵ | 2 | (56) |
|
| Gastric Mixed
Adenocarcinoma (GMA) (4) | 31 | 9.737 | 8.460 |
1.49×10⁻⁵ | 3 |
|
|
| Gastric Intestinal
Type Adenocarcinoma (ITGA) (26) | 31 | 4.413 | 7.512 |
2.59×10⁻⁹ | 5 |
|
|
| Gastric Cancer (GC)
(80) | 80 | 3.226 | 5.032 |
6.55×10⁻⁷ | 2 | (57) |
| Head and neck | Salivary Gland
Adenoid Cystic Carcinoma (SGACC) (16) | 6 | 4.703 | 11.107 |
5.90×10⁻¹⁰ | 1 | (58) |
| Lung | Squamous Cell
Carcinoma (SCC) (34) | 28 | 2.177 | 5.194 |
1.45×10⁻⁶ | 10 | (59) |
| Ovarian | Ovarian Serous
Surface Papillary Carcinoma (SSPC) (28) | 4 | 36.947 | 7.443 |
2.62×10⁻⁸ | 2 | (60) |
|
| Ovarian Carcinoma
(OC) (185) | 10 | 3.105 | 10.018 |
9.77×10⁻⁹ | 7 | (61) |
|
| Ovarian Serous
Cystadenocarcinoma (OSC) (586) | 8 | 2.706 | 8.141 |
2.09×10⁻⁵ | 10 | (62) |
| Other cancer | Skin Basal Cell
Carcinoma (SBCC) (15) | 4 | 5.312 | 11.144 | 1.81
×10−9 | 1 | (63) |
High BGN expression and survival
outcome in multiple types of solid cancer
The expression of BGN was significantly increased in
certain types of human solid cancers, including bladder, brain and
CNS, breast, colorectal, gastric, head and neck, esophageal,
ovarian, lung and other cancers, however there was no data on the
downregulation of the BGN from the database (Table I). The present study used the
Kaplan-Meier Plotter, OncoLnc and UALCAN databases to identify the
association between survival time and the mRNA levels of BGN in
patients with different types and subtypes of solid cancer.
As shown in Table
II, BGN gene with a significant association with patient
survival can be identified in GC and OC (P<0.05). There is no
significant association of BGN upregulation with patient survival
in BC, EC (P>0.05), IBC, READ, COAD, and ESCC (P>0.05). The
survival rate of patients with LC with P>0.05 in RNA-seq and
P<0.05 in microarray analysis requires further investigation.
Therefore, high BGN mRNA expression may potentially be associated
with the prognosis in patients with BLC, LSCC, and OSC, as the
present analyses provided RNA-seq analysis results (P<0.05)
without microarray analysis confirmation (Table II). The association between BGN mRNA
expression and prognosis in patients with other types of cancer and
subtypes of cancer requires further investigation as there is no
prognostic data in the KM plotter, OncoLnc and UALCAN database
(Table III).
| Table II.Overall survival of patients with
different types of cancer with overexpressed BGN gene. |
Table II.
Overall survival of patients with
different types of cancer with overexpressed BGN gene.
| Cancer types | RNA-seq P-value
(database) | gene chip P-value
(database) |
|---|
| Breast cancer | 0.2556a | 0.7210a |
| Esophageal
adenocarcinoma | 0.0965a | N/A |
| Lung cancer | 0.3010a | 0.0002a |
| Gastric cancer | 0.0068a |
1.3×10⁻¹⁰a |
| Ovarian cancer | 0.0093a | 0.0004a |
| Bladder cancer | 0.0025a | N/A |
| Table III.Overall survival of patients with
different subtypes of cancer with overexpressed BGN
gene. |
Table III.
Overall survival of patients with
different subtypes of cancer with overexpressed BGN
gene.
| Cancer subtype | RNA-seq P-value
(database) | gene chip P-value
(database) |
|---|
| Lung squamous cell
carcinoma | 0.0111a | N/A |
| Ovarian serous
cystadenocarcinoma | 0.0290c | N/A |
| Breast invasive
carcinoma | 0.9400c | N/A |
| Colon
adenocarcinoma | 0.0963b | N/A |
| Rectum
adenocarcinoma | 0.1776a | N/A |
| Esophageal
Squamous | 0.2707a | N/A |
| Cell Carcinoma |
|
|
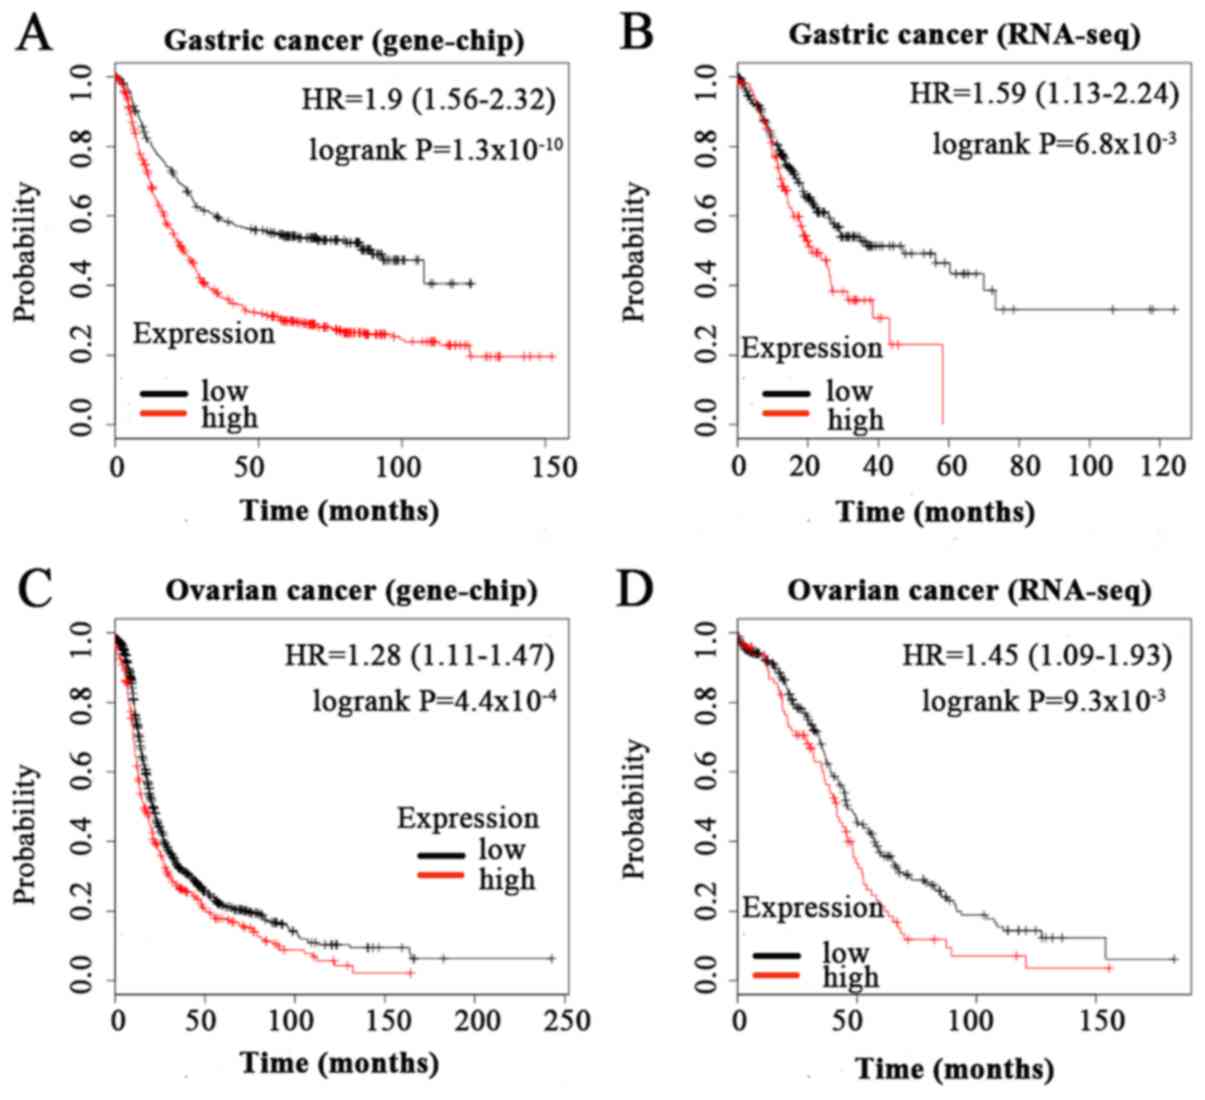
As presented in Fig.
2, high expression of BGN was significantly associated with
shorter OS time in patients with GC [HR=1.9 (1.56–2.32),
P=1.3×10⁻¹⁰ in microarry analysis; HR=1.59 (1.13–2.24),
P=6.8×10⁻³ in RNA-seq analysis] and OC [HR=1.28
(1.11–1.47), P=4.4×10⁻⁴ in microarry analysis; HR=1.45
(1.09–1.93), P=9.3×10⁻³ in RNA-seq analysis].
In summary, high BGN mRNA expression in gastric
cancer and ovarian cancer was significantly associated with poor
overall survival. High BGN mRNA expression was indicated to be
associated with poor clinical outcome in the prognosis of patients
with bladder cancer, lung squamous cell carcinoma, and ovarian
serous cystadenocarcinoma. However, the association between BGN
mRNA upregulation and prognosis in patients with other types and
subtypes of cancer requires further examination.
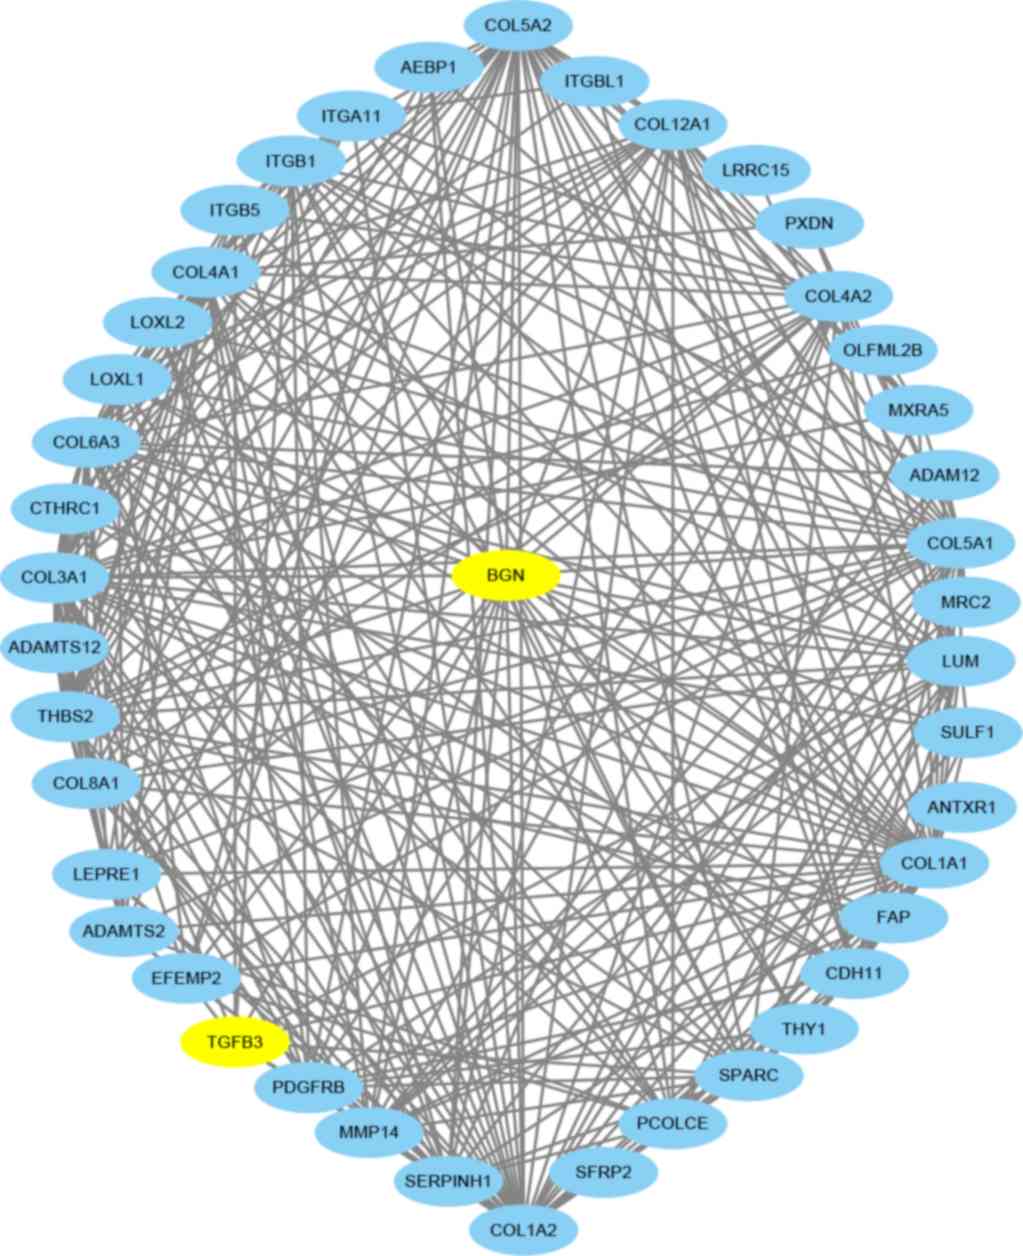
PPI network construction
The GEPIA database was used to download the top 50
co-expressed genes, then the PPI was generated (Fig. 3). In the network, BGN directly
interacted with 42 neighboring genes, including ANTXR1, AEBP1,
CDH11, CTHRC1, EFEMP2, FAP, LEPRE1, LRRC15, LUM, MMP14, MRC2,
MXRA5, OLFML2B, PCOLCE, PDGFRB, PXDN, SERPINH1, SFRP2, SPARC,
SULF1, TGFβ3, THBS2, THY1, genes of the disintegrin and
metalloproteinase gene family, collagen family genes, the integrin
subunit gene family and lastly the lysyl oxidase-like gene family,
which jointly regulate the occurrence and development of human
tumors. Jointly genes with similar expression patterns are likely
to have related functions (64). For
example, enrichment indicates that BGN-coexpressed genes are
at least partially biologically connected in developing multiple
cancers (65). The basic interaction
between the neighboring genes is the ‘functional association’. The
two proteins that both contribute jointly to a specific biological
function can interact specifically without touching at all, such as
when a transcription factor helps to regulate the expression and
production of another protein, or when two enzymes exchange a
specific substrate via diffusion. The exact molecular mechanisms in
cancer associated with BGN remain unclear (66). BGN upregulation has been implicated
in the inflammatory response triggered by transforming growth
factor β (TGF-β) (8,67,68). In
the PPI network, TGF-β3 may play an important role to regulate the
expression of BGN, however, the influence of TGF-β3 needs to be
further investigated.
Discussion
In the present study, the mRNA expression levels of
BGN were systematically analyzed, and the results indicated that
BGN was upregulated in various types of cancerous tissues, when
compared with that in normal tissues. Previous studies have
demonstrated that significantly increased levels of BGN are
frequently detected in the clinical samples of patients with
gastric (13), breast (69), colorectal (70), lung (71), ovarian (10) and pancreatic cancer (16). In addition, high expression of BGN in
patients with solid cancer is significantly associated with poor
outcome (15). Solid cancer include
BLC, brain and CNS cancer, BC, cervical cancer, CC, EC, GC, HNC,
kidney cancer, liver cancer, LC, melanoma, OC, pancreatic cancer,
prostate cancer (72). Consistent
with these studies, the present analyses demonstrated that BGN
expression levels were increased in the majority of cancers, such
as bladder, brain and central nervous system, breast, colorectal,
esophageal, gastric, head and neck, lung, ovarian, and 28 subtype
cancers, when compared with that in normal tissues. In addition,
the current prognosis analyses revealed that high tissue BGN
expression predicts worse survival in GC and OC. High BGN mRNA
expression was associated with poor overall survival in patients
with BLC, LSCC, and OSC. Therefore, BGN may be employed as either a
novel prognostic biomarker or as a promising therapeutic target for
human carcinomas, which is consistent with the findings of previous
reports (15,73). The 43 genes with similar expression
patterns are likely to have related functions in the aggressive
growth and metastasis of cancers (64). In the PPI network, the genes of
AEBP1, MMP14, OLFML2B, PDGFRB, SERPINE1, SPARC, SFRP2, COL1A2,
COL6A3, THBS2, COL5A2, COL11A1, FAP, MXRA5 and THY1 were
upregulated in solid cancer tissues, and significantly associated
with the overall survival of patients with cancer (74–82).
Some genes in the PPI network, including AEBP1, OLFML2B, PDGFRB,
SERPINE1, COL1A2, COL6A3, and THBS2 have been reported
to be associated with metastasis, invasion and migration in cancer
cells (74,76,80,83,84). The
enrichment of BGN-coexpressed genes indicates that the proteins are
at least partially biologically connected as a group (64). However, a detailed understanding of
the mechanism associated with the function of BGN is currently
lacking; therefore, further functional studies are warranted in the
future. In addition, the BGN protein expression levels or the
signaling pathways potentially involved require further
investigation. Finally, studies utilizing larger cohorts, specific
cancers, or larger prospective studies also need to be conducted in
order to validate the prognostic values of BGN.
In summary, the present study comprehensively
analyzed the mRNA expression levels and prognostic value of BGN in
the most common types of cancer, and the results indicated that BGN
exhibited significantly high expression levels in cancer tissues
compared with normal tissues in multiple types of cancer. The
present findings indicated that BGN may serve as a promising
prognostic biomarker and therapeutic target for patients with BLCA
and STAD.
Acknowledgements
Not applicable.
Funding
No funding was received.
Availability of data and materials
The datasets used and/or analyzed during the current
study are available from the corresponding author on reasonable
request.
Authors' contributions
SFZ conceived and designed the study. XJY, WJZ, LCL
and ZPW made substantial contributions to the design of the current
study, acquisition of data, interpretation of data and revising the
manuscript. All authors read and approved the final manuscript.
Ethics approval and consent to
participate
Not applicable.
Patient consent for publication
Not applicable.
Competing interests
The authors declare that they have no competing
interests.
References
|
1
|
Chaker L, Falla A, van der Lee SJ, Muka T,
Imo D, Jaspers L, Colpani V, Mendis S, Chowdhury R, Bramer WM, et
al: The global impact of non-communicable diseases on
macro-economic productivity: A systematic review. Eur J Epidemiol.
30:357–395. 2015. View Article : Google Scholar : PubMed/NCBI
|
|
2
|
Patel SA and DeMichele A: Adding adjuvant
systemic treatment after neoadjuvant therapy in breast cancer:
Review of the data. Curr Oncol Rep. 19:562017. View Article : Google Scholar : PubMed/NCBI
|
|
3
|
Miller KD, Nogueira L, Mariotto AB,
Rowland JH, Yabroff KR, Alfano CM, Jemal A, Kramer JL and Siegel
RL: Cancer treatment and survivorship statistics, 2019. CA Cancer J
Clin. 69:363–385. 2019. View Article : Google Scholar : PubMed/NCBI
|
|
4
|
Siegel RL, Miller KD and Jemal A: Cancer
statistics, 2019. CA Cancer J Clin. 69:7–34. 2019. View Article : Google Scholar : PubMed/NCBI
|
|
5
|
Ferlay J, Shin HR, Bray F, Forman D,
Mathers C and Parkin DM: Estimates of worldwide burden of cancer in
2008. Int J Cancer. 127:2893–2917. 2010. View Article : Google Scholar : PubMed/NCBI
|
|
6
|
Geerkens C, Vetter U, Just W, Fedarko NS,
Fisher LW, Young MF, Termine JD, Robey PG, Wöhrle D and Vogel W:
The X-chromosomal human biglycan gene BGN is subject to X
inactivation but is transcribed like an X-Y homologous gene. Hum
Genet. 96:44–52. 1995. View Article : Google Scholar : PubMed/NCBI
|
|
7
|
McBride OW, Fisher LW and Young MF:
Localization of PGI (biglycan, BGN) and PGII (decorin, DCN, PG-40)
genes on human chromosomes Xq13-qter and 12q, respectively.
Genomics. 6:219–225. 1990. View Article : Google Scholar : PubMed/NCBI
|
|
8
|
Nastase MV, Young MF and Schaefer L:
Biglycan: A multivalent proteoglycan providing structure and
signals. J Histochem Cytochem. 60:963–975. 2012. View Article : Google Scholar : PubMed/NCBI
|
|
9
|
Fallon JR and McNally EM: Non-Glycanated
biglycan and LTBP4: Leveraging the extracellular matrix for
Duchenne muscular dystrophy therapeutics. Matrix Biol.
68-69:616–627. 2018. View Article : Google Scholar : PubMed/NCBI
|
|
10
|
Kocbek V, Hevir-Kene N, Bersinger NA,
Mueller MD and Rižner TL: Increased levels of biglycan in
endometriomas and peritoneal fluid samples from ovarian
endometriosis patients. Gynecol Endocrinol. 30:520–524. 2014.
View Article : Google Scholar : PubMed/NCBI
|
|
11
|
Jacobsen F, Kraft J, Schroeder C,
Hube-Magg C, Kluth M, Lang DS, Simon R, Sauter G, Izbicki JR,
Clauditz TS, et al: Up-regulation of biglycan is associated with
poor prognosis and PTEN deletion in patients with prostate cancer.
Neoplasia. 19:707–715. 2017. View Article : Google Scholar : PubMed/NCBI
|
|
12
|
Weber CK, Sommer G, Michl P, Fensterer H,
Weimer M, Gansauge F, Leder G, Adler G and Gress TM: Biglycan is
overexpressed in pancreatic cancer and induces G1-arrest in
pancreatic cancer cell lines. Gastroenterology. 121:657–667. 2001.
View Article : Google Scholar : PubMed/NCBI
|
|
13
|
Hu L, Duan YT, Li JF, Su LP, Yan M, Zhu
ZG, Liu BY and Yang QM: Biglycan enhances gastric cancer invasion
by activating FAK signaling pathway. Oncotarget. 5:1885–1896. 2014.
View Article : Google Scholar : PubMed/NCBI
|
|
14
|
Xing X, Gu X, Ma T and Ye H: Biglycan
up-regulated vascular endothelial growth factor (VEGF) expression
and promoted angiogenesis in colon cancer. Tumour Biol.
36:1773–1780. 2015. View Article : Google Scholar : PubMed/NCBI
|
|
15
|
Wang B, Li GX, Zhang SG, Wang Q, Wen YG,
Tang HM, Zhou CZ, Xing AY, Fan JW, Yan DW, et al: Biglycan
expression correlates with aggressiveness and poor prognosis of
gastric cancer. Exp Biol Med (Maywood). 236:1247–1253. 2011.
View Article : Google Scholar : PubMed/NCBI
|
|
16
|
Aprile G, Avellini C, Reni M, Mazzer M,
Foltran L, Rossi D, Cereda S, Iaiza E, Fasola G and Piga A:
Biglycan expression and clinical outcome in patients with
pancreatic adenocarcinoma. Tumor Biol. 34:131–137. 2013. View Article : Google Scholar
|
|
17
|
Rhodes DR, Yu J, Shanker K, Deshpande N,
Varambally R, Ghosh D, Barrette T, Pandey A and Chinnaiyan AM:
ONCOMINE: A cancer microarray database and integrated data-mining
platform. Neoplasia. 6:1–6. 2004. View Article : Google Scholar : PubMed/NCBI
|
|
18
|
Anaya J: OncoLnc: Linking TCGA survival
data to mRNAs, miRNAs, and lncRNAs. PeerJ Computer Sci. 2:e672016.
View Article : Google Scholar
|
|
19
|
Chandrashekar DS, Bashel B, Balasubramanya
SAH, Creighton CJ, Ponce-Rodriguez I, Chakravarthi BVSK and
Varambally S: UALCAN: A portal for facilitating tumor subgroup gene
expression and survival analyses. Neoplasia. 19:649–658. 2017.
View Article : Google Scholar : PubMed/NCBI
|
|
20
|
Györffy B, Lanczky A, Eklund AC, Denkert
C, Budczies J, Li Q and Szallasi Z: An online survival analysis
tool to rapidly assess the effect of 22,277 genes on breast cancer
prognosis using microarray data of 1,809 patients. Breast Cancer
Res Treat. 123:725–731. 2010. View Article : Google Scholar : PubMed/NCBI
|
|
21
|
Győrffy B, Lánczky A and Szállási Z:
Implementing an online tool for genome-wide validation of
survival-associated biomarkers in ovarian-cancer using microarray
data from 1287 patients. Endocr Relat Cancer. 19:197–208. 2012.
View Article : Google Scholar : PubMed/NCBI
|
|
22
|
Győrffy B, Surowiak P, Budczies J and
Lánczky A: Online survival analysis software to assess the
prognostic value of biomarkers using transcriptomic data in
non-small-cell lung cancer. PLoS One. 8:e822412013. View Article : Google Scholar : PubMed/NCBI
|
|
23
|
Szász AM, Lánczky A, Nagy Á, Förster S,
Hark K, Green JE, Boussioutas A, Busuttil R, Szabó A and Győrffy B:
Cross-validation of survival associated biomarkers in gastric
cancer using transcriptomic data of 1,065 patients. Oncotarget.
7:49322–49333. 2016. View Article : Google Scholar : PubMed/NCBI
|
|
24
|
Szklarczyk D, Franceschini A, Wyder S,
Forslund K, Heller D, Huerta-Cepas J, Simonovic M, Roth A, Santos
A, Tsafou KP, et al: STRING v10: Protein-protein interaction
networks, integrated over the tree of life. Nucleic Acids Res.
43:D447–D452. 2015. View Article : Google Scholar : PubMed/NCBI
|
|
25
|
Chen X, Cheung ST, So S, Fan ST, Barry C,
Higgins J, Lai KM, Ji J, Dudoit S, Ng IO, et al: Gene expression
patterns in human liver cancers. Mol Biol Cell. 13:1929–1939. 2002.
View Article : Google Scholar : PubMed/NCBI
|
|
26
|
Higgins JP, Shinghal R, Gill H, Reese JH,
Terris M, Cohen RJ, Fero M, Pollack JR, van de Rijn M and Brooks
JD: Gene expression patterns in renal cell carcinoma assessed by
complementary DNA microarray. Am J Pathol. 162:925–932. 2003.
View Article : Google Scholar : PubMed/NCBI
|
|
27
|
Iacobuzio-Donahue CA, Maitra A, Olsen M,
Lowe AW, van Heek NT, Rosty C, Walter K, Sato N, Parker A, Ashfaq
R, et al: Exploration of global gene expression patterns in
pancreatic adenocarcinoma using cDNA microarrays. Am J Pathol.
162:1151–1162. 2003. View Article : Google Scholar : PubMed/NCBI
|
|
28
|
Buchholz M, Braun M, Heidenblut A, Kestler
HA, Klöppel G, Schmiegel W, Hahn SA, Lüttges J and Gress TM:
Transcriptome analysis of microdissected pancreatic intraepithelial
neoplastic lesions. Oncogene. 24:6626–6636. 2005. View Article : Google Scholar : PubMed/NCBI
|
|
29
|
Segara D, Biankin AV, Kench JG, Langusch
CC, Dawson AC, Skalicky DA, Gotley DC, Coleman MJ, Sutherland RL
and Henshall SM: Expression of HOXB2, a retinoic acid signaling
target in pancreatic cancer and pancreatic intraepithelial
neoplasia. Clin Cancer Res. 11:3587–3596. 2005. View Article : Google Scholar : PubMed/NCBI
|
|
30
|
Badea L, Herlea V, Dima SO, Dumitrascu T
and Popescu I: Combined gene expression analysis of whole-tissue
and microdissected pancreatic ductal adenocarcinoma identifies
genes specifically overexpressed in tumor epithelia.
Hepatogastroenterology. 55:2016–2027. 2008.PubMed/NCBI
|
|
31
|
Mas VR, Maluf DG, Archer KJ, Yanek K, Kong
X, Kulik L, Freise CE, Olthoff KM, Ghobrial RM, McIver P and Fisher
R: Genes involved in viral carcinogenesis and tumor initiation in
hepatitis C virus-induced hepatocellular carcinoma. Mol Med.
15:85–94. 2009. View Article : Google Scholar : PubMed/NCBI
|
|
32
|
Yusenko MV, Kuiper RP, Boethe T, Ljungberg
B, van Kessel AG and Kovacs G: High-resolution DNA copy number and
gene expression analyses distinguish chromophobe renal cell
carcinomas and renal oncocytomas. BMC Cancer. 9:1522009. View Article : Google Scholar : PubMed/NCBI
|
|
33
|
Roessler S, Jia HL, Budhu A, Forgues M, Ye
QH, Lee JS, Thorgeirsson SS, Sun Z, Tang ZY, Qin LX and Wang XW: A
unique metastasis gene signature enables prediction of tumor
relapse in early-stage hepatocellular carcinoma patients. Cancer
Res. 70:10202–10212. 2010. View Article : Google Scholar : PubMed/NCBI
|
|
34
|
Franzmann E: Carcinoma. Encyclopedia of
Behavioral Medicine. Gellman MD and Turner JR: Springer New York;
New York, NY: pp. 329–330. 2013, View Article : Google Scholar
|
|
35
|
Blaveri E, Simko JP, Korkola JE, Brewer
JL, Baehner F, Mehta K, Devries S, Koppie T, Pejavar S, Carroll P
and Waldman FM: Bladder cancer outcome and subtype classification
by gene expression. Clin Cancer Res. 11:4044–4055. 2005. View Article : Google Scholar : PubMed/NCBI
|
|
36
|
Bredel M, Bredel C, Juric D, Harsh GR,
Vogel H, Recht LD and Sikic BI: Functional network analysis reveals
extended gliomagenesis pathway maps and three novel MYC-interacting
genes in human gliomas. Cancer Res. 65:8679–8689. 2005. View Article : Google Scholar : PubMed/NCBI
|
|
37
|
Ma XJ, Dahiya S, Richardson E, Erlander M
and Sgroi DC: Gene expression profiling of the tumor
microenvironment during breast cancer progression. Breast Cancer
Res. 11:R72009. View Article : Google Scholar : PubMed/NCBI
|
|
38
|
Curtis C, Shah SP, Chin SF, Turashvili G,
Rueda OM, Dunning MJ, Speed D, Lynch AG, Samarajiwa S, Yuan Y, et
al: The genomic and transcriptomic architecture of 2,000 breast
tumours reveals novel subgroups. Nature. 486:346–352. 2012.
View Article : Google Scholar : PubMed/NCBI
|
|
39
|
Karnoub AE, Dash AB, Vo AP, Sullivan A,
Brooks MW, Bell GW, Richardson AL, Polyak K, Tubo R and Weinberg
RA: Mesenchymal stem cells within tumour stroma promote breast
cancer metastasis. Nature. 449:557–563. 2007. View Article : Google Scholar : PubMed/NCBI
|
|
40
|
Perou CM, Sørlie T, Eisen MB, van de Rijn
M, Jeffrey SS, Rees CA, Pollack JR, Ross DT, Johnsen H, Akslen LA,
et al: Molecular portraits of human breast tumours. Nature.
406:747–752. 2000. View Article : Google Scholar : PubMed/NCBI
|
|
41
|
Zhao H, Langerod A, Ji Y, Nowels KW,
Nesland JM, Tibshirani R, Bukholm IK, Kåresen R, Botstein D,
Børresen-Dale AL and Jeffrey SS: Different gene expression patterns
in invasive lobular and ductal carcinomas of the breast. Mol Biol
Cell. 15:2523–2536. 2004. View Article : Google Scholar : PubMed/NCBI
|
|
42
|
Cancer Genome Atlas Network: Comprehensive
molecular portraits of human breast tumours. Nature. 490:61–70.
2012. View Article : Google Scholar : PubMed/NCBI
|
|
43
|
Ciriello G, Gatza ML, Beck AH, Wilkerson
MD, Rhie SK, Pastore A, Zhang H, McLellan M, Yau C, Kandoth C, et
al: Comprehensive molecular portraits of invasive lobular breast
cancer. Cell. 163:506–519. 2015. View Article : Google Scholar : PubMed/NCBI
|
|
44
|
Kaiser S, Park YK, Franklin JL, Halberg
RB, Yu M, Jessen WJ, Freudenberg J, Chen X, Haigis K, Jegga AG, et
al: Transcriptional recapitulation and subversion of embryonic
colon development by mouse colon tumor models and human colon
cancer. Genome Biol. 8:R1312007. View Article : Google Scholar : PubMed/NCBI
|
|
45
|
Skrzypczak M, Goryca K, Rubel T, Paziewska
A, Mikula M, Jarosz D, Pachlewski J, Oledzki J and Ostrowski J:
Modeling oncogenic signaling in colon tumors by multidirectional
analyses of microarray data directed for maximization of analytical
reliability. PLoS One. 5(pii): e130912010. View Article : Google Scholar : PubMed/NCBI
|
|
46
|
Graudens E, Boulanger V, Mollard C,
Mariage-Samson R, Barlet X, Grémy G, Couillault C, Lajémi M,
Piatier-Tonneau D, Zaborski P, et al: Deciphering cellular states
of innate tumor drug responses. Genome Biol. 7:R192006. View Article : Google Scholar : PubMed/NCBI
|
|
47
|
Cancer Genome Atlas Network, ; Muzny DM,
Bainbridge MN, Chang K, Dinh HH, Drummond JA, Fowler G, Kovar CL,
Lewis LR, Morgan MB, et al: Comprehensive molecular
characterization of human colon and rectal cancer. Nature.
487:330–337. 2012. View Article : Google Scholar : PubMed/NCBI
|
|
48
|
Gaedcke J, Grade M, Jung K, Camps J, Jo P,
Emons G, Gehoff A, Sax U, Schirmer M, Becker H, et al: Mutated KRAS
results in overexpression of DUSP4, a MAP-kinase phosphatase, and
SMYD3, a histone methyltransferase, in rectal carcinomas. Genes
Chromosomes Cancer. 49:1024–1034. 2010. View Article : Google Scholar : PubMed/NCBI
|
|
49
|
Hong Y, Downey T, Eu KW, Koh PK and Cheah
PY: A ‘metastasis-prone’ signature for early-stage mismatch-repair
proficient sporadic colorectal cancer patients and its implications
for possible therapeutics. Clin Exp Metastasis. 27:83–90. 2010.
View Article : Google Scholar : PubMed/NCBI
|
|
50
|
Su H, Hu N, Yang HH, Wang C, Takikita M,
Wang QH, Giffen C, Clifford R, Hewitt SM, Shou JZ, et al: Global
gene expression profiling and validation in esophageal squamous
cell carcinoma and its association with clinical phenotypes. Clin
Cancer Res. 17:2955–2966. 2011. View Article : Google Scholar : PubMed/NCBI
|
|
51
|
Hu N, Clifford RJ, Yang HH, Wang C,
Goldstein AM, Ding T, Taylor PR and Lee MP: Genome wide analysis of
DNA copy number neutral loss of heterozygosity (CNNLOH) and its
relation to gene expression in esophageal squamous cell carcinoma.
BMC Genomics. 11:5762010. View Article : Google Scholar : PubMed/NCBI
|
|
52
|
Hao Y, Triadafilopoulos G, Sahbaie P,
Young HS, Omary MB and Lowe AW: Gene expression profiling reveals
stromal genes expressed in common between Barrett's esophagus and
adenocarcinoma. Gastroenterology. 131:925–933. 2006. View Article : Google Scholar : PubMed/NCBI
|
|
53
|
Chen X, Leung SY, Yuen ST, Chu KM, Ji J,
Li R, Chan AS, Law S, Troyanskaya OG, Wong J, et al: Variation in
gene expression patterns in human gastric cancers. Mol Biol Cell.
14:3208–3215. 2003. View Article : Google Scholar : PubMed/NCBI
|
|
54
|
Cho JY, Lim JY, Cheong JH, Park YY, Yoon
SL, Kim SM, Kim SB, Kim H, Hong SW, Park YN, et al: Gene expression
signature-based prognostic risk score in gastric cancer. Clin
Cancer Res. 17:1850–1857. 2011. View Article : Google Scholar : PubMed/NCBI
|
|
55
|
Wang Q, Wen YG, Li DP, Xia J, Zhou CZ, Yan
DW, Tang HM and Peng ZH: Upregulated INHBA expression is associated
with poor survival in gastric cancer. Med Oncol. 29:77–83. 2012.
View Article : Google Scholar : PubMed/NCBI
|
|
56
|
D'Errico M, de Rinaldis E, Blasi MF, Viti
V, Falchetti M, Calcagnile A, Sera F, Saieva C, Ottini L, Palli D,
et al: Genome-wide expression profile of sporadic gastric cancers
with microsatellite instability. Eur J Cancer. 45:461–469. 2009.
View Article : Google Scholar
|
|
57
|
Cui J, Chen Y, Chou WC, Sun L, Chen L, Suo
J, Ni Z, Zhang M, Kong X, Hoffman LL, et al: An integrated
transcriptomic and computational analysis for biomarker
identification in gastric cancer. Nucleic Acids Res. 39:1197–1207.
2011. View Article : Google Scholar : PubMed/NCBI
|
|
58
|
Frierson HF Jr, El-Naggar AK, Welsh JB,
Sapinoso LM, Su AI, Cheng J, Saku T, Moskaluk CA and Hampton GM:
Large scale molecular analysis identifies genes with altered
expression in salivary adenoid cystic carcinoma. Am J Pathol.
161:1315–1323. 2002. View Article : Google Scholar : PubMed/NCBI
|
|
59
|
Talbot SG, Estilo C, Maghami E, Sarkaria
IS, Pham DK, O-Charoenrat P, Socci ND, Ngai I, Carlson D, Ghossein
R, et al: Gene expression profiling allows distinction between
primary and metastatic squamous cell carcinomas in the lung. Cancer
Res. 65:3063–3071. 2005. View Article : Google Scholar : PubMed/NCBI
|
|
60
|
Welsh JB, Zarrinkar PP, Sapinoso LM, Kern
SG, Behling CA, Monk BJ, Lockhart DJ, Burger RA and Hampton GM:
Analysis of gene expression profiles in normal and neoplastic
ovarian tissue samples identifies candidate molecular markers of
epithelial ovarian cancer. Proc Natl Acad Sci USA. 98:1176–1181.
2001. View Article : Google Scholar : PubMed/NCBI
|
|
61
|
Bonome T, Levine DA, Shih J, Randonovich
M, Pise-Masison CA, Bogomolniy F, Ozbun L, Brady J, Barrett JC,
Boyd J and Birrer MJ: A gene signature predicting for survival in
suboptimally debulked patients with ovarian cancer. Cancer Res.
68:5478–5486. 2008. View Article : Google Scholar : PubMed/NCBI
|
|
62
|
Cancer Genome Atlas Research Network, .
Integrated genomic analyses of ovarian carcinoma. Nature.
474:609–615. 2011. View Article : Google Scholar : PubMed/NCBI
|
|
63
|
Riker AI, Enkemann SA, Fodstad O, Liu S,
Ren S, Morris C, Xi Y, Howell P, Metge B, Samant RS, et al: The
gene expression profiles of primary and metastatic melanoma yields
a transition point of tumor progression and metastasis. BMC Med
Genomics. 1:132008. View Article : Google Scholar : PubMed/NCBI
|
|
64
|
Tang Z, Li C, Kang B, Gao G, Li C and
Zhang Z: GEPIA: A web server for cancer and normal gene expression
profiling and interactive analyses. Nucleic Acids Res. 45:W98–W102.
2017. View Article : Google Scholar : PubMed/NCBI
|
|
65
|
Szklarczyk D, Gable AL, Lyon D, Junge A,
Wyder S, Huerta-Cepas J, Simonovic M, Doncheva NT, Morris JH, Bork
P, et al: STRING v11: Protein-protein association networks with
increased coverage, supporting functional discovery in genome-wide
experimental datasets. Nucleic Acids Res. 47:D607–D613. 2019.
View Article : Google Scholar : PubMed/NCBI
|
|
66
|
Appunni S, Anand V, Khandelwal M, Gupta N,
Rubens M and Sharma A: Small leucine rich proteoglycans (decorin,
biglycan and lumican) in cancer. Clin Chim Acta. 491:1–7. 2019.
View Article : Google Scholar : PubMed/NCBI
|
|
67
|
Schaefer L, Babelova A, Kiss E, Hausser
HJ, Baliova M, Krzyzankova M, Marsche G, Young MF, Mihalik D, Götte
M, et al: The matrix component biglycan is proinflammatory and
signals through Toll-like receptors 4 and 2 in macrophages. J Clin
Invest. 115:2223–2233. 2005. View Article : Google Scholar : PubMed/NCBI
|
|
68
|
Hildebrand A, Romaris M, Rasmussen LM,
Heinegård D, Twardzik DR, Border WA and Ruoslahti E: Interaction of
the small interstitial proteoglycans biglycan, decorin and
fibromodulin with transforming growth factor beta. Biochem J.
302:527–534. 1994. View Article : Google Scholar : PubMed/NCBI
|
|
69
|
Bischof AG, Yüksel D, Mammoto T, Mammoto
A, Krause S and Ingber DE: Breast cancer normalization induced by
embryonic mesenchyme is mediated by extracellular matrix biglycan.
Integr Biol (Camb). 5:1045–1056. 2013. View Article : Google Scholar : PubMed/NCBI
|
|
70
|
Liu B, Xu T, Xu X, Cui Y and Xing X:
Biglycan promotes the chemotherapy resistance of colon cancer by
activating NF-kappaB signal transduction. Mol Cell Biochem.
449:285–294. 2018. View Article : Google Scholar : PubMed/NCBI
|
|
71
|
Yang Z, Wen Y, Qian L and Hospital Z:
Up-regulation of biglycan is associated with malignant phenotype of
nonsmall cell lung cancer. J Med Res. 45:41–46. 2016.
|
|
72
|
Ferlay J, Colombet M, Soerjomataram I,
Mathers C, Parkin DM, Piñeros M, Znaor A and Bray F: Estimating the
global cancer incidence and mortality in 2018: GLOBOCAN sources and
methods. Int J Cancer. 144:1941–1953. 2019. View Article : Google Scholar : PubMed/NCBI
|
|
73
|
Appunni S, Anand V, Khandelwal M, Seth A,
Mathur S and Sharma A: Altered expression of small leucine-rich
proteoglycans (Decorin, Biglycan and Lumican): Plausible diagnostic
marker in urothelial carcinoma of bladder. Tumour Biol.
39:10104283176991122017. View Article : Google Scholar : PubMed/NCBI
|
|
74
|
Liu JY, Jiang L, Liu JJ, He T, Cui YH,
Qian F and Yu PW: AEBP1 promotes epithelial-mesenchymal transition
of gastric cancer cells by activating the NF-κB pathway and
predicts poor outcome of the patients. Sci Rep. 8:119552018.
View Article : Google Scholar : PubMed/NCBI
|
|
75
|
Kasurinen A, Gramolelli S, Hagström J,
Laitinen A, Kokkola A, Miki Y, Lehti K, Yashiro M, Ojala PM,
Böckelman C and Haglund C: High tissue MMP14 expression predicts
worse survival in gastric cancer, particularly with a low PROX1.
Cancer Med. 8:6995–7005. 2019. View Article : Google Scholar : PubMed/NCBI
|
|
76
|
Liu J, Liu Z, Zhang X, Gong T and Yao D:
Bioinformatic exploration of OLFML2B overexpression in gastric
cancer base on multiple analyzing tools. BMC Cancer. 19:2272019.
View Article : Google Scholar : PubMed/NCBI
|
|
77
|
Wang G, Shi B, Fu Y, Zhao S, Qu K, Guo Q,
Li K and She J: Hypomethylated gene NRP1 is co-expressed with
PDGFRB and associated with poor overall survival in gastric cancer
patients. Biomed Pharmacother. 111:1334–1341. 2019. View Article : Google Scholar : PubMed/NCBI
|
|
78
|
Liao P, Li W, Liu R, Teer JK, Xu B, Zhang
W, Li X, Mcleod HL and He Y: Genome-scale analysis identifies
SERPINE1 and SPARC as diagnostic and prognostic biomarkers in
gastric cancer. Onco Targets Ther. 11:6969–6980. 2018. View Article : Google Scholar : PubMed/NCBI
|
|
79
|
Wang H, Duan XL, Qi XL, Meng L, Xu YS, Wu
T and Dai PG: Concurrent Hypermethylation of SFRP2 and DKK2
Activates the Wnt/β-catenin pathway and is associated with poor
prognosis in patients with gastric cancer. Mol Cells. 40:45–53.
2017. View Article : Google Scholar : PubMed/NCBI
|
|
80
|
Ao R, Guan L, Wang Y and Wang JN:
Silencing of COL1A2, COL6A3, and THBS2 inhibits gastric cancer cell
proliferation, migration, and invasion while promoting apoptosis
through the PI3k-Akt signaling pathway. J Cell Biochem.
119:4420–4434. 2018. View Article : Google Scholar : PubMed/NCBI
|
|
81
|
Zhuo C, Li X, Zhuang H, Tian S, Cui H,
Jiang R, Liu C, Tao R and Lin X: Elevated THBS2, COL1A2, and SPP1
expression levels as predictors of gastric cancer prognosis. Cell
Physiol Biochem. 40:1316–1324. 2016. View Article : Google Scholar : PubMed/NCBI
|
|
82
|
Hao S, Lv J, Yang Q, Wang A, Li Z, Guo Y
and Zhang G: Identification of key genes and circular RNAs in human
gastric cancer. Med Sci Monit. 25:2488–2504. 2019. View Article : Google Scholar : PubMed/NCBI
|
|
83
|
Suzuki S, Dobashi Y, Hatakeyama Y, Tajiri
R, Fujimura T, Heldin CH and Ooi A: Clinicopathological
significance of platelet-derived growth factor (PDGF)-B and
vascular endothelial growth factor-A expression, PDGF receptor-β
phosphorylation, and microvessel density in gastric cancer. BMC
Cancer. 10:6592010. View Article : Google Scholar : PubMed/NCBI
|
|
84
|
Mazzoccoli G, Pazienza V, Panza A, Valvano
MR, Benegiamo G, Vinciguerra M, Andriulli A and Piepoli A: ARNTL2
and SERPINE1: Potential biomarkers for tumor aggressiveness in
colorectal cancer. J Cancer Res Clin Oncol. 138:501–511. 2012.
View Article : Google Scholar : PubMed/NCBI
|