Introduction
Skin cutaneous melanoma (SKCM) is a highly
aggressive skin cancer, which arises from the malignant
transformation of melanocytes in the basal layer of the epidermis
(1,2)
and has a poor prognosis, with a 5-year overall survival (OS) of
91.8% worldwide (3). The number of
new cases of SKCM that will emerge in 2019 was estimated to be
96,480, with the mortality estimated to be 7,230 (4,5).
Therefore, there is an urgent need to identify novel biomarkers and
prognostic predictive indicators for the detection and management
of SKCM.
The JAK-STAT signaling pathway serves a crucial role
in cell immunity, division and death, and in tumor formation
(6). The two key components involved
in this pathway are Janus kinases (JAKs) and signal transducer and
activator of transcription proteins (STATs), which are encoded by
the genes JAK (JAK1, JAK2, JAK3 and TYK2) and
STAT (STAT1, STAT2, STAT3, STAT4, STAT5A, STAT5B and
STAT6), respectively (6).
A previous study has demonstrated that the key genes
involved in the JAK-STAT signaling pathway are associated with
several types of cancer, including breast (7,8),
ovarian, lung, brain (9) and
colorectal (10) cancer, and that
their differential expression may result in different prognosis
outcomes in different types of cancer. However, few reports about
the association between these genes and SKCM are available, and
further investigation analyzing the prognostic value of gene
expression in the JAK-STAT signaling pathway in SKCM is needed. The
aim of the present study was to identify the prognostic values of
the expression of genes involved in the JAK-STAT signaling pathway
in patients with SKCM based on data derived from public databases
and bioinformatics analysis, and to explore the underlying
mechanism that may affect the outcome in SKCM prognosis.
Materials and methods
Data preparation
The Cancer Genome Atlas (TCGA; https://cancergenome.nih.gov; accessed on September
10th 2018 was used to obtain the gene expression and clinical data
of patients with SKCM, including sex, age and tumor stage. A total
of 458 SKCM cases were selected after removing the cases with
missing mRNA expression or clinical data and 0-day survival
time.
Functional analysis of key genes in
the JAK-STAT signaling pathway
The Kyoto Encyclopedia of Genes and Genomes (KEGG)
signaling pathway map was generated using the KEGG website
(https://www.kegg.jp; accessed on September 10th
2018 (11–13). Gene ontology (GO) term analysis,
including biological function (BP), molecular function (MF) and
cellular component (CC), as well as KEGG enrichment analysis for
JAK and STAT gene families, were performed using the Database for
Annotation, Visualization and Integrated Discovery version 6.8
(DAVID; https://david.ncifcrf.gov/tools.jsp; accessed on
September 13th 2018. The official gene symbol was used as the
identifier; the species was Homo sapiens (14,15).
Gene interaction and association
analysis
Gene-gene interaction analysis was performed using
gene multiple association network integration algorithm (GeneMANIA;
http://genemania.org; accessed on September 15th
2018 using the default parameters (16,17). The
correlation between JAK and STAT pathway gene expression in SKCM
was evaluated using the Pearson's correlation coefficient;
P<0.01 was considered to indicate a significant correlation.
Protein-protein interaction analysis was performed using the Search
Tool for the Retrieval of Interacting Genes/Proteins (STRING;
https://string-db.org; accessed on September 25th
2018. The minimum required interaction score was 0.400 (18,19).
Patient grouping based on gene
expression level
Patients with SKCM were divided into high or low
expression groups using the median value, and the vertical scatter
plots were generated.
Survival analysis
Kaplan-Meier survival plots with log-rank test were
used to evaluate the OS for the high and low-expression groups of
each gene and clinicopathological characteristics. In addition, the
Cox proportional hazard regression model was used for univariate
and multivariate survival analyses, and 95% confidence intervals
(CIs) and hazard ratios (HRs) were calculated. Joint effects
analysis was performed for the combination of genes identified as
significant by the survival analysis.
Nomogram
A nomogram was used to evaluate the association
between JAK and STAT gene expression and clinical information in
SKCM. In addition, the risk rank for each gene and
clinicopathological characteristic, including age, sex and tumor
stage, was evaluated by the risk points and total points. Survival
rates (1-, 3- and 5-year) were also scored. A high score was
associated with a low survival rate.
Gene set enrichment analysis
(GSEA)
To investigate the potential underlying mechanism of
the differential expression of STAT1, STAT3, STAT4, STAT5B
and STAT6 in SKCM, GSEA version 3.0 software (http://software.broadinstitute.org/gsea/msigdb/index.jsp;
accessed on September 20th 2018 (20) was used, and the difference in the
expression levels in the low and high-expression groups for each
gene was analyzed with reference gene sets, which were based on the
Molecular Signatures Database sets c2 (KEGG gene sets,
c2.all.v6.2.symbols.gmt), c5 [Gene Ontology (GO) gene sets,
c5.all.v6.2.symbols.gmt] and c6 (oncogenic signatures gene sets,
c6.all.v6.2.symbols.gmt) (21). The
permutation number was set to 1,000. Those enrichment gene sets
revealed by GSEA as exhibiting a nominal P<0.05 and a false
discovery rate (FDR) <0.25 were considered to indicate a
statistically significant difference. The default parameters were
used in GSEA software.
Statistical analysis
Statistical analysis was performed using SPSS v.25.0
software (IBM Corp.) and R 3.3.5 (https://www.r-project.org/). Kaplan-Meier survival
analysis and the log-rank test were used to calculate the OS and
P-values for all associations. The Cox proportional hazards
regression model was used for univariate and multivariate survival
analyses. HRs and 95% CIs were calculated using the Cox
proportional hazards regression model with adjustment for
influential clinical characteristics such as race, sex, age,
Tumor-Node-Metastasis stage (22)
and body mass index. FDRs in the GSEA were adjusted for multiple
testing with the Benjamini-Hochberg procedure to control the FDR
(23,24). P<0.05 was considered to indicate a
statistically significant difference. Vertical scatter plots and
survival curves were generated in GraphPad Prism v.7.0 (GraphPad
Software, Inc.).
Results
Clinicopathological characteristics of
patients with SKCM
The clinicopathological data of the 458 patients
included in the present study are presented in Table I. Race, age and tumor stage were
significantly associated with median survival time (P=0.003,
P<0.001 and P<0.001, respectively; Table I). After normalization, only JAK1,
STAT1, STAT3, STAT4, STAT5B and STAT6 genes mRNA
expression were observed.
 | Table I.Survival analysis based on clinical
information. |
Table I.
Survival analysis based on clinical
information.
| Characteristic | Patients
(n=458) | No. of events
(%) | MST (days) | HR (95% CI) | Crude P-value |
|---|
| Race |
|
|
|
| 0.003a |
|
Caucasian | 435 | 210 (48.3) | 2,454 | 0.337 (0.166–0.687)
Ref. |
|
|
Other | 13 | 8 (61.5) | 636 |
|
|
|
Unknown | 10 |
|
|
|
|
| Sex |
|
|
|
| 0.345 |
|
Male | 284 | 146 (51.4) | 2,421 | Ref. 0.872
(0.657–1.158) |
|
|
Female | 174 | 73 (42.0) | 2,367 |
|
|
| Age (years) |
|
|
|
|
<0.001a |
|
≤60 | 239 | 115 (48.1) | 3,196 | 0.587 (0.445–0.773)
Ref. |
|
|
>60 | 219 | 104 (47.5) | 1,864 |
|
|
| Tumor
stageb |
|
|
|
|
<0.001a |
|
Early | 231 | 108 (46.8) | 3,195 | 0.547 (0.411–0.728)
Ref. |
|
|
Advanced | 191 | 96 (50.3) | 1,927 |
|
|
|
Unknown | 36 |
|
|
|
|
Bioinformatics analysis of JAK and
STAT genes
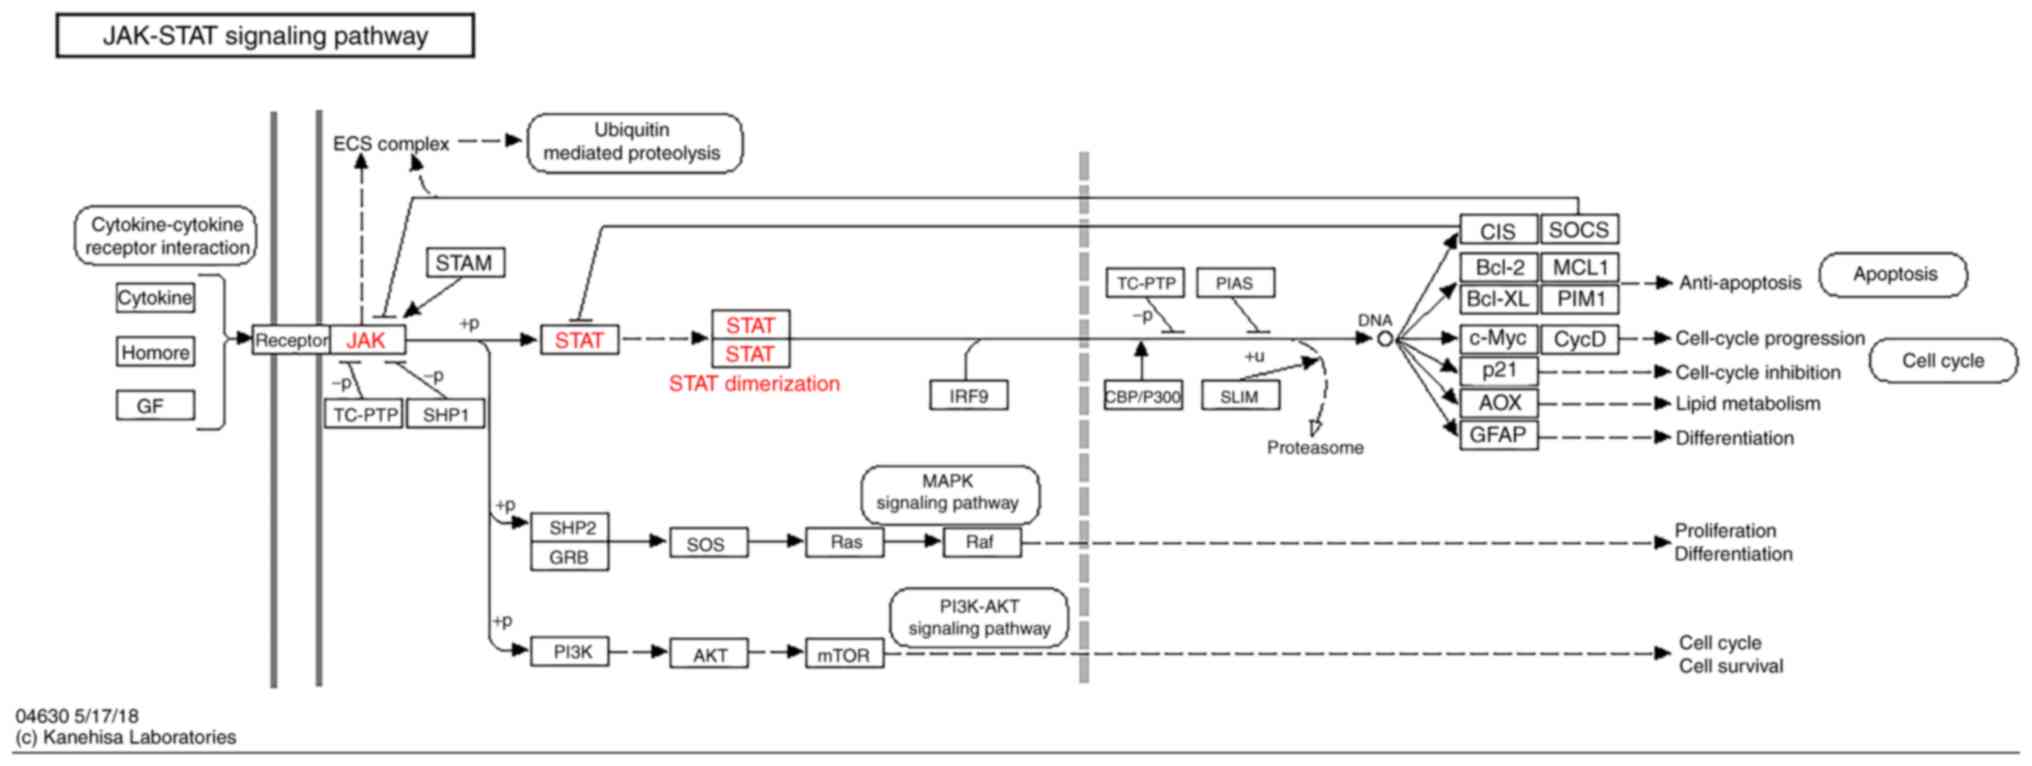
The KEGG pathway map of the JAK-STAT signaling
pathway is represented in Fig. 1
(KEGG map no. 04630; http://www.genome.jp/dbget-bin/www_bget?pathway:map04630).
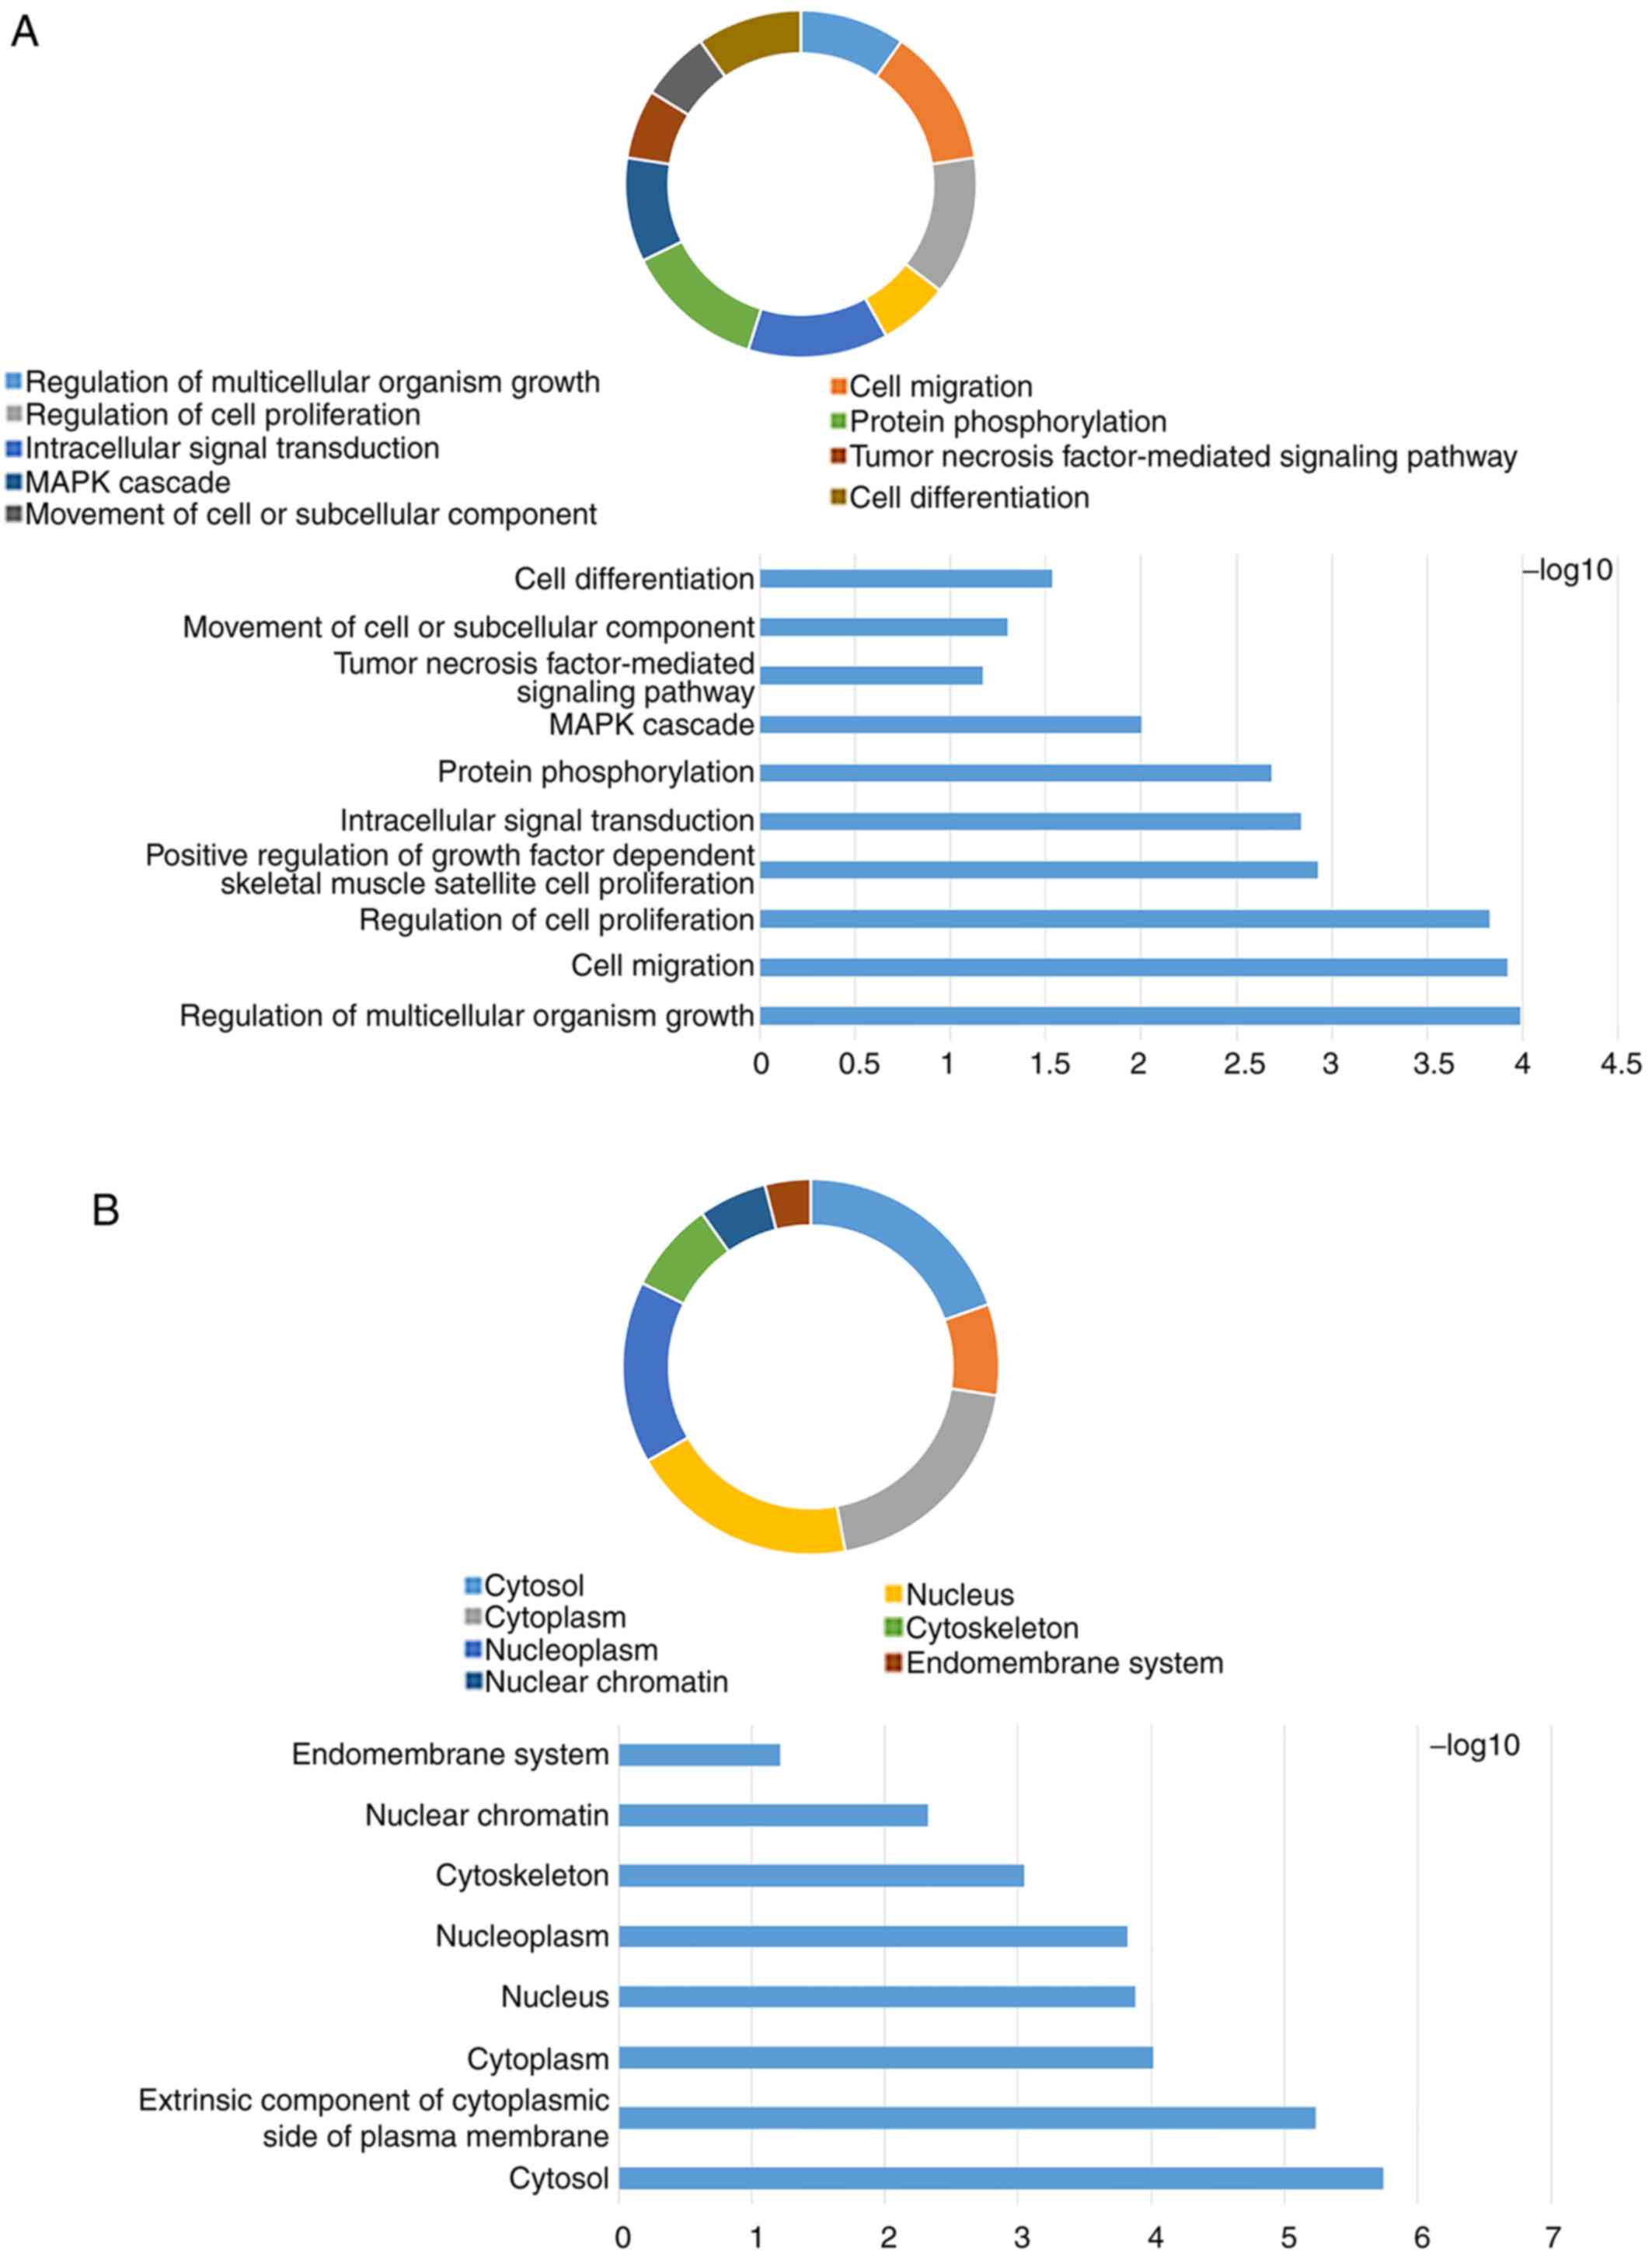
The GO term and KEGG enrichment analysis for JAK and STAT genes
included BP (Figs. S1A and S2A), CC (Figs.
S1B and S2B), MF (Figs. S1C and S2C) and KEGG (Figs. S1D and S2D). The DAVID result for the combination
of JAK and STAT gene families suggested that the JAK and STAT
signaling pathways were associated with cell migration, the
mitogen-activated protein kinase (MAPK) cascade, cell
differentiation (Fig. 2A), cytosol,
cytoplasm (Fig. 2B), DNA binding,
ATP binding, signal transducer activity (Fig. 2C), the PI3K-AKT signaling pathway and
the pancreatic cancer signaling pathway (Fig. 2D).
Gene interaction and association
analysis
The gene-gene interaction network was analyzed
separately in the JAK family (Fig. S3) and in the STAT family
(Fig. S4), as well as in their
combination (Fig. 3A). The
protein-protein interaction network is presented in Fig. 3B.
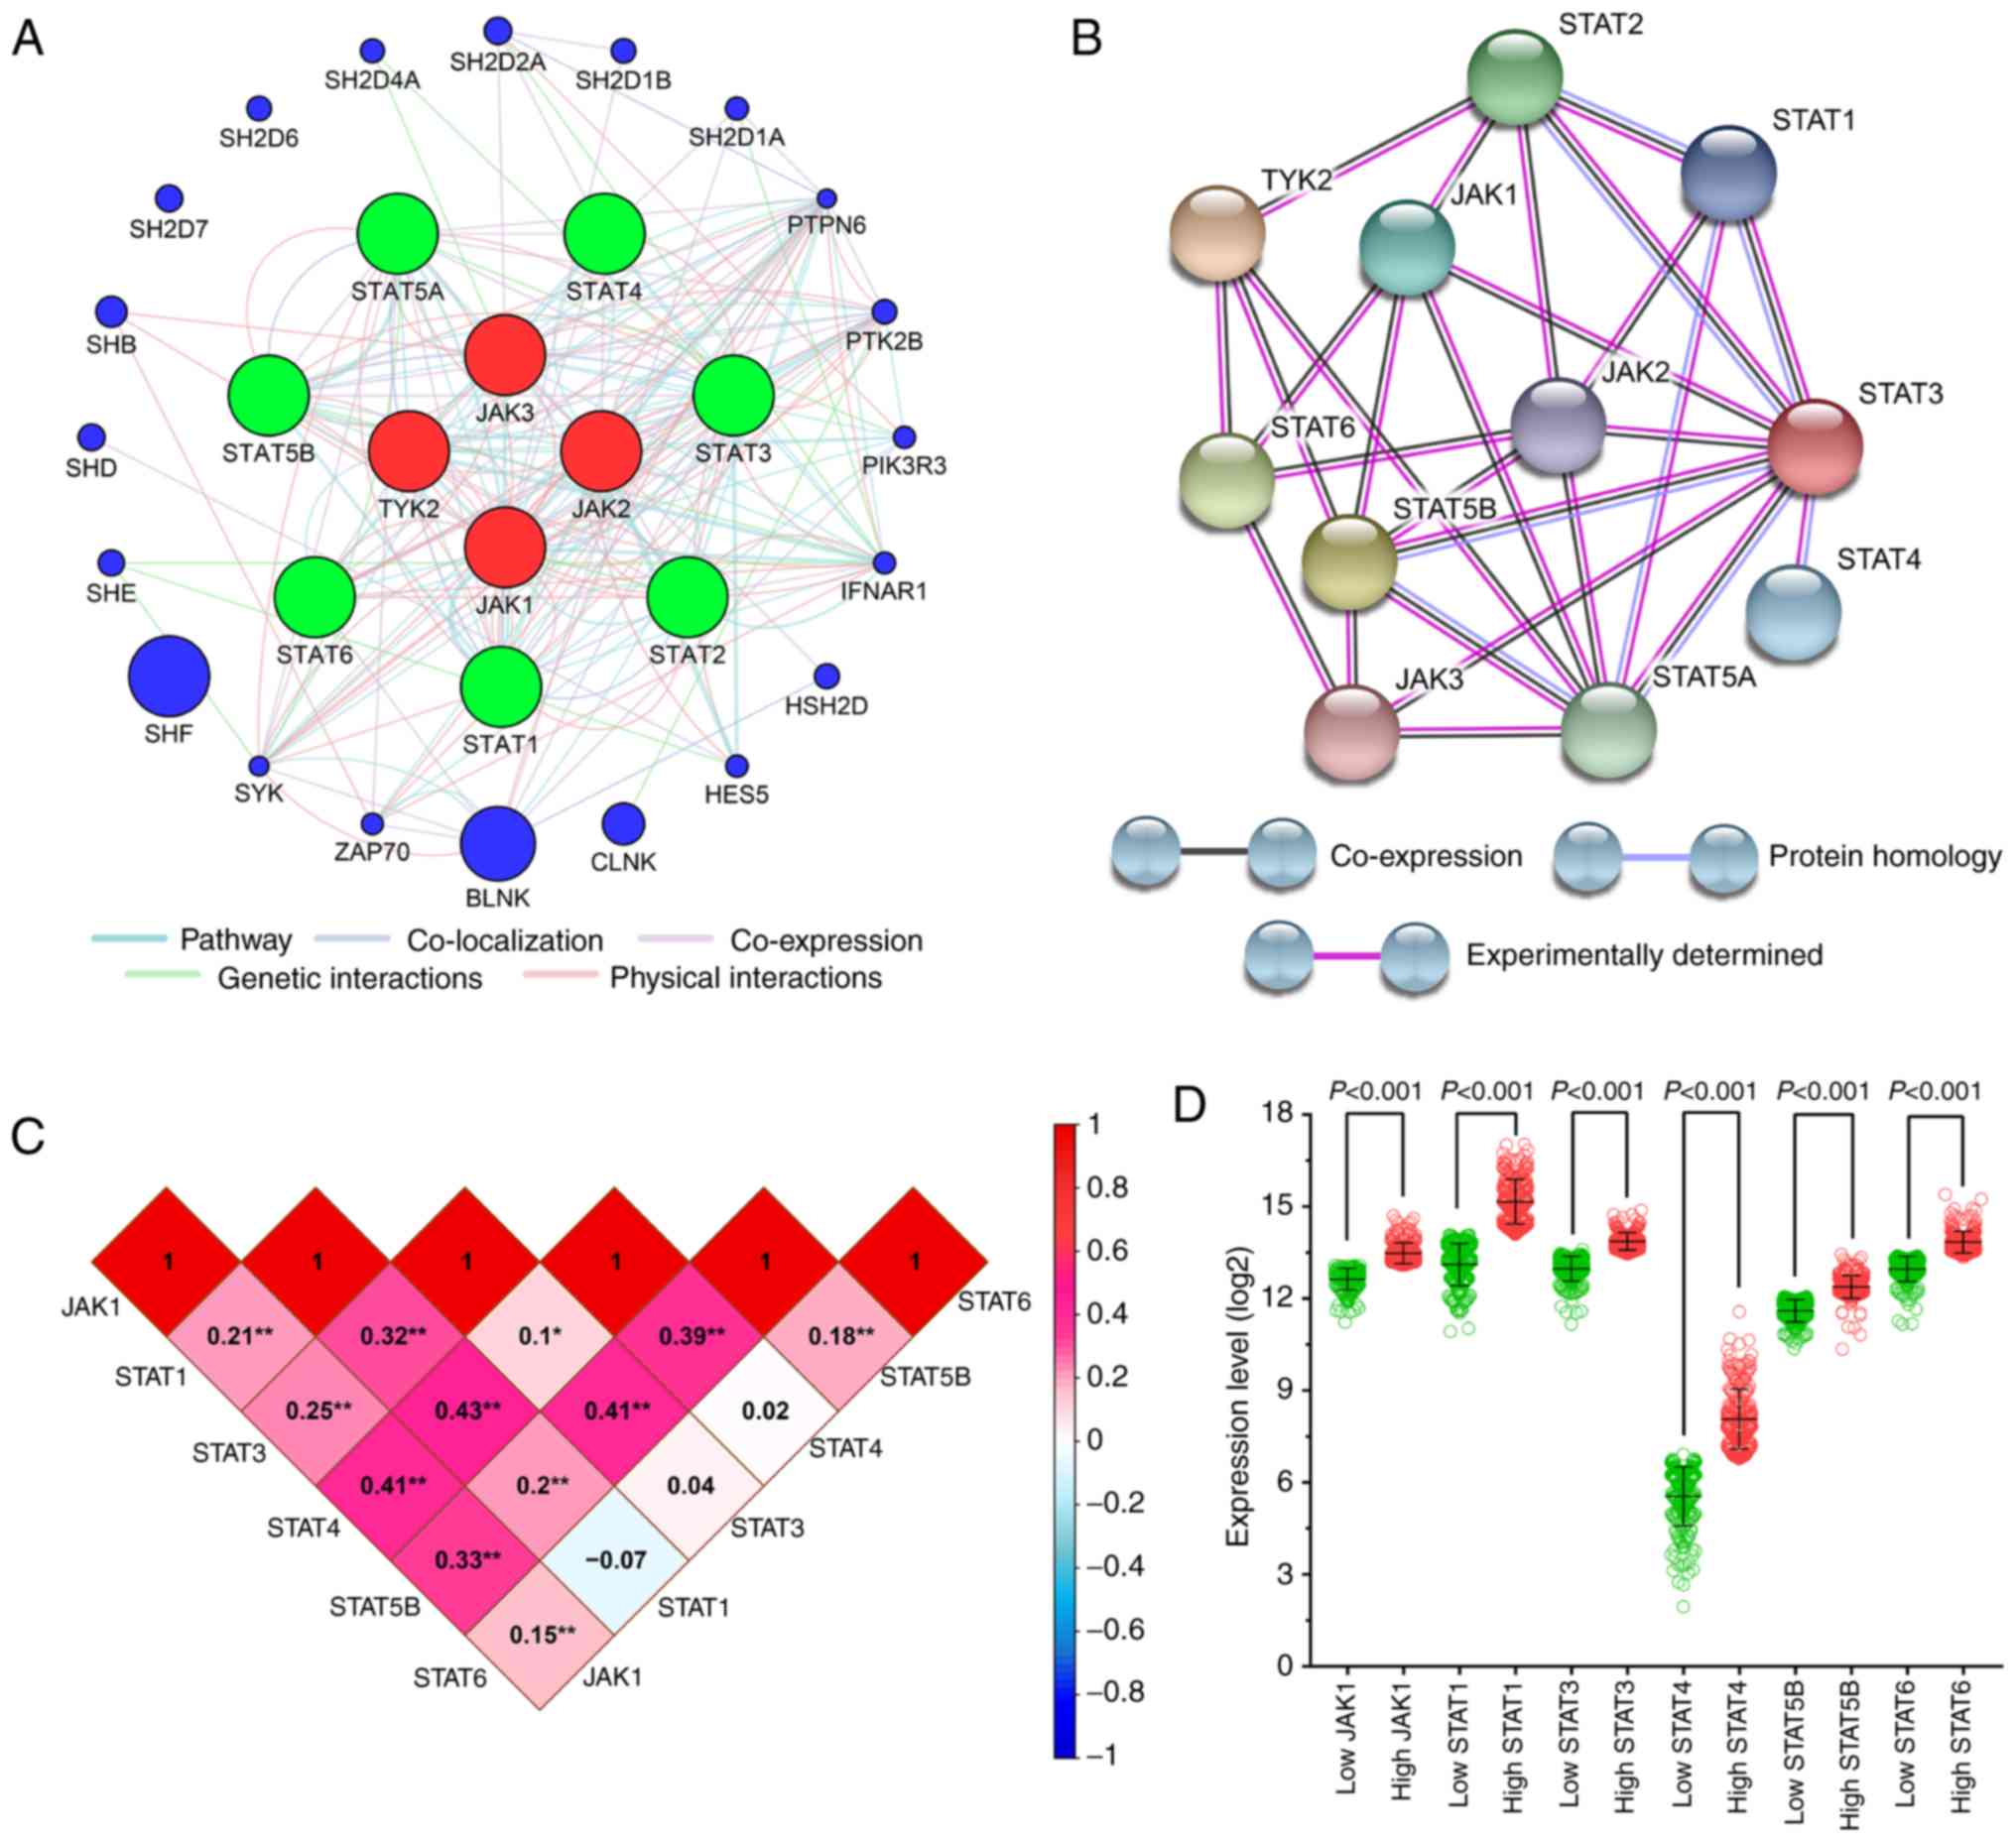 | Figure 3.Correlation and association analysis
for JAK and STAT genes in SKCM (A) Gene interaction network of JAK
and STAT genes generated by GeneMANIA. (B) Protein-protein
interaction network generated using the STRING database. (C)
Pearson's correlation coefficients for JAK1, STAT1, STAT3,
STAT4, STAT5B and STAT6 gene expression levels. (D)
Scatter plots of JAK1, STAT1, STAT3, STAT4, STAT5B and
STAT6 gene expression level in The Cancer Genome Atlas
database. GeneMANIA, gene multiple association network integration
algorithm; STRING, Search Tool for the Retrieval of Interacting
Genes/Proteins; STAT, signal transducer and activator of
transcription; SKCM, skin cutaneous melanoma; error bars in the
scatter plots, mean ± SD. |
Pearson's correlation coefficient was used to
analyze the correlation between JAK and STAT genes in SKCM tissues
based on the TCGA dataset (Fig. 3C).
The results suggested that, with the exception of STAT6, the
expression of STAT genes (STAT1, STAT3, STAT4 and
STAT5B) in SKCM strongly correlated with each other.
Scatter plots of the expression of all JAK and STAT
genes in TCGA dataset (using the median as the cut-off value) are
presented in Fig. 3D. The difference
between the high and low-expression groups was statistically
significant (P<0.001).
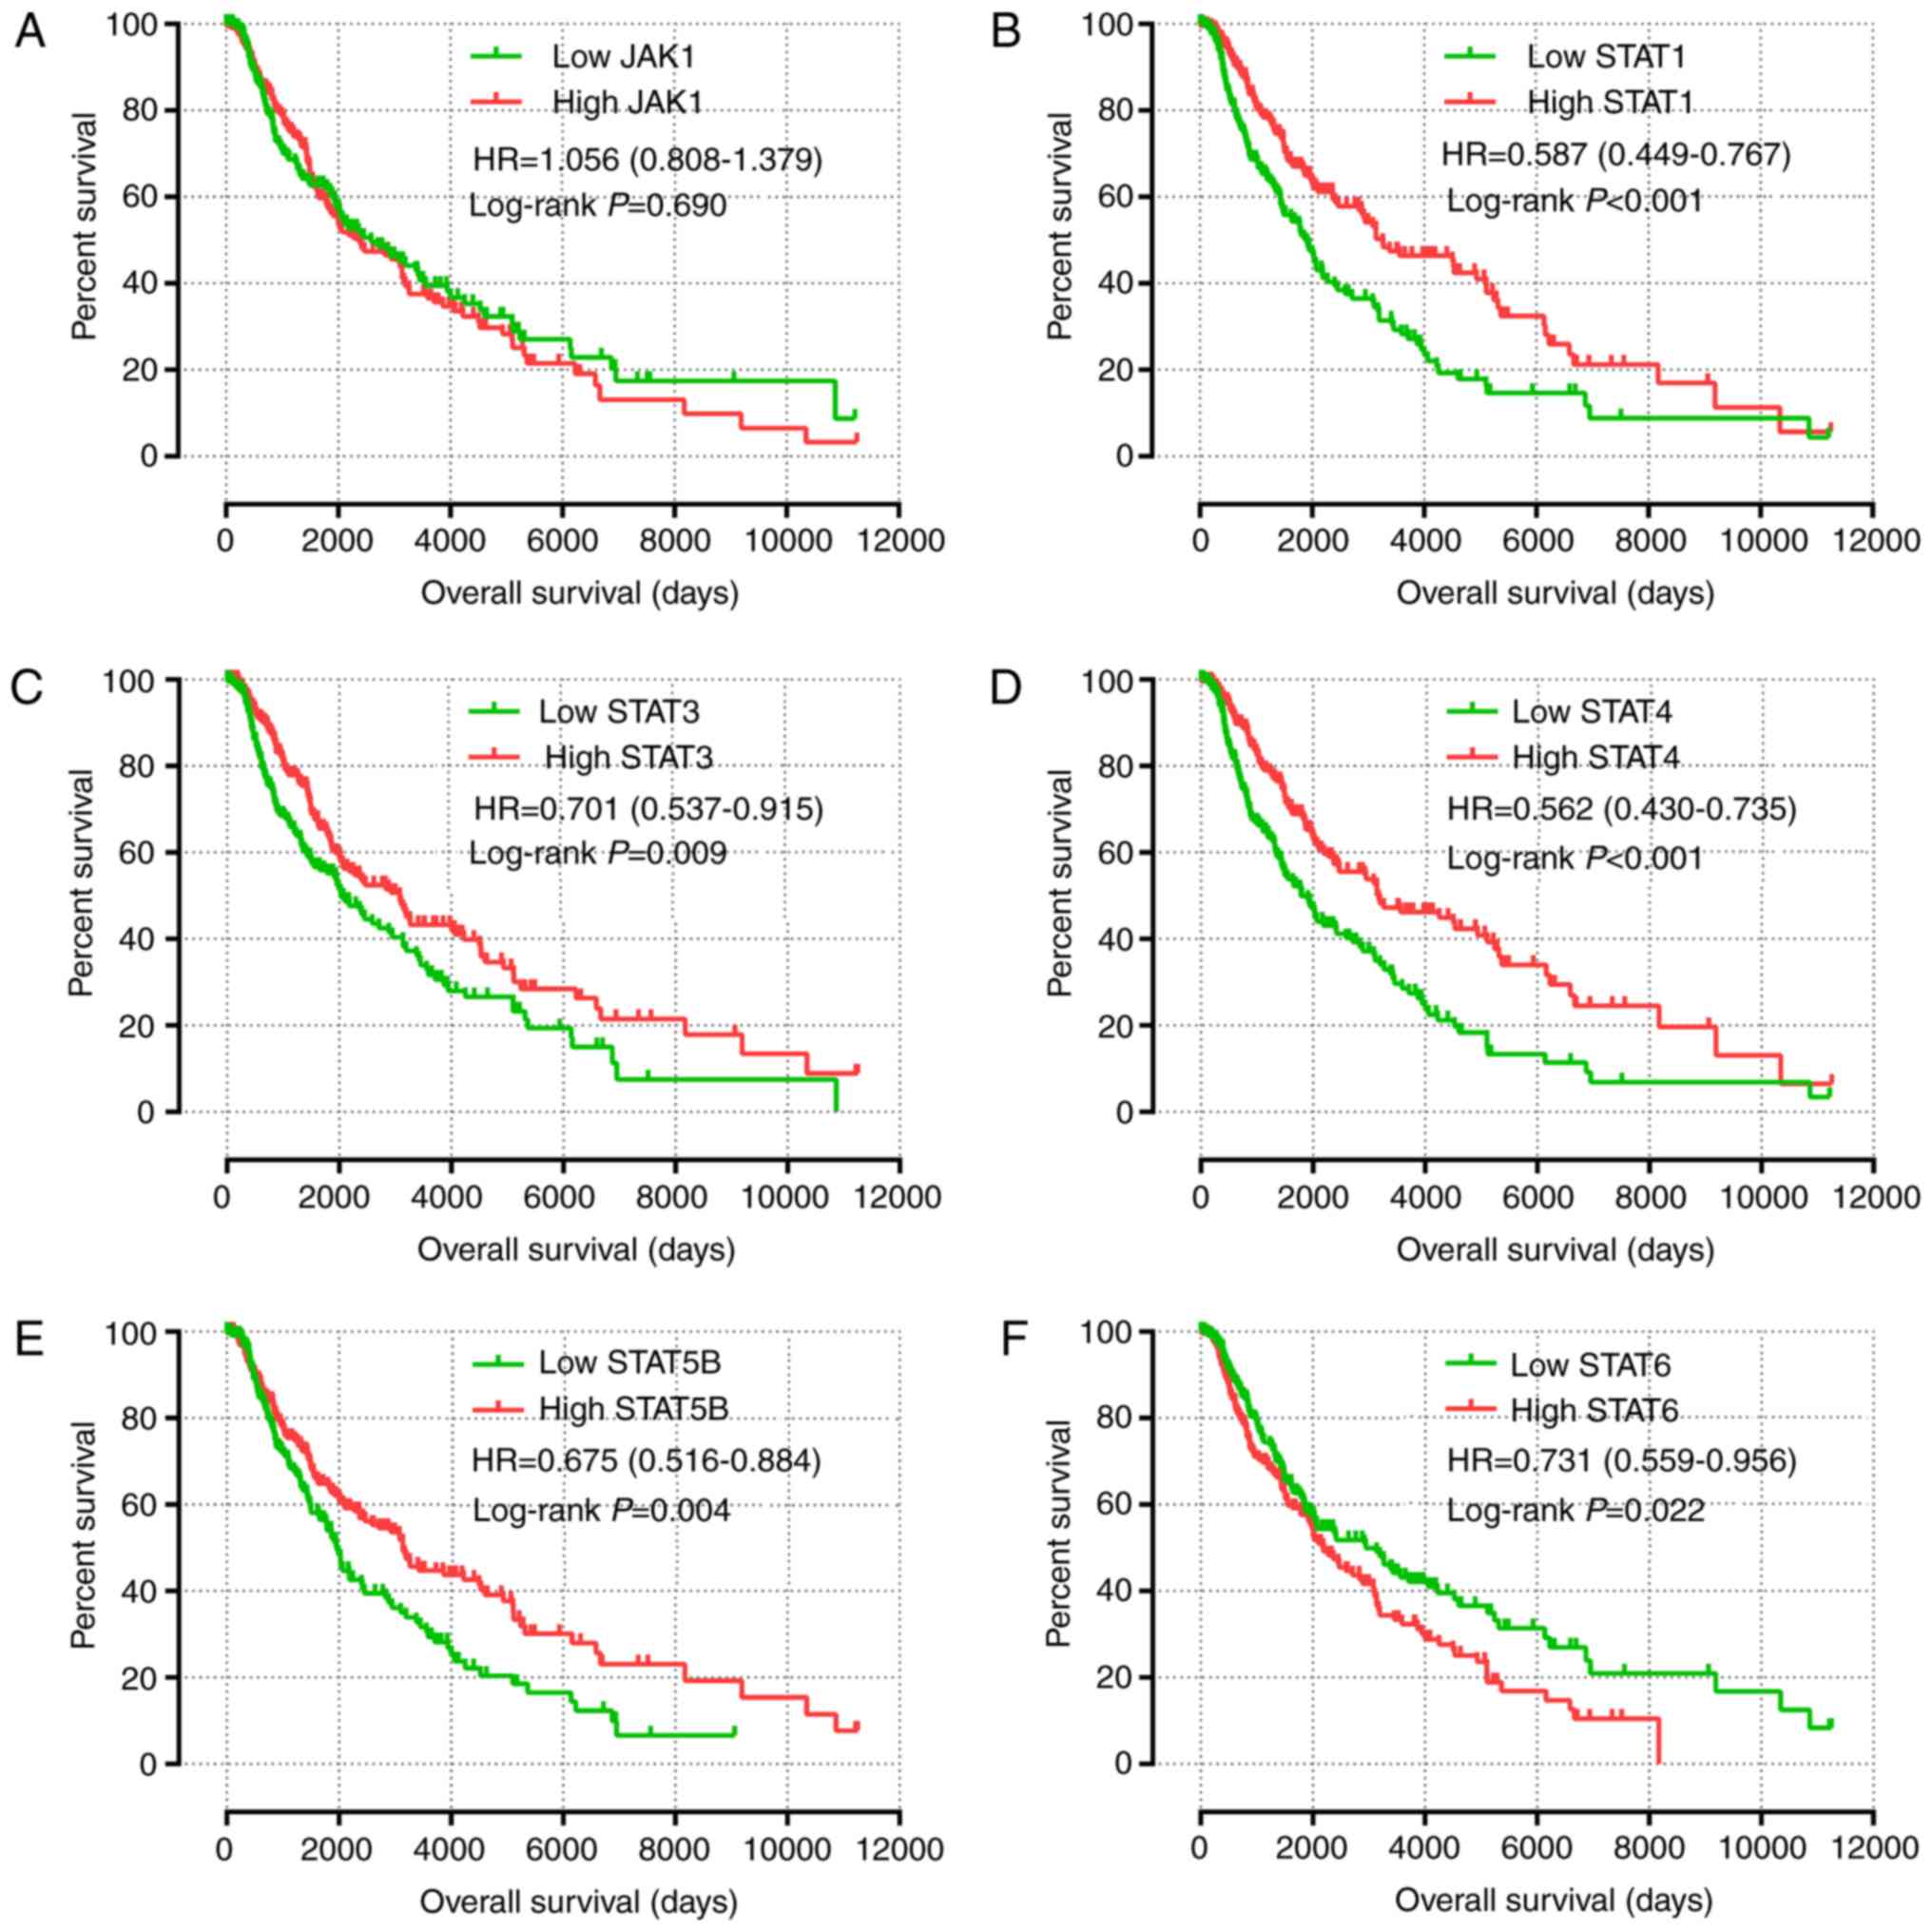
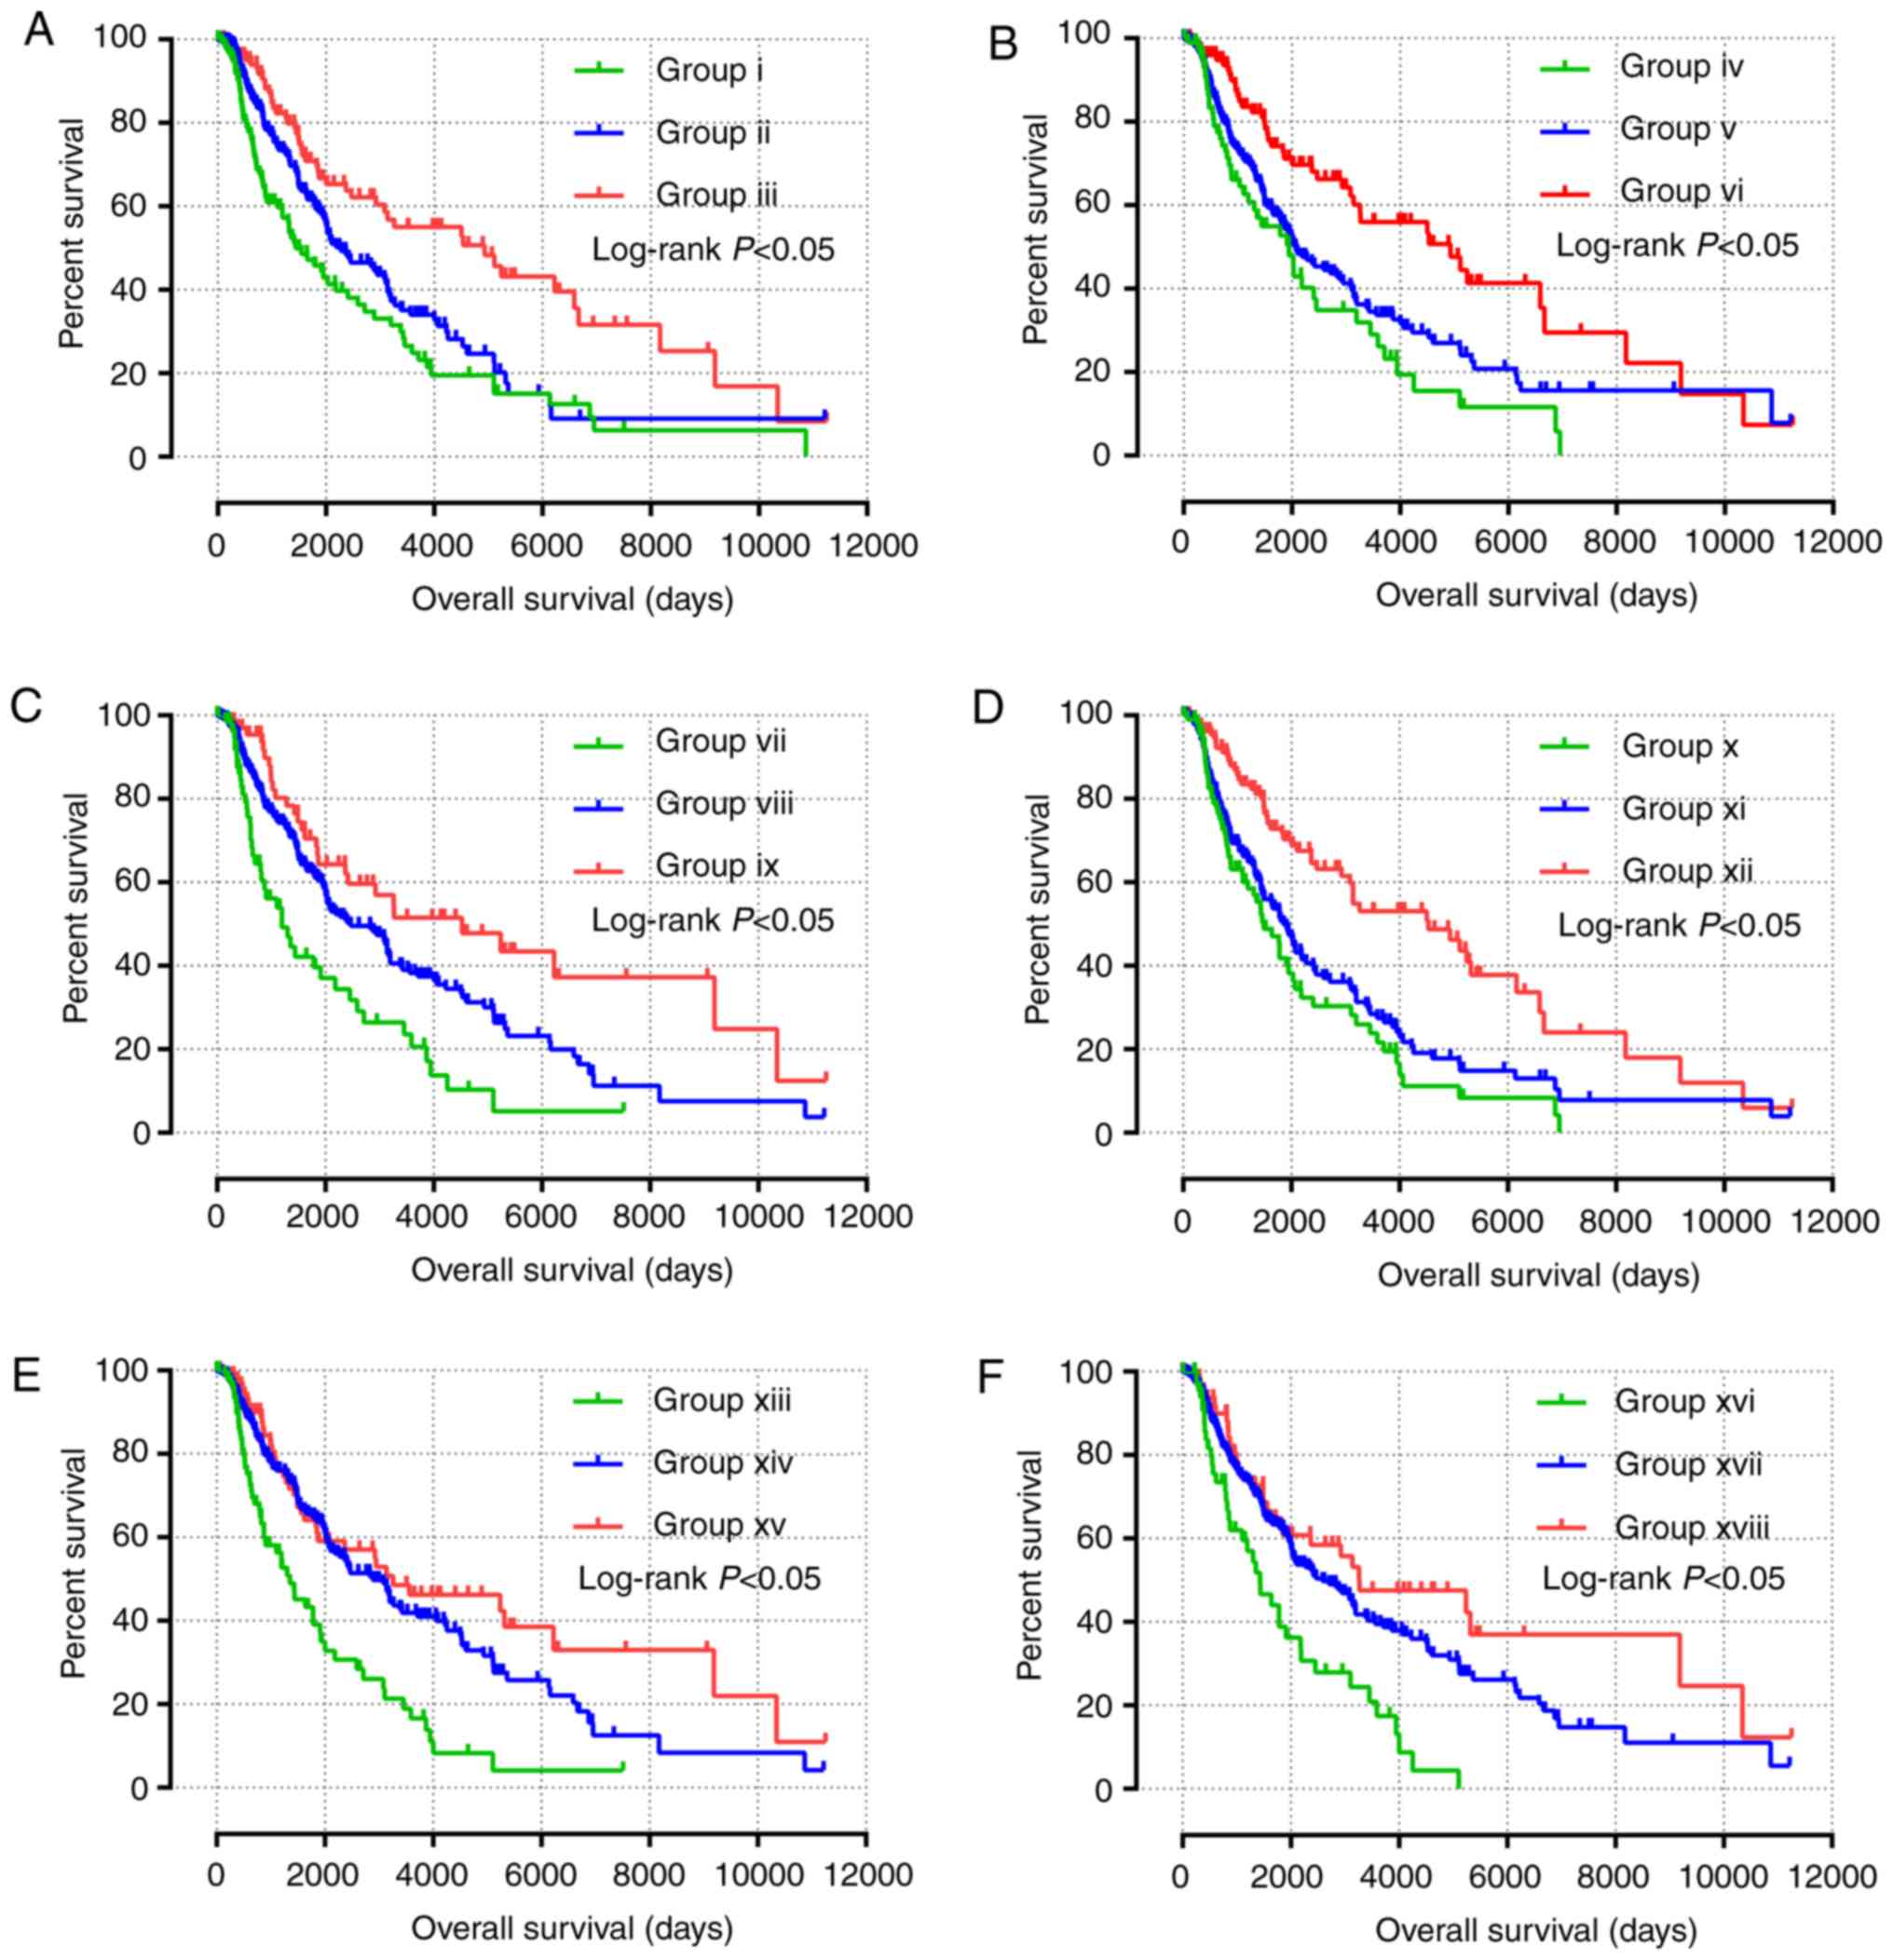
Survival analysis
The results of univariate survival analysis of JAK
and STAT genes are presented in Fig.
4 and Table II. High expression
levels of STAT1, STAT3, STAT4 and STAT5B, and low
expression levels of STAT6 were associated with a favorable
prognosis (P<0.05). Multivariate Cox proportional hazards
regression analysis identified that sex, race, age and tumor stage
were associated with the prognosis of patients with SKCM.
Multivariate survival analysis, in agreement with univariate
survival analysis, demonstrated that high expression of STAT1,
STAT3, STAT4 and STAT5B, and low expression of
STAT6 was associated with a favorable prognosis (adjusted
P<0.001; HR, 0.595; 95% CI, 0.455–0.778; adjusted P=0.018; HR,
0.725; 95% CI, 0.555–0.947; adjusted P<0.001; HR, 0.590; 95% CI,
0.450–0.773; adjusted P=0.007; HR, 0.690; 95% CI, 0.526–0.940; and
adjusted P=0.026; HR, 0.737; 95% CI, 0.563–0.964, respectively;
Table II).
| Table II.Prognostic survival analysis based on
high or low expression of JAK and STAT family genes |
Table II.
Prognostic survival analysis based on
high or low expression of JAK and STAT family genes
| Gene | Patients
(n=458) | No. of events
(%) | MST (days) | Crude HR (95%
CI) | Crude P-value | Adjusted
HRb (95% CI) | Adjusted
P-valueb |
|---|
| JAK1 |
|
Low | 229 | 99 (43.2) | 2,588 | Ref. 1.056
(0.808–1.379) | 0.690 | Ref. 0.950
(0.720–1.253) | 0.716 |
|
High | 229 | 120 (52.4) | 2,365 |
|
|
|
|
| STAT1 |
|
Low | 229 | 119 (52.0) | 1,910 | Ref
0.587(0.449–0.767) |
<0.001a | Ref. 0.595
(0.455–0.778) |
<0.001a |
|
High | 229 | 100 (47.3) | 3,259 |
|
|
|
|
| STAT3 |
|
High | 229 | 113 (49.3) | 2,030 | Ref. 0.701
(0.537–0.915) | 0.009a | Ref. 0.725
(0.555–0.947) | 0.018a |
|
Low | 229 | 106 (46.3) | 3,080 |
|
|
|
|
| STAT4 |
|
Low | 229 | 121 (52.8) | 1,785 | Ref. 0.562
(0.430–0.735) |
<0.001a | Ref. 0.590
(0.450–0.773) |
<0.001a |
|
High | 229 | 98 (42.8) | 3,176 |
|
|
|
|
| STAT5B |
|
Low | 229 | 117 (48.1) | 2,022 | Ref. 0.675
(0.516–0.884) | 0.004a | Ref. 0.690
(0.526–0.940) | 0.007a |
|
High | 229 | 102 (47.4) | 3,139 |
|
|
|
|
| STAT6 |
|
High | 229 | 115 (50.4) | 2,184 | Ref. 0.731
(0.559–0.956) | 0.022a | Ref. 0.737
(0.563–0.964) | 0.026a |
|
Low | 229 | 104 (47.2) | 3,139 |
|
|
|
|
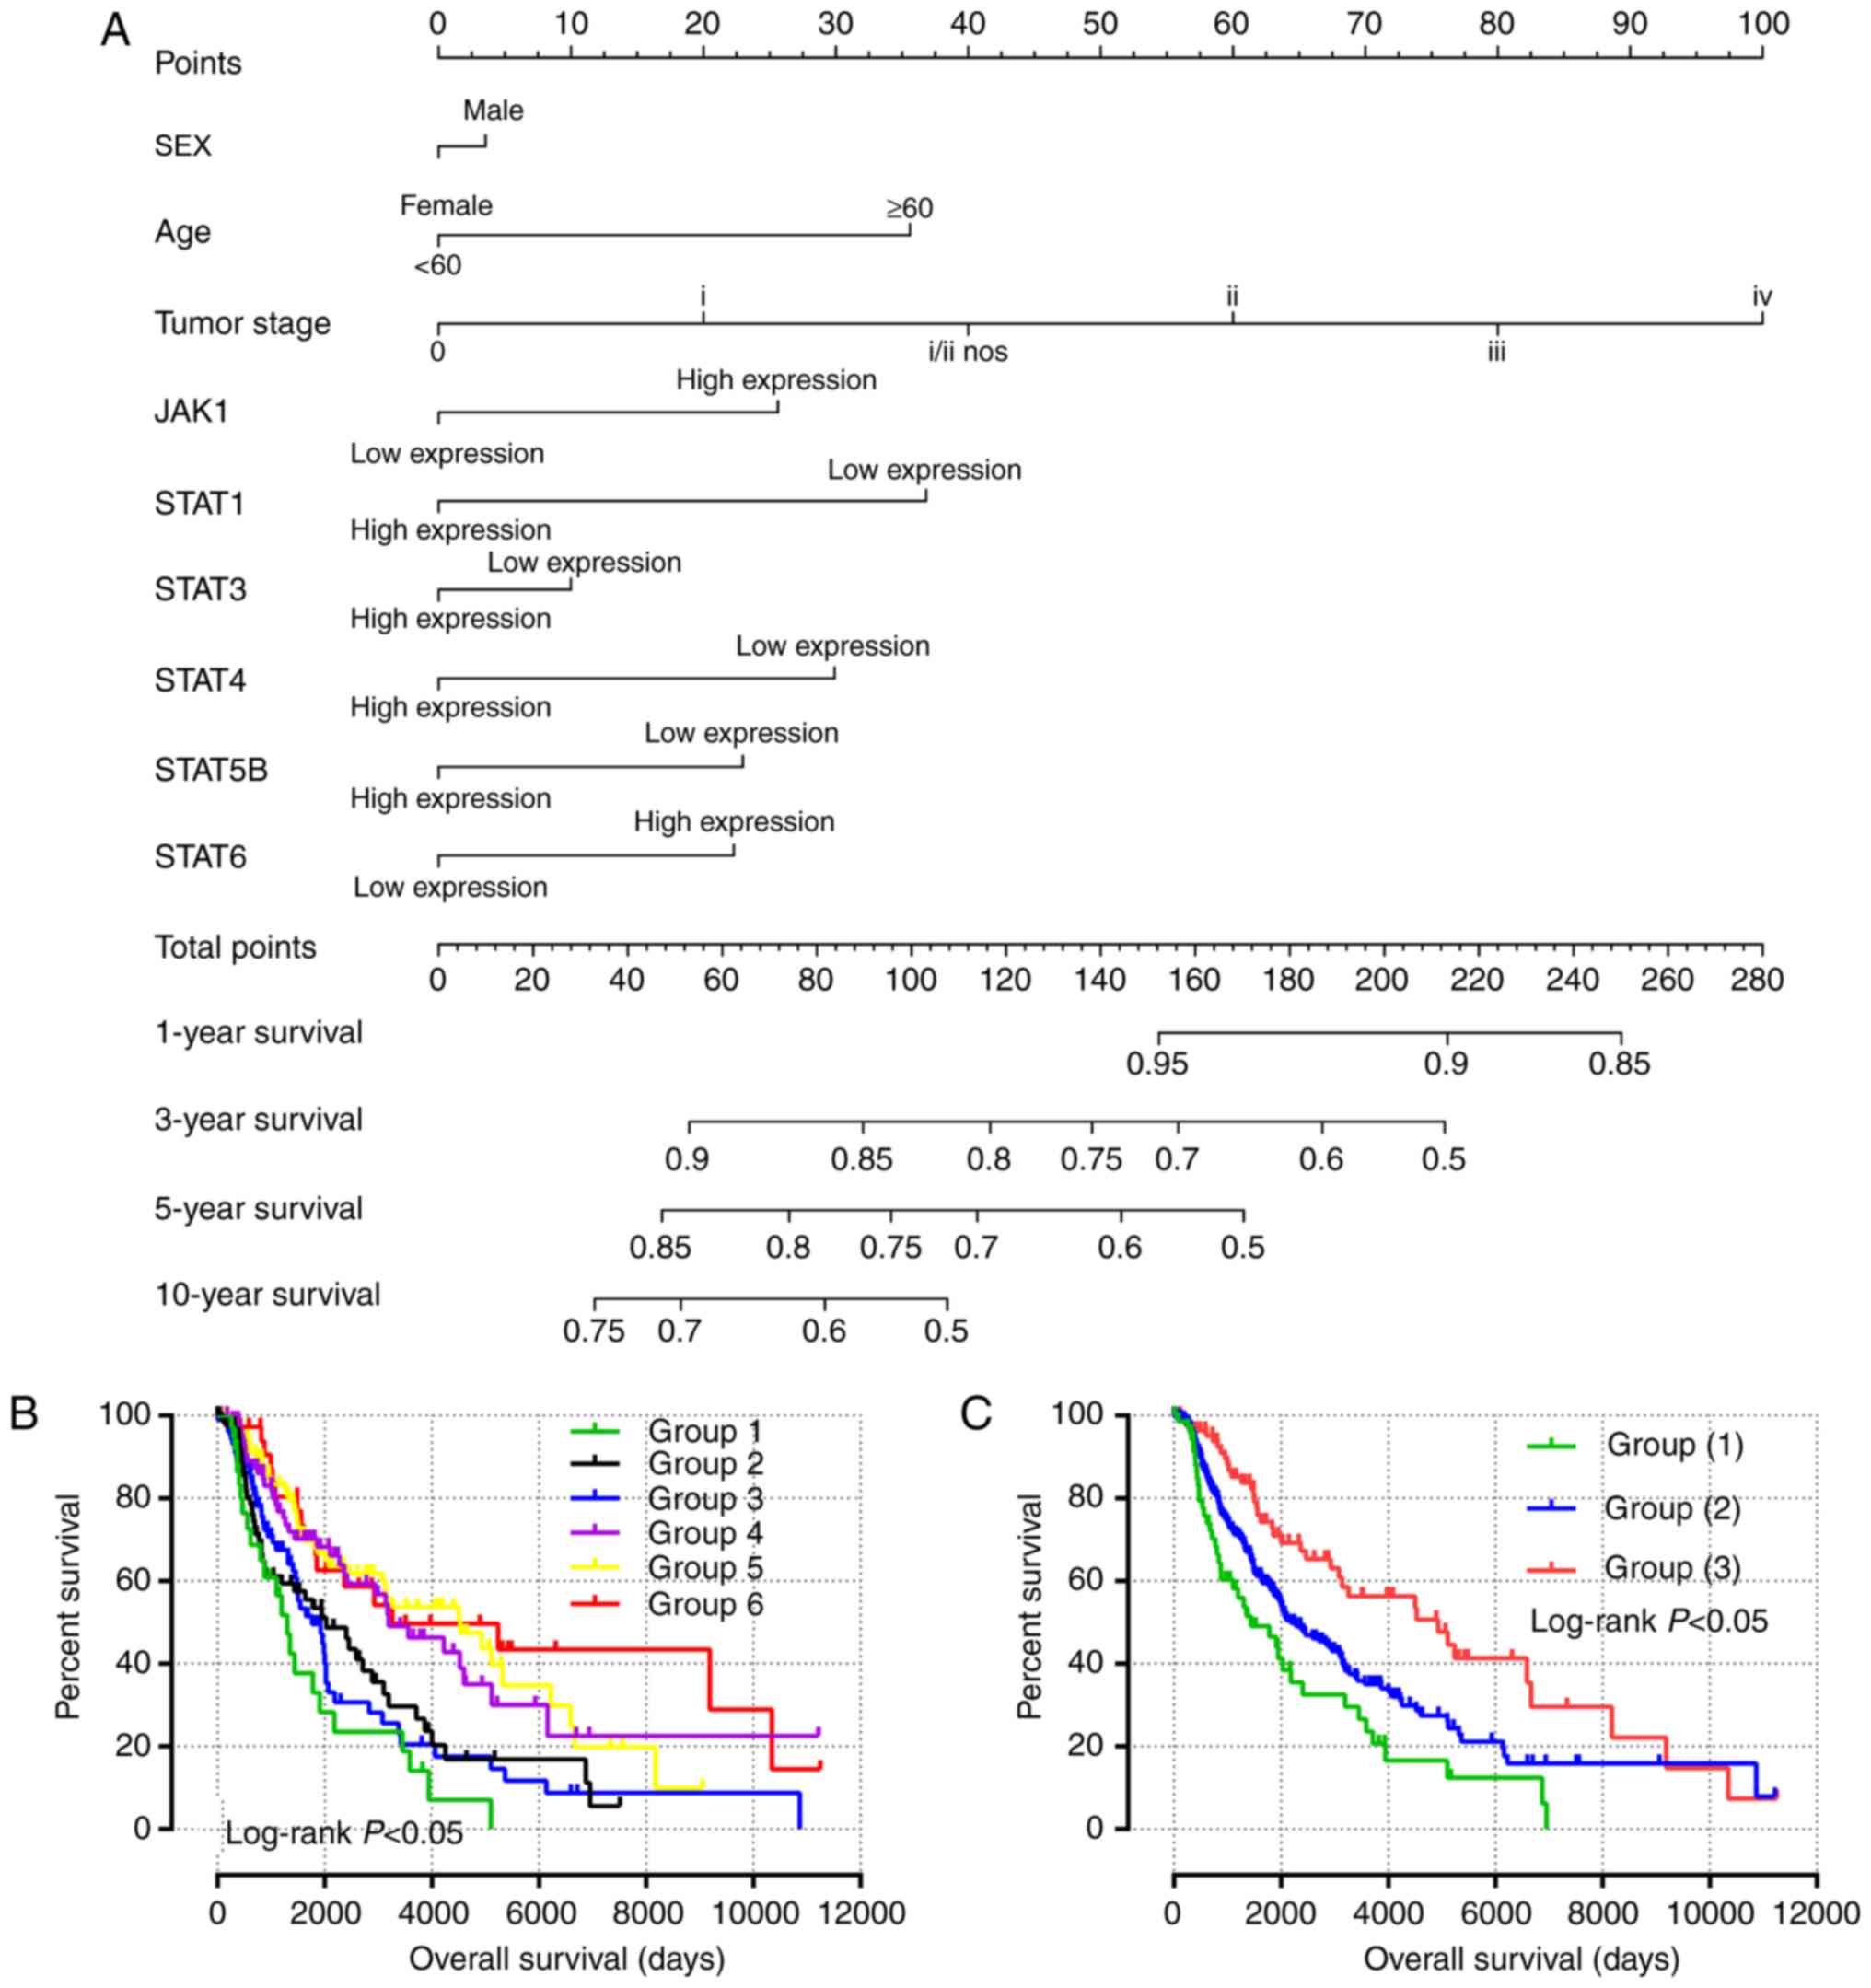
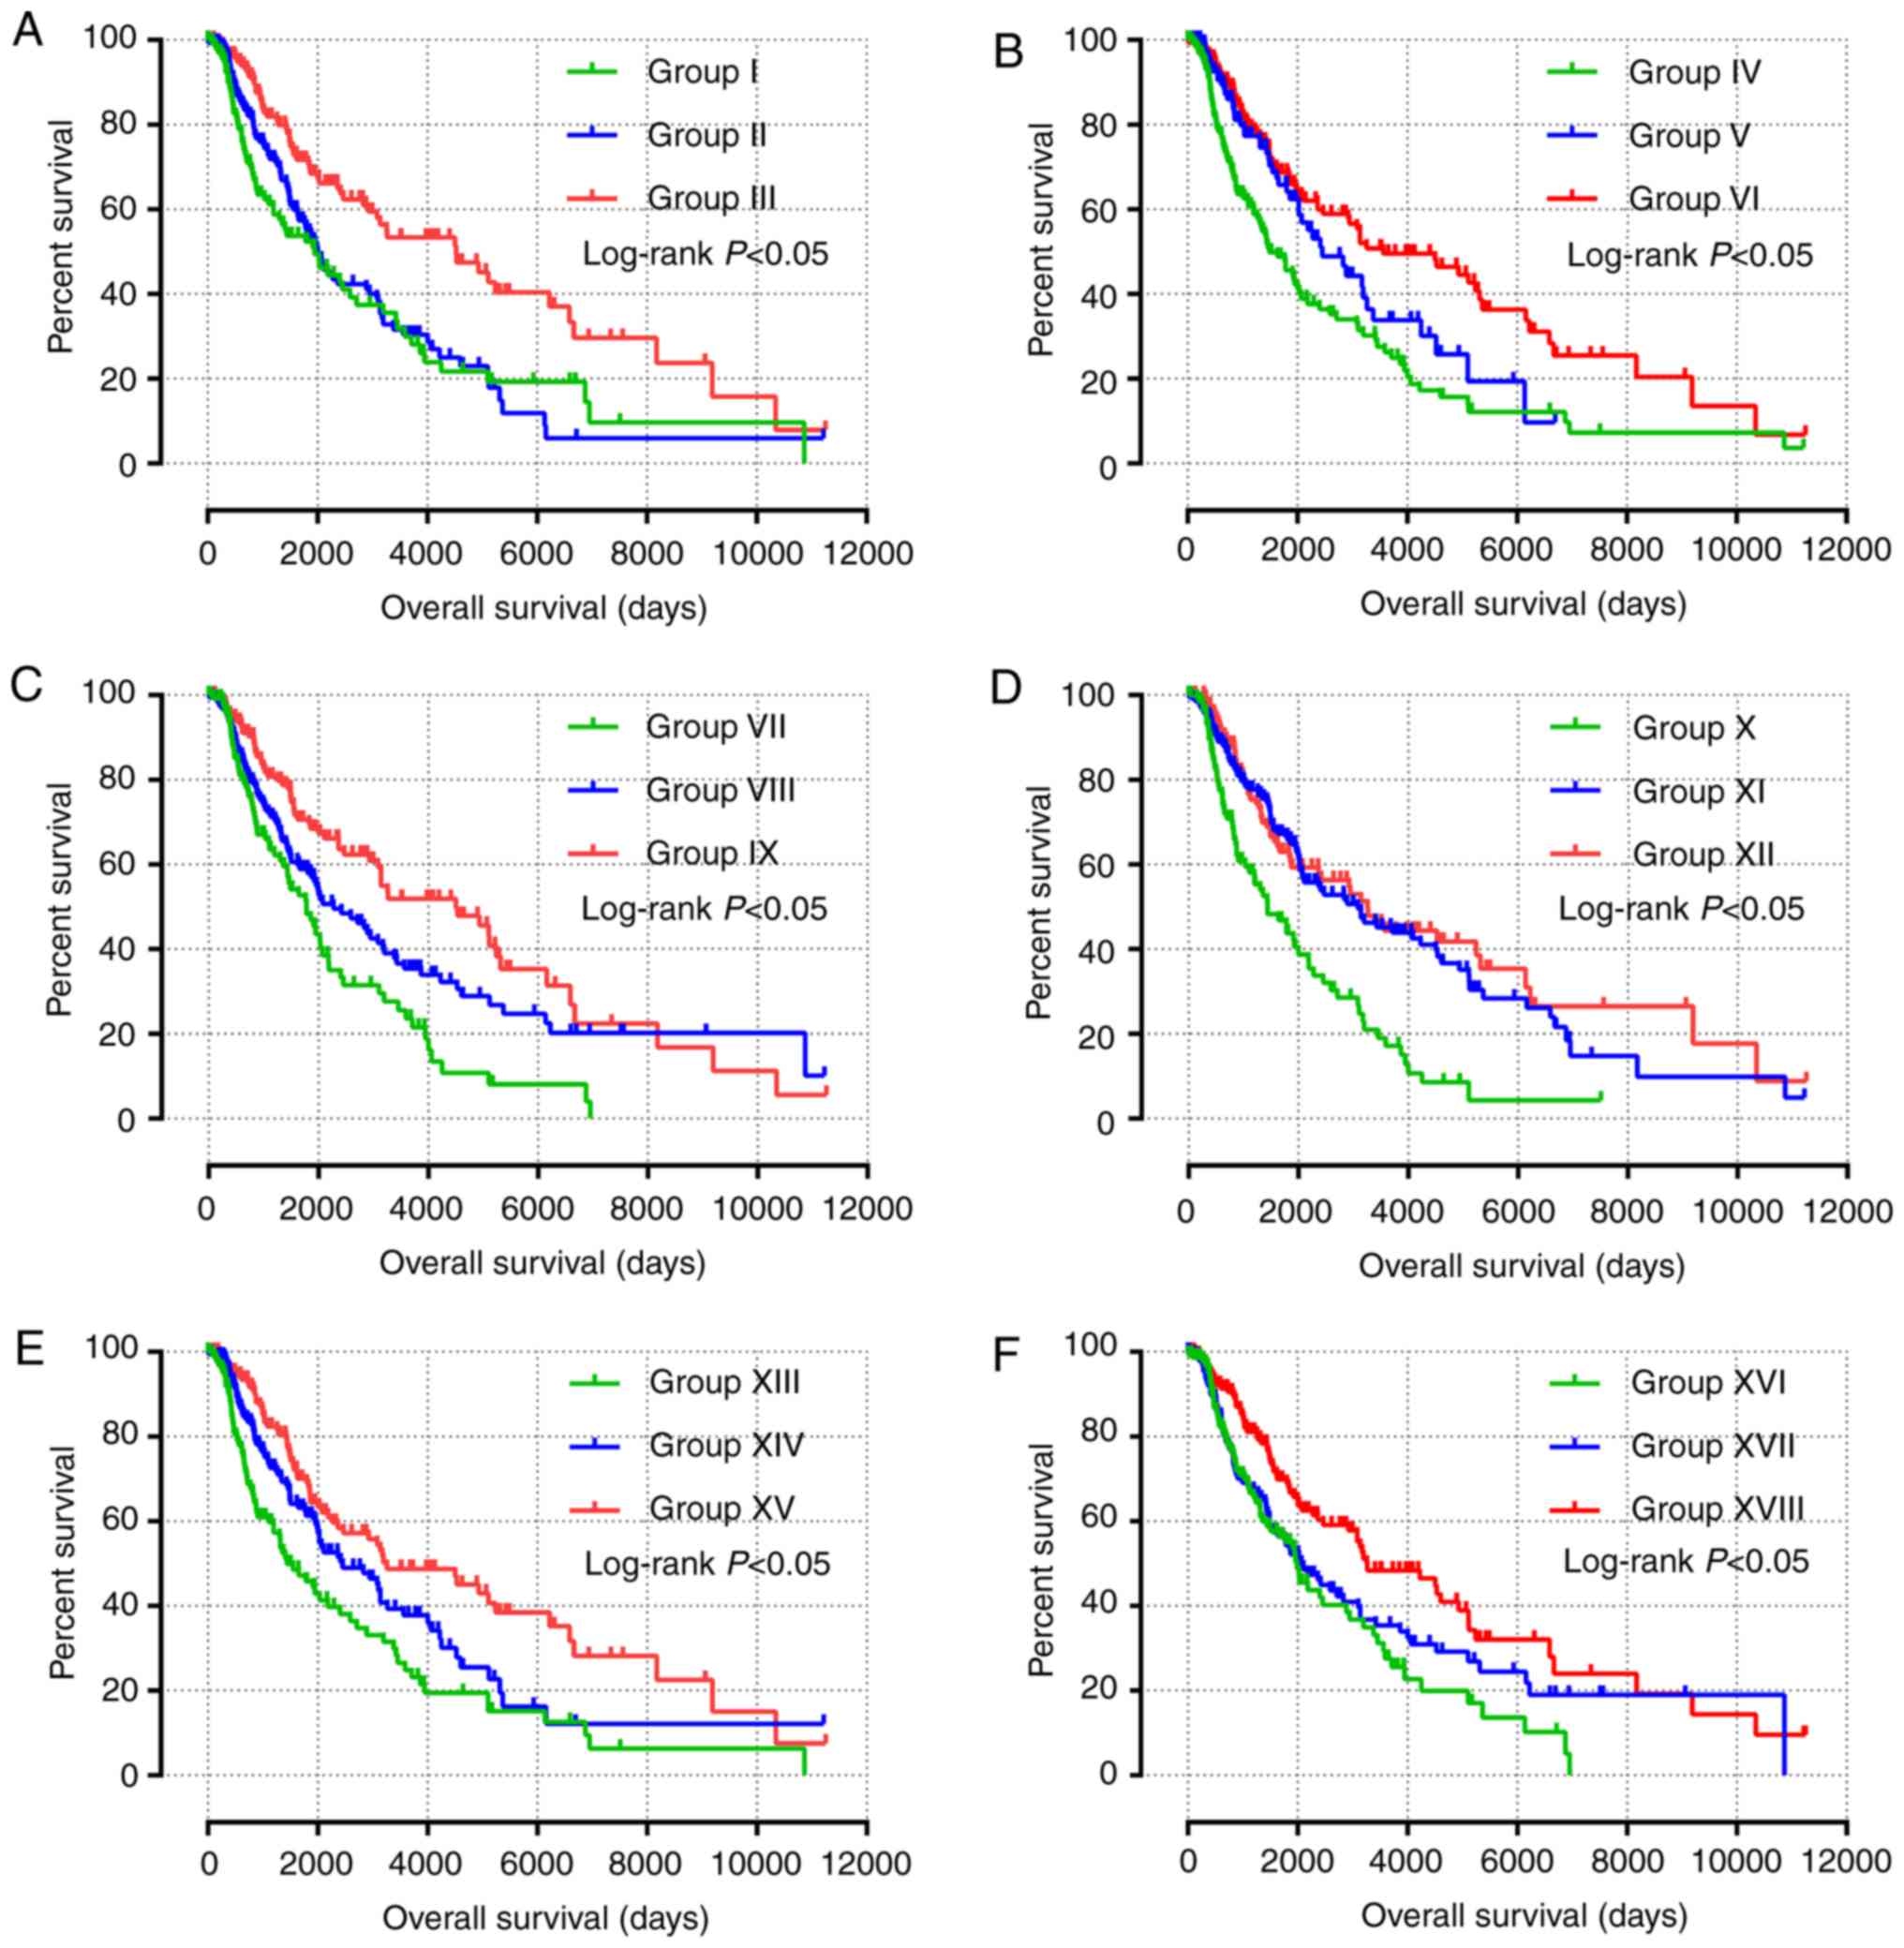
Predictive nomogram and joint effects
analysis
Independent factors, including age, sex, tumor stage
and mRNA expression, were integrated into the prognostic nomogram
to predict the clinical outcomes of patients with SKCM (Fig. 5A). Age, tumor stage, and JAK1,
STAT1, STAT4, STAT5B and STAT6 expression levels
exhibited major contributions as prognostic signatures in the risk
scores (range, 0–100).
All survival related genes, including STAT1,
STAT3, STAT4, STAT5B and STAT6, were selected and
grouped to perform joint effects analysis. The grouping information
of joint effects analysis is presented in Tables III–VI. The group number with simple Arabic
numerals represented all gene selected groups (Table III); Arab numerals with brackets
are 4 selected genes (Table IV);
Lowercase Roman numerals are 3 selected genes (Table V); Capitalized Roman numerals are 2
selected genes (Table VI). The
combination of genes with favorable prognosis had a better effect
on the OS (univariate survival analysis; P<0.05; Table VII and Figs. 5B-G, 6A-J and 7A-J).
| Table III.Grouping information for joint
effects analysis of all STAT genes. |
Table III.
Grouping information for joint
effects analysis of all STAT genes.
|
| Composition |
|---|
|
|
|
|---|
| Group | STAT1 | STAT3 | STAT4 | STAT5B | STAT6 |
|---|
| 1 | Low | Low | Low | Low | High |
| 2 | High | Low | Low | Low | High |
|
| Low | High | Low | Low | High |
|
| Low | Low | High | Low | High |
|
| Low | Low | Low | High | High |
|
| Low | Low | Low | Low | Low |
| 3 | High | High | Low | Low | High |
|
| High | Low | High | Low | High |
|
| High | Low | Low | High | High |
|
| High | Low | Low | Low | Low |
|
| Low | High | High | Low | High |
|
| Low | High | Low | High | High |
|
| Low | High | Low | Low | Low |
|
| Low | Low | High | High | High |
|
| Low | Low | High | Low | Low |
|
| Low | Low | Low | High | Low |
| 4 | High | High | High | Low | High |
|
| High | High | Low | High | High |
|
| High | Low | High | High | High |
|
| Low | High | High | High | High |
|
| High | High | Low | Low | Low |
|
| High | Low | High | Low | Low |
|
| Low | High | High | Low | Low |
|
| High | Low | Low | High | Low |
|
| Low | High | Low | High | Low |
|
| Low | Low | High | High | Low |
| 5 | High | High | High | High | High |
|
| High | High | High | Low | Low |
|
| High | High | Low | High | Low |
|
| High | Low | High | High | Low |
|
| Low | High | High | High | Low |
| 6 | High | High | High | High | Low |
| Table VI.Grouping information for joint
effects analysis of two selected STAT genes |
Table VI.
Grouping information for joint
effects analysis of two selected STAT genes
|
| Composition |
|---|
|
|
|
|---|
| Group | STAT1 | STAT3 | STAT4 | STAT5B | STAT6 |
|---|
| I | Low | Low | – | – | – |
| II | High | Low | – | – | – |
|
| Low | High | – | – | – |
| III | High | High | – | – | – |
| IV | Low | – | Low | – | – |
| V | High | – | Low | – | – |
|
| Low | – | High | – | – |
| VI | High | – | High | – | – |
| VII | Low | – | – | Low | – |
| VIII | Low | – | – | High | – |
|
| High | – | – | Low | – |
| IX | High | – | – | High | – |
| X | Low | – | – | – | High |
| XI | Low | – | – | – | Low |
|
| High | – | – | – | High |
| XII | High | – | – | – | Low |
| XIII | – | Low | Low | – | – |
| XIV | – | High | Low | – | – |
|
| – | Low | High | – | – |
| XV | – | High | High | – | – |
| XVI | – | Low | – | Low | – |
| XVII | – | Low | – | High | – |
|
| – | High | – | Low | – |
| XVIII | – | High | – | High | – |
| XIX | – | Low | – | – | High |
| XX | – | Low | – | – | Low |
|
| – | High | – | – | High |
| XXI | – | High | – | – | Low |
| XXII | – | – | Low | Low | – |
| XXIII | – | – | Low | High | – |
|
| – | – | High | Low | – |
| XXIV | – | – | High | High | – |
| XXV | – | – | Low | – | High |
| XXVI | – | – | Low | – | Low |
|
| – | – | High | – | High |
| XXVII | – | – | High | – | Low |
| XXVIII | – | – | – | Low | High |
| XXIV | – | – | – | Low | Low |
|
| – | – | – | High | High |
| XXX | – | – | – | High | Low |
| Table IV.Grouping information for joint
effects analysis of four selected STAT genes. |
Table IV.
Grouping information for joint
effects analysis of four selected STAT genes.
|
| Composition |
|---|
|
|
|
|---|
| Group | STAT1 | STAT3 | STAT4 | STAT5B | STAT6 |
|---|
| (1) | Low | Low | Low | Low | – |
| (2) | High | Low | Low | Low | – |
|
| Low | High | Low | Low | – |
|
| Low | Low | High | Low | – |
|
| Low | Low | Low | High | – |
|
| High | High | Low | Low | – |
|
| High | Low | High | Low | – |
|
| High | Low | Low | High | – |
|
| Low | High | High | Low | – |
|
| Low | High | Low | High | – |
|
| Low | Low | High | High | – |
|
| High | High | High | Low | – |
|
| High | High | Low | High | – |
|
| High | Low | High | High | – |
|
| Low | High | High | High | – |
| (3) | High | High | High | High | – |
| (4) | Low | Low | Low | – | High |
| (5) | High | Low | Low | – | High |
|
| Low | High | Low | – | High |
|
| Low | Low | High | – | High |
|
| Low | Low | Low | – | Low |
|
| High | High | Low | – | High |
|
| High | Low | High | – | High |
|
| High | Low | Low | – | Low |
|
| Low | High | High | – | High |
|
| Low | High | Low | – | Low |
|
| Low | Low | High | – | Low |
|
| High | High | High | – | High |
|
| High | High | Low | – | Low |
|
| High | Low | High | – | Low |
|
| Low | High | High | – | Low |
| (6) | High | High | High | – | Low |
| (7) | Low | Low | – | Low | High |
| (8) | High | Low | – | Low | High |
|
| Low | High | – | Low | High |
|
| Low | Low | – | High | High |
|
| Low | Low | – | Low | Low |
|
| High | High | – | Low | High |
|
| High | Low | – | High | High |
|
| High | Low | – | Low | Low |
|
| Low | High | – | High | High |
|
| Low | High | – | Low | Low |
|
| Low | Low | – | High | Low |
|
| High | High | – | High | High |
|
| High | High | – | Low | Low |
|
| High | Low | – | High | Low |
|
| Low | High | – | High | Low |
| (9) | High | High | – | High | Low |
| (10) | Low | – | Low | Low | High |
| (11) | High | – | Low | Low | High |
|
| Low | – | High | Low | High |
|
| Low | – | Low | High | High |
|
| Low | – | Low | Low | Low |
|
| High | – | High | Low | High |
|
| High | – | Low | High | High |
|
| High | – | Low | Low | Low |
|
| Low | – | High | High | High |
|
| Low | – | High | Low | Low |
|
| Low | – | Low | High | Low |
|
| High | – | High | High | High |
|
| High | – | High | Low | Low |
|
| High | – | Low | High | Low |
|
| Low | – | High | High | Low |
| (12) | High | – | High | High | Low |
| (13) | – | Low | Low | Low | High |
| (14) | – | High | Low | Low | High |
|
| – | Low | High | Low | High |
|
| – | Low | Low | High | High |
|
| – | Low | Low | Low | Low |
|
| – | High | High | Low | High |
|
| – | High | Low | High | High |
|
| – | High | Low | Low | Low |
|
| – | Low | High | High | High |
|
| – | Low | High | Low | Low |
|
| – | Low | Low | High | Low |
|
| – | High | High | High | High |
|
| – | High | High | Low | Low |
|
| – | High | Low | High | Low |
|
| – | Low | High | High | Low |
| (15) | – | High | High | High | Low |
| Table V.Grouping information for joint
effects analysis of three selected STAT genes. |
Table V.
Grouping information for joint
effects analysis of three selected STAT genes.
|
| Composition |
|---|
|
|
|
|---|
| Group | STAT1 | STAT3 | STAT4 | STAT5B | STAT6 |
|---|
| i | Low | Low | Low | – | – |
| ii | High | Low | Low | – | – |
|
| Low | High | Low | – | – |
|
| Low | Low | High | – | – |
|
| High | High | Low | – | – |
|
| High | Low | High | – | – |
|
| Low | High | High | – | – |
| iii | High | High | High | – | – |
| iv | Low | Low | – | Low | – |
| v | Low | Low | – | Low | – |
|
| High | High | – | Low | – |
|
| High | High | – | High | – |
|
| Low | High | – | Low | – |
|
| Low | Low | – | High | – |
|
| High | High | – | High | – |
| vi | High | High | – | High | – |
| vii | Low | Low | – | – | High |
| viii | High | Low | – | – | High |
|
| Low | High | – | – | High |
|
| Low | Low | – | – | Low |
|
| High | High | – | – | High |
|
| High | Low | – | – | Low |
|
| Low | High | – | – | Low |
| ix | High | High | – | – | Low |
| x | Low | – | Low | Low | – |
| xi | High | – | Low | Low | – |
|
| Low | – | High | Low | – |
|
| Low | – | Low | High | – |
|
| High | – | High | Low | – |
|
| High | – | Low | High | – |
|
| Low | – | High | High | – |
| xii | High | – | High | High | – |
| xiii | Low | – | Low | – | High |
| xiv | High | – | Low | – | High |
|
| Low | – | High | – | High |
|
| Low | – | Low | – | Low |
|
| High | – | High | – | High |
|
| High | – | Low | – | Low |
|
| Low | – | High | – | Low |
| xv | High | – | High | – | Low |
| xvi | Low | – | – | Low | High |
| xvii | High | – | – | Low | High |
|
| Low | – | – | High | High |
|
| Low | – | – | Low | Low |
|
| High | – | – | High | High |
|
| High | – | – | Low | Low |
|
| Low | – | – | High | Low |
| xviii | High | – | – | High | Low |
| xiv | – | Low | Low | Low | – |
| xx | – | High | Low | Low | – |
|
| – | Low | High | High | – |
|
| – | Low | Low | Low | – |
|
| – | High | High | High | – |
|
| – | High | Low | Low | – |
|
| – | Low | High | High | – |
| xxi | – | High | High | High | – |
| xxii | – | Low | Low | – | High |
| xxiii | – | High | Low | – | High |
|
| – | Low | High | – | High |
|
| – | Low | Low | – | Low |
|
| – | High | High | – | High |
|
| – | High | Low | – | Low |
|
| – | Low | High | – | Low |
| xxiv | – | High | High | – | Low |
| xxv | – | Low | – | Low | High |
| xxvi | – | High | – | High | High |
|
| – | Low | – | Low | High |
|
| – | Low | – | Low | Low |
|
| – | High | – | High | High |
|
| – | High | – | High | Low |
|
| – | Low | – | Low | Low |
| xxvii | – | High | – | High | Low |
| xxviii | – | – | Low | Low | High |
| xxix | – | – | High | High | High |
|
| – | – | Low | Low | High |
|
| – | – | Low | Low | Low |
|
| – | – | High | High | High |
|
| – | – | High | High | Low |
|
| – | – | Low | Low | Low |
| xxx | – | – | High | High | Low |
| Table VII.Joint effects analysis of the
prognostic value of combinations of gene expression in skin
cutaneous melanoma. |
Table VII.
Joint effects analysis of the
prognostic value of combinations of gene expression in skin
cutaneous melanoma.
| Group | No. of genes | Patients
(n=458) | No. of events
(%) | MST (days) | Log-rank
P-value | HR (95% CI) |
|---|
| 1 | 5 | 38 | 24 (63.1) | 1,301 | Ref. | Ref. |
| 2 | 5 | 87 | 46 (52.9) | 2,030 | 0.073 | 0.636
(0.487–1.043) |
| 3 | 5 | 106 | 53 (50.0) | 1,766 | 0.094 | 0.661
(0.407–1.073) |
| 4 | 5 | 98 | 37 (37.8) | 3,196 |
<0.001a | 0.352
(0.210–0.590) |
| 5 | 5 | 93 | 42 (45.2) | 4,533 |
<0.001a | 0.322
(0.194–0.535) |
| 6 | 5 | 36 | 17 (47.2) | 3,259 |
<0.001a | 0.280
(0.149–0.528) |
| (1) | 4 | 71 | 42 (59.2) | 1,441 | Ref. | Ref. |
| (2) | 4 | 301 | 140 (46.4) | 2,192 | 0.014a | 0.648
(0.458–0.915) |
| (3) | 4 | 86 | 37 (43.0) | 4,930 |
<0.001a | 0.376
(0.241–0588) |
| (4) | 4 | 61 | 37 (60.7) | 1,197 | Ref. | Ref. |
| (5) | 4 | 351 | 160 (45.6) | 2,829 |
<0.001a | 0.515
(0.360–0.738) |
| (6) | 4 | 46 | 22 (47.8) | 5,237 |
<0.001a | 0.312
(0.182–0.535) |
| (7) | 4 | 47 | 27 (57.4) | 1,354 | Ref. | Ref. |
| (8) | 4 | 365 | 171 (46.8) | 2,470 | 0.002a | 0.530
(0.352–0.798) |
| (9) | 4 | 46 | 21 (45.7) | 3,266 |
<0.001a | 0.370
(0.189–0.601) |
| (10) | 4 | 56 | 34 (60.7) | 1,354 | Ref. | Ref. |
| (11) | 4 | 351 | 160 (45.6) | 2,588 |
<0.001a | 0.484
(0.333–0.704) |
| (12) | 4 | 51 | 25 (49.0) | 3,259 |
<0.001a | 0.338
(0.200–0.573) |
| (13) | 4 | 42 | 26 (61.9) | 1,354 | Ref. | Ref. |
| (14) | 4 | 372 | 171 (46.0) | 2,588 | 0.001a | 0.498
(0.328–0.755) |
| (15) | 4 | 44 | 22 (50.0) | 2,927 |
<0.001a | 0.344
(0.193–0.612) |
| i | 3 | 130 | 75 (57.7) | 1,441 | Ref. | Ref. |
| ii | 3 | 250 | 112 (44.8) | 2,273 | 0.022a | 0.710
(0.529–0.952) |
| iii | 3 | 103 | 46 (44.7) | 4,930 |
<0.001a | 0.418
(0.289–0.605) |
| iv | 3 | 91 | 47 (51.6) | 1,949 | Ref. | Ref. |
| v | 3 | 267 | 131 (49.1) | 2,071 | 0.086 | 0.746
(0.534–1.042) |
| vi | 3 | 125 | 51 (40.8) | 4,930 |
<0.001a | 0.415
(0.278–0.620) |
| vii | 3 | 78 | 44 (56.4) | 1,197 | Ref. | Ref. |
| viii | 3 | 312 | 146 (46.8) | 2,470 |
<0.001a | 0.530
(0.377–0.744) |
| ix | 3 | 93 | 39 (41.9) | 4,526 |
<0.001a | 0.328
(0.212–0.508) |
| x | 3 | 103 | 61 (59.2) | 1,487 | Ref. | Ref. |
| xi | 3 | 245 | 127 (51.8) | 1,864 | 0.127 | 0.788
(0.580–1.070) |
| xii | 3 | 135 | 60 (44.4) | 4,533 |
<0.001a | 0.388
(0.270–0.557) |
| xiii | 3 | 95 | 55 (57.9) | 1,354 | Ref. | Ref. |
| xiv | 3 | 276 | 152 (551) | 2,889 |
<0.001a | 0.480
(0.348–0.661) |
| xv | 3 | 112 | 50 (44.6) | 3,259 |
<0.001a | 0.367
(0.249–0.542) |
| xvi | 3 | 69 | 40 (58.0) | 1,429 | Ref. | Ref. |
| xvii | 3 | 324 | 148 (45.7) | 2,588 |
<0.001a | 0.502
(0.352–0.715) |
| xviii | 3 | 90 | 40 (44.4) | 3,266 |
<0.001a | 0.358
(0.229–0.559) |
| xix | 3 | 87 | 51 (58.6) | 1,655 | Ref. | Ref. |
| xx | 3 | 268 | 121 (45.1) | 2,367 | 0.012a | 0.658
(0.474–0.913) |
| xxi | 3 | 128 | 57 (44.5) | 4,507 |
<0.001a | 0.419
(0.286–0.613) |
| xxii | 3 | 70 | 43 (61.4) | 1,301 | Ref. | Ref. |
| xxiii | 3 | 328 | 148 (45.1) | 2,948 |
<0.001a | 0.530
(0.377–0.745) |
| xxiv | 3 | 85 | 38 (44.7) | 3,259 |
<0.001a | 0.348
(0.223–0.542) |
| xxv | 3 | 66 | 35 (53.0) | 1,910 | Ref. | Ref. |
| xxvi | 3 | 323 | 150 (46.4) | 2,470 | 0.043a | 0.683
(0.472–0.988) |
| xxvii | 3 | 94 | 44 (46.8) | 3,266 | 0.001a | 0.462
(0.294–0.724) |
| xxviii | 3 | 70 | 40 (57.1) | 1,486 | Ref. | Ref. |
| xxix | 3 | 323 | 149 (46.1) | 2,470 | 0.001a | 0.536
(0.376–0.764) |
| xxx | 3 | 90 | 40 (44.4) | 5,237 |
<0.001a | 0.349
(0.223–0.545) |
| I | 2 | 139 | 70 (50.4) | 1,949 | Ref. | Ref. |
| II | 2 | 180 | 92 (51.1) | 2,005 | 0.519 | 0.902
(0.660–1.233) |
| III | 2 | 164 | 67 (40.9) | 4,526 |
<0.001a | 0.485
(0.346–0.678) |
| IV | 2 | 168 | 96 (57.1) | 1,487 | Ref. | Ref. |
| V | 2 | 122 | 48 (39.3) | 2,454 | 0.017a | 0.655
(0.462–0.928) |
| VI | 2 | 193 | 85 (44.0) | 3,564 |
<0.001a | 0.477
(0.356–0.641) |
| VII | 2 | 133 | 70 (52.6) | 1,780 | Ref. | Ref. |
| VIII | 2 | 192 | 90 (46.9) | 2,273 | 0.008a | 0.654
(0.477–0.897) |
| IX | 2 | 133 | 59 (44.4) | 4,507 |
<0.001a | 0.449
(0.316–0.638) |
| X | 2 | 125 | 70 (56.0) | 1,438 | Ref. | Ref. |
| XI | 2 | 208 | 94 (45.2) | 3,080 |
<0.001a | 0.483
(0.353–0.662) |
| XII | 2 | 125 | 55 (44.0) | 3,259 |
<0.001a | 0.435
(0.304–0.623) |
| XIII | 2 | 130 | 75 (57.7) | 1,441 | Ref. | Ref. |
| XIV | 2 | 198 | 84 (42.4) | 2,545 | 0.011a | 0.677
(0.488–0.912) |
| XV | 2 | 130 | 60 (46.2) | 3,259 |
<0.001a | 0.466
(0.332–0.656) |
| XVI | 2 | 148 | 72 (48.6) | 1,992 | Ref. | Ref. |
| XVII | 2 | 162 | 80 (49.4) | 2,071 | 0.297 | 0.843
(0.612–1.162) |
| XVIII | 2 | 148 | 67 (45.3) | 3,259 | 0.001a | 0.564
(0.403–0.791) |
| XIX | 2 | 111 | 61 (54.9) | 1,910 | Ref. | Ref. |
| XX | 2 | 236 | 106 (44.9) | 3,080 | 0.008a | 0.652
(0.476–0.894) |
| XXI | 2 | 111 | 52 (46.8) | 3,259 |
<0.001a | 0.508
(0.349–0.739) |
| XXII | 2 | 141 | 77 (54.6) | 1,780 | Ref. | Ref. |
| XXIII | 2 | 176 | 78 (44.3) | 2,192 | 0.015a | 0.674
(0.490–0.926) |
| XXIV | 2 | 141 | 64 (45.4) | 3,259 |
<0.001a | 0.466
(0.333–0.653) |
| XXV | 2 | 118 | 65 (55.1) | 1,544 | Ref. | Ref. |
| XXVI | 2 | 222 | 106 (47.4) | 3,136 |
<0.001a | 0.548
(0.400–0.750) |
| XXVII | 2 | 118 | 48 (40.7) | 3,259 |
<0.001a | 0.399
(0.273–0.583) |
| XXVIII | 2 | 105 | 56 (53.3) | 1,780 | Ref. | Ref. |
| XXIX | 2 | 248 | 114 (46.0) | 2,470 | 0.013a | 0.667
(0.484–0.920) |
| XXX | 2 | 105 | 49 (46.7) | 3,424 |
<0.001a | 0.466
(0.314–0.692) |
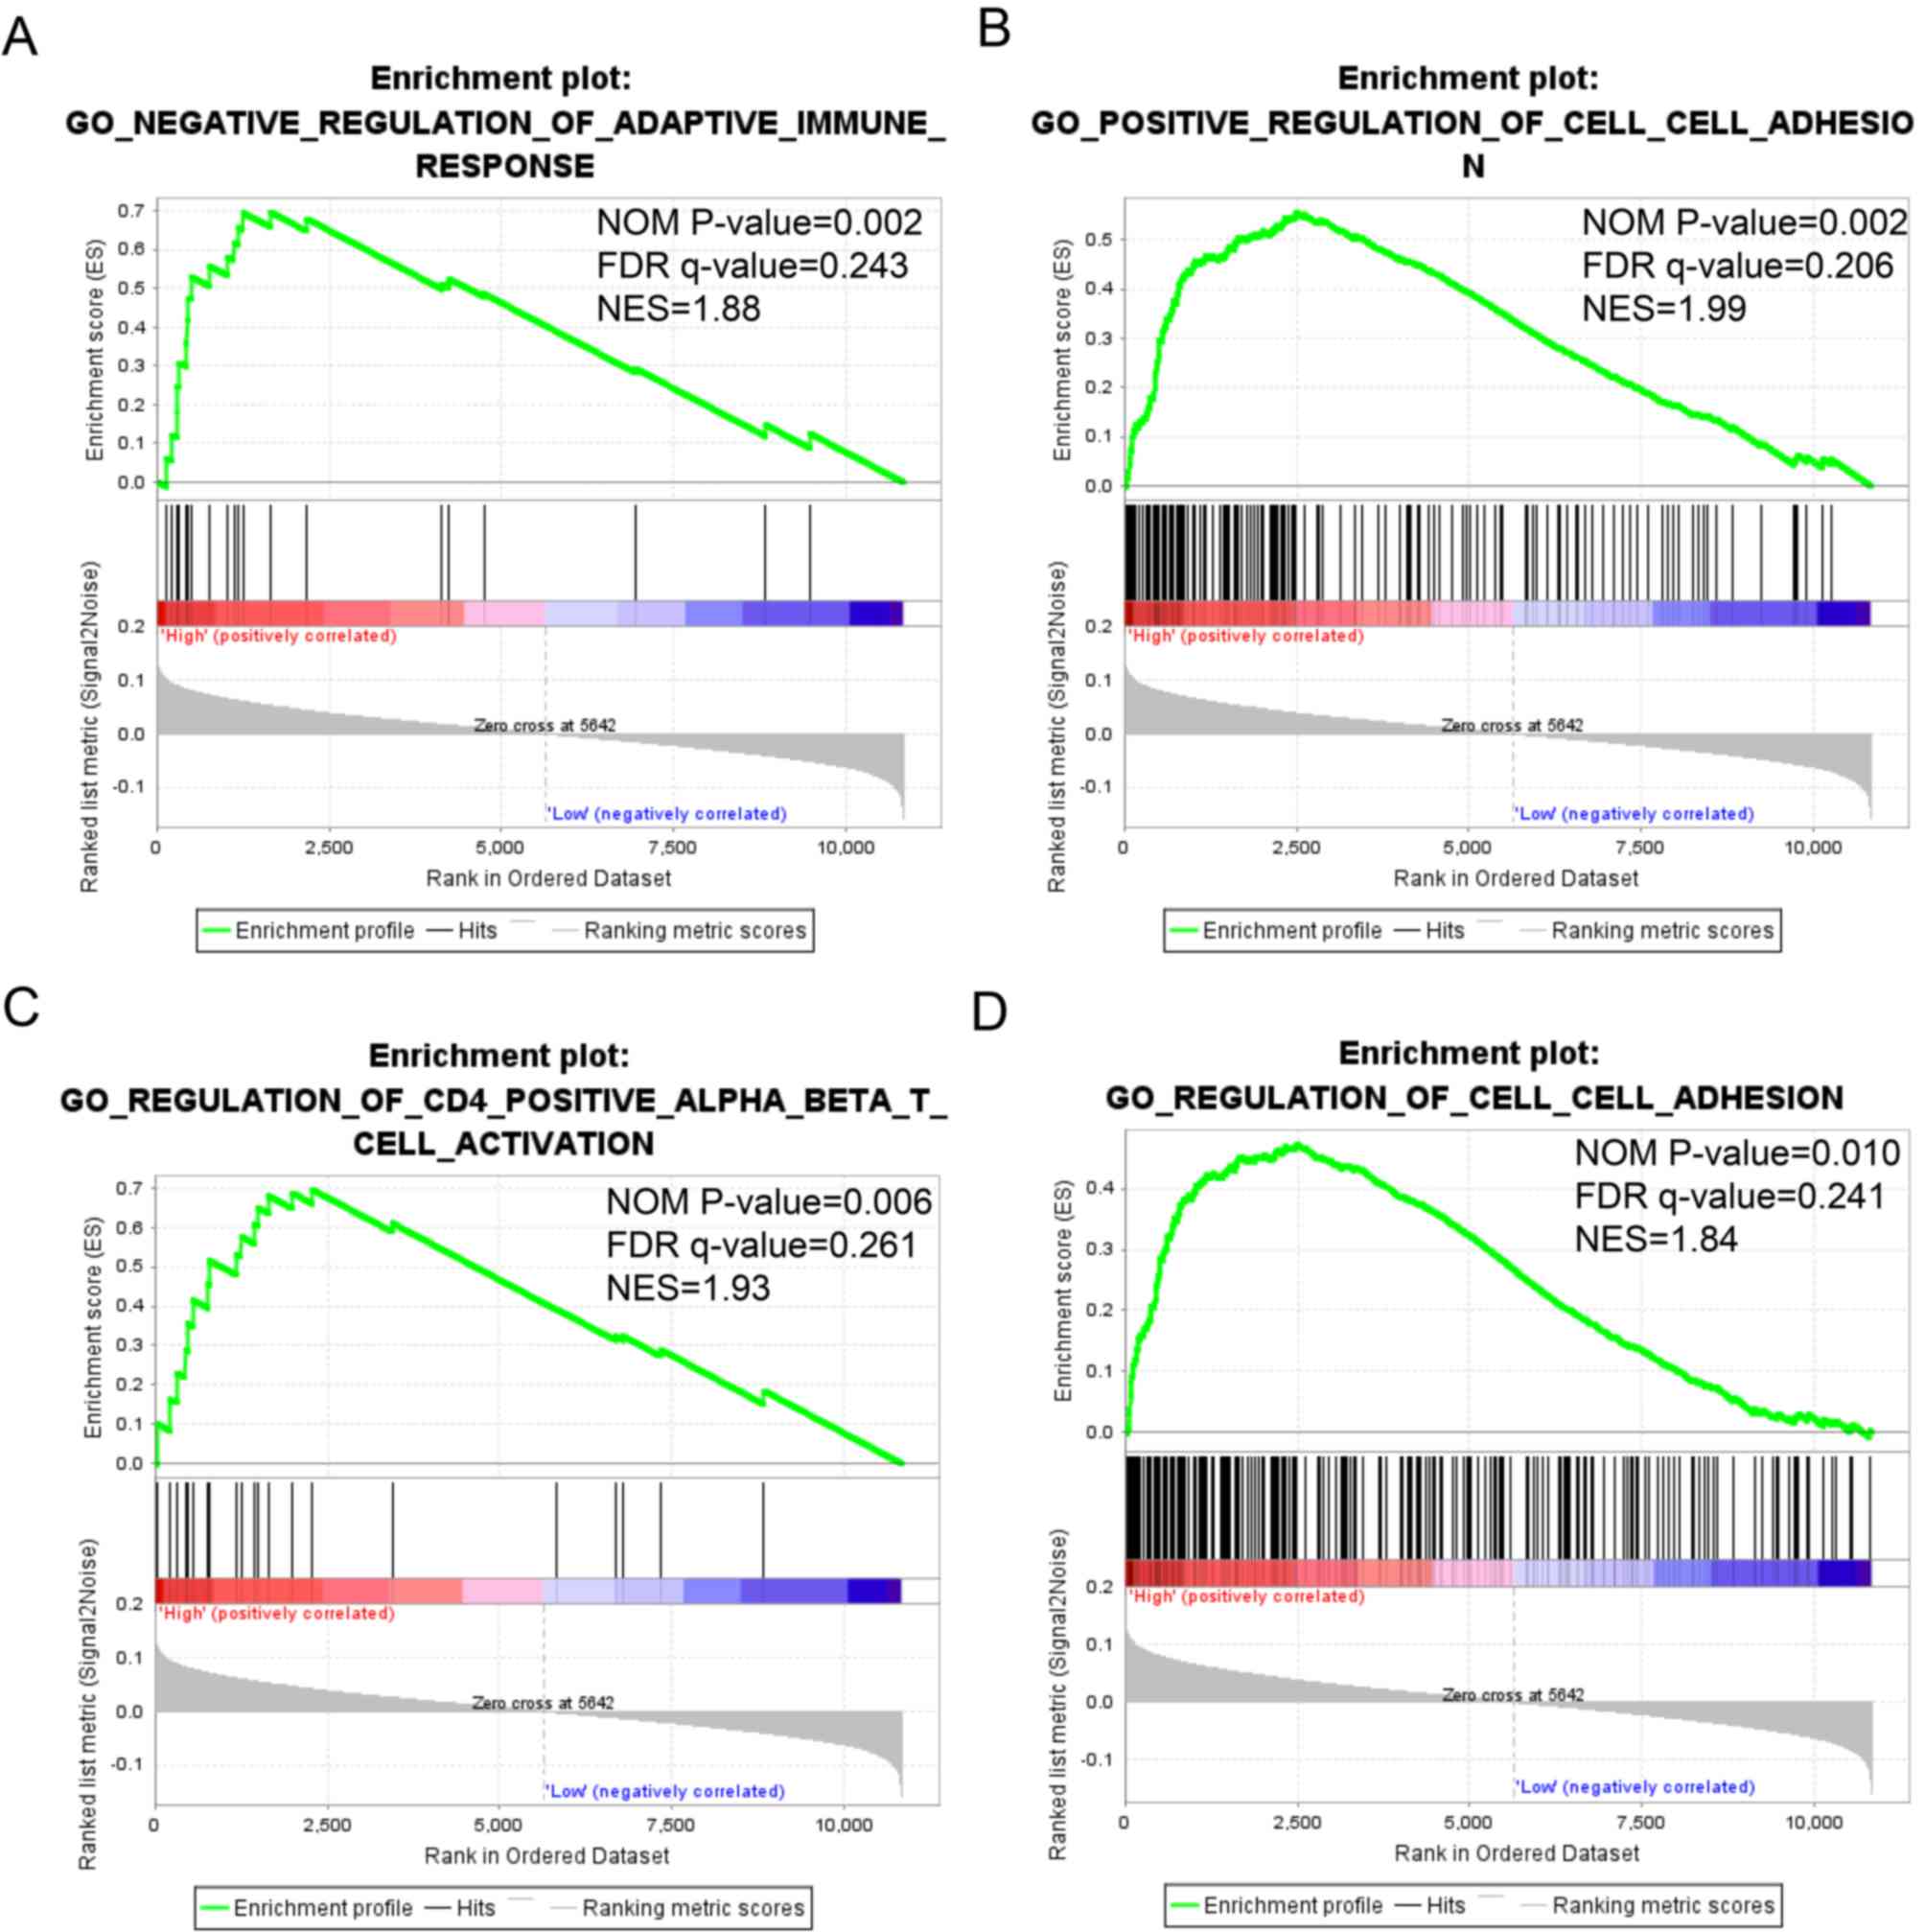
GSEA
The detailed GSEA results, including KEGG, GO and
oncogenic signatures, are shown in Tables SI, SII and SIII, respectively, and in Fig. 8. High expression of STAT1 was
significantly associated with immune response (normalized P=0.002;
FDR=0.243; Fig. 8A), cell adhesion
(normalized P=0.002; FDR=0.206; Fig.
8B; normalized P=0.010; FDR=0.241; Fig. 8D) and WNT protein binging (normalized
P=0.006; FDR=0.261; Fig. 8C). By
contrast, low expression of STAT4 was associated with WNT
protein binding (normalized P=0.001; FDR=−0.234; Fig. 8E), whereas high expression of
STAT5B was associated with gene silencing (normalized
P=0.002; FDR=0.249; Fig. 8F).
Discussion
In the Surveillance, Epidemiology, and End Results
Program database, the 5-year relative survival is 98% for prostate
cancer, 89.9% for breast cancer and 19.4% for lung cancer (3,4). For
melanoma, a 91.8% 5-year relative survival rate appears
satisfactory; however, the 5-year relative survival for patients
with tumor stage IV is only 3% (22,25).
The JAK-STAT signaling pathway serves a crucial role
in functions such as cell proliferation, differentiation, migration
and apoptosis, cell survival in hematopoiesis, immune cell
development, stem cell maintenance and organismal growth processes
(26–28). Dysfunction in the JAK-STAT signaling
pathway is associated with diseases such as cancer and immune
disorders (6,27). In the JAK-STAT signaling pathway, the
JAK family comprises JAK1, JAK2, JAK3 and
TYK2, and the STAT family comprises STAT1, STAT2,
STAT3, STAT4, STAT5A, STAT5B and STAT6 (6,29). A
number of diseases are associated with the expression levels of
genes of the JAK-STAT signaling pathway. A previous study has
demonstrated that increased expression of STAT3 or
STAT1, but not of both, was present in melanoma compared
with that in benign nevi or skin melanocytes (30). In addition, active STAT3 was
present in melanoma (30). By
contrast, overexpression of microRNA (miR)-214 in a lung cancer
cell line reduced the expression of JAK1, which inhibited
cell proliferation and colony formation, and suppressed cell
migration and invasion (31). In
papillary thyroid cancer, downregulation of JAK1 by
miR-520a-3p inactivated the JAK-STAT signaling pathway (32).
However, studies that explored the association
between the prognosis of melanoma and the JAK-STAT signaling
pathway are limited. In the present study, the expression of
JAK and STAT family genes in melanoma was
investigated based on TCGA data. The observation that JAK-STAT gene
expression is associated with the MAPK signaling pathway is in
agreement with a previous study, which demonstrated that the
JAK-STAT signaling pathway is integrated with the MAPK signaling
pathway (33–35) and is associated with melanoma
(36). Expression of JAK2, JAK3,
TYK2, STAT2 and STAT5B was not observed after
normalizing mRNA expression in the present study, suggesting that
these genes were expressed at a low level. High expression of
STAT1, STAT3, STAT4 and STAT5B, as well as low
expression of STAT6, were associated with a favorable
prognosis of patients with SKCM. These results are consistent with
other studies, in which high expression of STAT1 was
associated with favorable prognosis in high-grade serous ovarian
cancer (HGSC) (37), colorectal
cancer (38) and esophageal squamous
cell carcinoma (39). In addition,
high expression of STAT1 in HGSC was significantly
associated with the recruitment of intraepithelial CD8+
T cells, which enhanced the prognostic and predictive value of
intratumoral CD8+ T cells in HGSC (40), potentially due to tumors with high
STAT1 mRNA expression exhibiting elevated expression of
genes specific for tumor-associated macrophages and
immunosuppressive T lymphocytes (7).
The results of the enrichment analysis in the present study also
revealed that STAT1 was associated with the immune response,
which suggested that STAT1 may accelerate the immune cell
response to cancer (41). However,
high STAT1 expression was associated with poor prognosis in
glioblastoma (42), and breast
(7,8), ovarian, lung, blood and brain (9) cancer.
In contrast to that of STAT1, STAT3
expression is downregulated in malignant pleural mesothelioma
(43); however, the prognostic value
of this association has not been reported. The majority of studies
on STAT3 and cancer prognosis have demonstrated that
phosphorylated STAT3 is associated with a poor outcome in
colorectal cancer (10), multiple
myeloma (44) and urothelial
carcinoma (45). In addition,
STAT4 has been detected in several types of cancer,
including prostate (46), breast
(47), gastric (48) and ovarian (49) cancer. The upregulation of
STAT4 in hepatocellular carcinoma is associated with
favorable prognosis, possibly due to the expression of STAT4
in the immune cells; however, the function and mechanism of
STAT4 in non-immune cells remains unknown (50). High expression of STAT5B in
astrocytoma is associated with poor prognosis (51), whereas high expression of
STAT6 is associated with poor prognosis in colon cancer
(52).
The potential effects of these associations require
further exploration. For instance, colorectal carcinoma cell lines
exhibiting low STAT1 and high STAT3 expression levels
are associated with enhanced tumor growth in xenografts; by
contrast, xenograft cell lines with high STAT1 and low
STAT3 levels grew slowly (53). Thus, gene interactions may influence
the cancer outcome. The different expression level of these two
genes in different types of cancer may serve different roles. Joint
effects analysis in the present study suggested that any
combination of the tested markers may have a higher prognostic
value compared with that of any individual biomarker.
The STAT gene family affects cell differentiation
(54), invasion (55–57),
adhesion (58) and migration
(59), as well as cell cycle
(60–62) and colony formation (39,63)
through the JAK-STAT signaling pathway; these processes are
associated with the occurrence, development and outcome of cancer.
The potential mechanism of how these genes affect prognosis should
be further studied.
The present study investigated the prognostic value
of the key genes in the JAK-STAT signaling pathway; only STAT genes
were demonstrated to affect the prognosis of SKCM. In melanoma
research, no golden standard exists for diagnosis or prognosis that
would serve a similar role as the hairy-related 2 gene in breast
cancer or prostate specific antigen in prostate cancer. Certain
genes may act as biomarkers to predict the prognosis and mechanism
of SKCM, including RAF (Raf proto-oncogene), MEK (MAP/ERK kinase),
MAPK, RAS, myelocytomatosis oncogene and S100 calcium binding
protein (64–69). However, further research is required
to identify a golden standard for predicting melanoma.
There were certain limitations in the present study.
Firstly, only JAK expression data were reported following
normalization; additional mRNA expression data are needed to
further confirm these observations. Secondly, this is an
association study. Further research is needed to explore the
function and mechanism of the genes of the JAK-STAT signaling
pathway identified in the present study in patients with SKCM.
Another limitation of the current study is the limited sample size.
Improved design and larger sample size studies are necessary to
validate these results. Finally, there were no expression standards
to measure whether the gene expression was high or low.
To the best of our knowledge, the present study is
the first to evaluate the association between the expression of
genes of the JAK-STAT signaling pathway and OS in patients with
SKCM, and to identify the joint effects of prognostic values among
the five identified genes. Overall, the results of the present
study provided a novel insight into the function of these genes in
SKCM clinical outcomes, and may be further utilized in the clinic
for predicting the prognosis of SKCM.
In conclusion, the combination of the highly
expressed STAT1, STAT3, STAT4 and STAT5B genes, and
the lowly expressed STAT6 gene is associated with a
favorable prognosis in patients with SKCM, and may be used as a
novel biomarker for predicting the prognosis of patients with SKCM.
The expression of the genes in the STAT family may affect
the prognosis of SKCM by accelerating the immune response and
immune cell activity, and by involving the MAPK signaling pathway.
Further studies are required to validate these findings.
Supplementary Material
Supporting Data
Supporting Data
Supporting Data
Supporting Data
Acknowledgements
Not applicable.
Funding
The present study was funded by the National Nature
Science Foundation of China (grant no. 81760344).
Availability of data and materials
The datasets generated and/or analyzed during the
current study are available in the TCGA repository, https://portal.gdc.cancer.gov/.
Authors' contributions
XZ and FP conceived and designed the study. QW, HM
and SL processed the data and performed the statistical analysis.
LZ, RH, XW and XL wrote and revised the manuscript and helped to
perform the analysis and interpretation of data. All authors read
and approved the final version of the manuscript.
Ethics approval and consent to
participate
The present study did not involve human or animal
subjects.
Patient consent for publication
Not applicable.
Competing interests
The authors declare that they have no competing
interests.
References
|
1
|
Goldstein BG and Goldstein AO: Diagnosis
and management of malignant melanoma. Am Fam Physician.
63:1359–1368. 2001.PubMed/NCBI
|
|
2
|
Situm M, Buljan M, Kolić M and Vučić M:
Melanoma-clinical, dermatoscopical, and histopathological
morphological characteristics. Acta Dermatovenerol Croat. 22:1–12.
2014.PubMed/NCBI
|
|
3
|
Grimaldi AM, Simeone E and Ascierto PA:
The role of MEK inhibitors in the treatment of metastatic melanoma.
Curr Opin Oncol. 26:196–203. 2014. View Article : Google Scholar : PubMed/NCBI
|
|
4
|
Ferlay J, Soerjomataram I, Dikshit R, Eser
S, Mathers C, Rebelo M, Parkin DM, Forman D and Bray F: Cancer
incidence and mortality worldwide: Sources, methods and major
patterns in GLOBOCAN 2012. Int J Cancer. 136:E359–E386. 2015.
View Article : Google Scholar : PubMed/NCBI
|
|
5
|
Siegel RL, Miller KD and Jemal A: Cancer
statistics, 2019. CA Cancer J Clin. 69:7–34. 2019. View Article : Google Scholar : PubMed/NCBI
|
|
6
|
Aaronson DS and Horvath CM: A road map for
those who don't know JAK-STAT. Science. 296:1653–1655. 2002.
View Article : Google Scholar : PubMed/NCBI
|
|
7
|
Tymoszuk P, Charoentong P, Hackl H, Spilka
R, Müller-Holzner E, Trajanoski Z, Obrist P, Revillion F, Peyrat
JP, Fiegl H and Doppler W: High STAT1 mRNA levels but not its
tyrosine phosphorylation are associated with macrophage
infiltration and bad prognosis in breast cancer. BMC Cancer.
14:2572014. View Article : Google Scholar : PubMed/NCBI
|
|
8
|
Liu Y, Huang J, Li W, Chen Y, Liu X and
Wang J: Meta-analysis of STAT3 and phospho-STAT3 expression and
survival of patients with breast cancer. Oncotarget. 9:13060–13067.
2018.PubMed/NCBI
|
|
9
|
Cui X, Jing X, Yi Q, Long C, Tan B, Li X,
Chen X, Huang Y, Xiang Z, Tian J and Zhu J: Systematic analysis of
gene expression alterations and clinical outcomes of STAT3 in
cancer. Oncotarget. 9:3198–3213. 2018. View Article : Google Scholar : PubMed/NCBI
|
|
10
|
Han C, Sun B, Zhao X, Zhang Y, Gu Q, Liu
F, Zhao N and Wu L: Phosphorylation of STAT3 promotes vasculogenic
mimicry by inducing epithelial-to-mesenchymal transition in
colorectal cancer. Technol Cancer Res Treat. 16:1209–1219. 2017.
View Article : Google Scholar : PubMed/NCBI
|
|
11
|
Kanehisa M, Sato Y, Furumichi M, Morishima
K and Tanabe M: New approach for understanding genome variations in
KEGG. Nucleic Acids Res. 47((D1)): D590–D595. 2019. View Article : Google Scholar : PubMed/NCBI
|
|
12
|
Kanehisa M, Furumichi M, Tanabe M, Sato Y
and Morishima K: KEGG: New perspectives on genomes, pathways,
diseases and drugs. Nucleic Acids Res. 45(D1):D353–D361. 2017.
View Article : Google Scholar
|
|
13
|
Kanehisa M and Goto S: KEGG: Kyoto
encyclopedia of genes and genomes. Nucleic Acids Res. 28:27–30.
2000. View Article : Google Scholar : PubMed/NCBI
|
|
14
|
Huang da W, Sherman BT and Lempicki RA:
Systematic and integrative analysis of large gene lists using DAVID
bioinformatics resources. Nat Protoc. 4:44–57. 2009. View Article : Google Scholar : PubMed/NCBI
|
|
15
|
Huang da W, Sherman BT and Lempicki RA:
Bioinformatics enrichment tools: Paths toward the comprehensive
functional analysis of large gene lists. Nucleic Acids Res.
37:1–13. 2009. View Article : Google Scholar : PubMed/NCBI
|
|
16
|
Mostafavi S, Ray D, Warde-Farley D,
Grouios C and Morris Q: GeneMANIA: A real-time multiple association
network integration algorithm for predicting gene function. Genome
Biol. 9 (Suppl 1):S42008. View Article : Google Scholar : PubMed/NCBI
|
|
17
|
Warde-Farley D, Donaldson SL, Comes O,
Zuberi K, Badrawi R, Chao P, Franz M, Grouios C, Kazi F, Lopes CT,
et al: The GeneMANIA prediction server: Biological network
integration for gene prioritization and predicting gene function.
Nucleic Acids Res. 38:W214–W220. 2010. View Article : Google Scholar : PubMed/NCBI
|
|
18
|
von Mering C, Huynen M, Jaeggi D, Schmidt
S, Bork P and Snel B: STRING: A database of predicted functional
associations between proteins. Nucleic Acids Res. 31:258–261. 2003.
View Article : Google Scholar : PubMed/NCBI
|
|
19
|
Szklarczyk D, Morris JH, Cook H, Kuhn M,
Wyder S, Simonovic M, Santos A, Doncheva NT, Roth A, Bork P, et al:
The STRING database in 2017: Quality-controlled protein-protein
association networks, made broadly accessible. Nucleic Acids Res.
45((D1)): D362–D368. 2017. View Article : Google Scholar : PubMed/NCBI
|
|
20
|
Subramanian A, Tamayo P, Mootha VK,
Mukherjee S, Ebert BL, Gillette MA, Paulovich A, Pomeroy SL, Golub
TR, Lander ES and Mesirov JP: Gene set enrichment analysis: A
knowledge-based approach for interpreting genome-wide expression
profiles. Proc Natl Acad Sci USA. 102:15545–15550. 2005. View Article : Google Scholar : PubMed/NCBI
|
|
21
|
Liberzon A, Birger C, Thorvaldsdóttir H,
Ghandi M, Mesirov JP and Tamayo P: The molecular signatures
database (MSigDB) hallmark gene set collection. Cell Syst.
1:417–425. 2015. View Article : Google Scholar : PubMed/NCBI
|
|
22
|
Balch CM, Gershenwald JE, Soong SJ,
Thompson JF, Atkins MB, Byrd DR, Buzaid AC, Cochran AJ, Coit DG,
Ding S, et al: Final version of 2009 AJCC melanoma staging and
classification. J Clin Oncol. 27:6199–6206. 2009. View Article : Google Scholar : PubMed/NCBI
|
|
23
|
Benjamini Y, Drai D, Elmer G, Kafkafi N
and Golani I: Controlling the false discovery rate in behavior
genetics research. Behav Brain Res. 125:279–284. 2001. View Article : Google Scholar : PubMed/NCBI
|
|
24
|
Reiner A, Yekutieli D and Benjamini Y:
Identifying differentially expressed genes using false discovery
rate controlling procedures. Bioinformatics. 19:368–375. 2003.
View Article : Google Scholar : PubMed/NCBI
|
|
25
|
Gerami P, Cook RW, Wilkinson J, Russell
MC, Dhillon N, Amaria RN, Gonzalez R, Lyle S, Johnson CE,
Oelschlager KM, et al: Development of a prognostic genetic
signature to predict the metastatic risk associated with cutaneous
melanoma. Clin Cancer Res. 21:175–183. 2015. View Article : Google Scholar : PubMed/NCBI
|
|
26
|
Ghoreschi K, Laurence A and O'Shea JJ:
Janus kinases in immune cell signaling. Immunol Rev. 228:273–287.
2009. View Article : Google Scholar : PubMed/NCBI
|
|
27
|
Harrison DA: The Jak/STAT pathway. Cold
Spring Harb Perspect Biol. 4:a0112052012. View Article : Google Scholar : PubMed/NCBI
|
|
28
|
Zoranovic T, Grmai L and Bach EA:
Regulation of proliferation, cell competition, and cellular growth
by the drosophila JAK-STAT pathway. JAKSTAT.
2:e254082013.PubMed/NCBI
|
|
29
|
Rane SG and Reddy EP: Janus kinases:
Components of multiple signaling pathways. Oncogene. 19:5662–5679.
2000. View Article : Google Scholar : PubMed/NCBI
|
|
30
|
Messina JL, Yu H, Riker AI, Munster PN,
Jove RL and Daud AI: Activated stat-3 in melanoma. Cancer Control.
15:196–201. 2008. View Article : Google Scholar : PubMed/NCBI
|
|
31
|
Chen X, Du J, Jiang R and Li L:
MicroRNA-214 inhibits the proliferation and invasion of lung
carcinoma cells by targeting JAK1. Am J Transl Res. 10:1164–1171.
2018.PubMed/NCBI
|
|
32
|
Bi CL, Zhang YQ, Li B, Guo M and Fu YL:
MicroRNA-520a-3p suppresses epithelial-mesenchymal transition,
invasion, and migration of papillary thyroid carcinoma cells via
the JAK1-mediated JAK/STAT signaling pathway. J Cell Physiol.
234:4054–467. 2018. View Article : Google Scholar : PubMed/NCBI
|
|
33
|
Jain N, Zhang T, Fong SL, Lim CP and Cao
X: Repression of Stat3 activity by activation of mitogen-activated
protein kinase (MAPK). Oncogene. 17:3157–3167. 1998. View Article : Google Scholar : PubMed/NCBI
|
|
34
|
Rawlings JS, Rosler KM and Harrison DA:
The JAK/STAT signaling pathway. J Cell Sci. 117:1281–1283. 2004.
View Article : Google Scholar : PubMed/NCBI
|
|
35
|
Nissan MH, Pratilas CA, Jones AM, Ramirez
R, Won H, Liu C, Tiwari S, Kong L, Hanrahan AJ, Yao Z, et al: Loss
of NF1 in cutaneous melanoma is associated with RAS activation and
MEK dependence. Cancer Res. 74:2340–2350. 2014. View Article : Google Scholar : PubMed/NCBI
|
|
36
|
Davies MA and Samuels Y: Analysis of the
genome to personalize therapy for melanoma. Oncogene. 29:5545–5555.
2010. View Article : Google Scholar : PubMed/NCBI
|
|
37
|
Koti M, Siu A, Clément I, Bidarimath M,
Turashvili G, Edwards A, Rahimi K, Mes-Masson AM and Squire JA: A
distinct pre-existing inflammatory tumour microenvironment is
associated with chemotherapy resistance in high-grade serous
epithelial ovarian cancer. Br J Cancer. 112:1215–1222. 2015.
View Article : Google Scholar : PubMed/NCBI
|
|
38
|
Simpson JA, Al-Attar A, Watson NF,
Scholefield JH, Ilyas M and Durrant LG: Intratumoral T cell
infiltration, MHC class I and STAT1 as biomarkers of good prognosis
in colorectal cancer. Gut. 59:926–933. 2010. View Article : Google Scholar : PubMed/NCBI
|
|
39
|
Zhang Y, Molavi O, Su M and Lai R: The
clinical and biological significance of STAT1 in esophageal
squamous cell carcinoma. BMC Cancer. 14:7912014. View Article : Google Scholar : PubMed/NCBI
|
|
40
|
Au KK, Le Page C, Ren R, Meunier L,
Clément I, Tyrishkin K, Peterson N, Kendall-Dupont J, Childs T,
Francis JA, et al: STAT1-associated intratumoural TH1
immunity predicts chemotherapy resistance in high-grade serous
ovarian cancer. J Pathol Clin Res. 2:259–270. 2016. View Article : Google Scholar : PubMed/NCBI
|
|
41
|
Chan SR, Rickert CG, Vermi W, Sheehan KC,
Arthur C, Allen JA, White JM, Archambault J, Lonardi S, McDevitt
TM, et al: Dysregulated STAT1-SOCS1 control of JAK2 promotes
mammary luminal progenitor cell survival and drives ERalpha(+)
tumorigenesis. Cell Death Differ. 21:234–246. 2014. View Article : Google Scholar : PubMed/NCBI
|
|
42
|
Thota B, Arimappamagan A, Kandavel T,
Shastry AH, Pandey P, Chandramouli BA, Hegde AS, Kondaiah P and
Santosh V: STAT-1 expression is regulated by IGFBP-3 in malignant
glioma cells and is a strong predictor of poor survival in patients
with glioblastoma. J Neurosurg. 121:374–383. 2014. View Article : Google Scholar : PubMed/NCBI
|
|
43
|
Arzt L, Kothmaier H, Halbwedl I,
Quehenberger F and Popper HH: Signal transducer and activator of
transcription 1 (STAT1) acts like an oncogene in malignant pleural
mesothelioma. Virchows Arch. 465:79–88. 2014. View Article : Google Scholar : PubMed/NCBI
|
|
44
|
Jung SH, Ahn SY, Choi HW, Shin MG, Lee SS,
Yang DH, Ahn JS, Kim YK, Kim HJ and Lee JJ: STAT3 expression is
associated with poor survival in non-elderly adult patients with
newly diagnosed multiple myeloma. Blood Res. 52:293–299. 2017.
View Article : Google Scholar : PubMed/NCBI
|
|
45
|
Li WM, Huang CN, Lee YC, Chen SH, Lin HH,
Wu WJ, Li CC, Yeh HC, Chang LL, Hsu WC and Ke HL: Over-expression
of activated signal transducer and activator of transcription 3
predicts poor prognosis in upper tract urothelial carcinoma. Int J
Med Sci. 14:1360–1367. 2017. View Article : Google Scholar : PubMed/NCBI
|
|
46
|
Ni Z, Lou W, Lee SO, Dhir R, DeMiguel F,
Grandis JR and Gao AC: Selective activation of members of the
signal transducers and activators of transcription family in
prostate carcinoma. J Urol. 167:1859–1862. 2002. View Article : Google Scholar : PubMed/NCBI
|
|
47
|
Liu S, Li L, Zhang Y, Zhang Y, Zhao Y, You
X, Lin Z, Zhang X and Ye L: The oncoprotein HBXIP uses two pathways
to up-regulate S100A4 in promotion of growth and migration of
breast cancer cells. J Biol Chem. 287:30228–30239. 2012. View Article : Google Scholar : PubMed/NCBI
|
|
48
|
Zhou X, Xia Y, Su J and Zhang G:
Down-regulation of miR-141 induced by helicobacter pylori promotes
the invasion of gastric cancer by targeting STAT4. Cell Physiol
Biochem. 33:1003–1012. 2014. View Article : Google Scholar : PubMed/NCBI
|
|
49
|
Silver DL, Naora H, Liu J, Cheng W and
Montell DJ: Activated signal transducer and activator of
transcription (STAT) 3: Localization in focal adhesions and
function in ovarian cancer cell motility. Cancer Res. 64:3550–3558.
2004. View Article : Google Scholar : PubMed/NCBI
|
|
50
|
Wang G, Chen JH, Qiang Y, Wang DZ and Chen
Z: Decreased STAT4 indicates poor prognosis and enhanced cell
proliferation in hepatocellular carcinoma. World J Gastroenterol.
21:3983–3993. 2015. View Article : Google Scholar : PubMed/NCBI
|
|
51
|
Kuo YH, Chen YT, Tsai HP, Chai CY and Kwan
AL: Nucleophosmin overexpression is associated with poor survival
in astrocytoma. APMIS. 123:515–522. 2015. View Article : Google Scholar : PubMed/NCBI
|
|
52
|
Wang CG, Ye YJ, Yuan J, Liu FF, Zhang H
and Wang S: EZH2 and STAT6 expression profiles are correlated with
colorectal cancer stage and prognosis. World J Gastroenterol.
16:2421–2427. 2010. View Article : Google Scholar : PubMed/NCBI
|
|
53
|
Nivarthi H, Gordziel C, Themanns M, Kramer
N, Eberl M, Rabe B, Schlederer M, Rose-John S, Knösel T, Kenner L,
et al: The ratio of STAT1 to STAT3 expression is a determinant of
colorectal cancer growth. Oncotarget. 7:51096–51106. 2016.
View Article : Google Scholar : PubMed/NCBI
|
|
54
|
Sun Y, Han Y, Wang X, Wang W, Wang X, Wen
M, Xia J, Xing H, Li X and Zhang Z: Correlation of EGFR Del 19 with
Fn14/JAK/STAT signaling molecules in non-small cell lung cancer.
Oncol Rep. 36:1030–1040. 2016. View Article : Google Scholar : PubMed/NCBI
|
|
55
|
Jeon M, You D, Bae SY, Kim SW, Nam SJ, Kim
HH, Kim S and Lee JE: Dimerization of EGFR and HER2 induces breast
cancer cell motility through STAT1-dependent ACTA2 induction.
Oncotarget. 8:50570–50581. 2016.PubMed/NCBI
|
|
56
|
Chen G, Wang Y, Wu P, Zhou Y, Yu F, Zhu C,
Li Z, Hang Y, Wang K, Li J, et al: Reversibly stabilized polycation
nanoparticles for combination treatment of early- and late-stage
metastatic breast cancer. ACS Nano. 12:6620–6636. 2018. View Article : Google Scholar : PubMed/NCBI
|
|
57
|
Merk BC, Owens JL, Lopes MB, Silva CM and
Hussaini IM: STAT6 expression in glioblastoma promotes invasive
growth. BMC Cancer. 11:1842011. View Article : Google Scholar : PubMed/NCBI
|
|
58
|
Sumiyoshi H, Matsushita A, Nakamura Y,
Matsuda Y, Ishiwata T, Naito Z and Uchida E: Suppression of STAT5b
in pancreatic cancer cells leads to attenuated gemcitabine
chemoresistance, adhesion and invasion. Oncol Rep. 35:3216–3226.
2016. View Article : Google Scholar : PubMed/NCBI
|
|
59
|
Tian X, Guan W, Zhang L, Sun W, Zhou D,
Lin Q, Ren W, Nadeem L and Xu G: Physical interaction of STAT1
isoforms with TGF-β receptors leads to functional crosstalk between
two signaling pathways in epithelial ovarian cancer. J Exp Clin
Cancer Res. 37:1032018. View Article : Google Scholar : PubMed/NCBI
|
|
60
|
Wei M, Liu B, Gu Q, Su L, Yu Y and Zhu Z:
Stat6 cooperates with Sp1 in controlling breast cancer cell
proliferation by modulating the expression of p21(Cip1/WAF1) and
p27 (Kip1). Cell Oncol (Dordr). 36:79–93. 2013. View Article : Google Scholar : PubMed/NCBI
|
|
61
|
Morgan EL, Wasson CW, Hanson L, Kealy D,
Pentland I, McGuire V, Scarpini C, Coleman N, Arthur JSC, Parish
JL, et al: STAT3 activation by E6 is essential for the
differentiation-dependent HPV18 life cycle. PLoS Pathog.
14:e10069752018. View Article : Google Scholar : PubMed/NCBI
|
|
62
|
Hosui A, Klover P, Tatsumi T, Uemura A,
Nagano H, Doki Y, Mori M, Hiramatsu N, Kanto T, Hennighausen L, et
al: Suppression of signal transducers and activators of
transcription 1 in hepatocellular carcinoma is associated with
tumor progression. Int J Cancer. 131:2774–2784. 2012. View Article : Google Scholar : PubMed/NCBI
|
|
63
|
Zhang Y, Cheng X, Liang H and Jin Z: Long
non-coding RNA HOTAIR and STAT3 synergistically regulate the
cervical cancer cell migration and invasion. Chem Biol Interact.
286:106–110. 2018. View Article : Google Scholar : PubMed/NCBI
|
|
64
|
Khan MA, El-Gamal MI and Oh CH: A
progressive review of V600E-B-RAF-dependent melanoma and drugs
inhibiting it. Mini Rev Med Chem. 17:351–365. 2017. View Article : Google Scholar : PubMed/NCBI
|
|
65
|
Liu LJ, Wang W, Huang SY, Hong Y, Li G,
Lin S, Tian J, Cai Z, Wang HD, Ma DL and Leung CH: Inhibition of
the Ras/Raf interaction and repression of renal cancer xenografts
in vivo by an enantiomeric iridium(iii) metal-based compound. Chem
Sci. 8:4756–4763. 2017. View Article : Google Scholar : PubMed/NCBI
|
|
66
|
Bosserhoff AK: Novel biomarkers in
malignant melanoma. Clin Chim Acta. 367:28–35. 2006. View Article : Google Scholar : PubMed/NCBI
|
|
67
|
Kugel CH III and Aplin AE: Adaptive
resistance to RAF inhibitors in melanoma. Pigment Cell Melanoma
Res. 27:1032–1038. 2014. View Article : Google Scholar : PubMed/NCBI
|
|
68
|
Harpio R and Einarsson R: S100 proteins as
cancer biomarkers with focus on S100B in malignant melanoma. Clin
Biochem. 37:512–518. 2004. View Article : Google Scholar : PubMed/NCBI
|
|
69
|
Xiong TF, Pan FQ and Li D: Expression and
clinical significance of S100 family genes in patients with
melanoma. Melanoma Res. 29:23–29. 2019. View Article : Google Scholar : PubMed/NCBI
|