Introduction
Triple-negative breast cancer (TNBC) is a typical
molecular subtype of breast cancer that lacks the expression of
estrogen receptor (ER), progesterone receptor (PR) and human
epidermal growth factor receptor 2 (HER2) and accounts for 10–20%
of all types of breast cancer (1,2). TNBC is
also well known for its aggressive and metastatic clinical
characteristics and generally leads to early distant recurrence and
poor prognosis (3,4). Currently, no specific targeted therapy
is available for TNBC (5).
Therefore, it is crucial to identify potential biomarkers and novel
therapeutic targets for the development of a more efficient
treatment.
Emerging evidence has indicated that long non-coding
RNAs (lncRNAs) play a vital role in a large variety of biological
processes, including genetic transcription, chromosome
modification, cell cycle, cell differentiation and migration
(6–8). Various studies have indicated that
specific miRNAs may participate in tumor progression and function
as oncogenes or tumor suppressor genes (9–11).
Moreover, the competing endogenous RNA (ceRNA) hypothesis, which
suggests that non-coding RNAs and pseudogene transcripts are able
to compete for the same miRNA response elements in order to
regulate each other and communicate with mRNAs, has gained
increasing interest (12).
Thereafter, this hypothesis was validated experimentally by further
studies (13,14). However, published studies with large
sample sizes and specific biomarkers for TNBC are limited.
Therefore, the ceRNA network of TNBC has not yet been fully
investigated and requires further exploration.
In the present study, published microarray and
sequencing data were searched in the Gene Expression Omnibus (GEO)
and The Cancer Genome Atlas (TCGA) databases and gene expression
profiling data were collected from a large sample size of patients
with TNBC, in order to identify candidate RNA signatures in TNBC. A
predictable ceRNA network was also constructed based on the ceRNA
hypothesis, in order to identify the TNBC-specific RNAs involved in
the ceRNA crosstalk. These integrated analyses aimed to detect
novel lncRNA/miRNA/mRNA biomarkers of TNBC and reveal the
underlying molecular regulatory mechanisms of TNBC pathogenesis and
progression.
Materials and methods
Data mining
Microarray datasets, including GSE38959 (15), GSE61723 (16), GSE61724 (16), GSE76250 (17), GSE86945 (18) and GSE86946 (18), and one dataset obtained by expression
profiling via high-throughput sequencing, namely GSE58135 (19), were downloaded from the GEO database
(https://www.ncbi.nlm.nih.gov/geo/).
In order to be included, all datasets had to consist of at least 20
samples and employ tissue samples collected from patients with TNBC
and corresponding adjacent or healthy tissues. Large sample sizes
are considered to provide more reliable results in the screening of
differentially expressed genes (DEGs). It has been reported that
small sample sizes are one of the major challenges in microarray
analysis and, thus, recent integrated bioinformatics studies tend
to use datasets with relatively large sample sizes (20). Therefore, GEO datasets containing at
least 20 samples were chosen for further analysis in the present
study. RNA-sequencing (RNA-seq) and microRNA-sequencing (miRNA-seq)
data of patients with TNBC, comprising 116 patients with TNBC with
complete expression profiles and clinical information, were
downloaded from the TCGA database (https://portal.gdc.cancer.gov/). Finally, 126 RNA-seq
samples, including 115 tumor tissues and 11 healthy tissues, and
122 miRNA-seq samples, containing 113 tumor tissues and 9 healthy
tissues, were obtained. The present study was performed in
accordance with the publication guidelines provided by TCGA
(http://cancergenome.nih.gov/publications/publicationguidelines).
A flowchart of the data collection process and method
implementation is presented in Fig.
1.
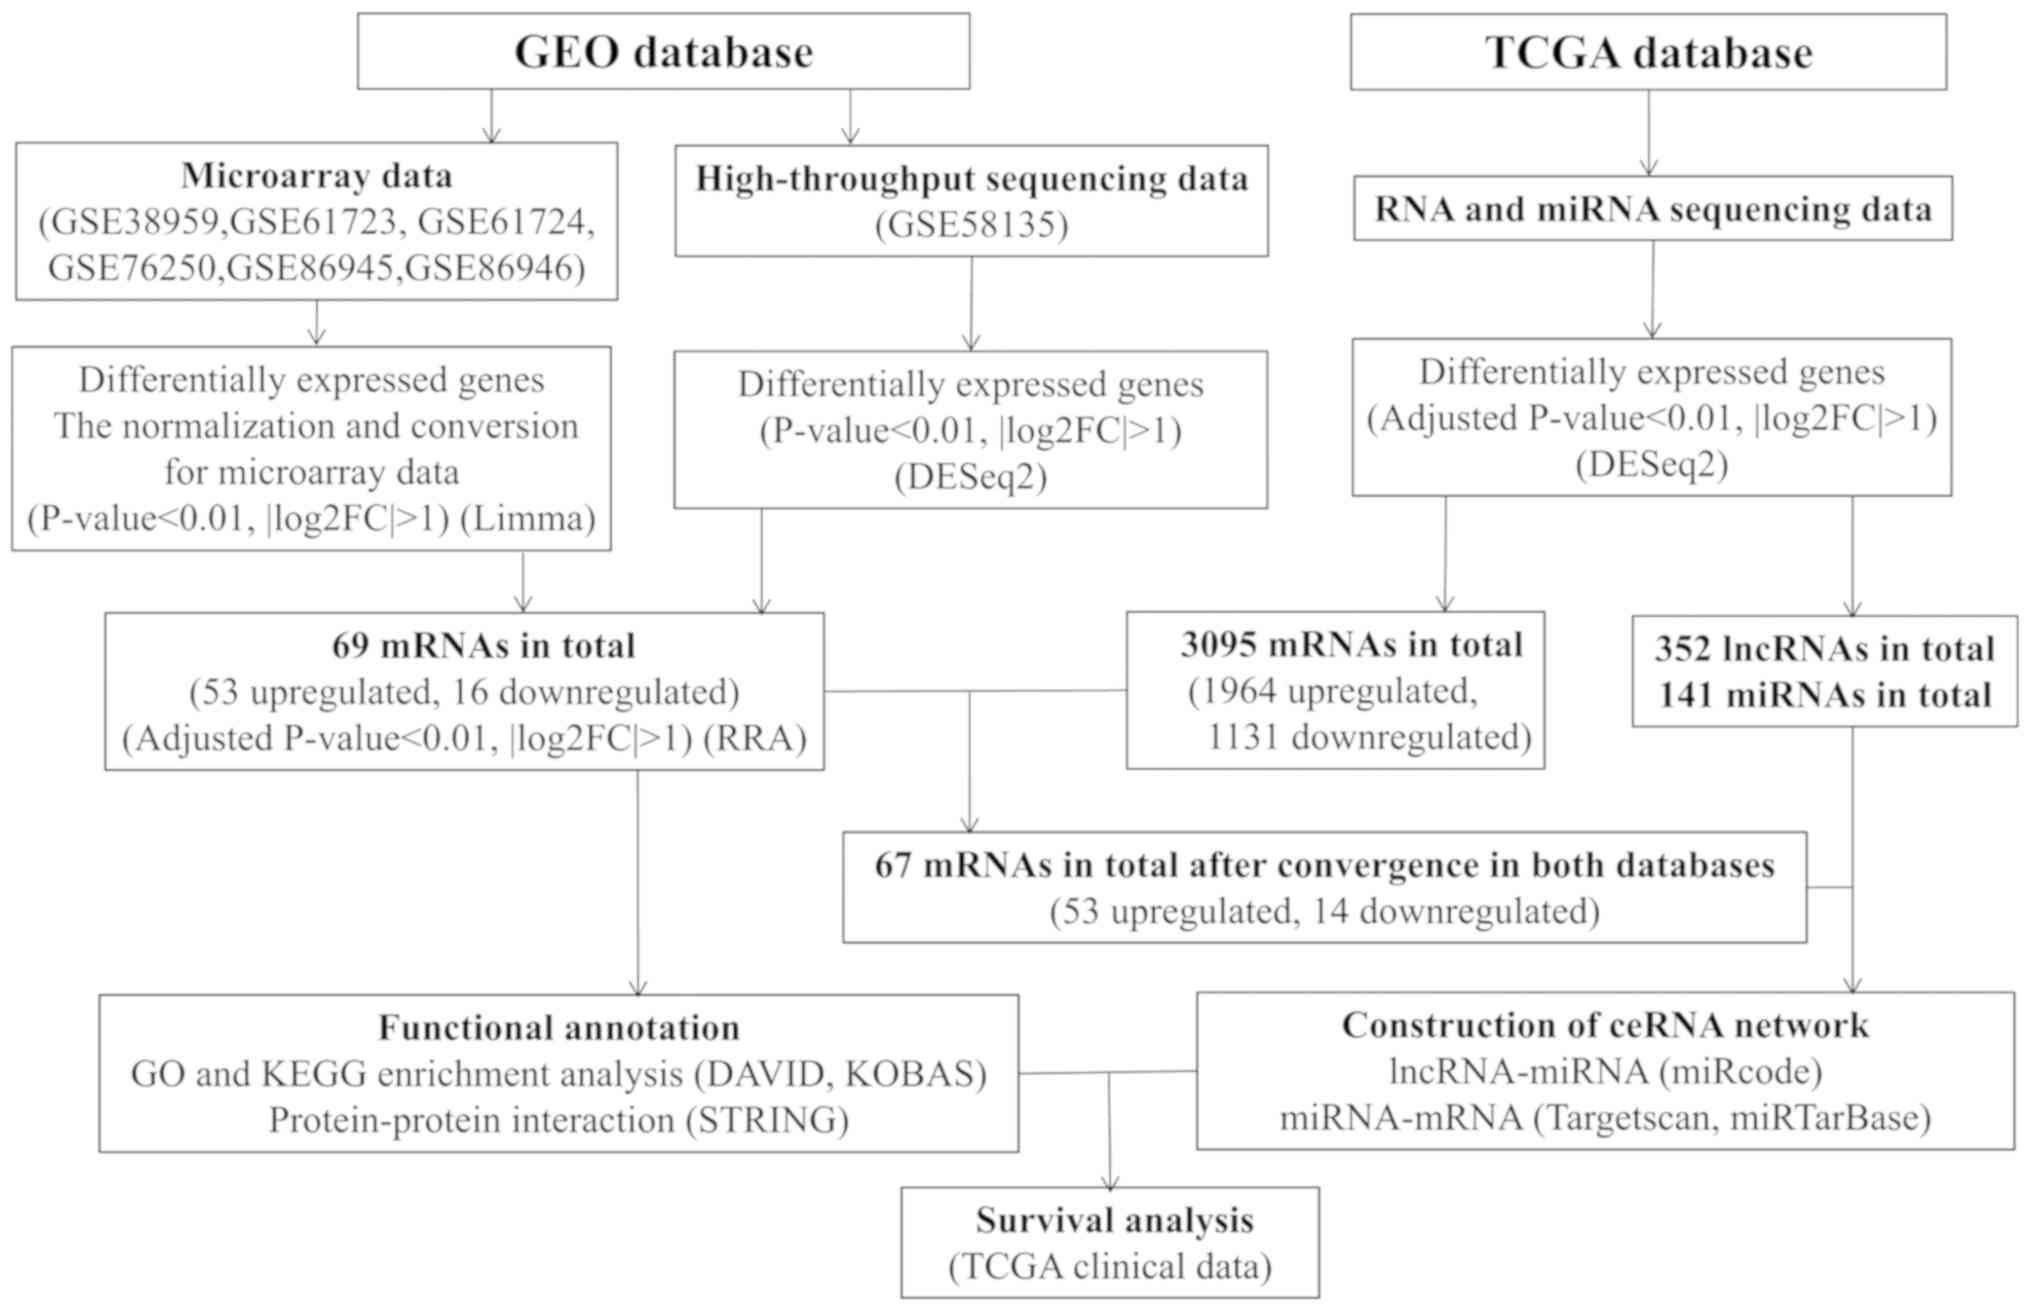 | Figure 1.Flowchart of data collection and
method implementation in this study. GEO, Gene Expression Omnibus;
KEGG, Kyoto Encyclopedia of Genes and Genomes; FDR, false discovery
rate; TCGA, The Cancer Genome Atlas; DAVID, Database for
Annotation, Visualization and Integrated Discovery; STRING, Search
Tool for the Retrieval of Interacting Genes; KOBAS, KEGG Orthology
Based Annotation System; FC, fold change; miRNAs, microRNAs;
lncRNAs, long non-coding RNAs; ceRNA, competing endogenous RNA. |
Analysis of DEGs
The Limma package of R software (version 3.5.2)
(21) was used for the normalization
and log base 2 transformation of microarray data from the GEO
datasets and screening of DEGs between tumor and healthy tissues.
Three datasets, specifically GSE76250, GSE86945 and GSE86946, were
merged into one group for normalization since they were all
profiled on the Affymetrix Human Transcriptome Array 2.0 platform
according to the GPL17586 platform (https://www.ncbi.nlm.nih.gov/geo/query/acc.cgi?acc=GPL17586).
A boxplot of the normalization and log base 2 transformation
corresponding to this group is presented in Fig. S1. The GSE58135 dataset was employed
for differential expression analysis between tumor and healthy
tissues, which was performed using the DESeq2 package v.1.26.0
(http://www.bioconductor.org/packages/release/bioc/html/DESeq2.html)
of R software (version 3.5.2). Gene integration analysis of the
DEGs identified from the seven GEO datasets was conducted using the
RobustRankAggreg package version 1.1 (22) based on a robust rank aggregation
(RRA) method. Genes were then regarded as DEGs following RRA
analysis based on the following significance cut-off levels:
Adjusted P<0.01 and |log2FC|>1. The RRA method that was
applied screens genes that are ranked consistently better than
expected based on the null hypothesis of uncorrelated inputs
(22). Thus, the gene expression
values of samples from different datasets were not integrated into
this analysis. In accordance with a number of published papers
based on the RobustRankAggreg package (23,24),
batch effect correction was not conducted in the present study.
The TCGA datasets were used for differential
expression analyses of mRNAs, lncRNAs and miRNAs, which were
compared between tumor and healthy tissues using the DESeq2 package
(version 1.26.0) of R software (version 3.5.2). An adjusted
P<0.01 and |log2FC|>1 were set as the cut-off criteria.
Functional enrichment analysis
Enrichment analysis of DEGs that were screened from
the GEO database based on the RRA method was conducted using the
Gene Ontology (GO) and Kyoto Encyclopedia of Genes and Genomes
(KEGG) analysis. The GO enrichment analysis and functional
annotation of the DEGs, which included the terms molecular function
(MF), biological process (BP) and cellular component (CC), were
performed using the Database for Annotation, Visualization and
Integrated Discovery (DAVID; version 6.8, (http://david.abcc.ncifcrf.gov/) (25). The KEGG Orthology Based Annotation
System (KOBAS; version 3.0; http://kobas.cbi.pku.edu.cn/) was used to evaluate the
statistical enrichment of DEGs in KEGG pathways. P<0.01 was
considered to indicate significantly enriched DEGs.
Protein-protein interaction (PPI)
network analysis
The Search Tool for the Retrieval of Interacting
Genes (STRING version 11.0) (https://string-db.org/) database provides information
regarding the predicted and experimental interactions of proteins
(26), thus it was used for the
identification of the protein-protein interactions among the
identified DEGs. In the present study, the DEGs were mapped into
PPIs and a combined score of ≥0.4 was considered as the cut-off
level. Moreover, Cytoscape software (version 3.7.1) was used to
construct the PPI networks (27).
Construction of the ceRNA network
The intersection of DEmRNAs between GEO and TCGA
databases obtained by using the VennDiagram package (version
1.6.20; http://CRAN.R-project.org/package=VennDiagram), DElnc
RNAs and DEmiRNAs from the TCGA database were used to construct the
ceRNA network. The miRcode database version 11.0; (http://www.mircode.org/) was used to collect predicted
and experimentally validated lncRNA-targeted miRNAs. MiRTarBase
version 6.0 (http://mirtarbase.mbc.nctu.edu.tw/php/index.php) and
TargetScan version 7.2 (http://www.targetscan.org/vert_72/) were cooperatively
utilized to determine miRNA-targeted mRNAs. Based on the above
lncRNA-miRNA and miRNA-mRNA interactions, visualization of the
lncRNA-miRNA-mRNA network was performed using Cytoscape.
Survival analysis
Gene expression data and survival information
obtained from the TCGA database were assessed by Kaplan-Meier
survival analysis and a log-rank test was performed using the
survival package version 2.44–1.1 (https://www.rdocumentation.org/packages/survival/versions/2.44–1.1)
in R software. All the samples were categorized into high and low
expression groups based on the median expression level of each DEG.
Regarding the log-rank test results, P<0.05 was considered to
indicate a statistically significant difference.
Results
Identification of DEGs
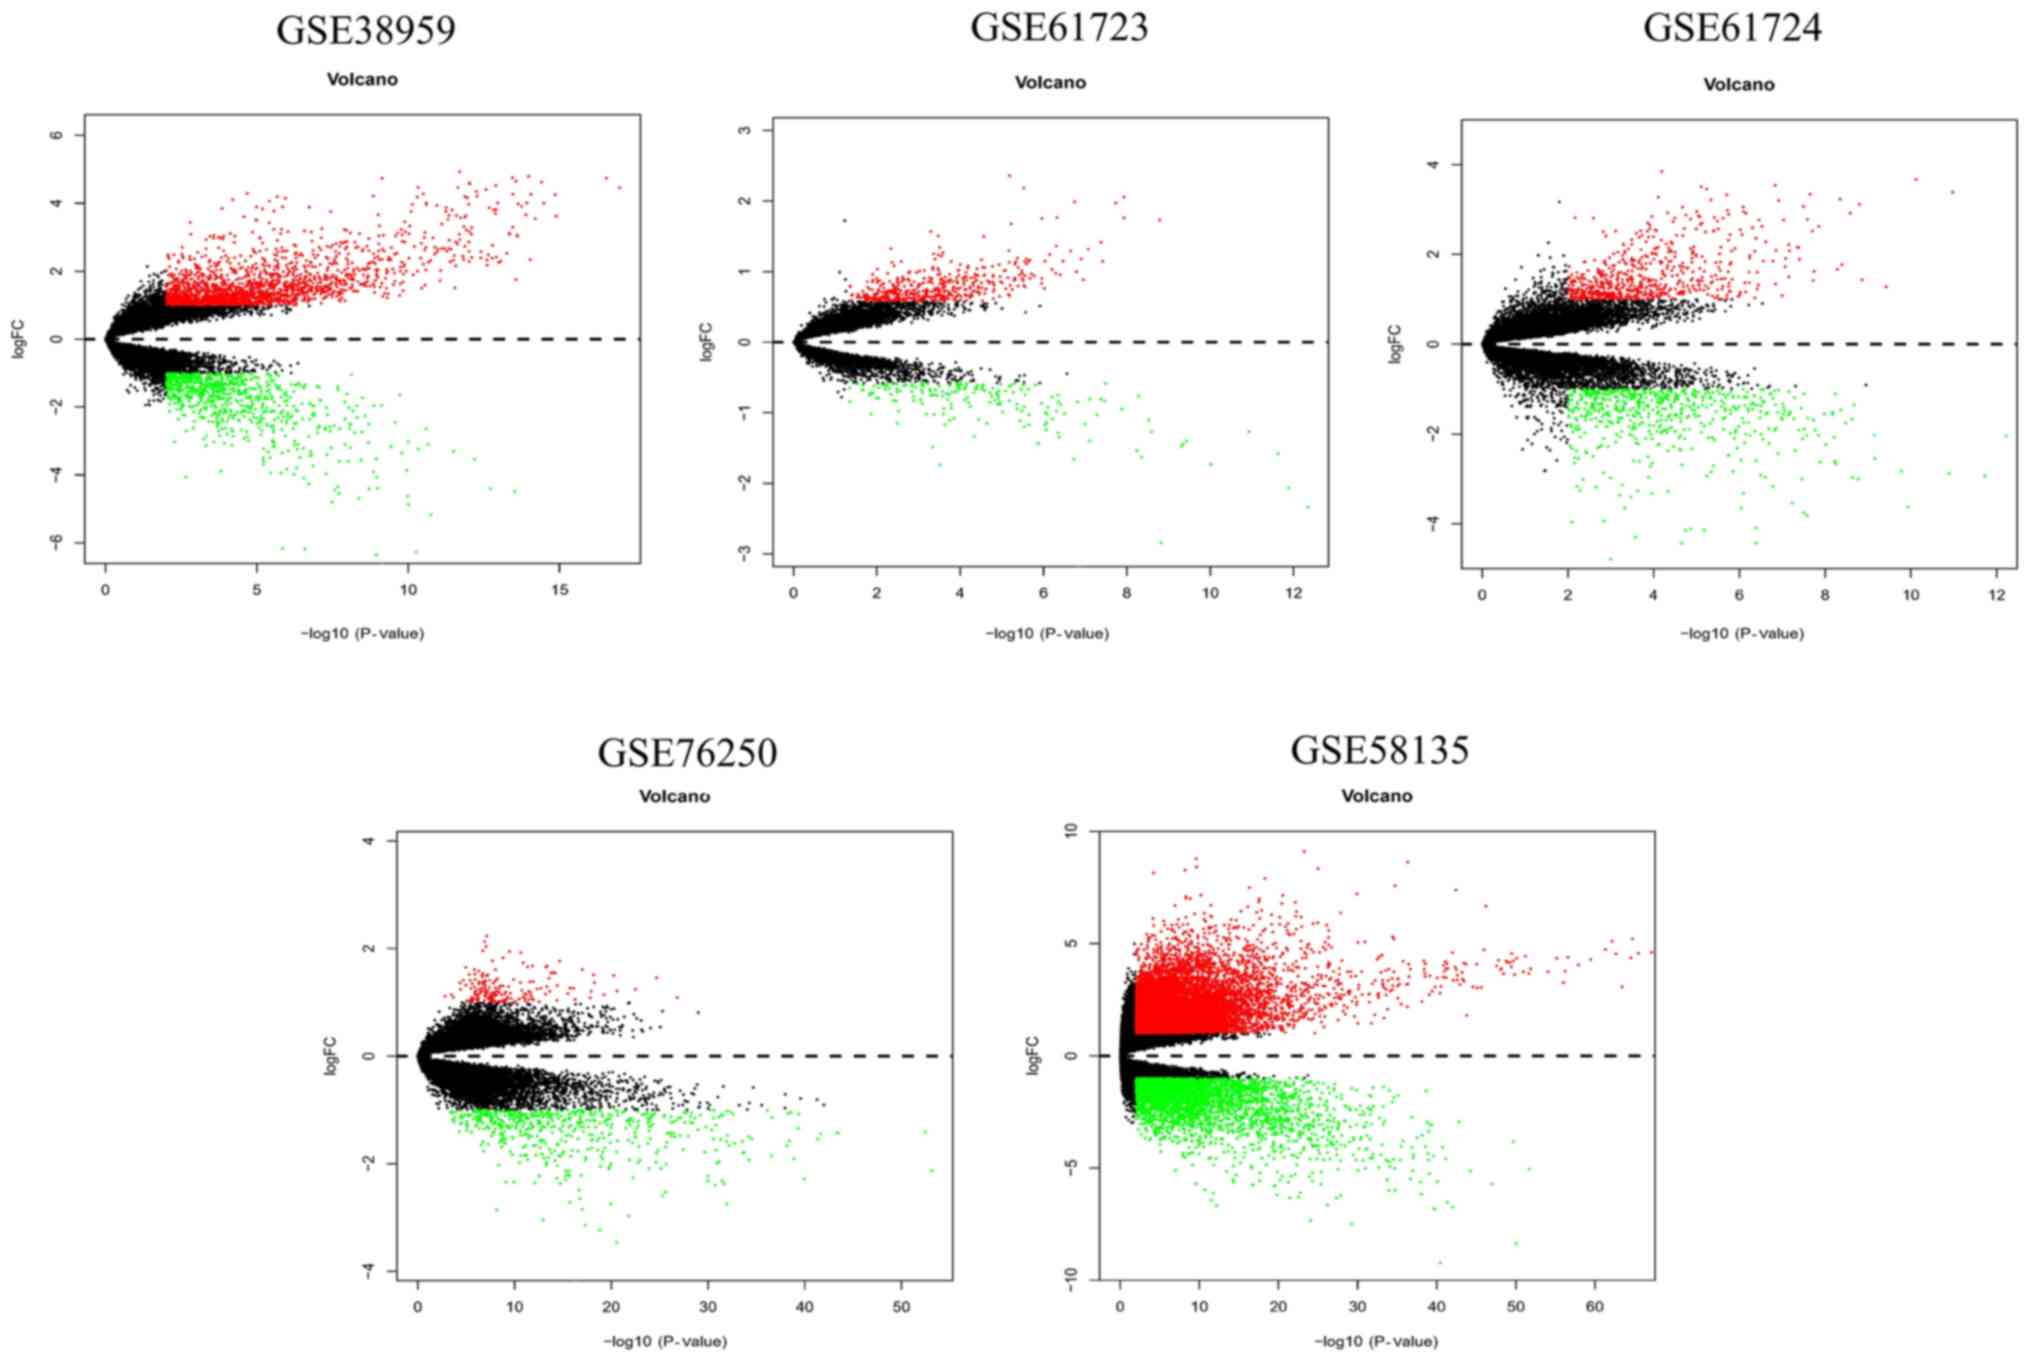
Information of the seven datasets that were
downloaded from the GEO database and included in the current study
is shown in Table I. Volcano plots
revealed the number of differentially expressed genes identified
from each dataset according to the set cut-off levels (P<0.01
and |log2FC|>1) (Fig.
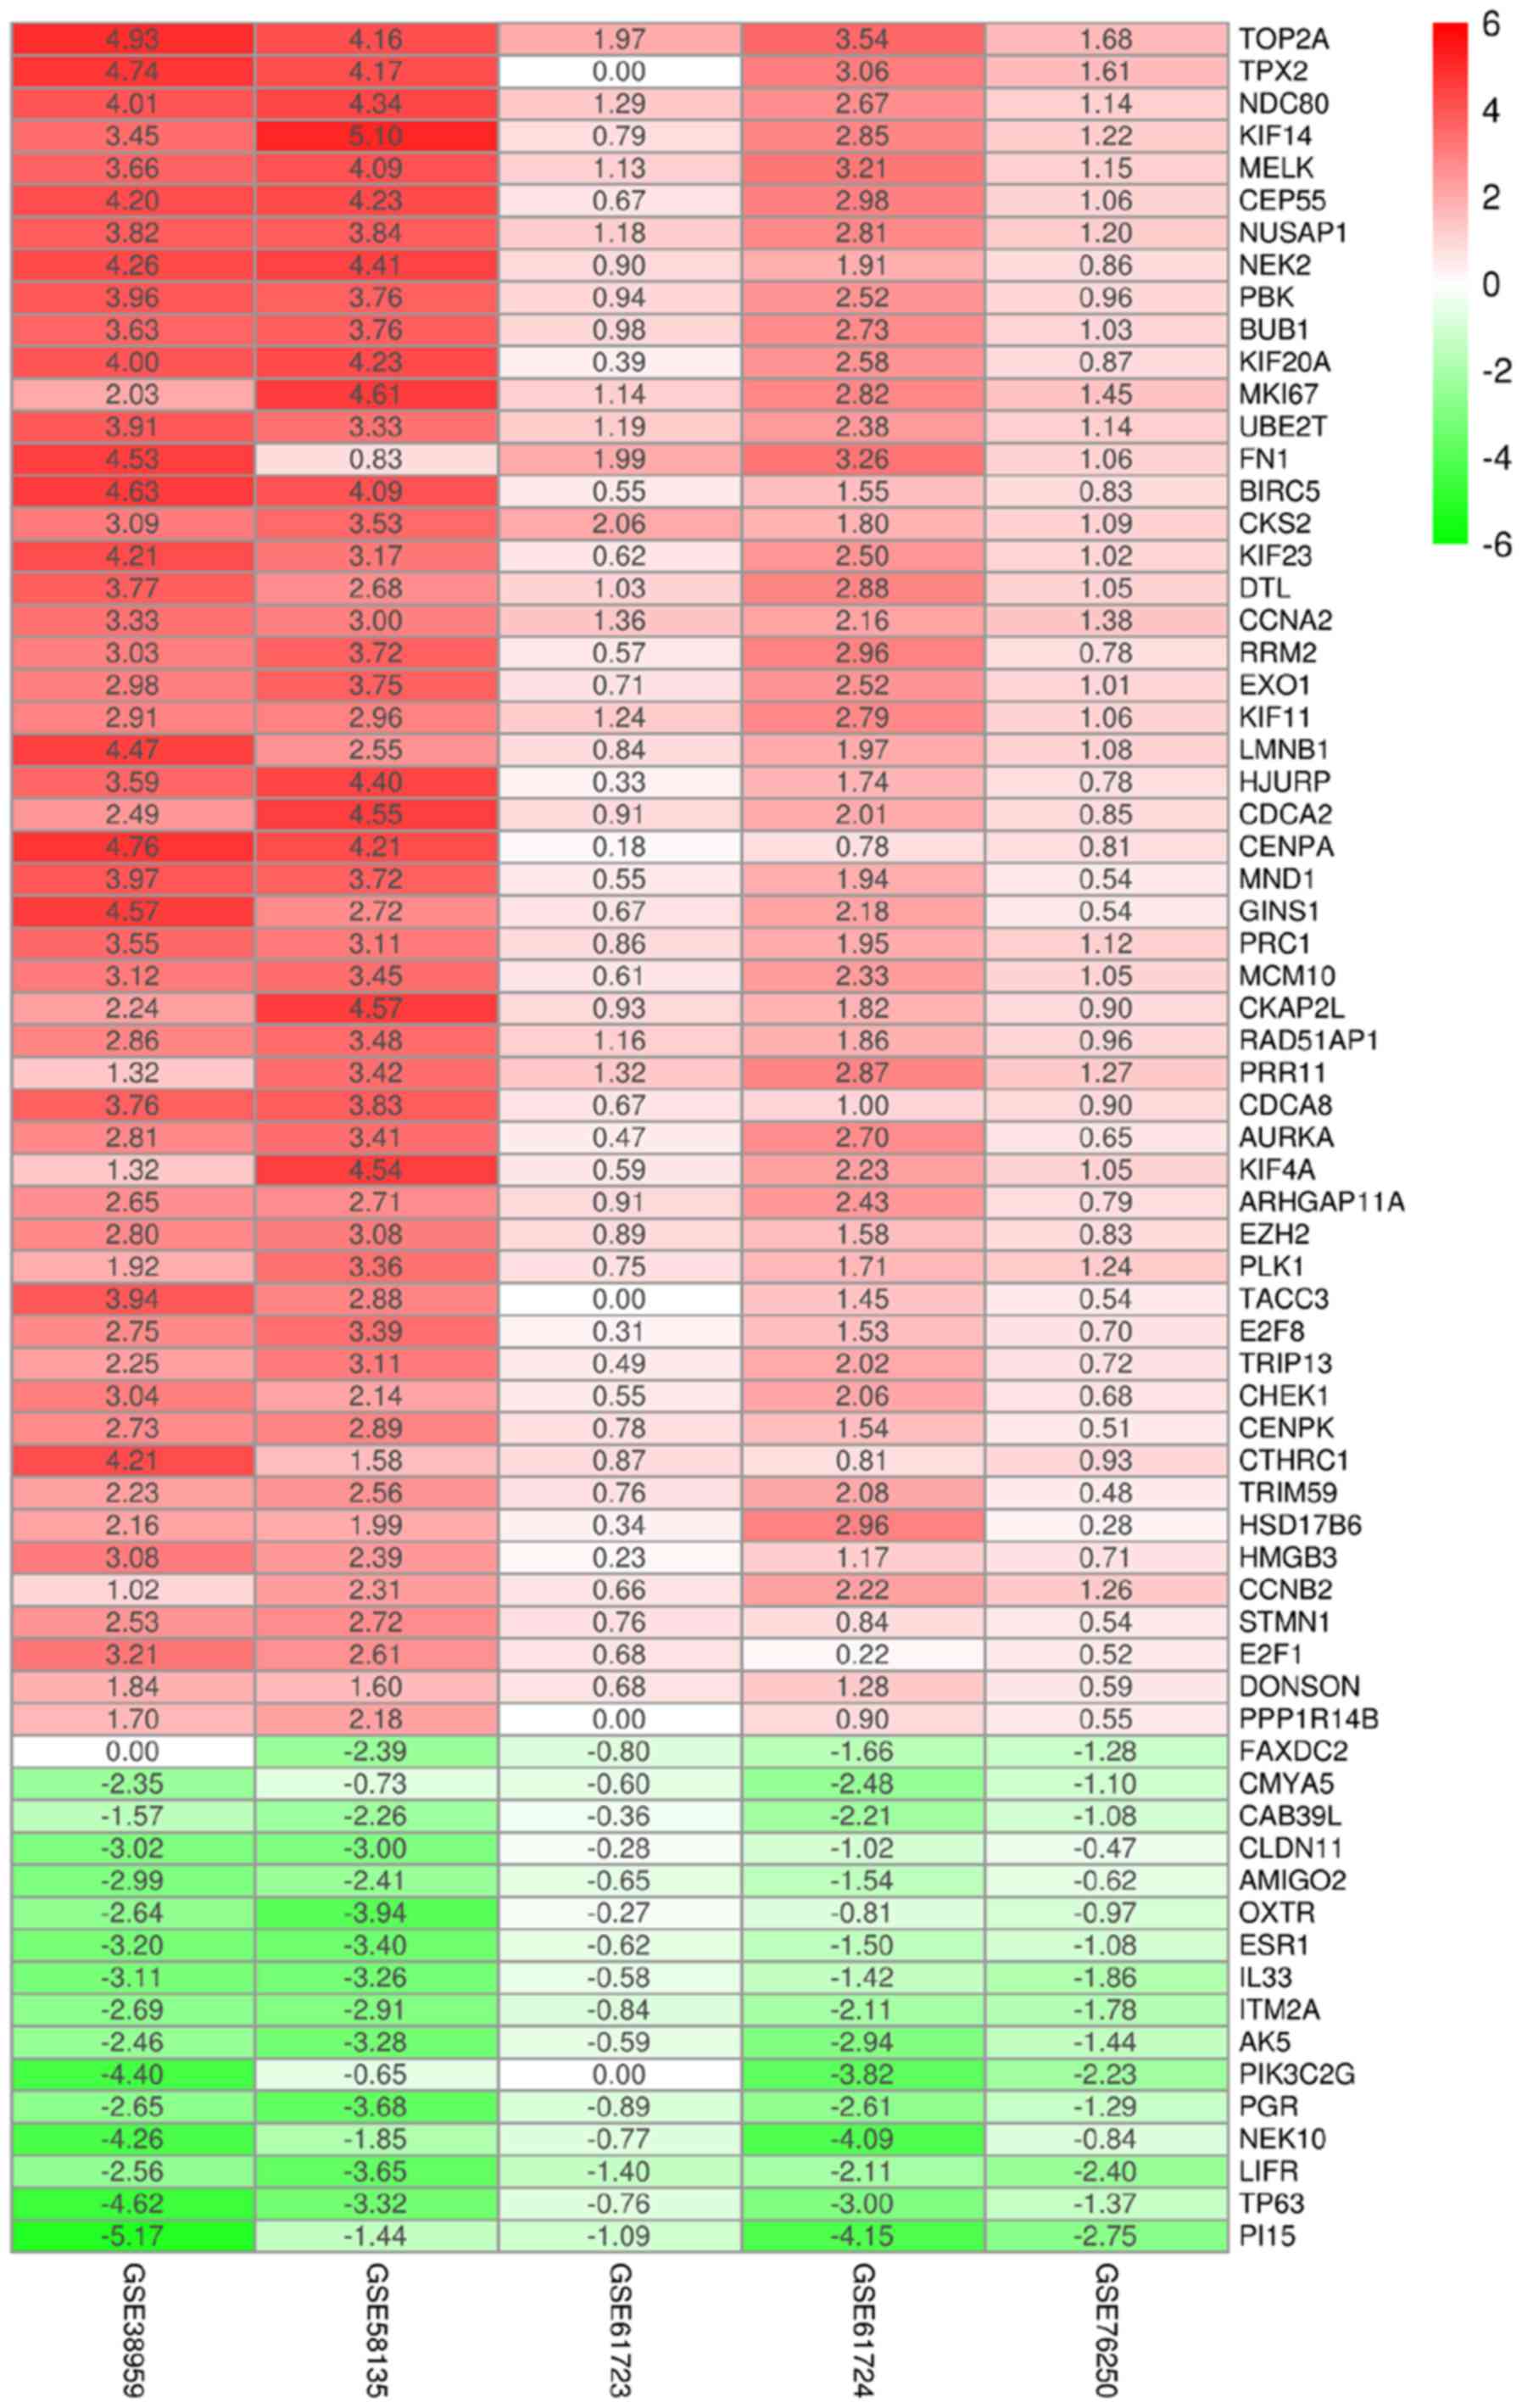
2). Based on different cut-off levels (adjusted P<0.01 and
|log2FC|>1), a total of 69 differentially expressed
mRNAs (DEmRNAs), consisting of 16 downregulated and 53 upregulated
genes, were identified following integrated analysis of these GEO
datasets using the RobustRankAggreg package and further analyzed
(Fig. 3).
 | Table I.Details of datasets from the Gene
Expression Omnibus database. |
Table I.
Details of datasets from the Gene
Expression Omnibus database.
| Author, year | PMID | Record | Tissue | Platform | Healthy | Cancer | (Refs.) |
|---|
| Komatsu et
al, 2013 | 23254957 | GSE38959 |
Triple-negative | GPL4133
Agilent-014850 Whole Human Genome | 13 | 30 | (15) |
|
|
|
| breast cancer | Microarray 4×44K
G4112F (Feature Number version) |
|
|
|
| Mathe et al,
2015 | 26537449 | GSE61723 |
Triple-negative | GPL16686
[HuGene-2_0-st] Affymetrix Human Gene 2.0 | 17 | 33 | (16) |
|
|
|
| breast cancer | ST Array
[transcript (gene) version] |
|
|
|
| Mathe et al,
2015 | 26537449 | GSE61724 |
Triple-negative | GPL6244
[HuGene-1_0-st] Affymetrix Human Gene 1.0 | 4 | 16 | (16) |
|
|
|
| breast cancer | ST Array
[transcript (gene) version] |
|
|
|
| Liu et al,
2016 | 26813360 | GSE76250 |
Triple-negative | GPL17586 [HTA-2_0]
Affymetrix Human Transcriptome | 33 | 165 | (17) |
|
|
|
| breast cancer | Array 2.0
[transcript (gene) version] |
|
|
|
| Romero-Cordoba
et al, 2018 | 30115973 | GSE86945 |
Triple-negative | GPL17586 [HTA-2_0]
Affymetrix Human Transcriptome | 0 | 100 | (18) |
|
|
|
| breast cancer | Array 2.0
[transcript (gene) version] |
|
|
|
| Romero-Cordoba
et al, 2018 | 30115973 | GSE86946 |
Triple-negative | GPL17586 [HTA-2_0]
Affymetrix Human Transcriptome | 0 | 58 | (18) |
|
|
|
| breast cancer | Array 2.0
[transcript (gene) version] |
|
|
|
| Varley et
al, 2014 | 24929677 | GSE58135 |
Triple-negative | GPL11154 Illumina
HiSeq 2000 (Homo sapiens) | 21 | 42 | (19) |
|
|
|
| breast cancer |
|
|
|
|
In the TCGA database, a total of 1,964 upregulated
and 1,131 downregulated mRNAs, 352 differentially expressed lncRNAs
(DElncRNAs) and 141 differentially expressed miRNAs (DEmiRNAs) were
identified based on the aforementioned cut-off levels. Heatmaps of
the top 200 DEmRNAs and DElncRNAs on the basis of adjusted P-value
and overall 141 DEmiRNAs are demonstrated in Figs. S2–S4, respectively.
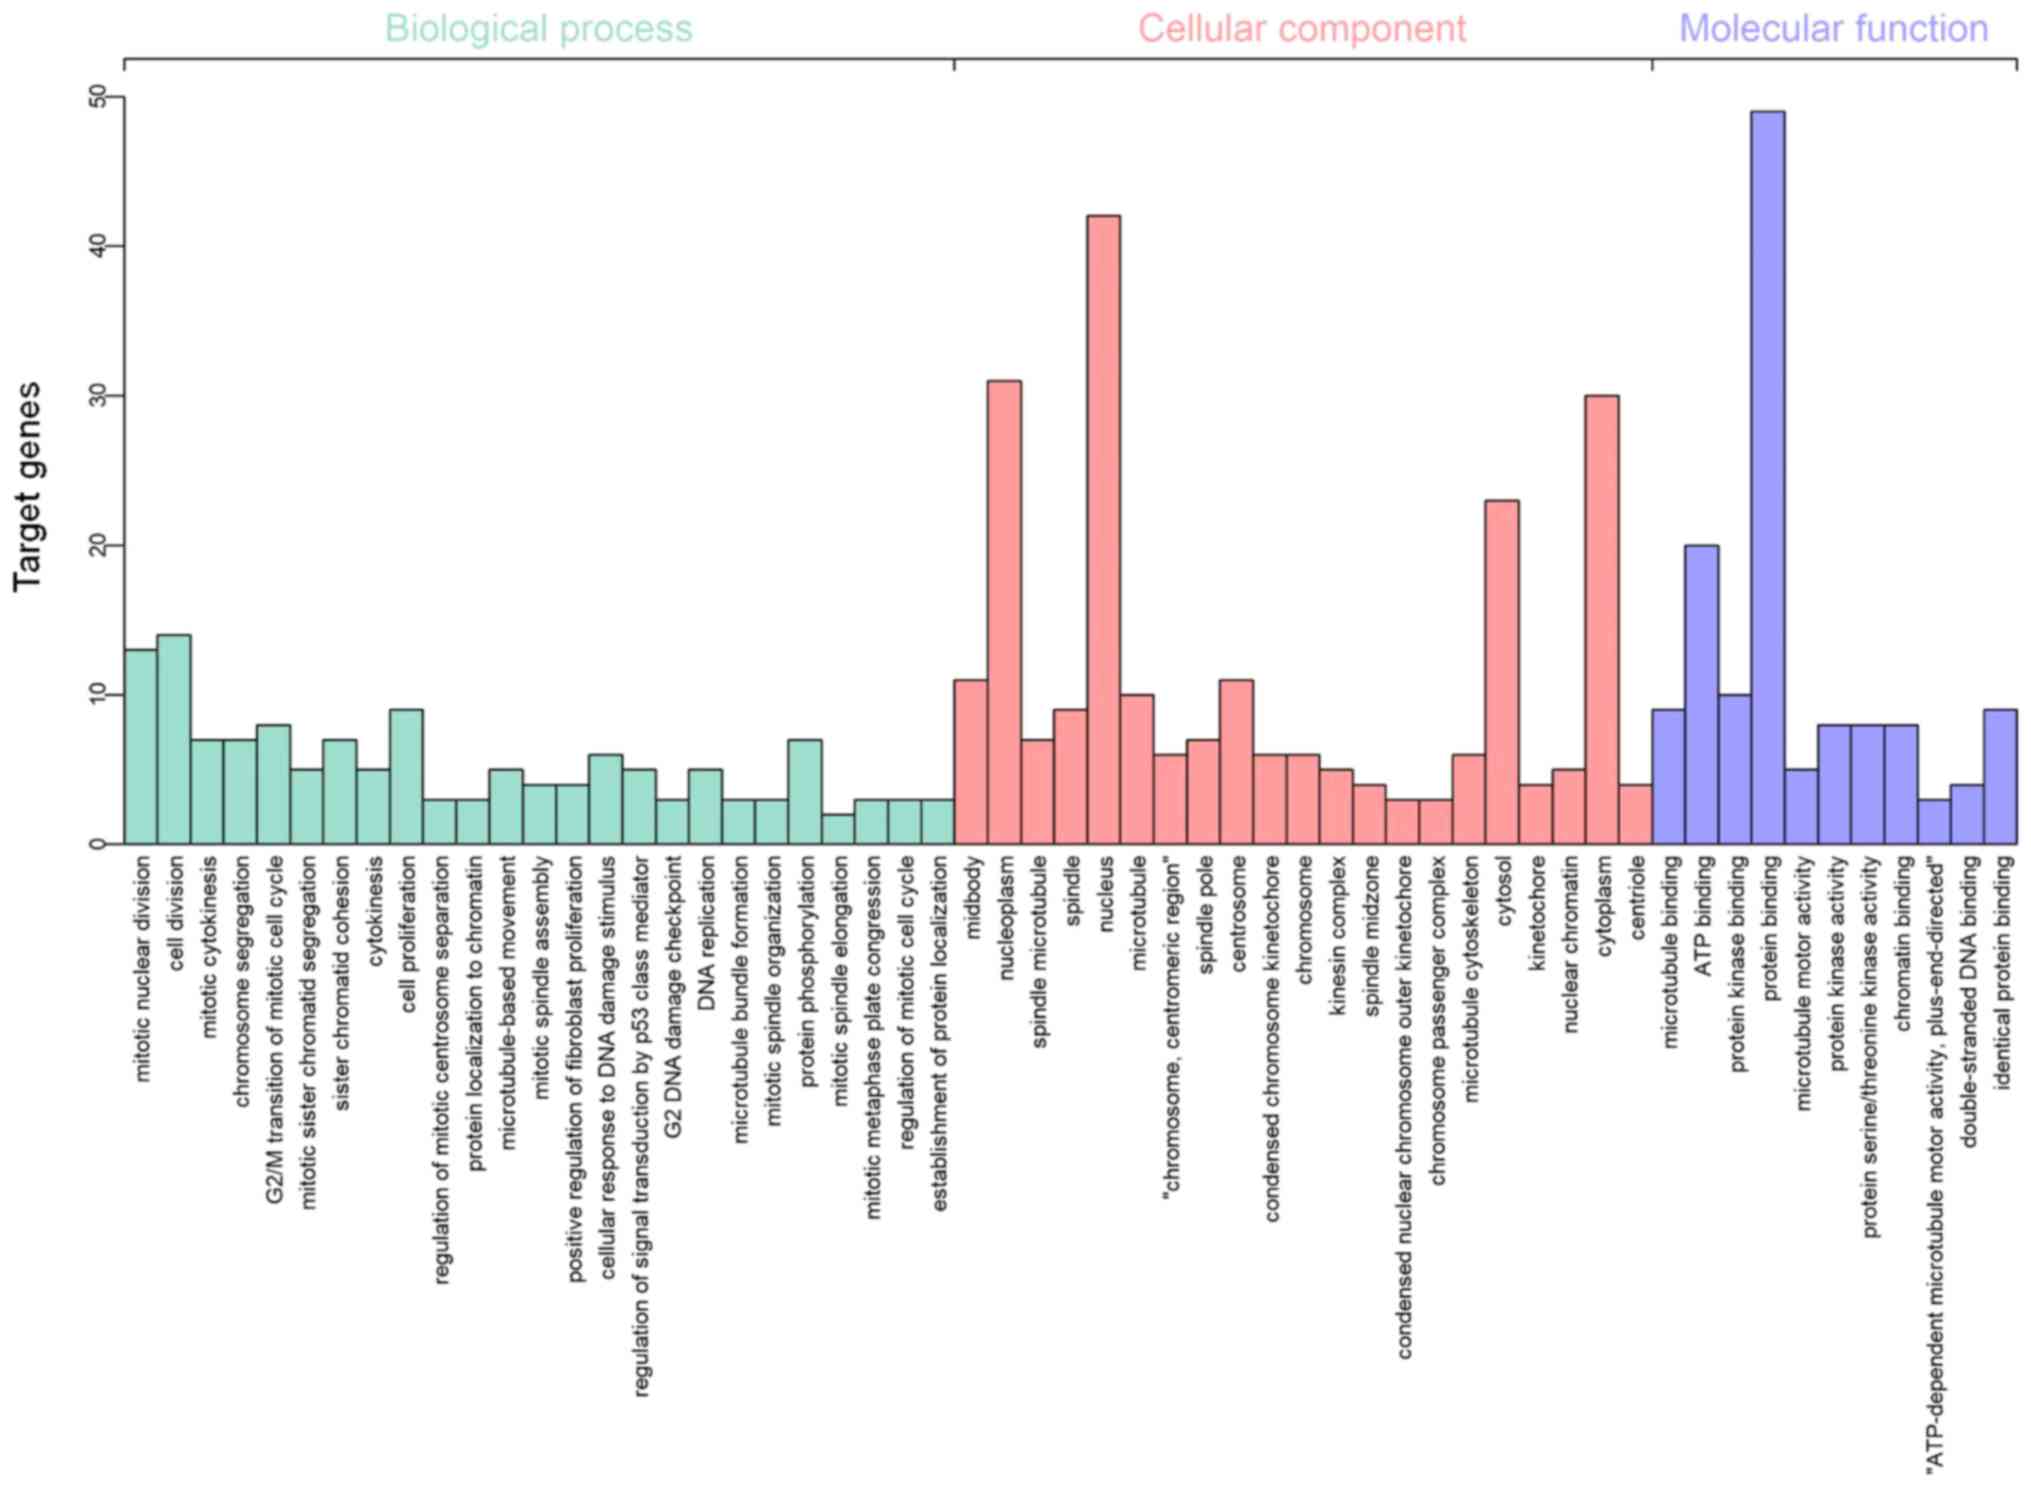
Functional enrichment analysis
Following gene integration analysis, GO term
functional enrichment analysis of the 69 DEGs was conducted using
DAVID with P<0.01 set as the significance cut-off level. The
following categories or ontologies were included in the analysis:
i) Biological processes; ii) cellular component; and iii) molecular
function. In terms of the biological processes, the DEGs were
significantly enriched in ‘mitotic nuclear division’ and ‘cell
division’. In the cellular component analysis, the DEGs were
markedly enriched in the ‘nucleoplasm’ and ‘nucleus’. According to
the molecular function, the DEGs were significantly enriched in ATP
binding and protein binding (Fig.
4). With respect to KEGG pathway enrichment analysis, performed
using KOBAS with P<0.01 set as the cut-off level, the 69 genes
were found to be mainly enriched in ‘cell cycle’,
‘progesterone-mediated oocyte maturation’, ‘oocyte meiosis’ and
‘microRNAs in cancer’ terms (Table
II).
| Table II.Enriched Kyoto Encyclopedia of Genes
and Genomes pathways of the differentially expressed genes. |
Table II.
Enriched Kyoto Encyclopedia of Genes
and Genomes pathways of the differentially expressed genes.
| Term | Count | P-value | FDR | Genes |
|---|
| hsa04110: Cell
cycle | 6 |
1.55×10⁻⁶ |
1.01×10⁻⁴ | PLK1, CCNB2, BUB1,
CCNA2, CHEK1, E2F1 |
| hsa04914:
Progesterone-mediated oocyte maturation | 5 |
9.06×10⁻⁶ |
2.94×10⁻⁴ | CCNB2, BUB1, PLK1,
PGR, CCNA2 |
| hsa04114: Oocyte
meiosis | 5 |
2.43×10⁻⁵ |
5.26×10⁻⁴ | CCNB2, BUB1, PLK1,
AURKA, PGR |
| hsa05206: MicroRNAs
in cancer | 5 |
1.00×10⁻³ |
1.33×10⁻² | STMN1, TP63, EZH2,
E2F1, KIF23 |
| hsa04115: P53
signaling pathway | 3 |
1.03×10⁻³ |
1.33×10⁻² | CCNB2, RRM2,
CHEK1 |
| hsa05222: Small
cell lung cancer | 3 |
2.02×10⁻³ |
2.18×10⁻² | FN1, E2F1,
CKS2 |
| hsa05161: Hepatitis
B | 3 |
8.31×10⁻³ |
7.71×10⁻² | E2F1, BIRC5,
CCNA2 |
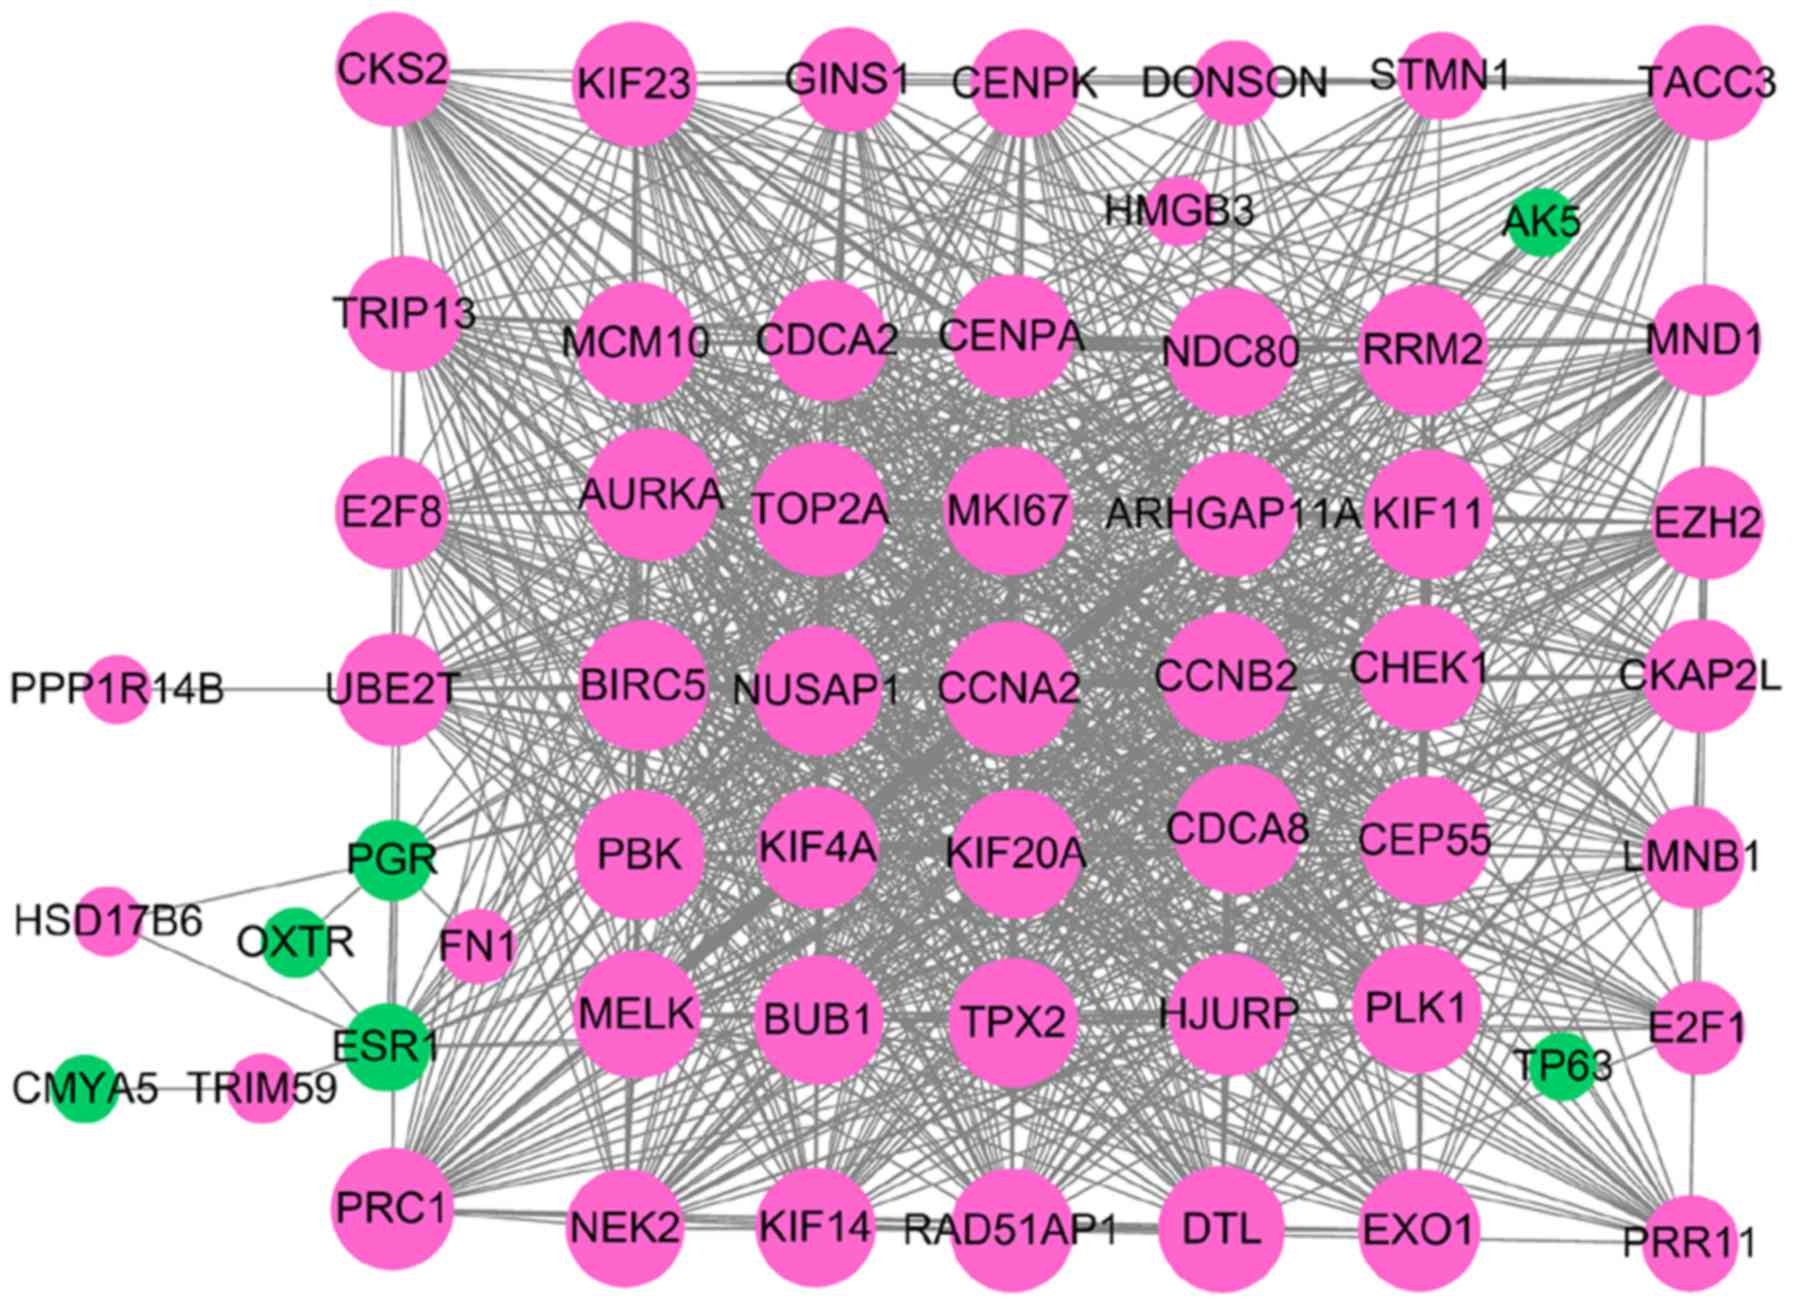
PPI network analysis
The DEGs in TNBC were examined using the STRING
database to construct PPI networks. A total of 69 DEGs were
identified from the GEO database using the RRA method, including 53
upregulated and 16 downregulated DEGs. Following removal of the
isolated and partially connected nodes, a complex PPI network was
formulated consisting of 58 nodes and 926 interactions, which were
obtained with a combined score >0.4 (Fig. 5).
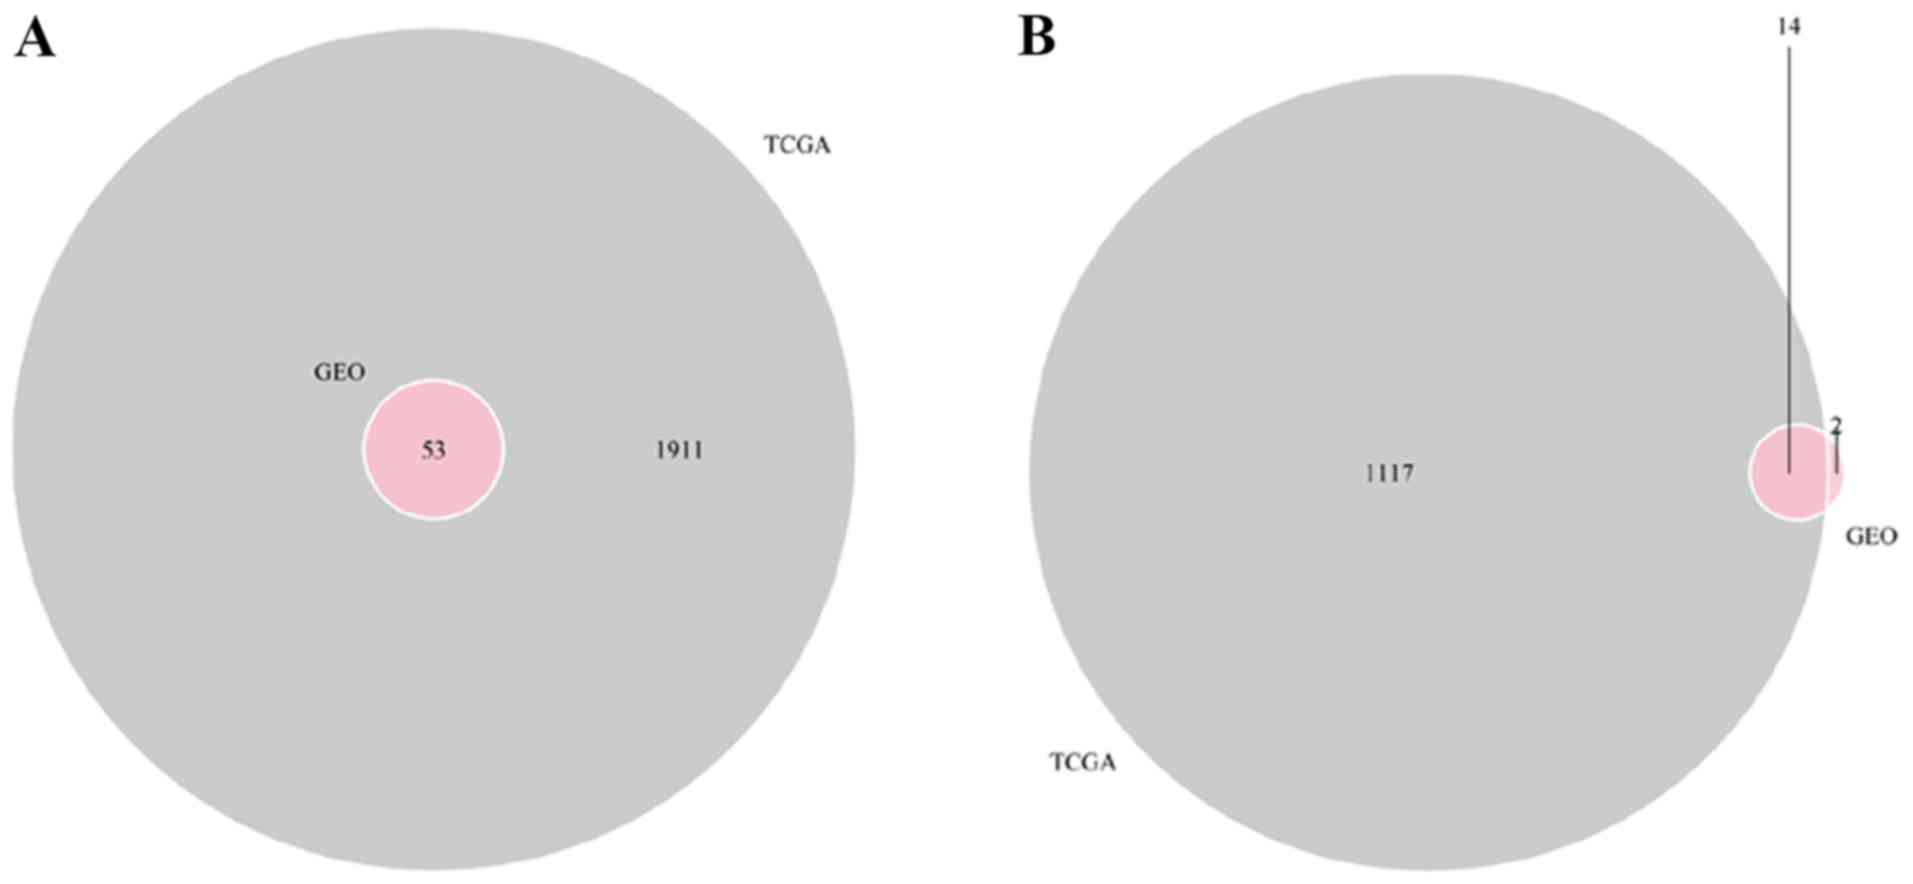
Construction of the ceRNA network
A total of 67 DEmRNAs from the intersections of the
GEO and TCGA databases and 352 DElncRNAs and 141 DEmiRNAs from the
TCGA database were selected in order to construct a ceRNA network.
A Venn diagram demonstrated the intersections of DEmRNAs between
the GEO and TCGA databases (Fig. 6).
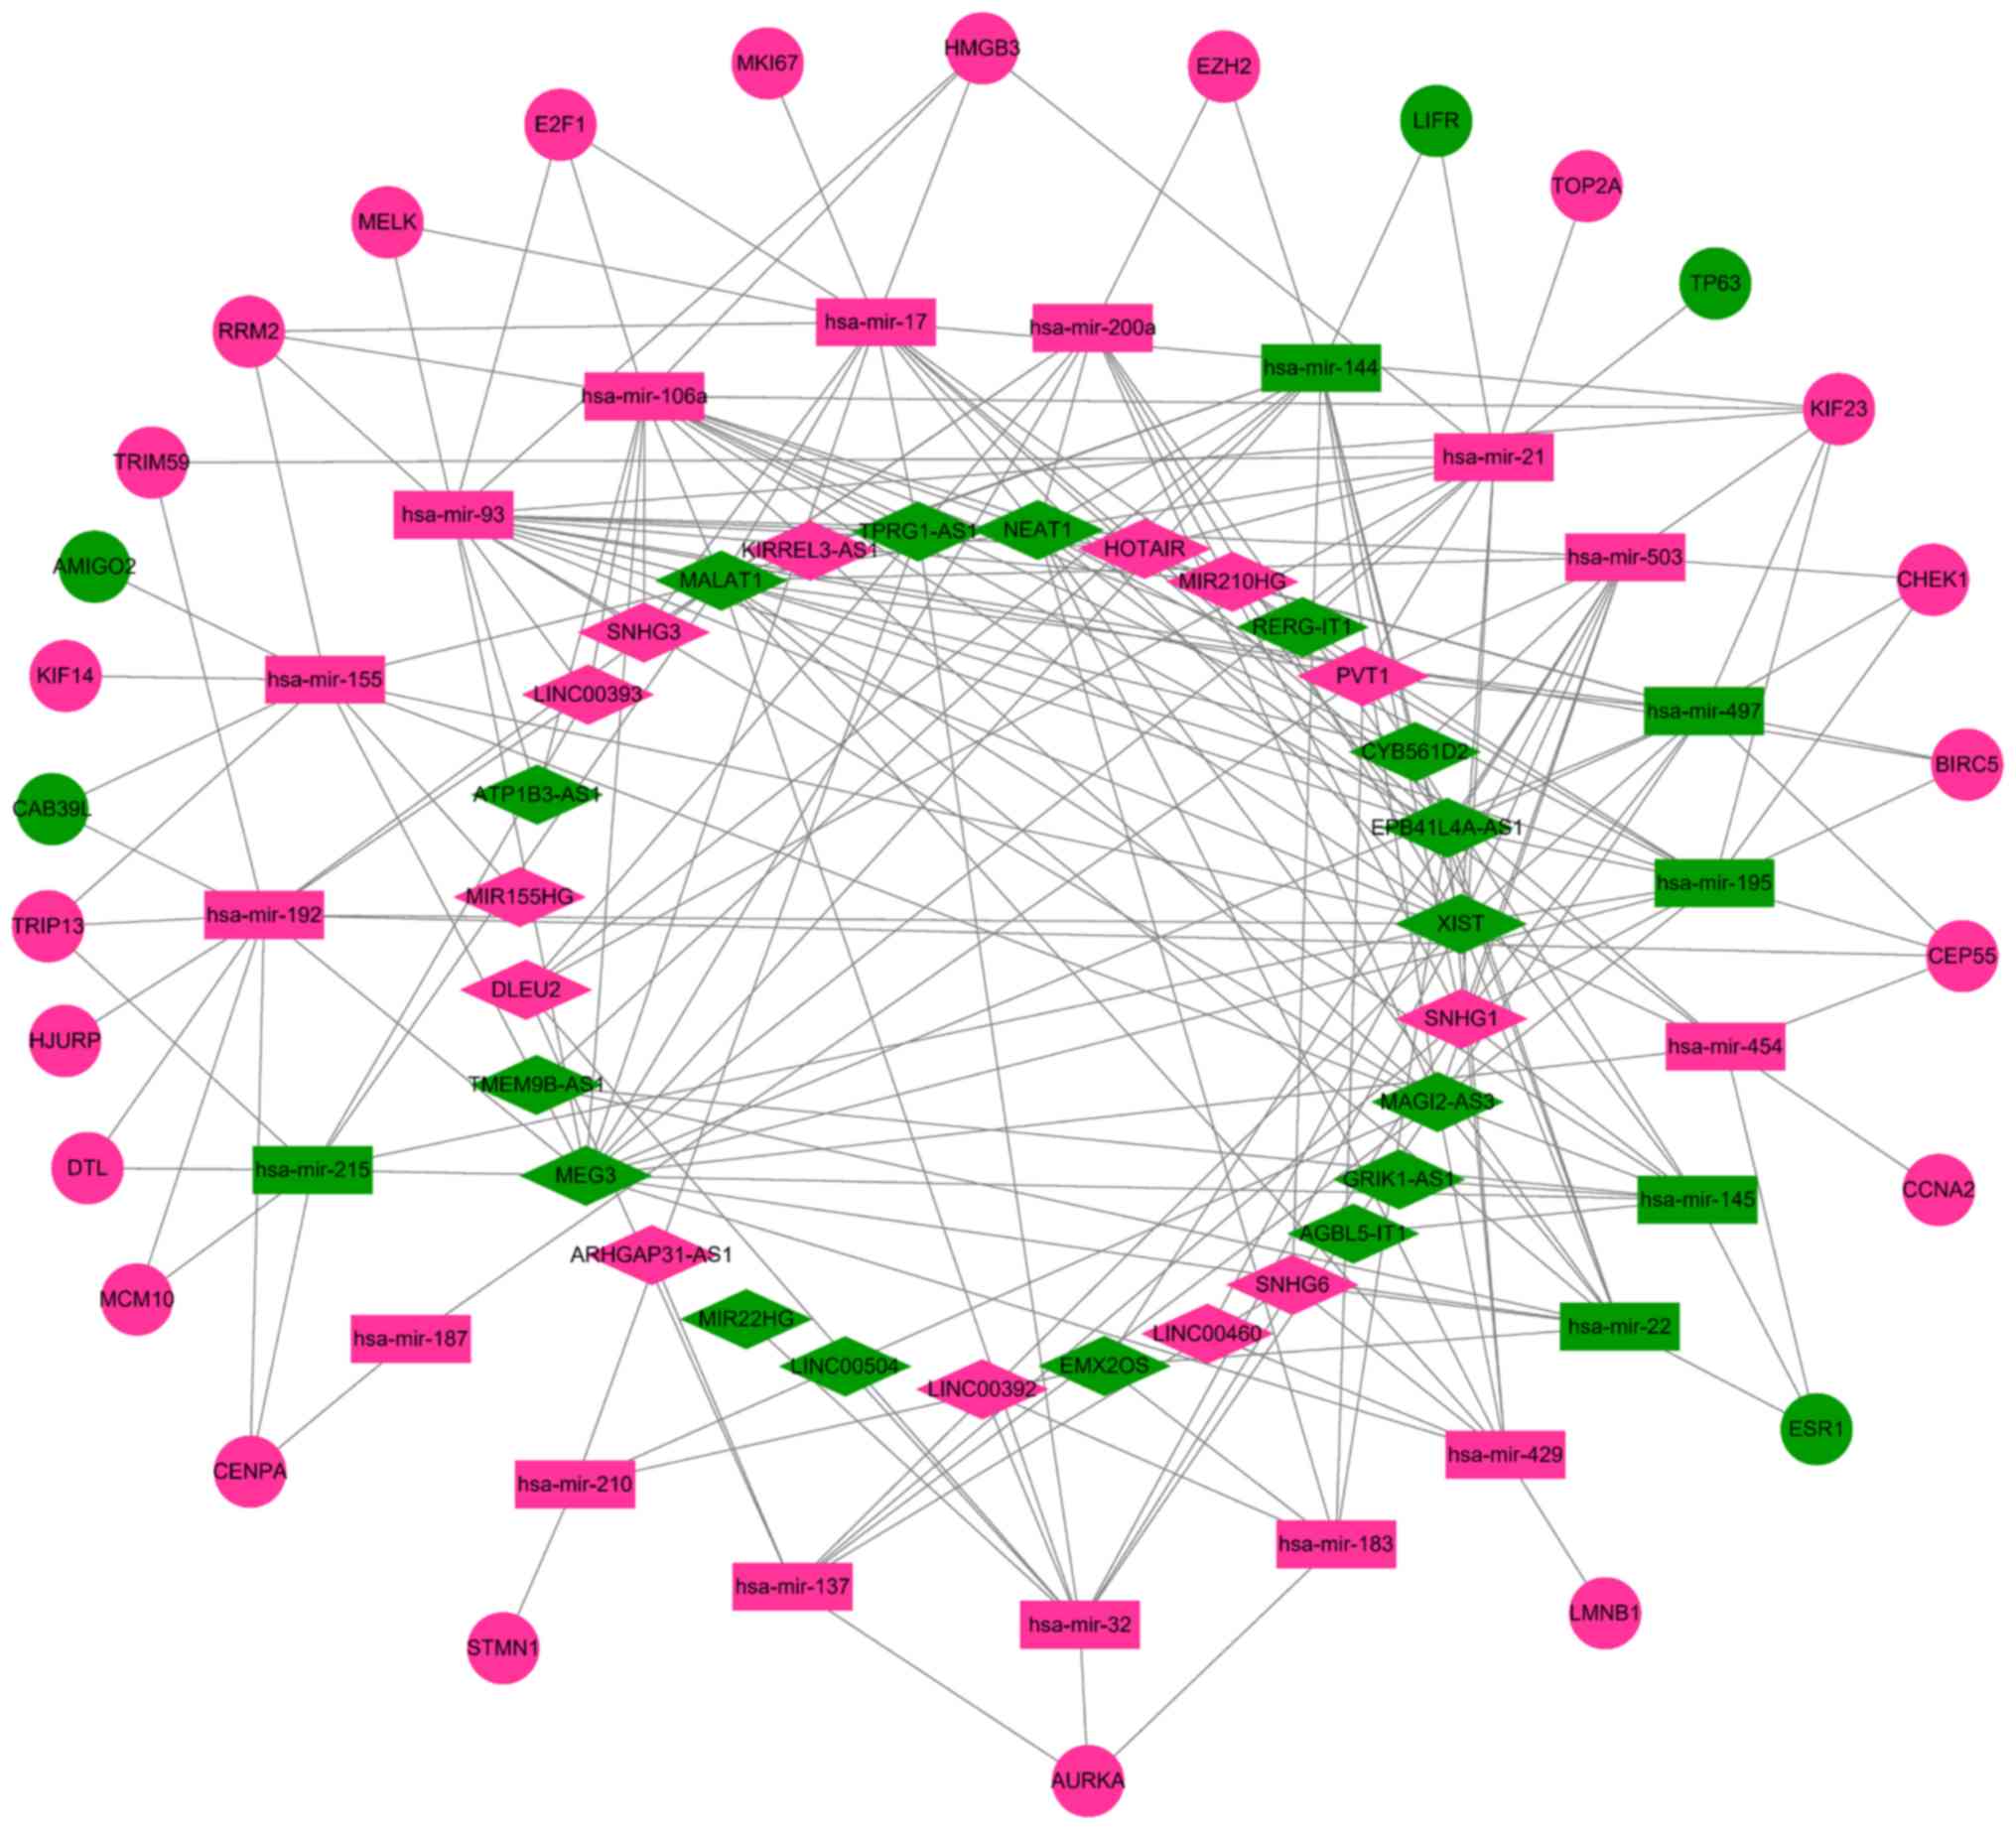
To further understand the functions of the DElncRNAs, DEmiRNAs and
DEmRNAs, a ceRNA network was constructed. In Table III, it is shown that 31 DElncRNAs
interacted with 29 DEmiRNAs retrieved from the miRcode database.
Subsequently, DEmRNAs were searched in the miRTarBase and
TargetScan databases based on the 29 DEmiRNAs. According to results
from both databases, a total of 27 DEmRNAs capable of interacting
with 21 of the 29 DEmiRNAs were chosen (Table IV). Following removal of the
remaining eight DEmiRNAs and the corresponding lncRNAs, 29
DElncRNAs, 21 DEmiRNAs and 27 DEmRNAs were used to establish a
ceRNA network (Fig. 7).
| Table III.miRNAs that may be targeted by
specific lncRNAs in triple-negative breast cancer. |
Table III.
miRNAs that may be targeted by
specific lncRNAs in triple-negative breast cancer.
| lncRNA | miRNA |
|---|
| XIST | miR-503, miR-301b,
miR-454, miR-93, miR-106a, miR-96, miR-137, miR-140, miR-141,
miR-200a, miR-144, miR-155, miR-195, miR-497, miR-17, miR-192,
miR-215, miR-429, miR-204, miR-21, miR-22, miR-32, miR-338 |
| MEG3 | miR-551a, miR-301b,
miR-454, miR-93, miR-106a, miR-96, miR-140, miR-141, miR-200a,
miR-143, miR-144, miR-145, miR-155, miR-195, miR-497, miR-17,
miR-192, miR-215, miR-429, miR-204, miR-21, miR-22, miR-338 |
| MALAT1 | miR-503, miR-93,
miR-106a, miR-96, miR-140, miR-141, miR-200a, miR-143, miR-144,
miR-145, miR-155, miR-195, miR-497, miR-17, miR-192, miR-215,
miR-429, miR-204, miR-21, miR-22, miR-32, miR-338 |
| NEAT1 | miR-503, miR-301b,
miR-454, miR-93, miR-106a, miR-96, miR-140, miR-141, miR-200a,
miR-143, miR-144, miR-195, miR-497, miR-17, miR-183, miR-429,
miR-204, miR-22, miR-338 |
| MAGI2-AS3 | miR-503, miR-93,
miR-106a, miR-137, miR-141, miR-200a, miR-143, miR-144, miR-145,
miR-155, miR-195, miR-497, miR-429, miR-204, miR-210, miR-22,
miR-32 |
| PVT1 | miR-503, miR-551a,
miR-93, miR-106a, miR-140, miR-143, miR-145, miR-195, miR-497,
miR-17, miR-183, miR-187, miR-21 |
| SNHG1 | miR-503, miR-137,
miR-140, miR-141, miR-200a, miR-143, miR-144, miR-145, miR-195,
miR-497, miR-204, miR-21, miR-32 |
| EPB41L4A-AS1 | miR-503, miR-93,
miR-106a, miR-141, miR-200a, miR-195, miR-497, miR-17, miR-183,
miR-429, miR-22, miR-338 |
| DLEU2 | miR-551a, miR-96,
miR-137, miR-141, miR-200a, miR-143, miR-144, miR-21, miR-32 |
| CYB561D2 | miR-503, miR-93,
miR-106a, miR-140, miR-144, miR-22, miR-338 |
| HOTAIR | miR-301b, miR-454,
miR-143, miR-17, miR-93, miR-204, miR-21 |
| SNHG | miR-93, miR-106a,
miR-141, miR-200a, miR-17, miR-338 |
| MIR210HG | miR-551a, miR-93,
miR-106a, miR-145, miR-195, miR-497 |
| TPRG1-AS1 | miR-93, miR-106a,
miR-17, miR-210, miR-32, miR-338 |
| SNHG6 | miR-137, miR-144,
miR-429, miR-204, miR-22 |
| EMX2OS | miR-503, miR-143,
miR-183, miR-210, miR-22 |
| ATP1B3-AS1 | miR-93, miR-106a,
miR-96, miR-204 |
| LINC00393 | miR-93, miR-106a,
miR-192, miR-215 |
| LINC00460 | miR-503, miR-143,
miR-429, miR-338 |
| GRIK1-AS1 | miR-145, miR-204,
miR-338 |
| LINC00504 | miR-140, miR-32,
miR-338 |
| MIR155HG | miR-155, miR-204,
miR-338 |
| TMEM9B-AS1 | miR-144, miR-145,
miR-22 |
| AGBL5-IT1 | miR-145,
miR-204 |
| C6orf99 | miR-140,
miR-338 |
| KIRREL3-AS1 | miR-144,
miR-338 |
| LINC00392 | miR-183,
miR-32 |
| UCA1 | miR-96,
miR-143 |
| ARHGAP31-AS1 | miR-137 |
| MIR22HG | miR-32 |
| RERG-IT1 | miR-21 |
| Table IV.mRNAs that may be targeted by
specific miRNAs in triple-negative breast cancer. |
Table IV.
mRNAs that may be targeted by
specific miRNAs in triple-negative breast cancer.
| miRNA | mRNA |
|---|
| miR-192 | CAB39L, CEP55,
MCM10, TRIM59, CENPA, HJURP, TRIP13, DTL |
| miR-17 | KIF23, HMGB3, RRM2,
E2F1, MKI67, MELK |
| miR-93 | RRM2, E2F1, KIF23,
HMGB3, BIRC5, MELK |
| miR-21 | TOP2A, TRIM59,
LIFR, TP63, HMGB3 |
| miR-155 | TRIP13, RRM2,
CAB39L, AMIGO2, KIF14 |
| miR-215 | TRIP13, CENPA,
MCM10, DTL |
| miR-195 | KIF23, CHEK1,
CEP55, BIRC5 |
| miR-497 | CHEK1, KIF23,
CEP55, BIRC5 |
| miR-106a | RRM2, HMGB3, E2F1,
KIF23 |
| miR-454 | ESR1, CEP55,
CCNA2 |
| miR-503 | KIF23, CHEK1 |
| miR-144 | LIFR, EZH2 |
| miR-32 | AURKA |
| miR-145 | ESR1 |
| miR-183 | AURKA |
| miR-200a | EZH2 |
| miR-187 | CENPA |
| miR-429 | LMNB1 |
| miR-137 | AURKA |
| miR-210 | STMN1 |
| miR-22 | ESR1 |
Survival analysis
To determine whether the expression levels of the 69
DEmRNAs identified from the GEO database and the DEGs included in
the ceRNA network were related to the overall survival of patients
with TNBC, Kaplan-Meier curves were generated based on the gene
expression data and survival information retrieved from the TCGA
database. As a result, three DEmRNAs, tripartite motif containing
59 (TRIM59), exonuclease 1 (EXO1) and RAD51-associated protein 1
(RAD51AP1), one DElncRNA, KIRREL3-antisense RNA 1 (KIRREL3-AS1),
and one DEmiRNA, hsa-mir-106a, were found to be significantly
associated with the prognosis of patients with TNBC (P<0.05;
Fig. 8). Moreover, TRIM59,
KIRREL3-AS1 and hsa-mir-106a were found to be involved in the ceRNA
network. All five survival-related genes were upregulated and the
high expression levels of all five genes were related to better
prognosis.
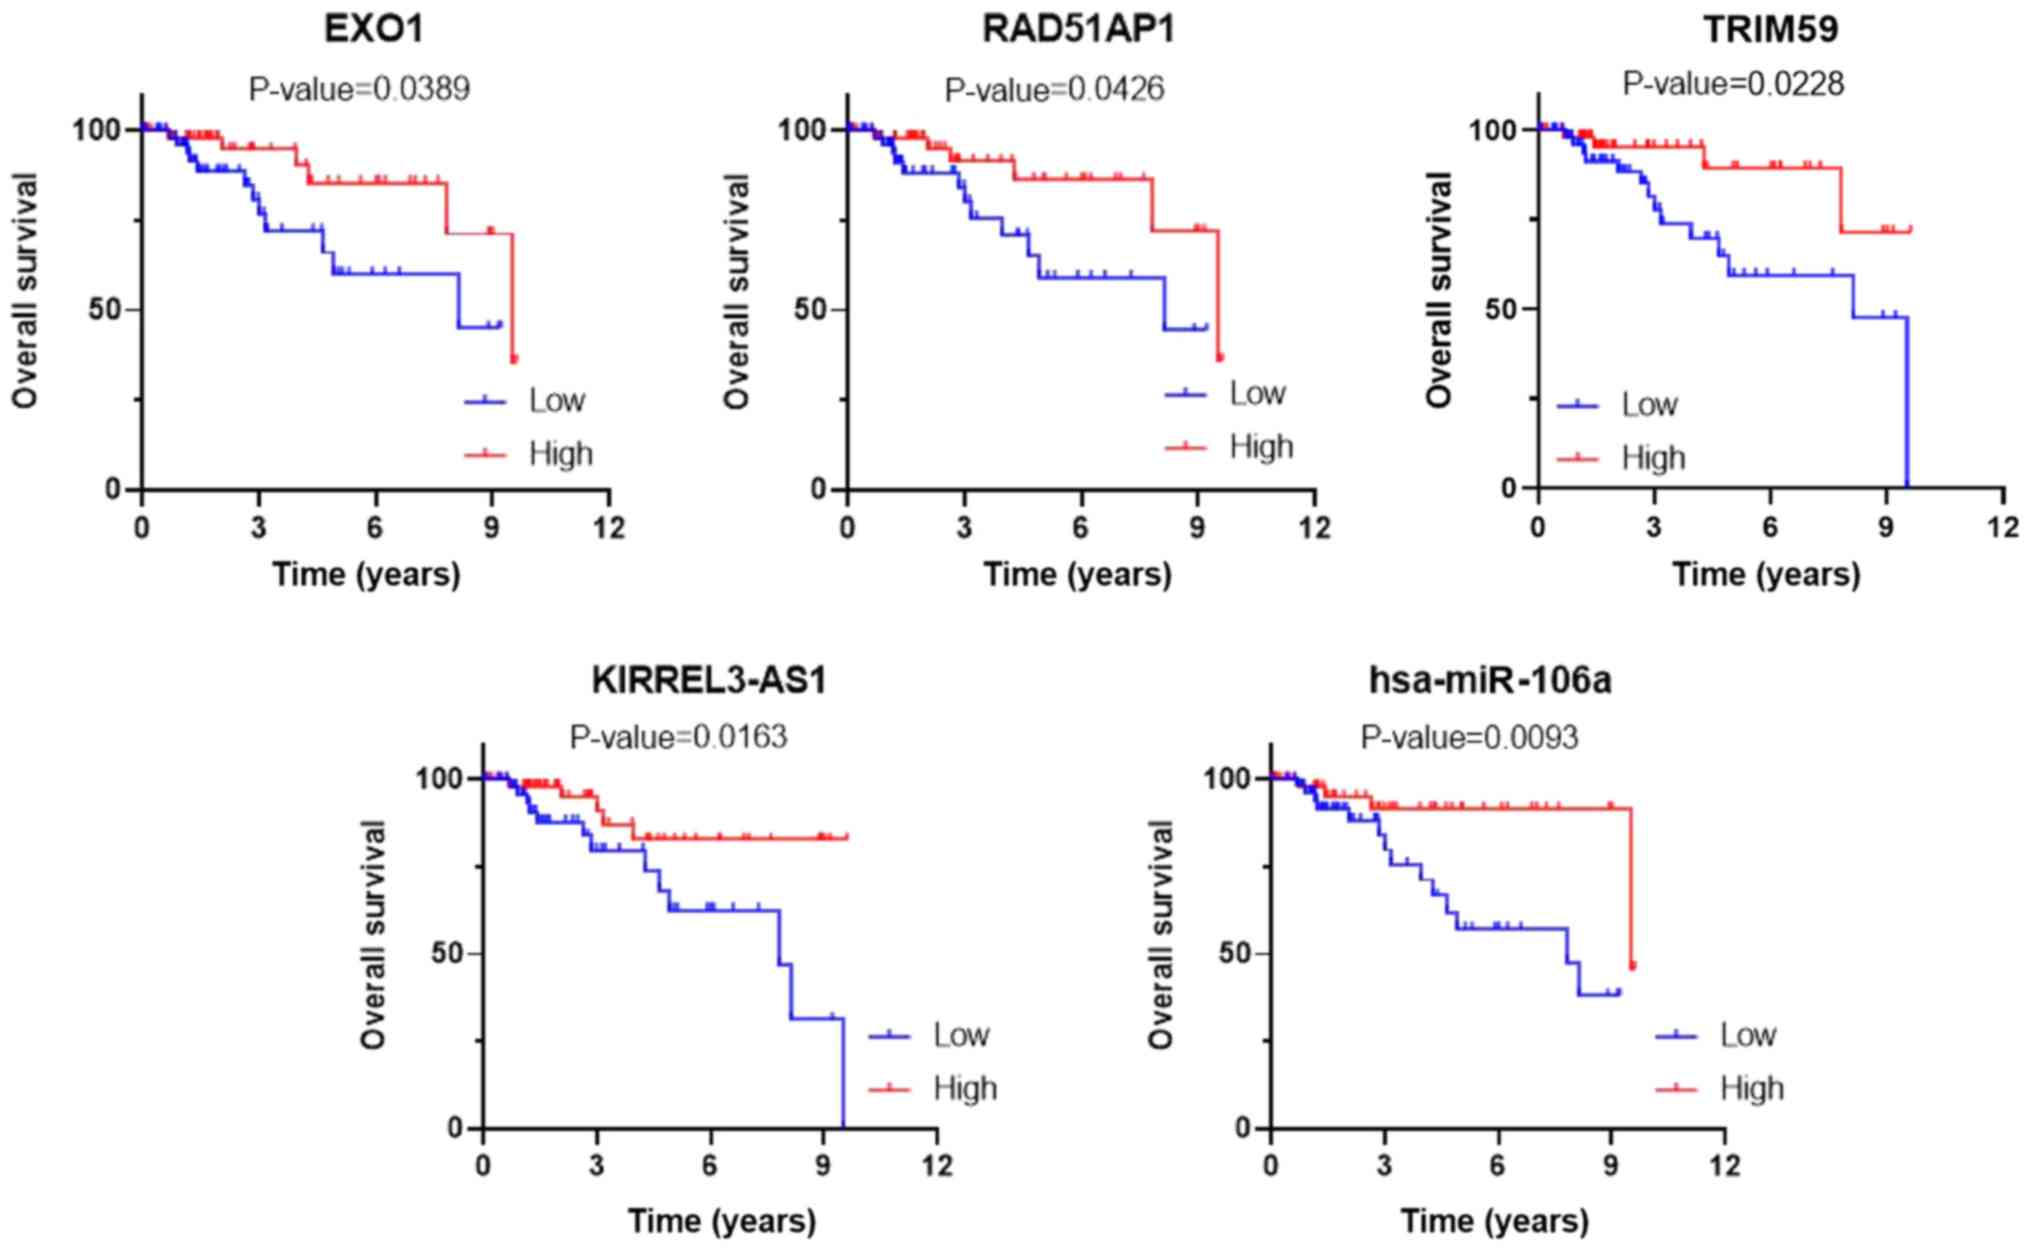 | Figure 8.Kaplan-Meier curves of three DEmRNAs,
TRIM59, EXO1 and RAD51AP1, one DElncRNA, KIRREL3-AS1, and one
DEmiRNA, hsa-mir-106a, associated with overall survival. DE,
differentially expressed; lncRNAs, long non-coding RNAs; TRIM59,
tripartite motif containing 59; EXO1, exonuclease 1; RAD51AP1,
RAD51-associated protein 1; KIRREL3-AS1, KIRREL3-antisense RNA
1. |
Discussion
Five distinct intrinsic breast cancer subtypes have
been identified based on gene expression: i) Luminal A; ii) luminal
B; iii) HER2 overexpressing; iv) basal-like; and v) healthy breast
tissue-like (28–30). Prat et al (31) have also identified a new breast
cancer intrinsic subtype known as claudin-low or mesenchymal-like.
These six subtypes of breast cancer defined by immunohistochemistry
(IHC) demonstrate distinct differences in terms of breast cancer
survival (32). TNBC is regarded as
an aggressive subtype of breast cancer, since it is characterized
by higher rates of progression, metastasis and recurrence than the
other molecular subtypes. This subtype is more commonly diagnosed
in young women (33). The main
therapeutic strategies for the treatment of patients with TNBC are
surgery and chemotherapy. One of the primary factors that
contribute to poor prognosis of patients with TNBC is that few
effective therapeutic targets are available. Therefore, studies on
the underlying mechanisms of the pathogenesis and progression of
TNBC are required for the development of more effective therapeutic
strategies.
Compared with the original long-term fundamental
experimental studies, integrated mining of microarray data and
high-throughput sequencing from public databases appears to be more
comprehensive and highly informative. Furthermore, since a number
of studies have indicated the involvement of ceRNA crosstalk in
diverse biological processes, including tumorigenesis, progression
and metastasis, the comprehensive analysis of lncRNA-miRNA-mRNA
ceRNA networks has become more widely used in the prediction of
candidate RNA signatures in various cancer types (34–36),
including TNBC (37–39). Nonetheless, non-coding RNA-associated
ceRNA networks based on whole-genome gene expression profiling with
large-scale microarray and sequencing data of patients with TNBC
have not been described.
In the current study, seven datasets from studies on
TNBC were downloaded from the publicly available GEO database. The
published original studies, from which the data were obtained, are
discussed in the following text. Komatsu et al (15) identified abnormal spindle microtubule
assembly and centromere protein K as novel molecular targets for
TNBC therapy, since the absence of these genes was found to cause
an arrest in the G2/M and G0/G1 phases of the cell cycle,
respectively, and subsequently induced cell death in TNBC cells.
Mathe et al (16) compared
the genes that were found to be TNBC-specific from their cohort
which consists of patients with TNBC and the The Cancer Genome
Atlas (TCGA) cohort which is an external validation cohort
including patients with TNBC from the TCGA database, and it was
found that four of the genes, namely ankyrin repeat domain 30A,
acidic nuclear phosphoprotein 32 family member E, desmocollin 2 and
interleukin 6 signal transducer (IL6ST), were common to both TNBC
cohorts. The survival curves revealed that high expression of IL6ST
was significantly associated with improved survival outcomes. Liu
et al (17) successfully
developed an mRNA and an integrated mRNA-lncRNA signature based on
eight mRNAs and two lncRNAs. The data from those two signatures
suggested that the lncRNAs HIST2H2BC and SNRPEP4 promoted cell
proliferation and invasion, thus contributing to paclitaxel
resistance in TNBC cells. Romero-Cordoba et al (18) identified a set of altered miRNAs and
experimentally confirmed that a specific miRNA, hsa-mir-342-3p, was
downregulated in TNBC compared with other phenotypes. In addition,
loss of function of miR-342-3p resulted in monocarboxylate
transporter 1 overexpression and contributed to oncogenic metabolic
reprogramming in TNBC. Varley et al (19) analyzed sequencing data in order to
identify breast cancer-associated read-through fusion transcripts.
This analysis led to the identification of SCNN1A-TNFRSF1A and
CTSDIFITM10, two recurrent read-through fusion transcripts found to
involve membrane proteins, which raised the possibility of them
being breast cancer-specific cell surface markers. In order to
fully mine the information of these datasets, multistep processing
and integrated bioinformatics were applied to reveal DEGs in TNBC.
More importantly, a robust rank aggregation (RRA) method was used
to identify stable DEGs among different studies. This method
analyzes prioritized gene lists and finds commonly overlapping
genes, which are ranked consistently better than expected by chance
(40).
Finally, 69 dysregulated mRNAs were identified from
the GEO datasets, including 53 upregulated and 16 downregulated
genes, which are demonstrated in Fig.
3. Subsequently, GO and KEGG functional enrichment analyses
were performed and a PPI network of these DEGs was constructed in
order to demonstrate their characteristics and specific biological
significance. DEGs were further validated in the TCGA database.
Eventually, 29 lncRNAs, 21 miRNAs and 27 mRNAs were selected to
construct a potential lncRNA-miRNA-mRNA ceRNA network by biological
prediction in order to elucidate the interactions and regulatory
mechanisms of DEGs. Finally, Kaplan-Meier curves were generated
using the gene expression data and survival information provided by
the TCGA database to detect prognostic indicators for patients with
TNBC. As a result, three DEmRNAs, namely TRIM59, EXO1 and RAD51AP1,
one DElncRNA, KIRREL3-AS1 and one DEmiRNA, hsa-mir-106a, were
considered to be closely associated with the prognosis of patients
with TNBC. Moreover, TRIM59, KIRREL3-AS1 and hsa-mir-106a were
involved in the ceRNA network. The expression levels of all five
genes were found to be upregulated and related to longer survival
times. Nevertheless, the determination of the nature of protective
factors or risk factors depends on gene expression at both the
transcription and translation levels. Certain DEGs identified in
the present study have been reported to be associated with the
prognosis of breast cancer. As observed by gene expression
profiling, IHC analysis has revealed that the expression of certain
proliferation markers, including Ki67 and Aurora A kinase, is
associated with poor prognosis in ER+ disease (41,42). In
addition, as assessed by IHC, BCL2 expression is a powerful
predictor of favorable prognosis in breast cancer across different
molecular subtypes (43). Despite
these findings, the routine assessment of IHC markers in addition
to ER, PR and HER2 has yet to be implemented in standard clinical
treatment guidelines. Therefore, the remaining survival-related
genes identified in the current study should be further explored in
future studies.
In the present study, miRcode was used to collect
predicted and experimentally validated miRNAs that are targeted by
lncRNAs. In addition, TargetScan and miRTarBase were cooperatively
utilized to determine mRNAs that are targeted by miRNAs. According
to accumulating biological data, numerous computational models for
potential miRNA-disease association inference have been developed,
which are highly useful in research of the underlying molecular
mechanism of human diseases and the development of new drugs for
disease treatment (44–46). In particular, Chen et al
(47) proposed the model of the
Ensemble of Decision Tree-based MiRNA-Disease Association
prediction (EDTMDA) for the identification of miRNA-disease
associations by inputting features that were extracted from
integrated miRNA similarity, disease similarity and known
miRNA-disease associations. It is believed that EDTMDA is able to
make reliable predictions and guide experiments to reveal further
miRNA-disease associations. However, limited studies on
computational models for the prediction of potential lncRNA-disease
associations are available. The involvement of lncRNAs in numerous
biological processes and their important roles in a variety of
complex human diseases have been demonstrated. Therefore, the
development of more effective computational models to identify
potential relationships between lncRNAs and diseases may aid
further understanding of disease mechanisms at the lncRNA molecular
level. Furthermore, the development of a computational model
capable of directly determining mRNAs that are targeted by lncRNAs
would notably reduce the time required for analysis. In conclusion,
research on computational models for the prediction of potential
diseases at the level of gene expression regulation,
post-translational protein modification and cellular environment
may promote the diagnosis, treatment, prognosis and prevention of
human diseases, including TNBC.
Of note, gene expression profiling was conducted
using large-scale microarray and sequencing data of patients with
TNBC. A robust rank aggregation (RRA) method was applied to
comprehensively screen stable DEGs among the different studies.
Furthermore, a network of predicted ceRNA interactions derived from
integrative bioinformatics analysis was successfully constructed.
The reliability of the results was secured by the use of reasonable
screening criteria, sufficient sample size and appropriate
visualization of the results. There are also limitations to the
current study. First, it would be more appropriate to include
paired samples in order to eliminate error among different patients
since each gene expression level varied substantially in different
patients. Secondly, the complex ceRNA network was constructed by
biological prediction based on the hypothesis that lncRNAs may
serve as ceRNAs and, therefore, affect the expression of target
genes by merging miRNAs. Therefore, further research is required
for the verification of the current study results and further
understanding of the molecular mechanisms of the identified RNA
signatures in TNBC.
In conclusion, the present study identified a large
number of cancer-specific and several survival-related DEGs by
integrated analysis of large-scale gene expression profiles from
the GEO and TCGA databases. The predicted lncRNA-miRNA-mRNA ceRNA
network may provide guidance for further studies on the molecular
pathogenesis and progression mechanisms underlying TNBC.
Supplementary Material
Supporting Data
Acknowledgements
The authors would like to thank Mr. Jiwei Li
(Lifegenes Biotechnology, Shanghai, China) for his advice and
technical assistance.
Funding
No funding was received.
Availability of data and materials
The datasets used and/or analyzed during the current
study are available from the corresponding author on reasonable
request.
Authors' contributions
PY and LFT wrote the manuscript and were responsible
for data analysis. GT, LL and PY conceived and designed the study.
GT and LL revised and drafted the manuscript. All authors have read
and approved the final version of the manuscript.
Ethics approval and consent to
participate
Not applicable.
Patient consent for publication
Not applicable.
Competing interests
The authors declare that they have no competing
interests.
References
|
1
|
Onitilo AA, Engel JM, Greenlee RT and
Mukesh BN: Breast cancer subtypes based on ER/PR and Her2
expression: Comparison of clinicopathologic features and survival.
Clin Med Res. 7:4–13. 2009. View Article : Google Scholar : PubMed/NCBI
|
|
2
|
Bauer KR, Brown M, Cress RD, Parise CA and
Caggiano V: Descriptive analysis of estrogen receptor
(ER)-negative, progesterone receptor (PR)-negative, and
HER2-negative invasive breast cancer, the so-called triple-negative
phenotype: A population-based study from the California cancer
registry. Cancer. 109:1721–1728. 2007. View Article : Google Scholar : PubMed/NCBI
|
|
3
|
Dent R, Trudeau M, Pritchard KI, Hanna WM,
Kahn HK, Sawka CA, Lickley LA, Rawlinson E, Sun P and Narod SA:
Triple-negative breast cancer: Clinical features and patterns of
recurrence. Clin Cancer Res. 13:4429–4434. 2007. View Article : Google Scholar : PubMed/NCBI
|
|
4
|
Rakha EA, Elrehim DA, Paish C, Green AR,
Lee AH, Robertson JF, Blamey RW, Macmillan D and Ellis IO: Basal
phenotype identifes a poor prognostic subgroup of breast cancer of
clinical importance. Eur J Cancer. 42:3149–3156. 2006. View Article : Google Scholar : PubMed/NCBI
|
|
5
|
Zaky SS, Lund MJ, May KA, Godette KD,
Beitler JJ, Holmes LR, O'Regan RM, Yu ES, Yu DS and Landry JC: The
negative effect of triple-negative breast cancer on outcome after
breast-conserving therapy. Ann Surg Oncol. 18:2858–2865. 2011.
View Article : Google Scholar : PubMed/NCBI
|
|
6
|
Fatica A and Bozzoni I: Long non-coding
RNAs: New players in cell differentiation and development. Nat Rev
Genet. 15:7–21. 2014. View
Article : Google Scholar : PubMed/NCBI
|
|
7
|
Deva Magendhra Rao AK, Patel K, Korivi
Jyothiraj S, Meenakumari B, Sundersingh S, Sridevi V, Rajkumar T,
Pandey A, Chatterjee A, Gowda H and Mani S: Identification of
lncRNAs associated with early stage breast cancer and their
prognostic implications. Mol Oncol. 13:1342–1355. 2019.PubMed/NCBI
|
|
8
|
Chen X, Yan CC, Zhao X and You ZH: Long
non-coding RNAs and complex diseases: From experimental results to
computational models. Brief Bioinform. 18:558–576. 2017.PubMed/NCBI
|
|
9
|
Bertoli G, Cava C and Castiglioni I:
MicroRNAs: New biomarkers for diagnosis, prognosis, therapy
prediction and therapeutic tools for breast cancer. Theranostics.
5:1122–1143. 2015. View Article : Google Scholar : PubMed/NCBI
|
|
10
|
Haakensen VD, Nygaard V, Greger L, Aure
MR, Fromm B, Bukholm IR, Luders T, Chin SF, Git A, Caldas C, et al:
Subtype-specific micro-RNA expression signatures in breast cancer
progression. Int J Cancer. 139:1117–1128. 2016. View Article : Google Scholar : PubMed/NCBI
|
|
11
|
Chen X, Xie D, Zhao Q and You ZH:
Micrornas and complex diseases: From experimental results to
computational models. Brief Bioinform. 20:515–539. 2019. View Article : Google Scholar : PubMed/NCBI
|
|
12
|
Salmena L, Poliseno L, Tay Y, Kats L and
Pandolfi PP: A ceRNA hypothesis: The rosetta stone of a hidden RNA
language? Cell. 146:353–358. 2011. View Article : Google Scholar : PubMed/NCBI
|
|
13
|
He R, Liu P, Xie X, Zhou Y, Liao Q, Xiong
W, Li X, Li G, Zeng Z and Tang H: circGFRA1 and GFRA1 act as ceRNAs
in triple negative breast cancer by regulating miR-34a. J Exp Clin
Cancer Res. 36:1452017. View Article : Google Scholar : PubMed/NCBI
|
|
14
|
Li S, Zhou J, Wang Z, Wang P, Gao X and
Wang Y: Long noncoding RNA GAS5 suppresses triple negative breast
cancer progression through inhibition of proliferation and invasion
by competitively binding miR-196a-5p. Biomed Pharmacother.
104:451–457. 2018. View Article : Google Scholar : PubMed/NCBI
|
|
15
|
Komatsu M, Yoshimaru T, Matsuo T, Kiyotani
K, Miyoshi Y, Tanahashi T, Rokutan K, Yamaguchi R, Saito A, Imoto
S, et al: Molecular features of triple negative breast cancer cells
by genome-wide gene expression profiling analysis. Int J Oncol.
42:478–506. 2013. View Article : Google Scholar : PubMed/NCBI
|
|
16
|
Mathe A, Wong-Brown M, Morten B, Forbes
JF, Braye SG, Avery-Kiejda KA and Scott RJ: Novel genes associated
with lymph node metastasis in triple negative breast cancer. Sci
Rep. 5:158322015. View Article : Google Scholar : PubMed/NCBI
|
|
17
|
Liu YR, Jiang YZ, Xu XE, Hu X, Yu KD and
Shao ZM: Comprehensive transcriptome profiling reveals multigene
signatures in triple-negative breast cancer. Clin Cancer Res.
22:1653–1662. 2016. View Article : Google Scholar : PubMed/NCBI
|
|
18
|
Romero-Cordoba SL, Rodriguez-Cuevas S,
Bautista-Pina V, Maffuz-Aziz A, D'Ippolito E, Cosentino G, Baroni
S, Iorio MV and Hidalgo-Miranda A: Loss of function of miR-342-3p
results in MCT1 over-expression and contributes to oncogenic
metabolic reprogramming in triple negative breast cancer. Sci Rep.
8:122522018. View Article : Google Scholar : PubMed/NCBI
|
|
19
|
Varley KE, Gertz J, Roberts BS, Davis NS,
Bowling KM, Kirby MK, Nesmith AS, Oliver PG, Grizzle WE, Forero A,
et al: Recurrent read-through fusion transcripts in breast cancer.
Breast Cancer Res Treat. 146:287–297. 2014. View Article : Google Scholar : PubMed/NCBI
|
|
20
|
Moradifard S, Hoseinbeyki M, Ganji SM and
Minuchehr Z: Analysis of microRNA and gene expression profiles in
Alzheimer's disease: A meta analysis approach. Sci Rep. 8:47672018.
View Article : Google Scholar : PubMed/NCBI
|
|
21
|
Ritchie ME, Phipson B, Wu D, Hu Y, Law CW,
Shi W and Smyth GK: Limma powers differential expression analyses
for RNA-sequencing and microarray studies. Nucleic Acids Res.
43:e472015. View Article : Google Scholar : PubMed/NCBI
|
|
22
|
Kolde R, Laur S, Adler P and Vilo J:
Robust rank aggregation for gene list integration and
meta-analysis. Bioinformatics. 28:573–580. 2012. View Article : Google Scholar : PubMed/NCBI
|
|
23
|
Shi KQ, Lin Z, Chen XJ, Song M, Wang YQ,
Cai YJ, Yang NB, Zheng MH, Dong JZ, Zhang L and Chen YP:
Hepatocellular carcinoma associated microRNA expression signature:
Integrated bioinformatics analysis, experimental validation and
clinical significance. Oncotarget. 6:25093–25108. 2015. View Article : Google Scholar : PubMed/NCBI
|
|
24
|
Yang J, Han S, Huang W, Chen T, Liu Y, Pan
S and Li S: A meta-analysis of microRNA expression in liver cancer.
PLoS One. 9:e1145332014. View Article : Google Scholar : PubMed/NCBI
|
|
25
|
Huang da W, Sherman BT and Lempicki RA:
Systematic and integrative analysis of large gene lists using DAVID
bioinformatics resources. Nat Protoc. 4:44–57. 2009. View Article : Google Scholar : PubMed/NCBI
|
|
26
|
Szklarczyk D, Morris JH, Cook H, Kuhn M,
Wyder S, Simonovic M, Santos A, Doncheva NT, Roth A, Bork P, et al:
The STRING database in 2017: Quality-controlled protein-protein
association networks, made broadly accessible. Nucleic Acids Res.
45:D362–D368. 2017. View Article : Google Scholar : PubMed/NCBI
|
|
27
|
Shannon P, Markiel A, Ozier O, Baliga NS,
Wang JT, Ramage D, Amin N, Schwikowski B and Ideker T: Cytoscape: A
software environment for integrated models of biomolecular
interaction networks. Genome Res. 13:2498–2504. 2003. View Article : Google Scholar : PubMed/NCBI
|
|
28
|
Perou CM, Sørlie T, Eisen MB, van de Rijn
M, Jeffrey SS, Rees CA, Pollack JR, Ross DT, Johnsen H, Akslen LA,
et al: Molecular portraits of human breast tumours. Nature.
406:747–752. 2000. View
Article : Google Scholar : PubMed/NCBI
|
|
29
|
Sørlie T, Perou CM, Tibshirani R, Aas T,
Geisler S, Johnsen H, Hastie T, Eisen MB, van de Rijn M, Jeffrey
SS, et al: Gene expression patterns of breast carcinomas
distinguish tumor subclasses with clinical implications. Proc Natl
Acad Sci USA. 98:10869–10874. 2001. View Article : Google Scholar : PubMed/NCBI
|
|
30
|
Sorlie T, Tibshirani R, Parker J, Hastie
T, Marron JS, Nobel A, Deng S, Johnsen H, Pesich R, Geisler S, et
al: Repeated observation of breast tumor subtypes in independent
gene expression data sets. Proc Natl Acad Sci USA. 100:8418–8423.
2003. View Article : Google Scholar : PubMed/NCBI
|
|
31
|
Prat A, Parker JS, Karginova O, Fan C,
Livasy C, Herschkowitz JI, He X and Perou CM: Phenotypic and
molecular characterization of the claudin-low intrinsic subtype of
breast cancer. Breast Cancer Res. 12:R682010. View Article : Google Scholar : PubMed/NCBI
|
|
32
|
Blows FM, Driver KE, Schmidt MK, Broeks A,
van Leeuwen FE, Wesseling J, Cheang MC, Gelmon K, Nielsen TO,
Blomqvist C, et al: Subtyping of breast cancer by
immunohistochemistry to investigate a relationship between subtype
and short and long term survival: A collaborative analysis of data
for 10,159 cases from 12 studies. PLoS Med. 7:e10002792010.
View Article : Google Scholar : PubMed/NCBI
|
|
33
|
Carey LA, Perou CM, Livasy CA, Dressler
LG, Cowan D, Conway K, Karaca G, Troester MA, Tse CK, Edmiston S,
et al: Race, breast cancer subtypes, and survival in the carolina
breast cancer study. JAMA. 295:2492–2502. 2006. View Article : Google Scholar : PubMed/NCBI
|
|
34
|
Long J, Bai Y, Yang X, Lin J, Yang X, Wang
D, He L, Zheng Y and Zhao H: Construction and comprehensive
analysis of a ceRNA network to reveal potential prognostic
biomarkers for hepatocellular carcinoma. Cancer Cell Int.
19:902019. View Article : Google Scholar : PubMed/NCBI
|
|
35
|
Zhang X, Zhang W, Jiang Y, Liu K, Ran L
and Song F: Identification of functional lncRNAs in gastric cancer
by integrative analysis of GEO and TCGA data. J Cell Biochem.
120:17898–17911. 2019.PubMed/NCBI
|
|
36
|
Wang X, Ding Y, Da B, Fei Y and Feng G:
Identification of potential prognostic long non-coding RNA
signatures based on a competing endogenous RNA network in lung
adenocarcinoma. Oncol Rep. 40:3199–3212. 2018.PubMed/NCBI
|
|
37
|
Zhu H, Dai M, Chen X, Chen X, Qin S and
Dai S: Integrated analysis of the potential roles of miRNA-mRNA
networks in triple negative breast cancer. Mol Med Rep.
16:1139–1146. 2017. View Article : Google Scholar : PubMed/NCBI
|
|
38
|
Yang R, Xing L, Wang M, Chi H, Zhang L and
Chen J: Comprehensive analysis of differentially expressed profiles
of lncRNAs/mRNAs and miRNAs with associated cerna networks in
triple-negative breast cancer. Cell Physiol Biochem. 50:473–488.
2018. View Article : Google Scholar : PubMed/NCBI
|
|
39
|
Yuan N, Zhang G, Bie F, Ma M, Ma Y, Jiang
X, Wang Y and Hao X: Integrative analysis of lncRNAs and miRNAs
with coding RNAs associated with ceRNA crosstalk network in triple
negative breast cancer. Onco Targets Ther. 10:5883–5897. 2017.
View Article : Google Scholar : PubMed/NCBI
|
|
40
|
Võsa U, Kolde R, Vilo J, Metspalu A and
Annilo T: Comprehensive meta-analysis of microrna expression using
a robust rank aggregation approach. Methods Mol Biol. 1182:361–373.
2014. View Article : Google Scholar : PubMed/NCBI
|
|
41
|
Cheang MC, Chia SK, Voduc D, Gao D, Leung
S, Snider J, Watson M, Davies S, Bernard PS, Parker JS, et al: Ki67
index, HER2 status, and prognosis of patients with luminal B breast
cancer. J Natl Cancer Inst. 101:736–750. 2009. View Article : Google Scholar : PubMed/NCBI
|
|
42
|
Ali HR, Dawson SJ, Blows FM, Provenzano E,
Pharoah PD and Caldas C: Aurora kinase A outperforms Ki67 as a
prognostic marker in ER-positive breast cancer. Br J Cancer.
106:1798–1806. 2012. View Article : Google Scholar : PubMed/NCBI
|
|
43
|
Dawson SJ, Makretsov N, Blows FM, Driver
KE, Provenzano E, Le Quesne J, Baglietto L, Severi G, Giles GG,
McLean CA, et al: BCL2 in breast cancer: A favourable prognostic
marker across molecular subtypes and independent of adjuvant
therapy received. Br J Cancer. 103:668–675. 2010. View Article : Google Scholar : PubMed/NCBI
|
|
44
|
Chen X and Huang L: LRSSLMDA: Laplacian
regularized sparse subspace learning for miRNA-disease association
prediction. PLoS Comput Biol. 13:e10059122017. View Article : Google Scholar : PubMed/NCBI
|
|
45
|
Chen X, Yin J, Qu J and Huang L: MDHGI:
Matrix decomposition and heterogeneous graph inference for
miRNA-disease association prediction. PLoS Comput Biol.
14:e10064182018. View Article : Google Scholar : PubMed/NCBI
|
|
46
|
Chen X, Wang L, Qu J, Guan NN and Li JQ:
Predicting miRNA-disease association based on inductive matrix
completion. Bioinformatics. 34:4256–4265. 2018.PubMed/NCBI
|
|
47
|
Chen X, Zhu CC and Yin J: Ensemble of
decision tree reveals potential miRNA-disease associations. PLoS
Comput Biol. 15:e10072092019. View Article : Google Scholar : PubMed/NCBI
|