Introduction
Endometrial cancer (EC) is a clinically
heterogeneous disease (1). Although
the majority of patients have favorable outcomes due to early
symptoms and early treatment, those with high grade, high stage and
serous type generally have a poor prognosis (1,2).
Stratification of patients into different risk groups aids
physicians in making clinical management decisions with respect to
adjuvant chemotherapy and postoperative surveillance.
Stratification is traditionally based on histological type, tumor
grade, stage and lymph node invasion (1,3).
However, interobserver disagreement in grade and histological type
assignment is common (4,5). In addition, grade 3 tumors comprise a
subset of ECs with significant differences in prognosis (6), and 8–10% of early-stage ECs develop
recurrence and distant metastasis (7). High-throughput sequencing and
bioinformatics analyses have revealed that cancers of the same
grade and histological type may have distinct molecular and genomic
profiles, which may account for the differences in patient
outcomes. In 2013, based on a combination of somatic copy number
alterations, tumor mutation burden, and microsatellite instability,
The Cancer Genome Atlas (TCGA) database classified ECs into the
following four molecular subtypes: Polymerase ε ultramutated
(POLE), microsatellite instability (MSI) hypermutated, copy number
low (CNL) and copy number high (CNH) (8). These molecular subtypes also have
prognostic implications. However, determining these molecular
subtypes require the next generation sequencing and bioinformatics
analysis which are too expensive and cumbersome for widespread
implementation in routine clinical practice (8). Therefore, more accurate molecular
prognostic markers and improved approaches are required to identify
patients who are at high-risk.
Metastasis, a process that involves dissociation,
homing and growth of tumor cells in distant organs, is responsible
for most cases of cancer-associated mortality (9). Adhesion to the extracellular matrix
(ECM) is a critical process for tumor cells migration, in which a
large group of diverse cell adhesion molecules (CAMs) serve a
significant role in cell-cell interactions and the interaction
between cells and ECM (10–13). The ECM is a natural niche for cell
residence, where the CAM-mediated interaction with surface ligands
leads to the activation of crucial signaling associated with cell
proliferation, differentiation and spreading (10–13).
Although the molecular events in numerous CAMs involved in
dissemination are not fully understood, CAMs could be promising
biomarkers for the diagnosis, prognosis and therapy of cancer
metastasis. There are five main classes of CAMs: Immunoglobulin
superfamily proteins, selectins, cadherins, integrins and mucins
(13). Some CAMs are found
dysregulated in several types of cancer and are associated with
cancer progression and survival. For example, higher expression of
L1 cell adhesion molecule (L1CAM) is associated with poor survival
in breast cancer, pancreatic cancer, colorectal cancer, ovarian
cancer and endometrial cancer (14–16).
Mucin 15, cell surface associated (MUC15), is overexpressed in
glioma and papillary thyroid carcinoma and correlates with tumor
progression (17,18). Cell adhesion associated, oncogene
regulated (CDON), is detected in high-grade tumor, rather than low
grade non-small cell lung cancer (19). The expression of immunoglobulin
superfamily member 9B (IGSF9B) is associated with shorter survival
in breast cancer patient (20). High
expression of basal cell adhesion molecule (Lutheran blood group)
(BCAM) is significantly associated with advanced stage of bladder
cancer (21). CEA cell adhesion
molecule 21 (CEACAM21) are overexpressed in the immune active
samples of high grade serous ovarian cancers which showed a
statistically significant better disease free survival over the
immune silent one (22). Integrin
subunit αL (ITGAL) constitutes one of the 10-gene expression
signature that correlated with poor survival of renal cancer
(23). However, a comprehensive
study of the role of CAMs in cancer progression is lacking,
particularly in EC. Based on the vital role of numerous CAMs in
cancer (10–13) and their context-dependent expression
in different tissues, we hypothesized that a set of CAMs different
from that in other cancers may be up- or downregulated in EC, and
that their comprehensive effects determine the behavior of
endometrial cancer cells during metastasis.
In the present study, the expression levels of 225
members of the CAM family were analyzed and the associations
between these CAMs and outcomes in patients with EC were
investigated using data from TCGA and the International Cancer
Genome Consortium (ICGC) databases. The results of the present
study may provide novel insights into the molecular pathogenesis of
progression of EC, as well as identifying novel biomarker
candidates.
Materials and methods
Source of data and sample
selection
CAM genes were retrieved from the gene database of
the National Center for Biotechnology Information (https://www.ncbi.nlm.nih.gov/). A total of 225 genes
belonging to cadherins, mucins, selectins, integrins, the
immunoglobulin superfamily and other CAMs were included in the
present study (Table SI). The mRNA
expression data of Endometrial Carcinoma (EC; 583 cases; Dataset
ID: TCGA-UCEC.htseq_fpkm.tsv; version 10-27-2017), corresponding
clinical information (605 cases; version 10-27-2017) and survival
data (592 cases; version 10-27-2017) were downloaded from the
University of California Santa Cruz (UCSC) Xena browser (https://xenabrowser.net). Log2 (FPKM+1)
transformed expression data were used for all of analyses. Normal
solid tissue samples, as well as repeated and recurrent samples,
were excluded. Finally, 543 cases with both sequencing data of the
primary tumor and clinicopathological data were selected and used
in the analyses. Information regarding the molecular subtypes of
these cases was obtained from cBioportal [www.cbioportal.org; Dataset, Uterine Corpus
Endometrial Carcinoma (TCGA, Nature 2013)], in which 232 patients
with complete sequencing data were divided into four groups (POLE,
MSI, CNL and CNH) based on a combination of somatic copy number
alterations, tumor mutation burden and microsatellite instability.
Data from an independent cohort from ICGC (24) were downloaded from UCSC Xena browser,
504 cases with both expression (dataset, gene expression RNAseq-US
projects) and survival data (dataset, phenotype-OS) of EC were
selected and used for validation. Immunohistochemistry (IHC)
results of some CAMs on EC samples were obtained by searching the
Human Protein Atlas database (HPA; http://www.proteinatlas.org).
Statistical analysis
Statistical analysis was performed using GraphPad
Prism software (v.7.0; GraphPad Software, Inc.) and the Statistical
Package for Social Sciences for Windows (v.20.0; IBM Corp.). The
normality of data distribution was evaluated using the Shapiro-Wilk
test. The Student's t-test and Mann-Whitney U-test were used to
compare the means between two groups for normally and non-normally
distributed continuous data, respectively. For comparisons among
three or more groups, one-way analysis of variance and
Kruskal-Wallis test were used for normally and non-normally
distributed continuous data, respectively. VennPainter V.1.2.0
(https://github.com/linguoliang/VennPainter/releases)
was used to show the shared sets of differentially expressed genes
(DEGs) among different clinicopathological categories. The
Kaplan-Meier method was used to compare relapse-free survival (RFS)
and overall survival (OS) between different groups, and the
log-rank test was used to examine the statistical significance. RFS
was defined as time from surgery to the date of tumor recurrence,
metastasis or mortality. OS of patients was calculated from the
date of initial diagnosis to the date of death or last follow-up,
and expressed in terms of days. All cases of mortality were
considered as events, irrespective of the cause. The Cox
proportional hazards regression model was used for multivariate
analysis to compare the influence of expression of CAMs on survival
along with other clinicopathological characteristics, including
stage, grade, age, lymph node status, peritoneal cytology and
histological subtype. Only covariates significantly associated with
outcomes in univariate analysis were included in multivariate Cox
regression analysis. The backward method was selected for entering
variables into the multivariate Cox regression model. Results were
reported as hazard ratios (HRs) with 95% CIs. For survival
analysis, patients were divided into high- and low-expression
groups using optimum cut-off points determined using the X-tile
software v3.6.1 (25). A total of
334 cases were available for multivariate Cox analysis after the
incomplete data were excluded. P<0.05 was considered to indicate
a statistically significant difference.
Results
Processing and classification of
patients' clinical data
Through analysis of the clinical data, 543 primary
tumors were stratified into different prognostic risk groups
according to International Federation of Gynecology and Obstetrics
stage (26), histological subtype
(3), tumor pathological grade
(3), lymph nodes status, peritoneal
cytology, and recurrence and metastasis following treatment
(Table I). The four molecular
subtypes for 232 samples are also shown in Table I. Patient age ranged between 31 and
90 years, with a median age of 66 years. The follow-up time ranged
between 4 and 6,859 days, with a median follow-up time of 909
days.
 | Table I.Characteristics of patients with
endometrial cancer downloaded from The Cancer Genome Atlas
database. |
Table I.
Characteristics of patients with
endometrial cancer downloaded from The Cancer Genome Atlas
database.
| Characteristic | Patients, n | Percentage |
|---|
| FIGO stage | 543 |
|
| I | 339 | 62.43 |
| II | 51 | 9.39 |
| III | 124 | 22.84 |
| IV | 29 | 5.34 |
| Histological
type | 543 |
|
|
Endometrioid | 407 | 74.95 |
|
Mixed | 22 | 4.05 |
|
Serous | 114 | 21.00 |
| Pathology grade | 543 |
|
| G1 | 98 | 18.05 |
| G2 | 120 | 22.10 |
| G3 | 325 | 59.85 |
| Lymph node | 447 |
|
|
Positive | 84 | 18.79 |
|
Negative | 363 | 81.21 |
| Peritoneal
cytology | 407 |
|
|
Positive | 57 | 14.00 |
|
Negative | 350 | 86.00 |
| Molecular
subtype | 232 |
|
|
POLE | 17 | 7.33 |
|
MSI | 65 | 28.02 |
|
CNL | 90 | 38.79 |
|
CNH | 60 | 25.86 |
| Recurrence and
metastasis | 463 |
|
|
Positive | 70 | 15.12 |
|
Negative | 393 | 84.88 |
Expression of CAMs and their
association with clinicopathological features in patients with
EC
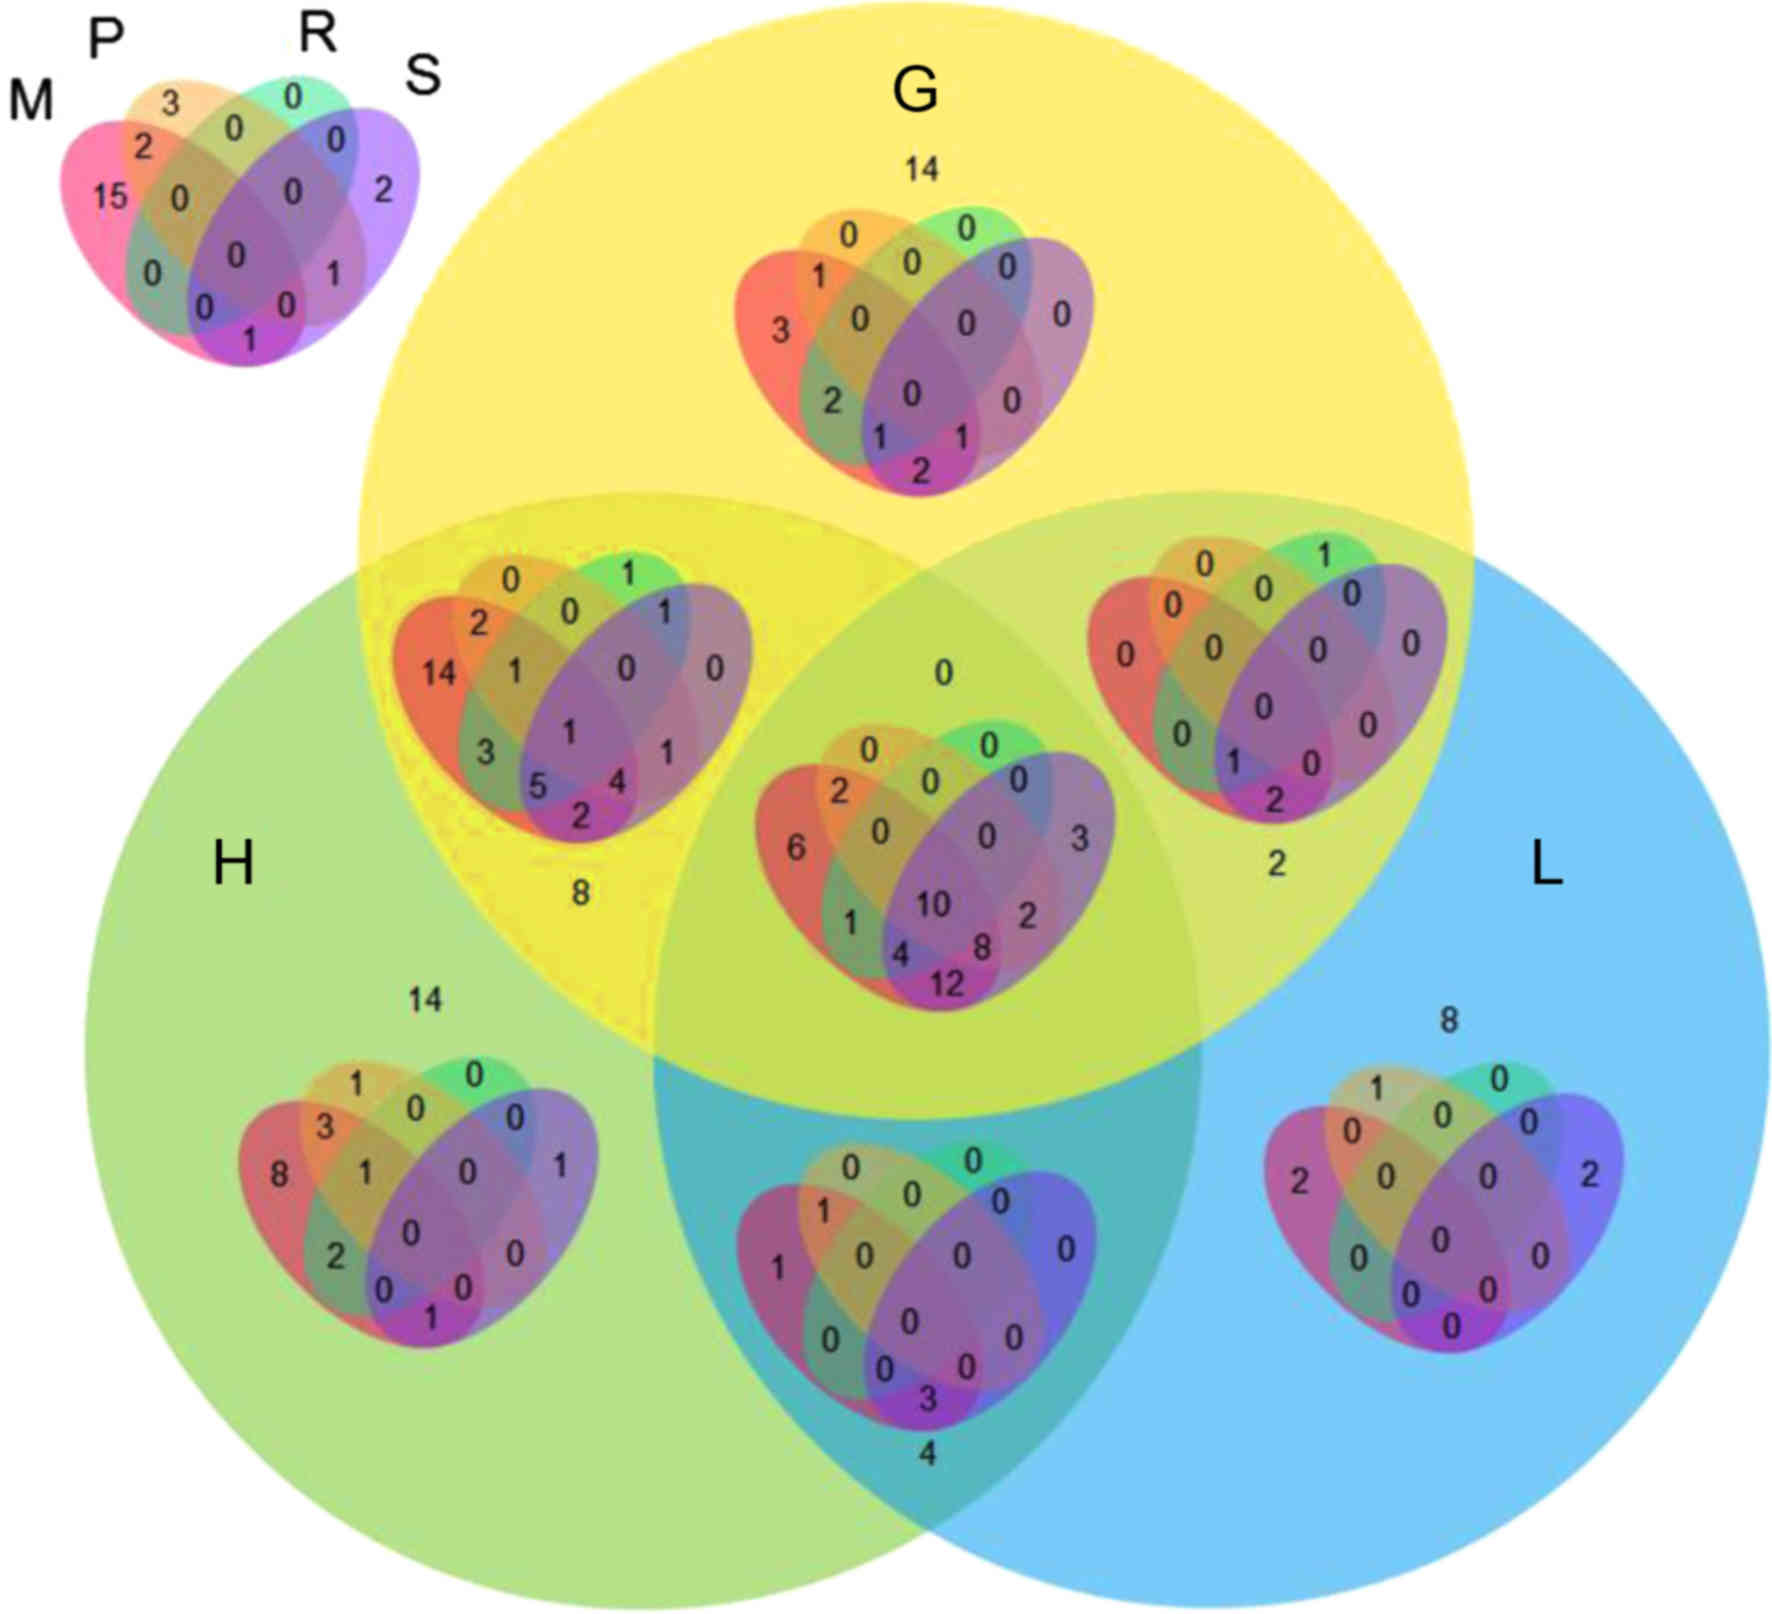
By analyzing the expression levels of 225 members of
the CAM family (Table SI),
differentially expressed CAMs were identified in samples of
different clinicopathological and molecular phenotypes, including
72 in different stages, 120 in different grades, 131 in different
histological types, 129 in different molecular subtypes, 76 in
samples with different lymph nodes status and 46 in samples with
different peritoneal cytology status. Additionally, 35
differentially expressed genes (DEGs) were found in patients with
local recurrence or distant metastasis compared to those without
recurrence or metastasis. Of these 35 DEGs, 13 were upregulated and
22 downregulated. The VennPainter diagram was used to show the
shared sets of DEGs and possible associations among the seven
clinicopathological categories (Fig.
1). Overlapping genes were considered to be more reliable. The
results revealed that 10 DEGs were shared in all seven
clinicopathological categories. There were 13 genes
co-differentially expressed in six clinicopathological categories,
and 28 genes were co-differentially expressed in five
clinicopathological categories (Fig.
1). Representative graphs of two differentially expressed CAMs
in patients evaluated with different clinicopathological categories
are shown in Fig. 2.
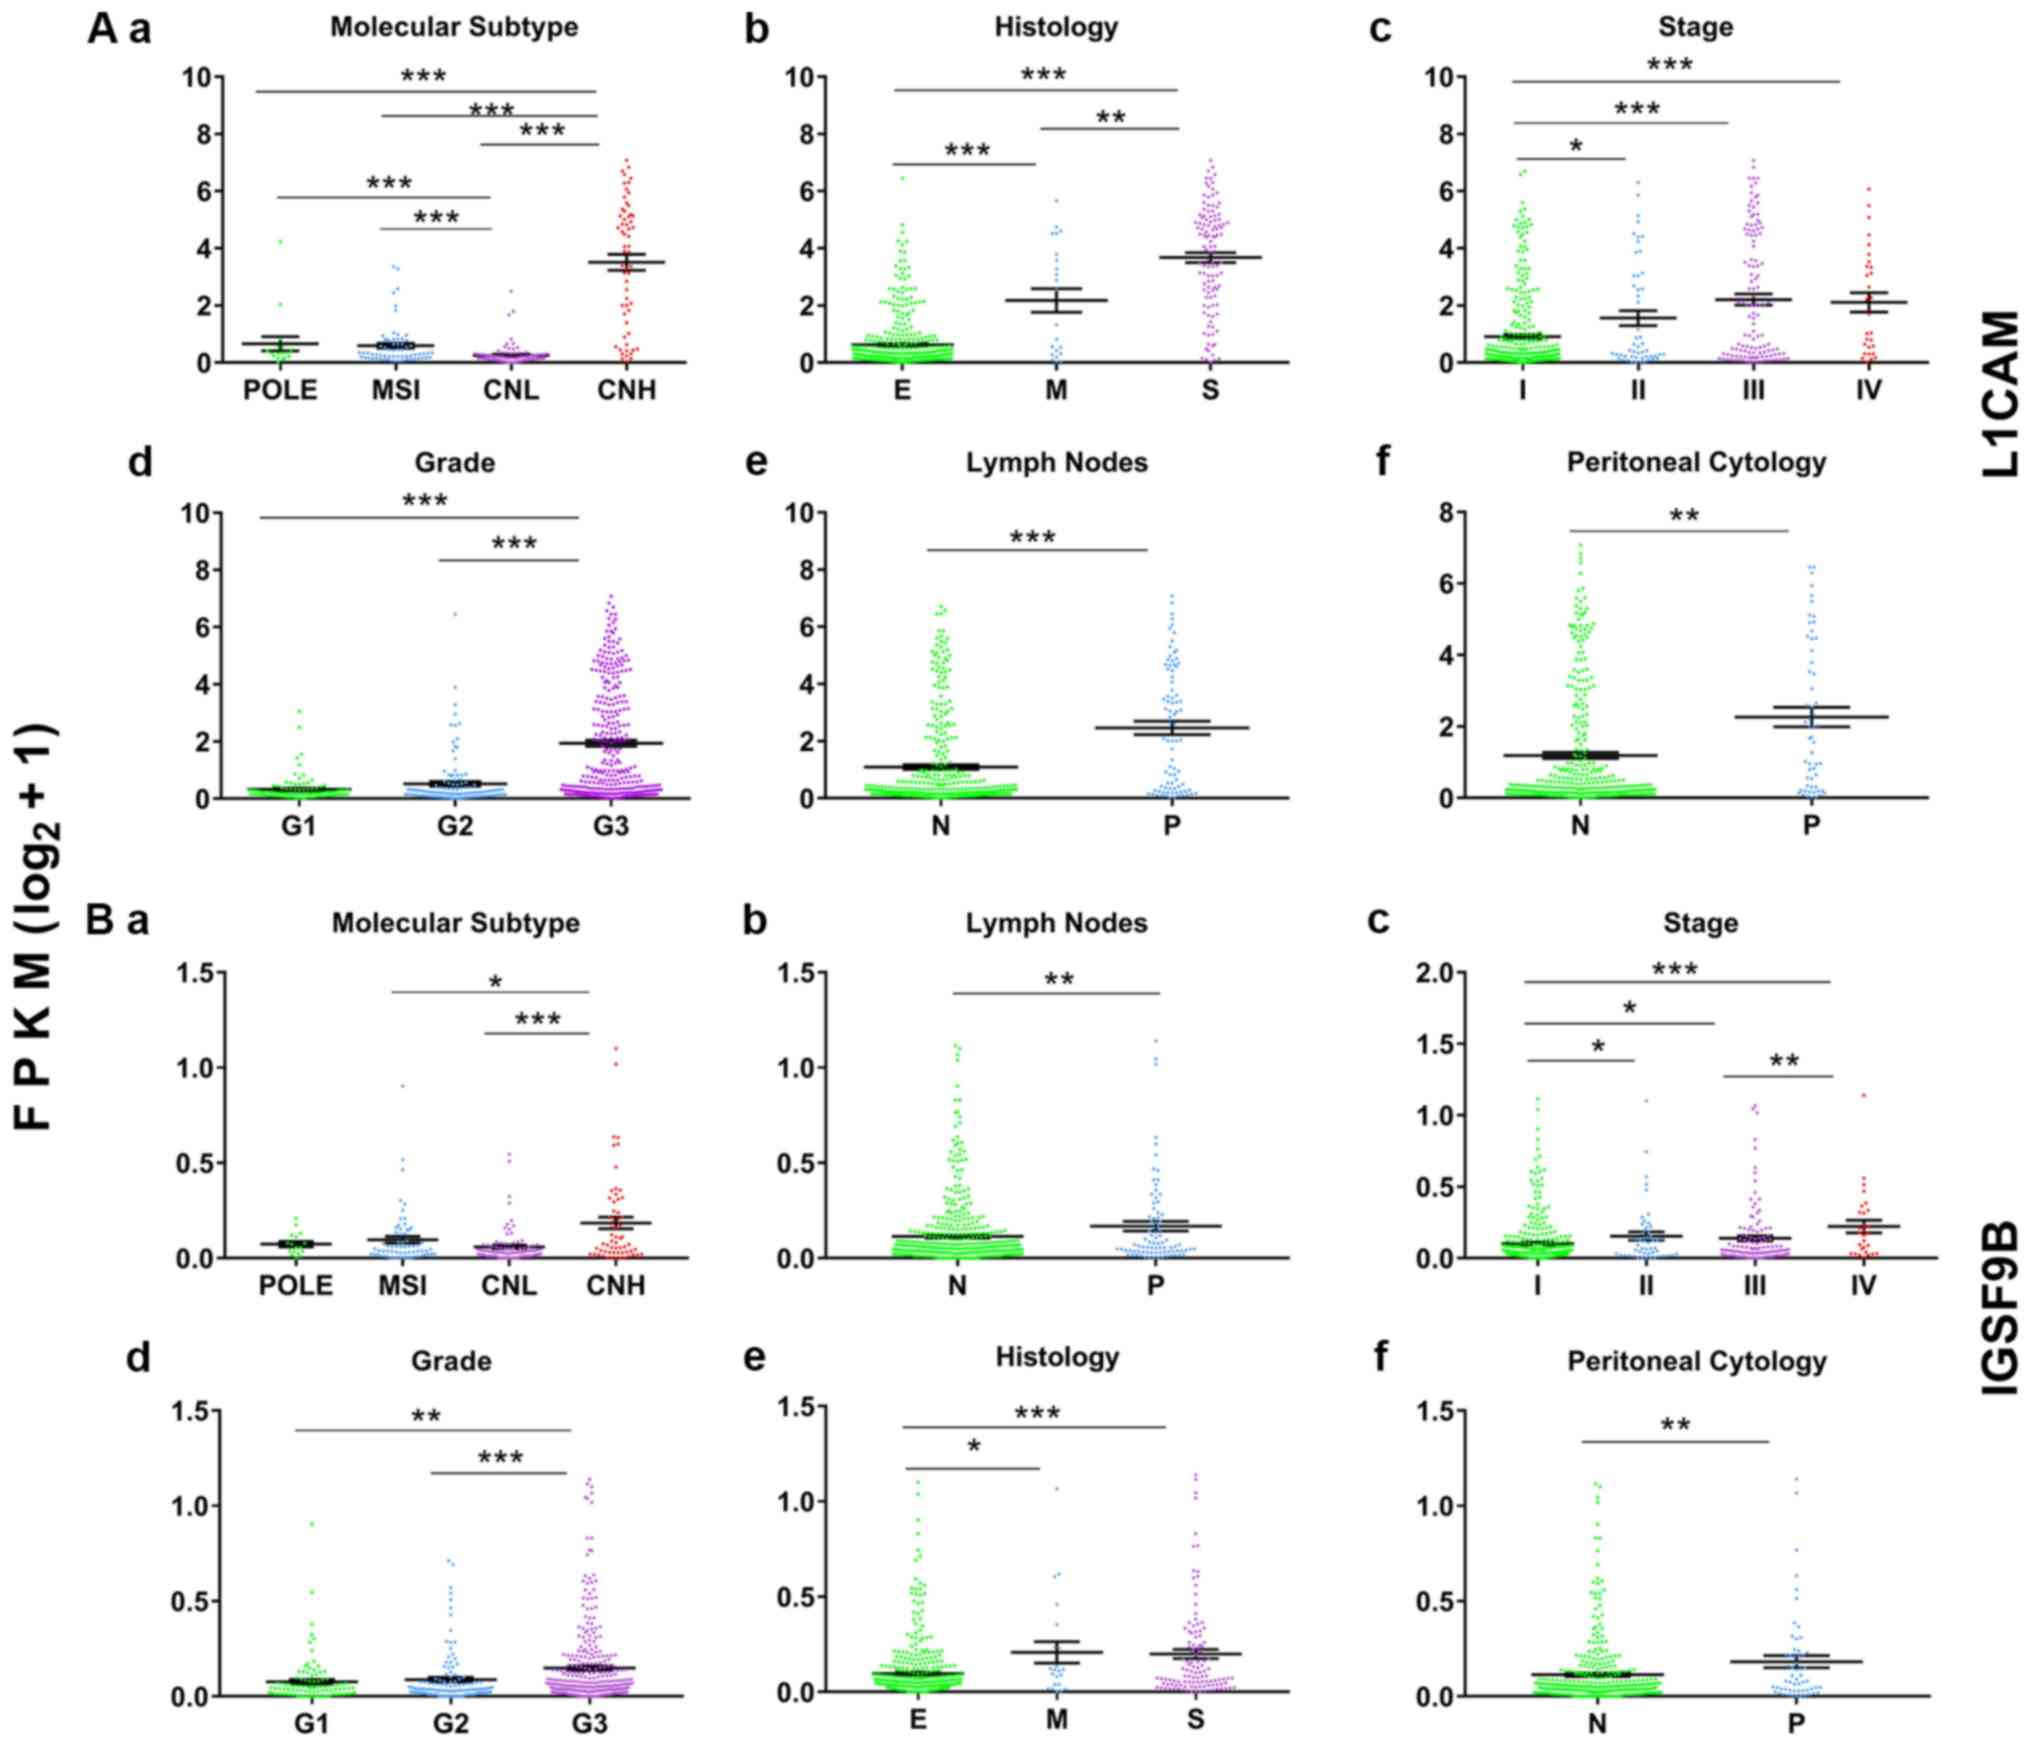 | Figure 2.Representative graphs of the
differentially expressed CAMs in patients with endometrial cancer
and classified by different clinicopathological categories.
Expression level and characteristics of L1CAM (Aa-Af) and IGSF9B
(Ba-Bf) are shown with respect to molecular subtypes (Aa and Ba),
histological types (Ab and Bb), stages (Ac and Bc), grades (Ad and
Bd), lymph node status (Ae and Be) and peritoneal washing cytology
status (Af and Bf). *P<0.05, **P<0.01, ***P<0.001. N,
negative; P, positive; E, endometrioid; M, mixed; S, serous; FPKM,
Fragments Per Kilobase of transcript per Million mapped reads;
POLE, polymerase ε ultramutated; MSI, microsatellite instability;
CNL, copy number low; CNH, copy number high; G, grade. |
Association between the expression
levels of CAMs and the survival time of patients
Genes that were co-differentially expressed in >5
clinicopathological categories were selected for Kaplan-Meier
analysis in which X-tile-determined cutoff points were used to
divide patients into high- and low-expression groups. The results
demonstrated that worse OS was associated with higher expression
levels of 21 CAM genes and lower expression levels of 7 CAM genes
(P<0.05; Table SII). L1CAM
exhibited the best separation of survival curves between the high-
and low-expression groups, with the highest χ2 value and
the lowest P-value. The association between the expression of 28
CAMs and the OS of the patients was further confirmed using
univariate Cox regression analysis (P<0.01 for all; Table SII). Subsequently, these genes were
analyzed using multivariate Cox regression analysis and the
aforementioned X-tile-determined cutoff points. Of the 28 CAM
genes, 10 were prognostic factors for OS independent of other
clinical risk factors, including stage, grade, age, lymph node
status, peritoneal cytology and histological subtype (Table II). A worse prognosis in patients
with EC was significantly associated with higher expression levels
of L1CAM, MUC15, CDON, IGSF9B, BCAM, protocadherin 9 (PCDH9) and
protocadherin β1 (PCDHB1) and lower expression levels of ITGAL,
immunoglobulin superfamily member 6 (IGSF6) and CEACAM21 (Table II). L1CAM was the most prominent
prognostic biomarker with a HR of 2.973 (95% CI, 1.529–5.782). The
association between the expression levels of these CAMs and the RFS
of the patients was also analyzed, and similar results were
obtained, with the exception of MUC15 (Table II).
| Table II.Multivariate Cox regression analysis
of prognostic factors for overall survival and relapse-free
survival. |
Table II.
Multivariate Cox regression analysis
of prognostic factors for overall survival and relapse-free
survival.
|
| Overall
survival | Relapse-free
survival |
|---|
|
|
|
|
|---|
| Prognostic
variables | P-value | HR | 95% CI | P-value | HR | 95% CI |
|---|
| Individual
genes |
|
|
|
|
|
|
|
CDON | 0.007 | 2.417 | 1.270–4.602 | 0.017 | 1.958 | 1.130–3.391 |
|
L1CAM | 0.001 | 2.973 | 1.529–5.782 | 0.003 | 2.019 | 1.263–3.227 |
|
PCDH9 | 0.025 | 2.033 | 1.094–3.779 | 0.046 | 1.624 | 1.007–2.617 |
|
PCDHB1 | 0.009 | 2.307 | 1.235–4.309 | 0.010 | 1.994 | 1.180–3.369 |
|
BCAM | 0.015 | 2.052 | 1.149–3.665 | 0.005 | 1.907 | 1.211–3.001 |
|
MUC15 | 0.029 | 1.884 | 1.065–3.332 | 0.653 | 1.115 | 0.694–1.790 |
|
IGSF9B | 0.015 | 2.115 | 1.157–3.866 | 0.042 | 1.711 | 1.020–2.867 |
|
ITGAL | 0.015 | 0.503 | 0.289–0.875 | 0.009 | 0.550 | 0.351–0.859 |
|
CEACAM21 | 0.011 | 0.422 | 0.218–0.817 | 0.006 | 0.480 | 0.285–0.807 |
|
IGSF6 | 0.006 | 0.411 | 0.218–0.775 | 0.004 | 0.490 | 0.302–0.793 |
| Six-gene
signature |
|
|
|
|
|
|
| All 6
genes < cut-off value | <0.001 |
|
| 0.001 |
|
|
| 1 gene
> cut-off value | 0.15 | 2.564 | 0.712–9.225 | 0.953 | 1.023 | 0.472–2.214 |
| 2–3
genes > cut-off value | 0.011 | 4.909 | 1.440–16.734 | 0.042 | 2.067 | 1.028–4.157 |
| 4–6
genes > cut-off value | <0.001 | 11.175 | 3.217–38.816 | 0.002 | 3.360 | 1.558–7.248 |
Combinational Kaplan-Meier
analysis
Numerous CAMs, rather than a single molecule, were
found to be dysregulated and associated with worse prognosis of
patients with EC; therefore, the invasion- and metastasis-promoting
effect may be due to the combined function of these molecules.
Therefore, combinational Kaplan-Meier analysis of the 10 CAMs that
were identified to be independent prognostic factors by
multivariate Cox regression analysis was performed. Patients with a
higher number of dysregulated CAMs had a higher risk of worse OS,
as shown in the multicategory Kaplan-Meier plot (Fig. 3A), in which patients were stratified
by the number of dysregulated CAMs.
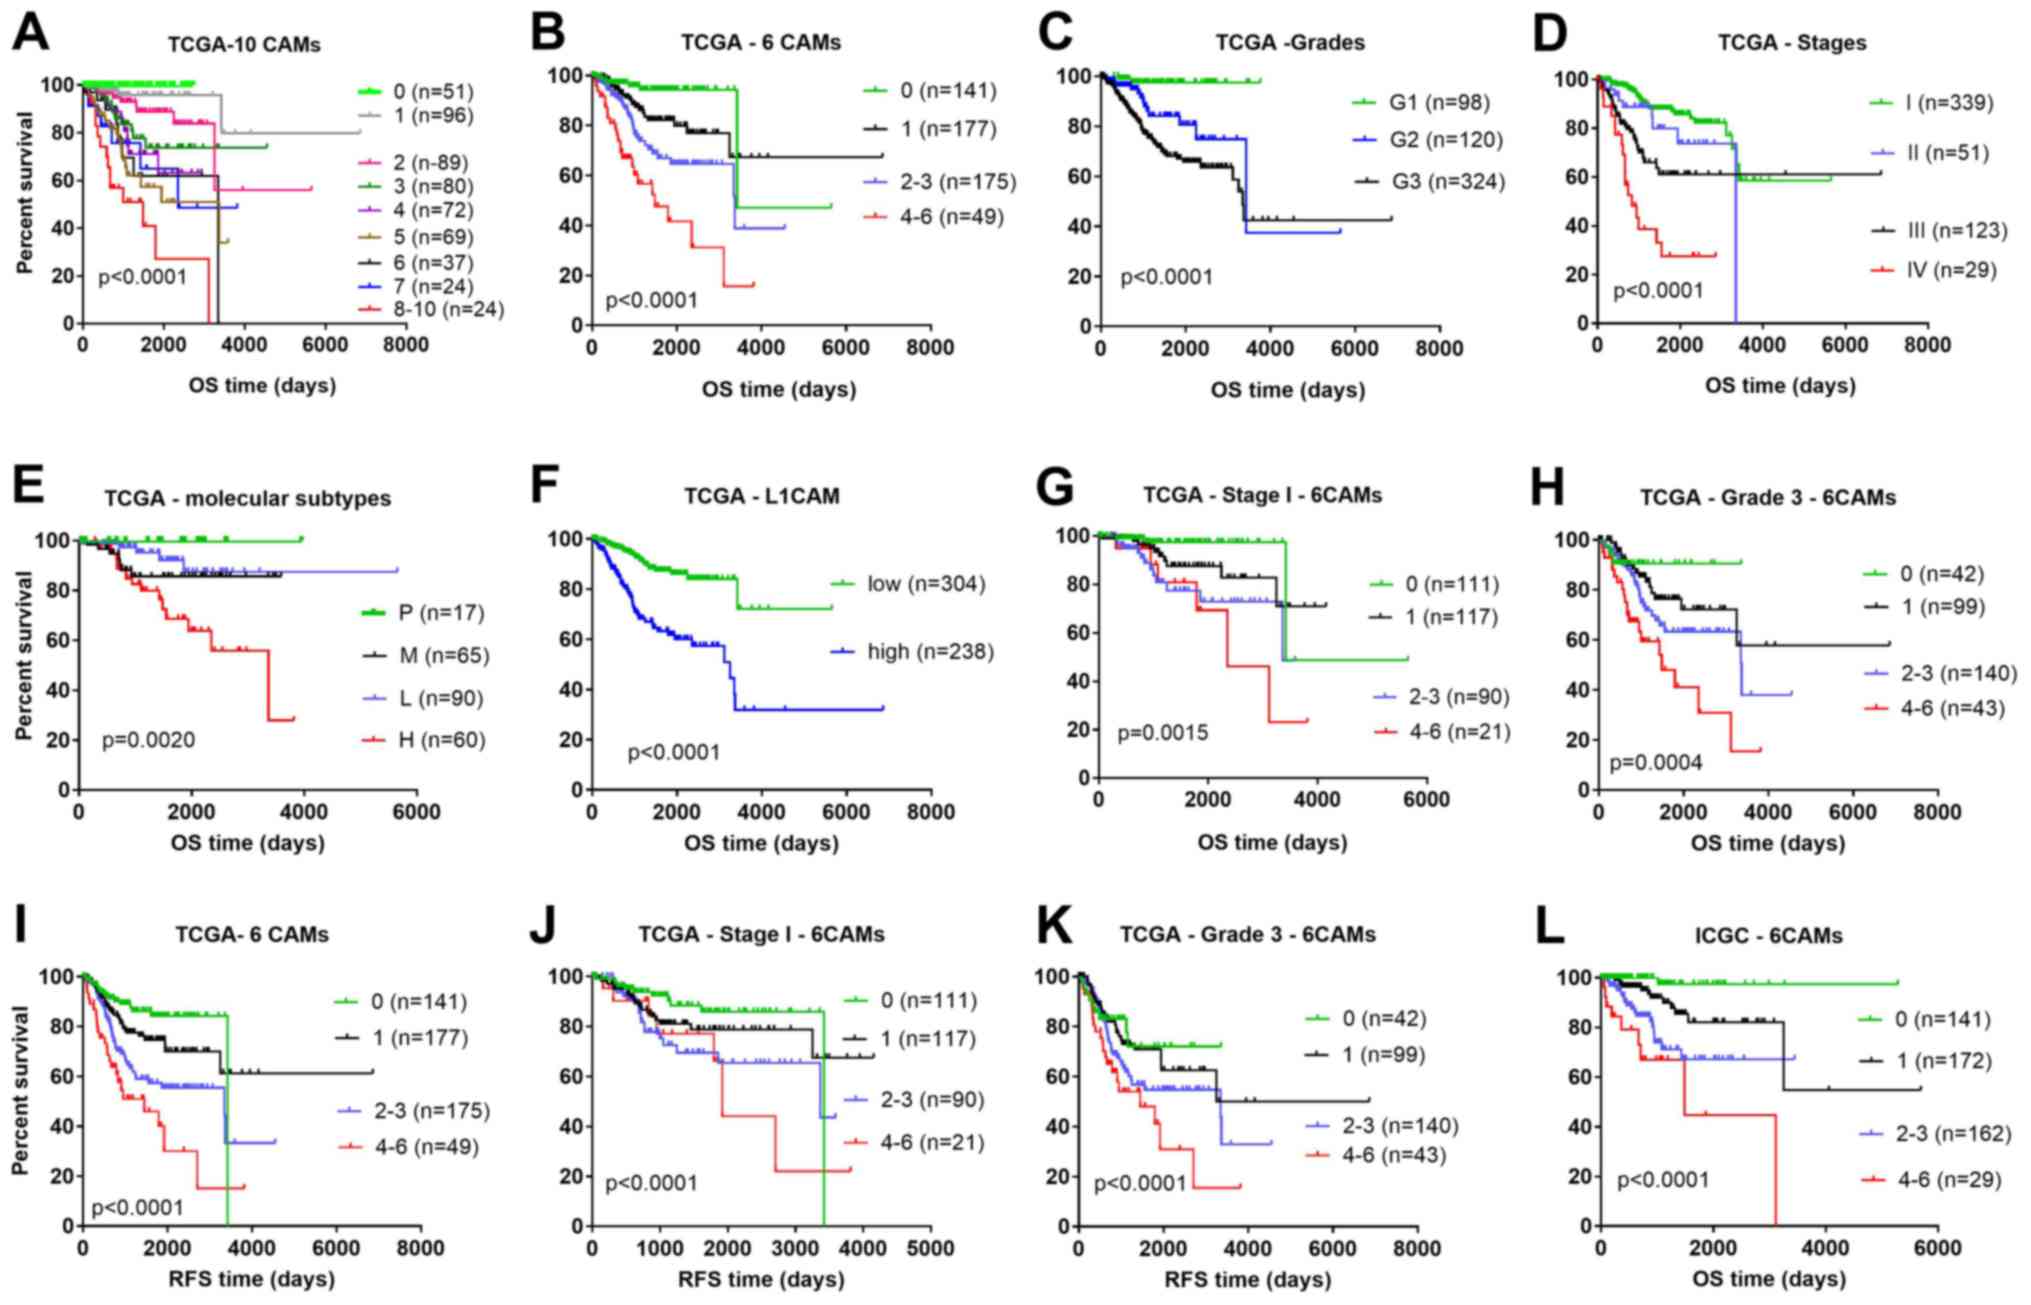 | Figure 3.Comparison of different prognostic
factors in OS and RFS analysis using the Kaplan-Meier method. OS
for patients stratified into (A) nine groups and (B) four groups
according to the number of high expression CAM genes, from the TCGA
dataset. The OS of patients stratified by different (C) grades, (D)
stages, (E) molecular subtypes and (F) expression levels of L1CAM
from TCGA database. The OS for patients stratified according to the
number of highly expressed CAM genes for (G) Stage I and (H) Grade
3 from the TCGA dataset. The RFS for patients stratified by (I) the
number of highly expressed CAM genes, (J) the number of highly
expressed CAM genes with Stage I and (K) the number of highly
expressed CAM genes with Grade 3, from the TCGA dataset. (L) OS for
patients from the ICGC dataset stratified according to the number
of highly expressed CAM genes. One case with OS time of −6 days was
excluded from TCGA cohort in all Kaplan-Meier analyses. 0, none of
the six genes were above the cut-off value; 1, one gene was above
the cut-off value; 2–3, two to three genes were above the cut-off
values; 4–6, four to six genes were above the cut-off values. CAM,
cell adhesion molecules; ICGC, International Cancer Genome
Consortium; OS, overall survival; RFS relapse-free survival; P,
polymerase ε ultramutated; M, microsatellite instability; L, copy
number low; H CNH, copy number high; TCGA, The Cancer Genome Atlas;
G, grade. |
Development of a classifier with a
six-gene signature
Although combinational analysis of the 10 CAMs could
predict prognosis, a lower number of genes would be more desirable.
Therefore, a six-gene signature (L1CAM, MUC15, CDON, IGSF9B, PCDH9
and PCDHB1) was developed to evaluate the prognosis of patients.
All six genes were unfavorable prognostic markers. They were
selected for the following reasons: Firstly, patients were well
stratified using the six-gene model. Secondly, their expression
features provide the possibility to use simple laboratory methods
to classify patients for risk stratification. In this six-gene
model, patients were stratified into four groups according to the
number of highly expressed CAMs (Fig.
3B). As shown by the multicategory Kaplan-Meier plots, the
six-gene model was a better predictor of overall survival rate
compared with grade (Fig. 3C), stage
(Fig. 3D), molecular subtype
(Fig. 3E) and expression of L1CAM
alone (Fig. 3F). Moreover, the
six-gene model also stratified heterogeneous stage I (339 cases;
Fig. 3G) and grade 3 (325 cases;
Fig. 3H) patients into different
risk groups, thereby refining the prognosis. Similar results were
obtained when RFS was analyzed (Fig.
3I-K). Additionally, the six-gene signature was demonstrated to
be an independent prognostic factor by multivariate Cox regression
analysis. The death risk of patients with elevation of >4 CAMs
in their samples was 11-fold higher compare with those without
elevation of these six CAMs (HR, 11.175; 95% CI, 3.217–38.816;
P<0.001), while the risk of recurrence and metastasis was about
3-fold higher for patients with elevation of >4 CAMs in their
samples compared with those without elevation (HR, 3.360; 95% CI,
1.558–7.248; P=0.002; Table
II).
Validation of the reliability of the
six-gene model using ICGC data
The prognostic reliability of the six-gene model was
validated using data from ICGC. Consistent with the result using
data from TCGA, higher expression levels of these six genes were
associated with worse OS, as analyzed using Kaplan-Meier and
univariate Cox regression methods (Table SIII). Patients from the ICGC cohort
could also be stratified into four risk groups according to the
number of highly expressed CAMs (Fig.
3L).
Association between the six-gene
signature and clinicopathological features
The composition ratios of different
clinicopathological phenotypes in the groups stratified by the
six-gene model were investigated. An increasing number of grade 3
cases, advanced stage, serous type, CNH, recurrence and metastasis,
positive peritoneal cytology, and lymph node invasion were
identified in groups with more highly expressed CAMs (Fig. 4). Patients with none of these six
genes above the cut-off values had a 5-year survival rate of 94.3%.
However, patients with 1, 2–3 and 4–6 genes above the cut-off
values had 5-year survival rates of 81.7, 66.4 and 41.6%,
respectively (Fig. 4).
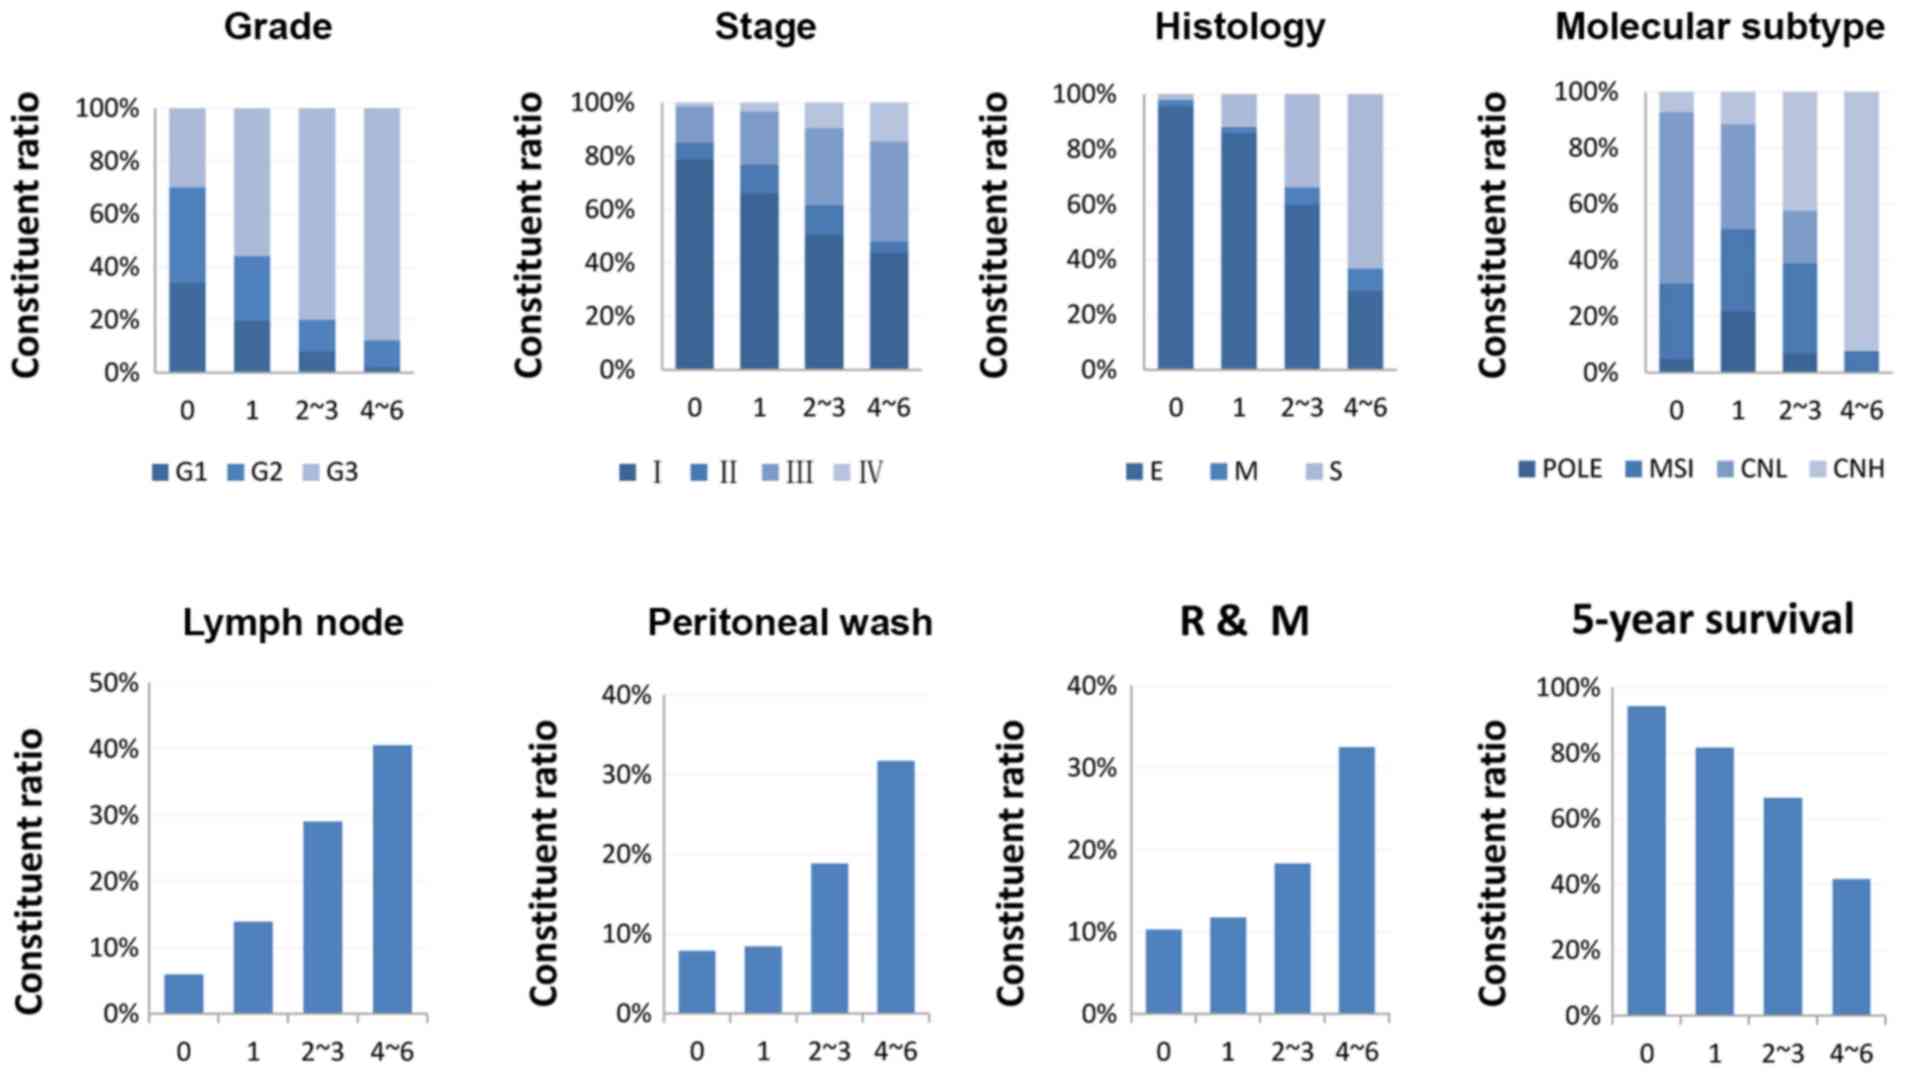 | Figure 4.Association between the six-gene
signature and clinicopathological features. Patients were
stratified into four groups: 0, none of the six genes were above
the cut-off values (n=141); 1, one gene above the cut-off point
(n=177); 2–3, two to three genes were above the cut-off values
(n=175); 4–6, four to six genes were above the cut-off values
(n=49). One case with an overall survival time of −6 days was
excluded. R, recurrence; M, metastasis; G, grade; E, endometrioid;
M, mixed; S, serous; POLE, polymerase ε ultramutated; MSI,
microsatellite instability; CNL, copy number low; CNH, copy number
high. |
Expression features of the six CAM
genes
The expression values of the six genes had similar
characteristic distribution patterns. Most of the samples were
convergently distributed at minimum levels (Fig. S1). Low expression samples accounted
for a high proportion in less aggressive clinicopathological
phenotypes such as grade I, grade II, endometrioid, stage I and
less aggressive molecular subtypes (POLE, MSI, and CNL). High
expression samples constituted a relatively high proportion in
aggressive clinicopathological phenotypes, such as grade 3, serous,
stage IV and molecular subtype CNH (Fig.
2). By searching the HPA database, IHC staining results of
L1CAM, CDON, IGSF9B and PCDHB1 in EC were obtained (Fig. S2). These four CAM genes exhibited
special features when examined by IHC. Firstly, positively stained
cells were scattered or clustered in their distribution, which made
it easy to distinguish from homogeneous non-specific staining.
Second, most of the samples presented on HPA website were
negatively stained, which was in accordance with the phenomenon
that most of the samples exhibited extremely low mRNA expression
levels. The features of expression may have some advantages that
can be useful in clinical practice. IHC-positive results were not
found for MUC15 in the 24 EC samples presented in the HPA database,
although scattered positively stained cells were seen in lung and
ovarian cancer. IHC results were not presented for PCDH9 in any
cancer.
Discussion
CAMs are a large class of cell surface molecules
that consists of >200 members in five families; although several
CAM genes mentioned earlier are known for their involvement in
different aspects of cancer biology (11), comprehensive study of all CAM genes
is lacking. In the present study, the expression levels of 225
members of the CAM family in EC were analyzed using data downloaded
from TCGA, and the expression changes of all CAMs among patients
with EC, with various clinicopathological phenotypes were also
investigated. The present study demonstrated that a number of CAMs
were differentially expressed and associated with aggressive
clinicopathological phenotypes. The dysregulated CAMs in EC
included members of the cadherins, integrins, mucins and the
immunoglobulin superfamily. These CAMs may have different
responsibilities in different aspects of cell adhesion, including
homophilic cell adhesion, heterophilic cell adhesion and
cell-matrix interactions (13). A
total of 28 CAM genes were associated with the prognosis of
patients with EC, 10 of which were demonstrated to be independent
prognostic factors for OS. When the 10 CAMs were analyzed in
combination, patients with a higher number of dysregulated CAMs had
a higher risk of worse OS. These results indicated a synergistic
biological role of these CAMs in the progression and aggressiveness
of EC. However, little is known regarding the exact roles of these
CAMs in EC, with the exception of L1CAM.
In EC, L1CAM was the most prominent prognostic
biomarker among all of the CAMs. L1CAM is normally highly expressed
in neural systems, and it performs an essential role in the
development and plasticity of the nervous system (14). L1CAM has been identified as a
prognostic marker for a wide spectrum of malignancies, including
melanoma, neuroblastoma, and prostate, pancreatic, breast, ovarian,
colorectal, head and neck, and non-small cell lung cancer, as well
as EC (14–16). It serves important roles in different
steps of cancer progression, such as cell proliferation and
apoptosis, adhesion and migration, and the epithelial-mesenchymal
transition process (14–16). Other CAMs, including MUC15, CDON,
IGSF9B, BCAM, CEACAM21 and ITGAL, have been associated with
progression and/or prognosis of several types of cancer as
mentioned in the introduction section (17–23), but
their association with EC has not been reported. To the best of our
knowledge, no association with cancer has been reported for PCDHB1,
IGSF6 and PCDH9.
In survival analysis, patients are often classified
by whether they fall above or below the median expression level.
However, the expression values of many genes in tumor tissues are
not normally distributed. Proper statistic methods are important in
analyzing these data. It has been reported that median cut-off
point approach would miss detecting 23% of the genes that were
significantly associated with survival at lower or higher
expression cut-points in patients with diffuse large B cell
lymphoma (27). X-tile, which uses
the maximum statistic to define the best categorization of
patients, is a powerful tool to explore the association of gene
expression data with outcomes (25).
Due to the skewed distribution of some CAM expression levels in
patients with EC, the X-tile-determined cut-off values were used
for Kaplan-Meier and Cox regression analysis in the present
study.
In consideration of practical clinical application,
a six-gene signature was established to evaluate the prognosis of
patients. Multivariate Cox regression analysis revealed that the
six-gene combination was an independent prognostic factor and was
effective for predicting worse OS and RFS in patients with EC.
Patients with more highly expressed CAMs had a higher risk of worse
survival. The prognostic reliability of the six-gene model was
validated using data of an independent cohort from ICGC. The
slightly inferior level of stratification in the ICGC cohort
compared with that in the TCGA cohort may be due to the difference
in the patients' composition of the clinicopathological subtype.
Unfortunately, the clinicopathological characteristics of the ICGC
cohort were not available for multivariate Cox regression analysis.
The effect of the six-gene signature in stratifying patients with
different risks was effective compared with that of several routine
clinical prognostic factors in the same cohort and could be
complementary to the present clinical prognostic criteria.
The six genes selected in the combination analysis
possessed the following features: Firstly, extremely low expression
was present in most of the samples and high expression was present
in a small number of samples with wide discrepancy. Accordingly,
these genes were negatively stained by IHC in most of the samples
presented on HPA website. Secondly, positively stained cells were
scattered or clustered in their distribution on IHC slides. As
examining mRNAs by the second-generation sequencing is more
sensitive compared with examining proteins by IHC, it is
hypothesized that the extremely low mRNA expression of these genes
may result in negative staining on IHC, while high mRNA expression
may result in positive staining. These features make the six CAM
genes promising for routine clinical application as it is easier to
judge between negative and positive staining than to define weak or
strong staining on IHC, and the scattered positive cancer cells are
easy to distinguish from homogeneous non-specific staining. Since
the amount of IHC detected samples presented in the HPA database is
limited, the positive rate of IHC detection with the proportion of
high mRNA expression samples could not be compared. Therefore, the
potential prognostic role and the true clinical value of these CAMs
require further validation by multi-medical center studies using
more practical and reliable methods, such as quantitative PCR and
IHC.
The present study demonstrated that dysregulation of
CAMs is an important feature characterizing the most aggressive EC,
which may facilitate further study on the oncogenic role of CAMs in
the progression of EC and a deeper understanding of the orchestral
function of CAMs in the progression of EC. The six-gene prognostic
signature may enable refinement of EC prognosis and allow further
studies and tailored treatment on the basis of biological
considerations.
Supplementary Material
Supporting Data
Acknowledgements
Not applicable.
Funding
No funding was received.
Availability of data and materials
All data generated or analyzed during the present
study are included in this published article.
Authors' contributions
XH and JW were involved in the conception and design
of the study. XH and LM participated in the retrieval of CAM genes
and literature searches. XH, LM and SL were involved in data
curation and validation. SL, QZ and NL statistically analyzed data
and created figures and tables. XH wrote the manuscript. JW and SL
reviewed and edited the manuscript. All authors read and approved
the final manuscript.
Ethics approval and consent to
participate
Not applicable.
Patient consent for publication
Not applicable.
Competing interests
The authors declare that they have no competing
interests.
References
|
1
|
Van Nyen T, Moiola CP, Colas E, Annibali D
and Amant F: Modeling endometrial cancer: Past, present, and
future. Int J Mol Sci. 19:E23482018. View Article : Google Scholar : PubMed/NCBI
|
|
2
|
Suhaimi SS, Ab Mutalib NS and Jamal R:
Understanding molecular landscape of endometrial cancer through
next generation sequencing: What we have learned so far? Front
Pharmacol. 7:4092016. View Article : Google Scholar : PubMed/NCBI
|
|
3
|
Jonathan SB: Uterine Cancer. Gynecology.
Lippincott Williams & Wilkins; USA: pp. 1343–1402. 2011
|
|
4
|
Thomas S, Hussein Y, Bandyopadhyay S, Cote
M, Hassan O, Abdulfatah E, Alosh B, Guan H, Soslow RA and Ali-Fehmi
R: Interobserver variability in the diagnosis of uterine high-grade
endometrioid carcinoma. Arch Pathol Lab Med. 140:836–843. 2016.
View Article : Google Scholar : PubMed/NCBI
|
|
5
|
Hoang LN, Kinloch MA, Leo JM, Grondin K,
Lee CH, Ewanowich C, Köbel M, Cheng A, Talhouk A, McConechy M, et
al: Interobserver agreement in endometrial carcinoma histotype
diagnosis varies depending on the cancer genome atlas (TCGA)-based
molecular subgroup. Am J Surg Pathol. 4:245–252. 2017. View Article : Google Scholar
|
|
6
|
Bosse T, Nout RA, McAlpine JN, McConechy
MK, Britton H, Hussein YR, Gonzalez C, Ganesan R, Steele JC,
Harrison BT, et al: Molecular classification of grade 3
endometrioid endometrial cancers identifies distinct prognostic
subgroups. Am J Surg Pathol. 42:561–568. 2018.PubMed/NCBI
|
|
7
|
Abdulfatah E, Ahmed Q, Alosh B,
Bandyopadhyay S, Bluth MH and Ali-Fehmi R: Gynecologic cancers:
Molecular updates 2018. Clin Lab Med. 38:421–438. 2018. View Article : Google Scholar : PubMed/NCBI
|
|
8
|
Cancer Genome Atlas Research Network, ;
Kandoth C, Schultz N, Cherniack AD, Akbani R, Liu Y, Shen H,
Robertson AG, Pashtan I, Shen R, et al: Integrated genomic
characterization of endometrial carcinoma. Nature. 497:67–73. 2013.
View Article : Google Scholar : PubMed/NCBI
|
|
9
|
Guan X: Cancer metastases: Challenges and
opportunities. Acta Pharm Sin B. 5:402–418. 2015. View Article : Google Scholar : PubMed/NCBI
|
|
10
|
Bombardelli L and Cavallaro U:
Immunoglobulin-like cell adhesion molecules: Novel signaling
players in epithelial ovarian cancer. Int J Biochem Cell Biol.
42:590–594. 2010. View Article : Google Scholar : PubMed/NCBI
|
|
11
|
Byron A and Frame MC: Adhesion protein
networks reveal functions proximal and distal to cell-matrix
contacts. Curr Opin Cell Biol. 39:93–100. 2016. View Article : Google Scholar : PubMed/NCBI
|
|
12
|
Lewczuk L, Pryczynicz A and
Guzinska-Ustymowicz K: Cell adhesion molecules in endometrial
cancer-A systematic review. Adv Med Sci. 64:423–429. 2019.
View Article : Google Scholar : PubMed/NCBI
|
|
13
|
Lodish H, Berk A, Zipursky SL, Matsudaira
P, Baltimore D and Darnell J: Cell-Cell Adhesion and Communication.
Molecular Cell Biology. 4th. W.H.Freeman; New York, NY USA: pp.
927–933. 2016
|
|
14
|
Samatov TR, Wicklein D and Tonevitsky AG:
L1CAM: Cell adhesion and more. Prog Histochem Cytochem. 51:25–32.
2016. View Article : Google Scholar : PubMed/NCBI
|
|
15
|
Dellinger TH, Smith DD, Ouyang C, Warden
CD, Williams JC and Han ES: L1CAM is an independent predictor of
poor survival in endometrial cancer-An analysis of the cancer
genome atlas (TCGA). Gynecol Oncol. 141:336–340. 2016. View Article : Google Scholar : PubMed/NCBI
|
|
16
|
Kommoss F, Kommoss F, Grevenkamp F, Bunz
AK, Taran FA, Fend F, Brucker SY, Wallwiener D, Schönfisch B, Greif
K, et al: L1CAM: Amending the ‘low-risk’ category in endometrial
carcinoma. J Cancer Res Clin Oncol. 143:255–262. 2017. View Article : Google Scholar : PubMed/NCBI
|
|
17
|
Nam KH, Noh TW, Chung SH, Lee SH, Lee MK,
Hong SW, Chung WY, Lee EJ and Park CS: Expression of the membrane
mucins MUC4 and MUC15, potential markers of malignancy and
prognosis, in papillary thyroid carcinoma. Thyroid. 21:745–750.
2011. View Article : Google Scholar : PubMed/NCBI
|
|
18
|
Yang WB and Li CY: Correlations of MUC15
overexpression with clinicopathological features and prognosis of
glioma. J Huazhong Univ Sci Technolog Med Sci. 34:254–259. 2014.
View Article : Google Scholar : PubMed/NCBI
|
|
19
|
Leem YE, Ha HL, Bae JH, Baek KH and Kang
JS: CDO, an Hh-coreceptor, mediates lung cancer cell proliferation
and tumorigenicity through Hedgehog signaling. PLoS One.
9:e1117012014. View Article : Google Scholar : PubMed/NCBI
|
|
20
|
Fonseca AL, da Silva VL, da Fonseca MM,
Meira IT, da Silva TE, Kroll JE, Ribeiro-Dos-Santos AM, Freitas CR,
Furtado R, de Souza JE, et al: Bioinformatics analysis of the human
surfaceome reveals new targets for a variety of tumor types. Int J
Genomics. 2016:83461982016. View Article : Google Scholar : PubMed/NCBI
|
|
21
|
Chang HY, Chang HM, Wu TJ, Chaing CY, Tzai
TS, Cheng HL, Raghavaraju G, Chow NH and Liu HS: The role of
lutheran/basal cell adhesion molecule in human bladder
carcinogenesis. J Biomed Sci. 24:612017. View Article : Google Scholar : PubMed/NCBI
|
|
22
|
Kreuzinger C, Geroldinger A, Smeets D,
Braicu EI, Sehouli J, Koller J, Wolf A, Darb-Esfahani S, Joehrens
K, Vergote I, et al: A complex network of tumor microenvironment in
human high-grade serous ovarian cancer. Clin Cancer Res.
23:7621–7632. 2017. View Article : Google Scholar : PubMed/NCBI
|
|
23
|
Boguslawska J, Kedzierska H, Poplawski P,
Rybicka B, Tanski Z and Piekielko-Witkowska A: Expression of genes
involved in cellular adhesion and extracellular matrix remodeling
correlates with poor survival of patients with renal cancer. J
Urol. 195:1892–1902. 2016. View Article : Google Scholar : PubMed/NCBI
|
|
24
|
International Cancer Genome Consortium, ;
Hudson TJ, Anderson W, Artez A, Barker AD, Bell C, Bernabé RR, Bhan
MK, Calvo F, Eerola I, et al: International network of cancer
genome projects. Nature. 464:993–998. 2010. View Article : Google Scholar : PubMed/NCBI
|
|
25
|
Camp RL, Dolled-Filhart M and Rimm DL:
X-tile a new bio-informatics tool for biomarker assessment and
outcome-based cut-point optimization. Clin Cancer Res.
10:7252–7259. 2004. View Article : Google Scholar : PubMed/NCBI
|
|
26
|
FIGO Committee on Gynecologic Oncology, .
FIGO staging for carcinoma of the vulva, cervix, and corpus uteri.
Int J Gynaecol Obstet. 125:97–98. 2014. View Article : Google Scholar : PubMed/NCBI
|
|
27
|
Rimsza LM, Unger JM, Tome ME and Leblanc
ML: A strategy for full interrogation of prognostic gene expression
patterns: Exploring the biology of diffuse large B cell lymphoma.
PLoS One. 6:e222672011. View Article : Google Scholar : PubMed/NCBI
|