Introduction
Retinoblastoma is the most common primary
intraocular malignant tumor in infants and young children, and it
ranks 3rd among all tumors only following leukemia and
neuroblastoma (1,2). Despite some progress made in the
treatment of retinoblastoma, some major problems have not been
resolved yet. Traditional external beam radiation is used to
control large tumors, but there are complications, including the
secondary malignant tumors, such as osteosarcoma, which leads to a
higher incidence rate of hereditary retinoblastoma in patients
(3,4). Although external therapies such as
chemotherapy have become indispensable treatment for retinoblastoma
currently, it results in noticeable complications (5). Therefore, search for new therapeutic
strategies to improve the clinical efficacy of patients with
retinoblastoma is urgently needed.
Rapamycin is a kind of macrolide produced by
Streptomyces hygroscopicus, which was originally developed as an
antifungal agent (6). However, it
has been used more for other purposes when its strong
immunosuppressive and anti-proliferative properties were found
(7). Nowadays, Rapamycin contributes
to the treatment of some cancers through inhibiting the Rapamycin
target pathway in mammals (8). Over
the years, it has been proven that apoptosis is the primary
mechanism for eliminating cancer cells, including intrinsic or
mitochondrial pathway and extrinsic or death receptor pathway
(9). Therefore, it is of great
significance to study the proliferation and apoptosis of
retinoblastoma cells.
The phosphatidylinositol 3-hydroxy kinase
(PI3K)/protein kinase B (AKT) pathway is an important signaling
pathway that affects the cellular energy metabolism, cell size,
cell cycle, cell proliferation, survival and apoptosis, which is
closely related to other important signal transduction pathways
(10–12). This pathway is composed of three
major driving molecules: PI3K, AKT and the mammalian target of
rapamycin (mTOR) (13–15). However, the role of the PI3K/AKT
signaling pathway in retinoblastoma still needs further research.
The aim of the present study was to enrich and improve the
theoretical basis of the effects of Rapamycin on proliferation and
apoptosis of retinoblastoma cells through the PI3K/AKT pathway.
Materials and methods
Commonly-used reagents and
consumables
Y79 cells [American Type Culture Collection (ATCC)
(Manassas)], Rapamycin (Pfizer), enzyme-linked immunosorbent assay
(ELISA) kits of reactive oxygen species (ROS) and malon- dialdehyde
(MDA) (Nanjing Jiancheng Bioengineering Institute),
radioimmunoprecipitation assay (RIPA) lysis buffer (Beyotime),
loading buffer, protease inhibitor and bicinchoninic acid (BCA)
protein concentration assay kit (Biosharp), glyceraldheyde
3-phosphate dehydrogenase (GAPDH) and secondary antibodies
(ImmunoWay), primary antibodies (Cell Signaling Technology, Inc.),
TRIzol reagent (Invitrogen; Thermo Fisher Scientific, Inc.),
diethyl pyrocarbonate (DEPC)-treated water, SuperScript III RT kit
and SYBR qPCR Mix (Applied Biosystems; Thermo Fisher Scientific,
Inc.), electrophoresis apparatus (Bio-Rad Laboratories, Inc.),
microplate reader (Thermo Fisher Scientific, Inc.), 2500 gel imager
(Bio-Rad Laboratories, Inc.) and quantitative polymerase chain
reaction (qPCR) instrument (7900 Fast, Applied Biosystems; Thermo
Fisher Scientific, Inc.).
Cell culture and grouping
The retinoblastoma Y79 cells purchased from ATCC
were quickly taken out from the liquid nitrogen container, and
rapidly thawed in 65°C sterile water prepared in advance, followed
by centrifugation at 2,500 × g at 20°C for 10 min. The supernatant
was discarded. After the above operation was repeated several
times, the cells were resuspended with medium and inoculated into a
6-well plate at an appropriate density, followed by incubation in a
thermostatic incubator. The medium was replaced every other day.
Then the cells in good growth status were divided into negative
control group (NC group), 0.2 µM Rapamycin group and 0.4 µM
Rapamycin group (the dose of Rapamycin was determined by
preliminary experiments (not shown). After stimulation for 24 h,
the cell samples were collected.
Cell proliferation assay using Cell
Counting Kit-8 (CCK-8)
The cells in the logarithmic growth phase in each
group were inoculated into a 96-well plate and cultured in the
thermostatic incubator with 5% CO2 at 37°C for 0, 24,
48, 72 and 96 h. Then the medium was discarded, and 110 µl of
developing solution was added into each well, followed by
incubation for 1 h at 37°C in the incubator. The absorbance in each
group was detected at 450 nm using an ultraviolet
spectrophotometer, and plotted into the line chart to reflect the
cell proliferative activity.
Detection of cytokines in each
group
After stimulation, the cells in good growth status
in the three groups were selected from the incubator, and the
medium was discarded. The cells were collected using a cell scraper
and lysed using the RIPA lysis buffer (strong), followed by
centrifugal separation at 2,500 × g at 20°C for 10 min. Then the
supernatant was collected to detect the levels of ROS, MDA and SOD
using the ELISA kits (HM10870, Bio-Swamp; HM10250, Bio-Swamp;
CSB-E17064h, Cusabio Biotech Co., Ltd.) according to the actual
situations and instructions. Finally, the absorbance in each group
was measured using a microplate reader.
Terminal deoxynucleotidyl
transferase-mediated dUTP nick end labeling (TUNEL) apoptosis
assay
Apoptosis of Y79 cells was detected using the
apoptosis assay kit (Roche), as follows: The cells in each group
were collected, and the supernatant was discarded. The cells were
washed with phosphate buffered saline (PBS), added with proteinase
K working solution, immersed in blocking buffer, fixed, rinsed and
infiltrated with 0.1% Triton X-100, followed by fluorescein
isothiocyanate (FITC) end labeling of apoptotic DNA fragment using
the TUNEL assay kit. The FITC-labeled TUNEL-positive cells were
observed under a fluorescence microscope, and the TUNEL-positive
cells were counted in 10 fields of view.
Detection of cell cycle using flow
cytometry
The cells were treated for 24 h and washed twice
with PBS, and the cell sediment at the bottom of tube was
collected. Then the cell sediment was added with 1 ml of pre-cooled
70% ethanol, transferred into the 1.5 ml Eppendorf (EP) tube and
fixed at 4°C overnight, followed by centrifugation at 1,750 × g at
20°C for 5 min. The supernatant was collected. With 3 replicates in
each group, the cell sediment was suspended with 500 µl of binding
buffer according to the instructions, added with 5 µl of propidium
iodide (PI) dye and placed at room temperature for 30 min in the
dark. Finally, the cell cycle was detected using the flow cytometer
according to the programmed operation. Flow cytometer (FACSCalibur;
BD Biosciences) was used for analysis. Data were obtained and
analyzed using the CellQuest professional software (version 3.3; BD
Biosciences).
Detection of apoptosis via flow
cytometry
The cells were treated for 24 h and washed twice
with PBS, and the cell sediment at the bottom of tube was
collected. With 3 replicates in each group, the cell sediment was
suspended with 500 µl of binding buffer according to the
instructions, added with 5 µl of Annexin V-binding buffer and 5 µl
of PI dye and placed at room temperature for 10 min. Finally, the
apoptosis rate was measured using the flow cytometer according to
the programmed operation.
Detection of gene expression using
RT-PCR
The RNA was extracted from cells and synthesized
into DNA using the kit (Takara) in accordance with the
instructions. The primer amplification system (20 µl) was
constructed using 2 µl of complementary deoxyribose nucleic acid
(cDNA), 10 µl of qPCR mix, 2 µl of primers and 6 µl of
ddH2O. Then, PCR amplification was performed:
pre-denaturation at 95°C for 2 min, 94°C for 20 sec, 60°C for 20
sec and 72°C for 30 sec, for a total of 40 cycles. The primer
sequences of target genes and the internal reference GAPDH were
designed according to those in the GenBank (Table I). The expression levels of target
genes were detected via RT-PCR.
 | Table I.Primer sequences. |
Table I.
Primer sequences.
| Target gene | Primer sequence
(F-R) |
|---|
| GAPDH |
5′-ACATGCCGCCTGGAGAAAC-3′ |
|
|
5′-GCCCAGGATGCCCTTTAGT-3′ |
| Bcl-2 |
5′-GTGCTCTTGAGATCTCTGG-3′ |
|
|
5′-CATCGATCTTCAGAAGTCTC-3′ |
| Caspase 8 |
5′-TACCGCACCCGGTTACTAT-3′ |
|
|
5′-TCCGGTTAACACGAGTGAG-3′ |
| PI3K |
5′-ATCGGCTCACCTTCTGCCCGTT-3′ |
|
|
5′-AGGTCTCGGTATCCCACGAAAGA-3′ |
| AKT |
5′-GATGGCAGGCTGACTTGTG-3′ |
|
|
5′-CTACGCGGATCAACCGAGACATA-3′ |
| mTOR |
5′-GAACTGCACGTCAGCACCA-3′ |
|
|
5′-TCAGTGAAAGTGCCAAATCAGGT-3′ |
Western blotting
The cells at an appropriate density in each group
were collected, from which the protein was extracted according to
the instructions, and the protein concentration was calculated.
After that, the protein was subjected to water bath and
centrifugation at 10,500 × g at 4°C for 10 min. Then western
blotting was performed: 12% separation gel and 5% spacer gel were
prepared for protein loading and electrophoresis, and the protein
was transferred onto a membrane using the semi-dry method, sealed,
incubated with the primary antibodies overnight and incubated again
with the secondary antibodies. The protein band was scanned and
quantified using the Odyssey scanner, and the level of protein to
be detected was corrected using GAPDH. Finally, the protein
expression was calculated through gray scan.
Statistical analysis
All raw data obtained in the experiments were
statistically analyzed using Statistical Product and Service
Solutions (SPSS) 21.0 software (IBM Corp.), the validity of raw
data was retained, and multiple comparisons were performed. The
experimental results were expressed as mean ± standard deviation
(mean ± SD). Analysis of variance followed by post hoc test (least
significant difference) was applied for the comparison among
groups. P<0.05 suggested that the difference was statistically
significant. The bar graph was plotted using GraphPad Prism
8.0.
Results
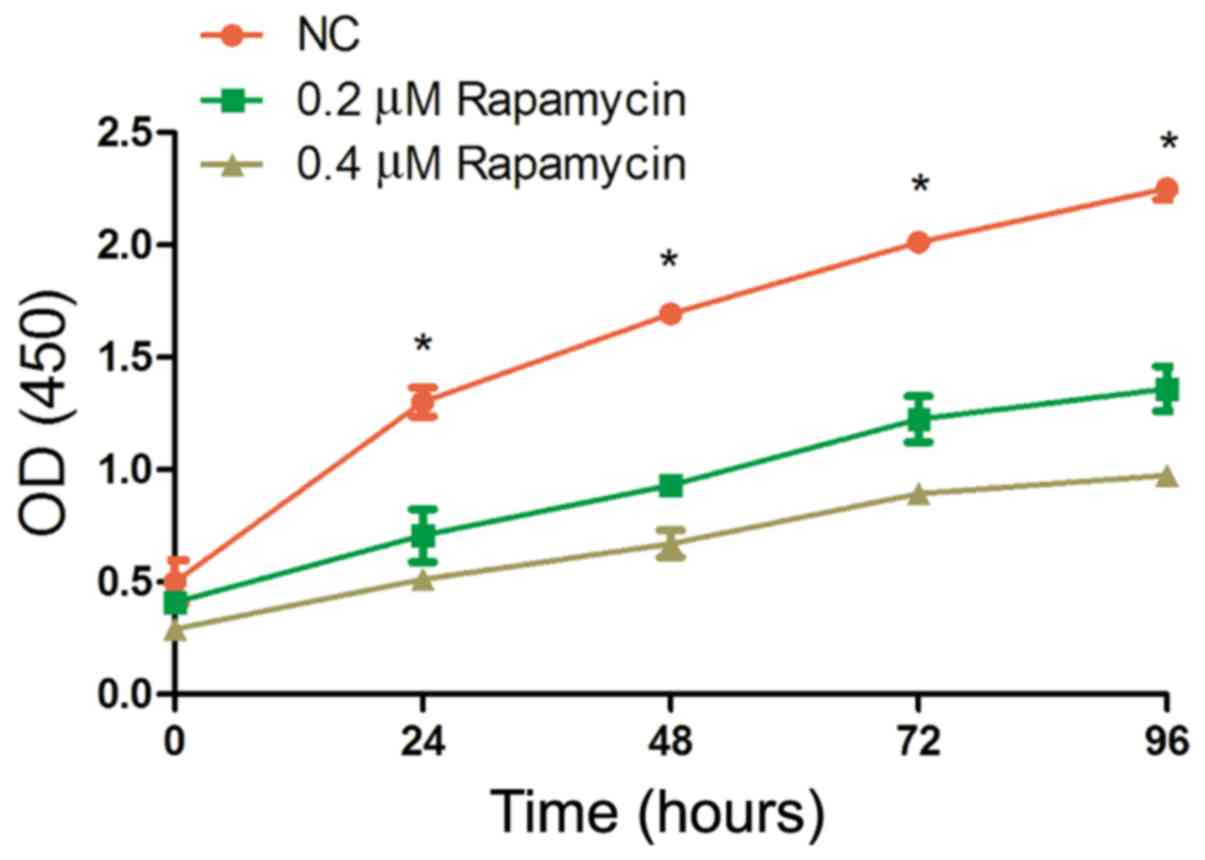
Results of cell proliferation assay
using CCK8
The absorbance in each group at different time
points was measured through proliferation assay using CCK8. As
shown in Fig. 1, the proliferation
ability of Y79 cells was significantly stronger in NC group than
that in other groups at 24, 48, 72 and 96 h (P<0.05), and it was
the weakest in 0.4 µM Rapamycin group (P<0.05).
Detection results of oxidative stress
cytokines in each group
As shown in Table
II, in 0.2 µM Rapamycin group and 0.4 µM Rapamycin group, the
content of ROS and MDA was significantly decreased (P<0.05),
while that of SOD was significantly increased (P<0.05), all of
which were remarkably superior in 0.4 µM Rapamycin group to those
in 0.2 µM Rapamycin group, indicating that 0.4 µM of Rapamycin can
inhibit the oxidative stress, further suppressing the occurrence of
retinoblastoma.
| Table II.Detection results of oxidative
stress. |
Table II.
Detection results of oxidative
stress.
| Group | ROS (µ/l) | MDA (mmol/l) | SOD (µ/mg) |
|---|
| NC | 36.5±2.3 | 22.1±0.8 | 3.4±0.8 |
| 0.2 µM Rapamycin | 20.2±3.4a | 12.2±1.0a | 12.1±2.0a |
| 0.4 µM Rapamycin | 10.3±2.1b | 5.2±1.3b | 18.2±2.5b |
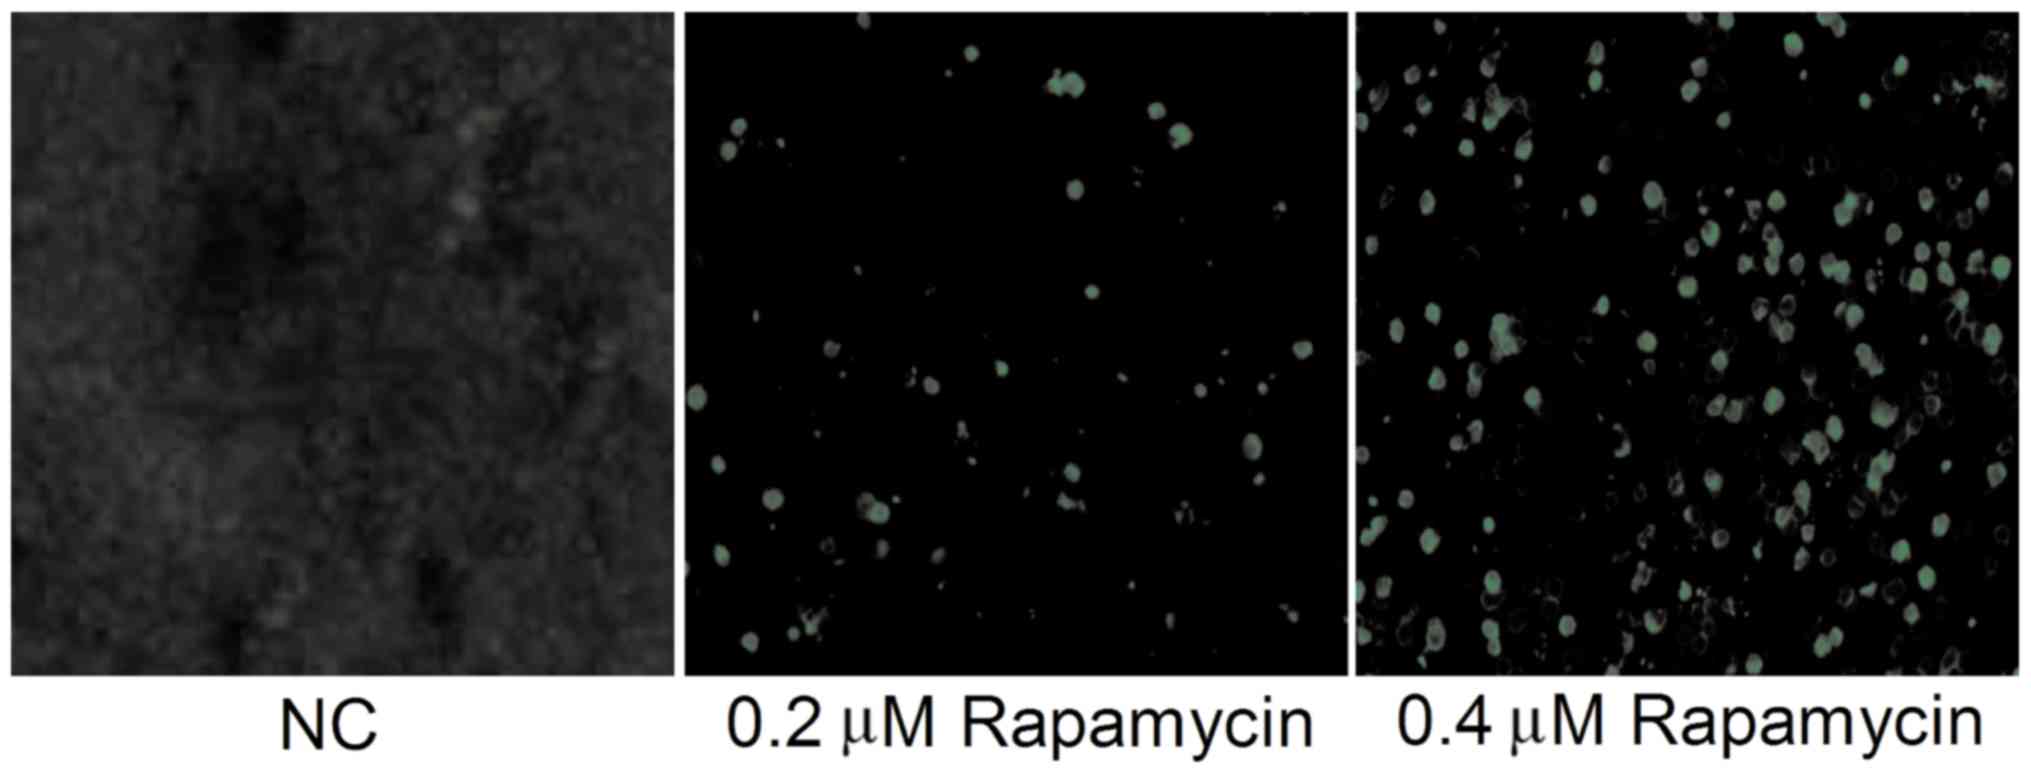
TUNEL apoptosis assay results
The level of apoptosis in each group was determined
using TUNEL staining. As shown in Fig.
2, there were fewer TUNEL-positive cells in NC group, and they
could hardly be observed. The number of TUNEL-positive cells in 0.2
µM Rapamycin group and 0.4 µM Rapamycin group was obviously higher
than that in NC group, and it was the highest in 0.4 µM Rapamycin
group (P<0.05). The above results suggest that Rapamycin can
promote apoptosis of Y79 cells.
Cell cycle detection via flow
cytometry
The cell cycle in each group was detected using flow
cytometry. The results manifested that there were more cells in S
phase and fewer cells in G2 phase in 0.2 µM Rapamycin group and 0.4
µM Rapamycin group. The cell cycle in 0.4 µM Rapamycin group was
obviously superior to that in 0.2 µM Rapamycin group (P<0.05)
(Table III). The above findings
demonstrate that 0.4 µM of Rapamycin can inhibit the proliferation
of retinoblastoma cells, and arrest the cell cycle in S phase.
| Table III.Cell cycle detection (%). |
Table III.
Cell cycle detection (%).
| Group/Cycle | G1 | S | G2 |
|---|
| NC | 28.4±0.5 | 49.0±0.4 | 22.6±0.6 |
| 0.2 µM Rapamycin | 28.6±0.4a | 60.5±0.1a | 11.9±0.8a |
| 0.4 µM Rapamycin | 29.0±0.5b | 66.5±0.7b | 4.5±0.9b |
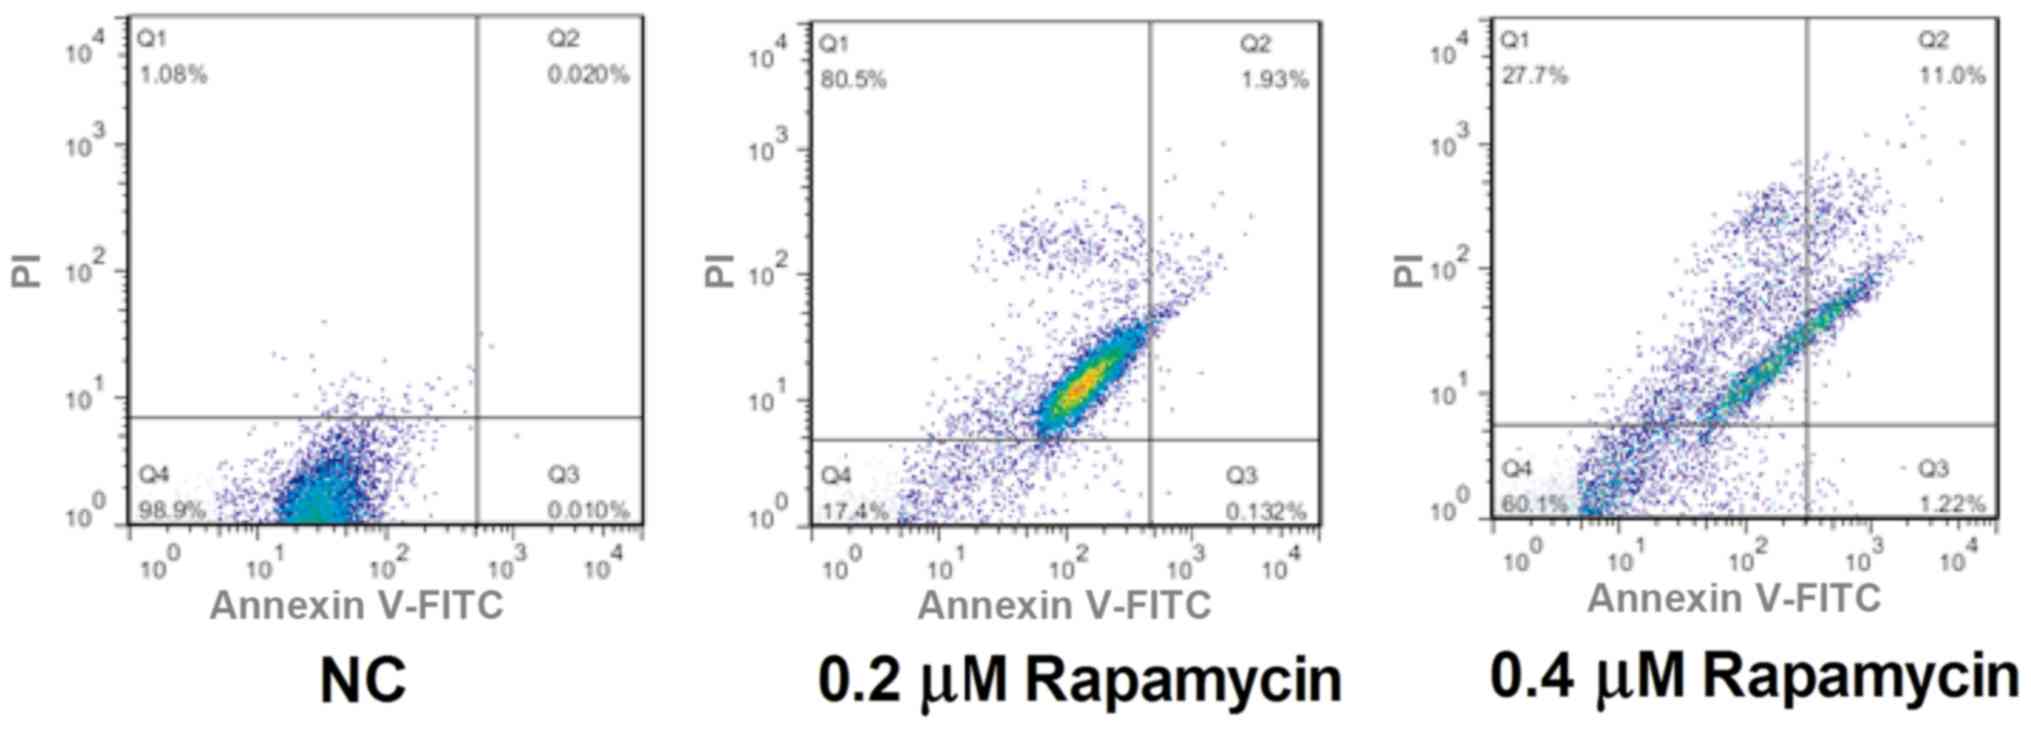
Apoptosis detection using flow
cytometry
Apoptosis level in each group was determined through
flow cytometry. It was found that the apoptosis rate in NC group
was lower, and the apoptotic cells could hardly be observed. The
number of apoptotic cells was obviously increased in 0.2 µM
Rapamycin group and 0.4 µM Rapamycin group compared with that in NC
group, and it was the highest in 0.4 µM Rapamycin group (P<0.05)
(Fig. 3), indicating that Rapamycin
can promote apoptosis of Y79 cells.
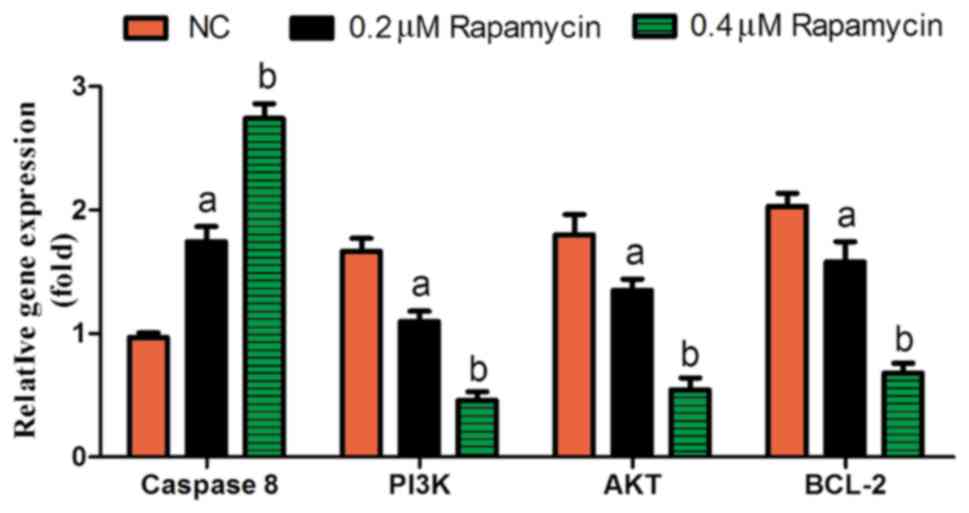
RT-PCR results
The results of RT-PCR revealed that 0.2 µM Rapamycin
group and 0.4 µM Rapamycin group had evidently lower expression
levels of Bcl-2, PI3K and AKT, and evidently higher expression of
Caspase 8 (P<0.05), while the above expression levels were the
opposite in NC group (Fig. 4), which
suggests that Rapamycin suppresses cell proliferation and promotes
apoptosis, further inhibiting the occurrence of retinal
diseases.
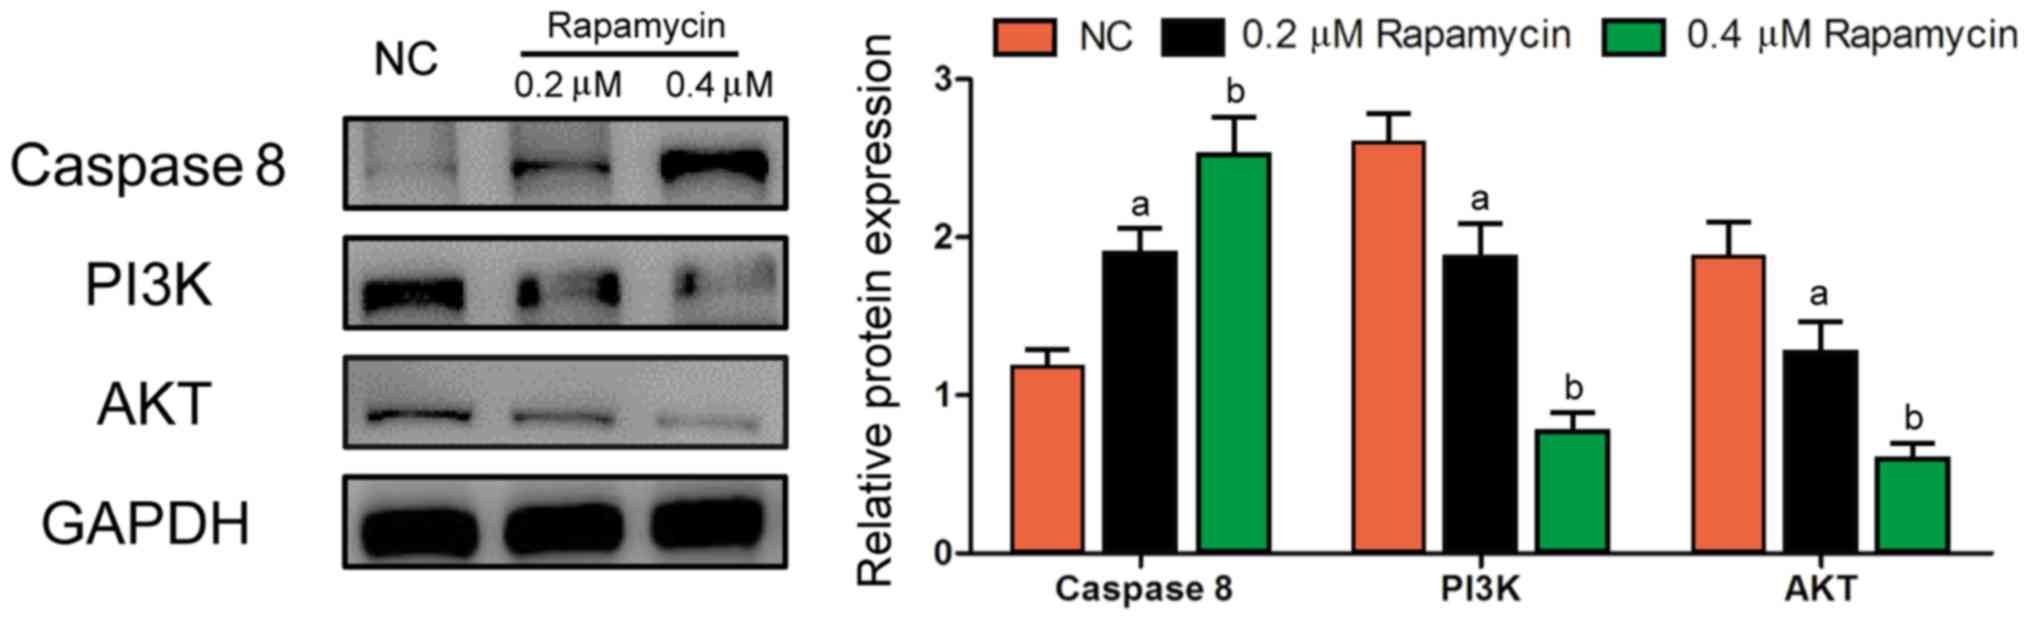
Western blot results
According to the results of western blotting, 0.2 µM
Rapamycin group and 0.4 µM Rapamycin group had remarkably lower
protein levels of PI3K and AKT (P<0.05) and a remarkably higher
protein level of Caspase 8 (P<0.05), while the above levels were
the opposite in NC group (Fig. 5),
which suggests that Rapamycin suppresses cell proliferation and
promotes apoptosis through inhibiting the PI3K/AKT signaling
pathway. Rabbit polyclonal Akt antibody (dilution: 1:500; cat. no.:
ab8805); rabbit monoclonal; Caspase 8 antibody (dilution: 1:500;
cat. no.: ab32397); rabbit polyclonal PI3K antibody (dilution:
1:500; cat. no.: ab70912); rabbit polyclonal GAPDH antibody
(dilution: 1:500, cat. no.: ab37168) and secondary goat anti-rabbit
(HRP) IgG antibody (dilution: 1/2000; cat. no.: ab6721) were all
purchased from Abcam.
Discussion
Retinoblastoma is the most common primary
intraocular malignant tumor in infants and young children. Despite
some progress made in the treatment of retinoblastoma, some major
problems have not been resolved yet, including the secondary
malignant tumors, such as osteosarcoma. Therefore, it is urgent to
search for new therapeutic strategies to improve the clinical
efficacy of patients with retinoblastoma. Rapamycin is a kind of
macrolide produced by Streptomyces, which can contribute to the
treatment of some cancers through inhibiting the Rapamycin target
pathway in mammals (16). In the
present study, the effects of Rapamycin on the proliferation and
apoptosis of retinoblastoma cells through the PI3K/AKT pathway were
explored. It was found through CCK-8 assay that the proliferation
ability of Y79 cells was significantly stronger in NC group than
that in other groups at 24, 48, 72 and 96 h, and it was the weakest
in 0.4 µM Rapamycin group. In addition, the cell cycle was detected
using flow cytometry. The results manifested that there were more
cells in S phase and fewer cells in G2 phase in 0.2 µM Rapamycin
group and 0.4 µM Rapamycin group. The cell cycle in 0.4 µM
Rapamycin group was obviously superior to that in 0.2 µM Rapamycin
group. The above findings demonstrate that 0.4 µM of Rapamycin can
inhibit the proliferation of retinoblastoma cells, and arrest the
cell cycle in S phase, consistent with previous studies (17). The level of ROS in cancer cells is
higher than that in normal cells due to oncogene stimulation,
increased metabolic activity and mitochondrial dysfunction. Under
the condition of continuous oxidative stress, cancer cells are
adapted through a series of mechanisms, which not only activate ROS
scavenging system, but also inhibit cell apoptosis. Therefore,
understanding the ROS adaptation mechanism is very important for
killing cancer cells and solving the problem of drug resistance.
SOD is ubiquitous and prevents the optic nerve conduction
abnormality. MDA can resist the effect of SOD, with cytotoxicity
(18). In this study, we chose the
dose of Rapamycin (0.2 and 0.4 µM) based on our preliminary
experimental results, which was the basis of this study. Results
showed that in 0.2 µM Rapamycin group and 0.4 µM Rapamycin group,
the content of ROS and MDA was significantly decreased, while that
of SOD was significantly increased, all of which were markedly
superior in 0.4 µM Rapamycin group to those in 0.2 µM Rapamycin
group, indicating that 0.4 µM of Rapamycin can inhibit the
oxidative stress, further suppressing the occurrence of
retinoblastoma. The mitochondrial function should be further
examined to more accurately account for this effects.
Apoptosis can be induced by internal and external
signals, and the release of cytochrome c due to the loss of
mitochondrial membrane potential is the key to the activation of
Caspase 9, causing intracellular damage. The apoptosis activator
transmits signals to the cytoplasm, leading to the activation of
Caspase 8, and results in apoptosis through the in vitro
pathway (19,20). The cleaved Caspase 8 and 9
accompanied by the cascade activation of Caspase have been observed
in studies, and Rapamycin can trigger the intrinsic and extrinsic
PI3K/AKT apoptotic pathways of human retinoblastoma Y79 cells, thus
facilitating apoptosis (21). In
this study, the apoptosis level in each group was determined using
TUNEL staining. It was found that there were fewer TUNEL-positive
cells in NC group, and they could hardly be seen. The number of
TUNEL-positive cells in 0.2 µM Rapamycin group and 0.4 µM Rapamycin
group was obviously larger than that in NC group, and it was the
largest in 0.4 µM Rapamycin group. Moreover, the results of flow
cytometry showed that the apoptosis rate in NC group was lower, and
the apoptotic cells could hardly be observed. The number of
apoptotic cells was obviously increased in 0.2 µM Rapamycin group
and 0.4 µM Rapamycin group compared with that in NC group, and it
was the largest in 0.4 µM Rapamycin group, indicating that
Rapamycin can promote apoptosis of Y79 cells. The PI3K/AKT pathway
is a central regulator for cancer proliferation, tumorigenesis and
metastasis. PI3K is a lipid kinase family that phosphorylates the
phosphate-3-hydroxyl. Both AKT and mTOR are downstream targets of
PI3K, and they can stimulate protein synthesis, cell growth and
proliferation. mTOR is an important component of the network, as
well as a PI3K-associated serine-threonine kinase that can regulate
anti-apoptosis and survival mechanisms through phosphorylating AKT
(22,23). In this study, the results of RT-PCR
revealed that 0.2 µM Rapamycin group and 0.4 µM Rapamycin group had
evidently lower expression levels of Bcl-2, PI3K and AKT, and
evidently higher expression of Caspase 8, while the above
expression levels were the opposite in NC group. According to the
results of western blotting, 0.2 µM Rapamycin group and 0.4 µM
Rapamycin group had remarkably lower protein levels of PI3K and AKT
and a remarkably higher protein level of Caspase 8, while the above
levels were the opposite in NC group, which suggests that Rapamycin
suppresses proliferation and promotes apoptosis of retinoblastoma
cells through inhibiting the PI3K/AKT signaling pathway, thereby
further inhibiting the occurrence of retinal diseases. Differently,
Wang et al (21) found that
Rapamycin disturbed mitochondrial membrane potential and
subsequently helped cytochrome c release from mitochondria
to cytosol and activated Caspase 8, inducing apoptosis in human
retinoblastoma Y79 cells. In subsequent research, animal
experiments need to be introduced to further explore the deeper
regulatory mechanism of PI3K/AKT signaling pathway from in
vivo and in vitro levels.
In conclusion, it was found that Rapamycin may
regulate the proliferation and apoptosis of retinoblastoma cells
through inhibiting the PI3K/AKT signaling pathway, so Rapamycin may
be used as a therapeutic drug for patients with retinoblastoma.
Acknowledgements
Not applicable.
Funding
No funding was received.
Availability of data and materials
All data generated or analyzed during this study are
included in this published article.
Authors' contributions
JY, MX and ZL designed the study and performed the
experi-ments; JY and ZL collected the data; MX and ZL analyzed the
data; JY, MX and ZL prepared the manuscript. All authors read and
approved the final manuscript.
Ethics approval and consent to
participate
Not applicable.
Patient consent for publication
Not applicable.
Competing interests
The authors declare that they have no competing
interests.
References
|
1
|
Bi LL, Han F, Zhang XM and Li YY: LncRNA
MT1JP acts as a tumor inhibitor via reciprocally regulating
Wnt/β-Catenin pathway in retinoblastoma. Eur Rev Med Pharmacol Sci.
22:4204–4214. 2018.PubMed/NCBI
|
|
2
|
Broaddus E, Topham A and Singh AD:
Survival with retinoblastoma in the USA: 1975–2004. Br J
Ophthalmol. 93:24–27. 2009. View Article : Google Scholar : PubMed/NCBI
|
|
3
|
Yin L, Sun Z, Ren Q, Su X and Zhang D:
Methyl eugenol induces potent anticancer effects in RB355 human
retinoblastoma cells by inducing autophagy, cell cycle arrest and
inhibition of PI3K/mTOR/Akt signalling pathway. J BUON.
23:1174–1178. 2018.PubMed/NCBI
|
|
4
|
Wang HF, Zheng SF, Chen Y, Zhou ZY and Xu
J: Correlations between claudin-1 and PIGF expressions in
retinoblastoma. Eur Rev Med Pharmacol Sci. 22:4196–4203.
2018.PubMed/NCBI
|
|
5
|
Zheng Q, Zhang Y, Ren Y, Wu Y, Yang S,
Zhang Y, Chen H, Li W and Zhu Y: Antiproliferative and apoptotic
effects of indomethacin on human retinoblastoma cell line Y79 and
the involvement of β-catenin, nuclear factor-κB and Akt signaling
pathways. Ophthalmic Res. 51:109–115. 2014. View Article : Google Scholar : PubMed/NCBI
|
|
6
|
Vézina C, Kudelski A and Sehgal SN:
Rapamycin (AY-22,989), a new antifungal antibiotic. I. Taxonomy of
the producing streptomycete and isolation of the active principle.
J Antibiot (Tokyo). 28:721–726. 1975. View Article : Google Scholar : PubMed/NCBI
|
|
7
|
Milani BY, Milani FY, Park DW, Namavari A,
Shah J, Amirjamshidi H, Ying H and Djalilian AR: Rapamycin inhibits
the production of myofibroblasts and reduces corneal scarring after
photorefractive keratectomy. Invest Ophthalmol Vis Sci.
54:7424–7430. 2013. View Article : Google Scholar : PubMed/NCBI
|
|
8
|
Ocana A, Vera-Badillo F, Al-Mubarak M,
Templeton AJ, Corrales-Sanchez V, Diez-Gonzalez L, Cuenca-Lopez MD,
Seruga B, Pandiella A and Amir E: Activation of the PI3K/mTOR/AKT
pathway and survival in solid tumors: Systematic review and
meta-analysis. PLoS One. 9:e952192014. View Article : Google Scholar : PubMed/NCBI
|
|
9
|
Moirangthem DS, Laishram S, Rana VS, Borah
JC and Talukdar NC: Essential oil of Cephalotaxus griffithii
needle inhibits proliferation and migration of human cervical
cancer cells: Involvement of mitochondria-initiated and death
receptor-mediated apoptosis pathways. Nat Prod Res. 29:1161–1165.
2015. View Article : Google Scholar : PubMed/NCBI
|
|
10
|
Kwon SJ, Lee JH, Moon KD, Jeong IY, Yee
ST, Lee MK and Seo KI: Isoegomaketone induces apoptosis in SK-MEL-2
human melanoma cells through mitochondrial apoptotic pathway via
activating the PI3K/Akt pathway. Int J Oncol. 45:1969–1976. 2014.
View Article : Google Scholar : PubMed/NCBI
|
|
11
|
Yang Z, Fang S, Di Y, Ying W, Tan Y and Gu
W: Modulation of NF-κB/miR-21/PTEN pathway sensitizes non-small
cell lung cancer to cisplatin. PLoS One. 10:e01215472015.
View Article : Google Scholar : PubMed/NCBI
|
|
12
|
Wu YR, Qi HJ, Deng DF, Luo YY and Yang SL:
MicroRNA-21 promotes cell proliferation, migration, and resistance
to apoptosis through PTEN/PI3K/AKT signaling pathway in esophageal
cancer. Tumour Biol. 37:12061–12070. 2016. View Article : Google Scholar : PubMed/NCBI
|
|
13
|
Dobbin ZC and Landen CN: The importance of
the PI3K/AKT/MTOR pathway in the progression of ovarian cancer. Int
J Mol Sci. 14:8213–8227. 2013. View Article : Google Scholar : PubMed/NCBI
|
|
14
|
Sarbassov DD, Guertin DA, Ali SM and
Sabatini DM: Phosphorylation and regulation of Akt/PKB by the
rictor-mTOR complex. Science. 307:1098–1101. 2005. View Article : Google Scholar : PubMed/NCBI
|
|
15
|
Heavey S, O'Byrne KJ and Gately K:
Strategies for co-targeting the PI3K/AKT/mTOR pathway in NSCLC.
Cancer Treat Rev. 40:445–456. 2014. View Article : Google Scholar : PubMed/NCBI
|
|
16
|
Chen Z, Yang L, Liu Y, Tang A, Li X, Zhang
J and Yang Z: LY294002 and Rapamycin promote coxsackievirus-induced
cytopathic effect and apoptosis via inhibition of PI3K/AKT/mTOR
signaling pathway. Mol Cell Biochem. 385:169–177. 2014. View Article : Google Scholar : PubMed/NCBI
|
|
17
|
Wang YD, Su YJ, Li JY, Yao XC and Liang
GJ: Rapamycin, a mTOR inhibitor, induced growth inhibition in
retinoblastoma Y79 cell via down-regulation of Bmi-1. Int J Clin
Exp Pathol. 8:5182–5188. 2015.PubMed/NCBI
|
|
18
|
Al-Malki AL: Oat attenuation of
hyperglycemia-induced retinal oxidative stress and NF-κB activation
in streptozotocin-induced diabetic rats. Evid Based Complement
Alternat Med. 2013:9839232013. View Article : Google Scholar : PubMed/NCBI
|
|
19
|
Valero T: Mitochondrial biogenesis:
Pharmacological approaches. Curr Pharm Des. 20:5507–5509. 2014.
View Article : Google Scholar : PubMed/NCBI
|
|
20
|
Ashkenazi A: Targeting the extrinsic
apoptotic pathway in cancer: Lessons learned and future directions.
J Clin Invest. 125:487–489. 2015. View
Article : Google Scholar : PubMed/NCBI
|
|
21
|
Wang YD, Su YJ, Li JY, Yao XC and Liang
GJ: Rapamycin, an mTOR inhibitor, induced apoptosis via independent
mitochondrial and death receptor pathway in retinoblastoma Y79
cell. Int J Clin Exp Med. 8:10723–10730. 2015.PubMed/NCBI
|
|
22
|
Sheppard K, Kinross KM, Solomon B, Pearson
RB and Phillips WA: Targeting PI3 kinase/AKT/mTOR signaling in
cancer. Crit Rev Oncog. 17:69–95. 2012. View Article : Google Scholar : PubMed/NCBI
|
|
23
|
Markman B, Dienstmann R and Tabernero J:
Targeting the PI3K/Akt/mTOR pathway - beyond rapalogs. Oncotarget.
1:530–543. 2010. View Article : Google Scholar : PubMed/NCBI
|