Introduction
Glioma is the most common type of primary
intracranial tumors in adults and is associated with a poor
prognosis (1–6). The majority of clinical studies
neglected the evaluation of survival time after the change in the
World Health Organization definition that was put forward in 2000
(7–11). Although a limited number of patients
(2-5%) survive >3 years (reported in 2007) (12,13), the
median survival time of most patients is only 15 months (reported
in 2012) (14). Currently, the
standard treatment for patients with glioma involves surgical
resection, followed by a combination of the chemotherapy drug
temozolomide and radiotherapy (15,16).
Despite the effective treatment strategy, the prognosis for glioma
remains poor, with a median survival period of ~14.6 months and a
3-year survival rate of 10% (reported in 2009) (15). In contrast to therapies developed for
other types of cancer, simple and small improvements have been made
in the treatment of glioma over the recent decades; the
pathophysiology of glioma remains to be clearly elucidated, and the
discovery of novel molecular targets is imperative for the advanced
therapy of glioma.
The frequently rearranged in advanced T-cell
lymphomas 1 (FRAT1) gene is a protooncogene that was first cloned
from T-cell lymphoma (17). FRAT1
acts as a positive regulator of the Wnt/β-catenin pathway (18,19) and
is able to suppress glycogen synthase kinase-3 (GSK-3)-mediated
phosphorylation (18,20). High expression of FRAT1 has been
identified in breast, cervical, ovarian, esophageal and non-small
cell lung cancer, suggesting its crucial role in malignant tumors
(21–26). In addition, FRAT1 knockdown has been
demonstrated to inhibit the expression levels of β-catenin, cyclin
D1 (CCND1) and c-myc in hepatocellular carcinoma cells under
hypoxic conditions (27). A previous
study has suggested that FRAT1 may be a useful molecular marker for
diagnosis by acting as a prognostic indicator of glioma, and a
promising candidate protein for glioma therapy (28). Although FRAT1 expression has been
identified to be associated with glioma, further understanding of
the detailed molecular mechanisms is required in order to improve
the efficacy of conventional therapeutic regimens.
Research focusing on the genome level of diseases
has become increasingly common due to the continuous advancements
in biotechnology. Gene expression profiling provides an insight
into the process of tumorigenesis and has been identified as an
efficient method for the identification of pathogenic genes
(29). Based on a recent study on
the protumorigenic role of STAT1 in glioblastoma (30) and a previous study (28), FRAT1 was identified as a novel target
biomarker in glioma. The aim of the present study was to elucidate
the potential association between STAT1 and FRAT1 expression and to
analyze the expression levels of STAT1 in glioma cells by gene
expression profiling.
Materials and methods
Cell culture
Tumor cells were used to construct glioma samples as
previously described (28).
According to the same study (28),
FRAT1 was highly expressed in U251 cells. Thus, in the current
study, U251 cells were selected to observe the expression of STAT1
and investigate the mechanism of FRAT1 in glioma. U251 cell lines
were purchased from the American Type Culture Collection, cultured
in Dulbecco's modified Eagle's medium containing 10% fetal bovine
serum (Gibco; Thermo Fisher Scientific, Inc.) and maintained in a
humidified incubator (CO2 water-jacketed incubator;
Thermo Electron Corporation) at 37°C in an atmosphere of 5%
CO2 and 95% air.
Transfection
Transfection was performed according to a previously
described method (28). To generate
stable FRAT1 knockdown cell lines, the pRNAT-U6.1/Neo plasmid
(GenScript), which carries the green fluorescence protein gene, was
selected for the expression of short hairpin RNAs (shRNAs)
targeting FRAT1. The DNA oligonucleotides (Biomics Co., Ltd) with
the sense and the antisense shRNAs sequences separated by a 9 bp
spacer and having BamHI and HindIII compatible
overhanging ends were fused to linearized pRNAT-U6.1/Neo plasmid.
All of the plasmids were confirmed by sequencing. After
constructing the shRNA plasmid, the most potent plasmid for the
knockdown of FRAT1 was identified, designated as pRNAT-FRAT1, which
was used to knock- down FRAT1 expression in subsequent
experiments.
In gene transfection, 2×10⁵ U251 cells
per well were plated onto 6-well plates and grown overnight to
60–70% confluence. Subsequently, these cells were transfected with
pRNAT-FRAT1 and empty pRNAT-U6.1/Neo vector using Lipofectamine™
2000 reagent (Invitrogen; Thermo Fisher Scientific, Inc.) under
standard conditions. According to the multiplicity of infection,
the amount of transfected plasmid was 0.7 µl of 6×10⁸
TU/ml. Untransfected parental cells were used as control for stable
selection. Fluorescence microscope (Olympus micropublisher 3.3RTV;
Olympus Corporation) were used to observe the expression of green
fluorescence protein, the cells with fluorescence ratio of ≥80%
were used for subsequent experiments. And the time interval between
transfection and subsequent experimentation was 168 h. The FRAT1
sequences were as follows: 5′-GAGCTGGCAAGCAGGGCAT-3′,
5′-AGCTAGTGCTCTCTGGAAA-3′ and 5′-GCAGTTACGTGCAAAGCTT-3′.
Gene expression profiling and
hierarchical clustering analysis
Total RNA was extracted from U251 cell lines using
TRIzol® reagent (Invitrogen; Thermo Fisher Scientific,
Inc.), followed by purification on an RNeasy column (Qiagen, Inc.).
The integrity of RNA was assessed using a bioanalyzer (Agilent
Technologies, Inc.). The total extracted RNA (100 ng) was labeled
and hybridized to Human Gene 1.0 ST microarrays (Affymetrix; Thermo
Fisher Scientific, Inc.) according to the manufacturer's protocol.
The differential expression of genes were calculated based on the
log2-fold change between the normal U251 cells samples
(4448-1, 4448-2, 4448-3) and FRAT1 knockdown (4449-1, 4449-2,
4449-3) U251 cells samples. Bidirectional hierarchical clustering
was conducted for differentially expressed genes (DEGs) (31).
Enrichment analysis
Gene ontology (GO; http://www.geneontology.org/) terms were displayed as
a significant network using the BiNGO plug-in of Cytoscape software
(version 3.2.1) (32). The Kyoto
Encyclopedia of Genes and Genomes (KEGG; http://www.genome.jp/kegg/) database was used to
identify significantly enriched pathways with a false discovery
rate (FDR) <0.05 (33). The
Database for Annotation Visualization and Integrated Discovery was
used to identify the enriched functions with FDR<0.05 set as the
significance cut-off level (34).
Ingenuity pathway analysis (IPA)
The list of DEGs between FRAT1 knockdown and control
FRAT1 U251 cells, which contained gene identifiers and
corresponding expression values, was uploaded to the IPA software
(Qiagen, Inc.) (35). IPA was used
to evaluate the differentially expressed data associated with
metabolic pathways, molecular networks and biological processes.
Each gene identifier was matched to its corresponding gene object
in the ingenuity pathway knowledge base (http://www.ingenuity.com).
Western blot analysis
Western blot analysis was performed as previously
described (28). Briefly, cells were
harvested and lysed, and the cleared lysates (30–50 µg/well) were
separated by sodium dodecyl sulfate-polyacrylamide gel
electrophoresis (12% gel) and transferred onto nitrocellulose
membranes (EMD Millipore). After blocking for 2 h at room
temperature in Tris-buffered saline (TBS; pH 7.4) with 0.1% Tween
20 (TBS-T) containing 5% non-fat dry milk, the membranes were
incubated with primary mouse anti-FRAT1 (diluted 1;200; cat. no.
ab108405; Abcam) and mouse anti-STAT1 (diluted 1;500; cat. no.
ab3987; Abcam). Membranes were then washed in PBS-T and incubated
with horseradish peroxidase-conjugated anti-mouse secondary
antibody (diluted 1;5,000; cat. no. sc-2005; Santa Cruz
Biotechnology, Inc.) at room temperature for 1 h. The signals were
detected using enhanced chemiluminescence detection solution
(Pierce; Thermo Fisher Scientific, Inc.). Protein expression was
calculated by densitometry using the Scion Image software (Scion
Corporation).
Results
DEGs between control and FRAT1
knockdown U251 cells
U251 cell lines were used to identify DEGs in glioma
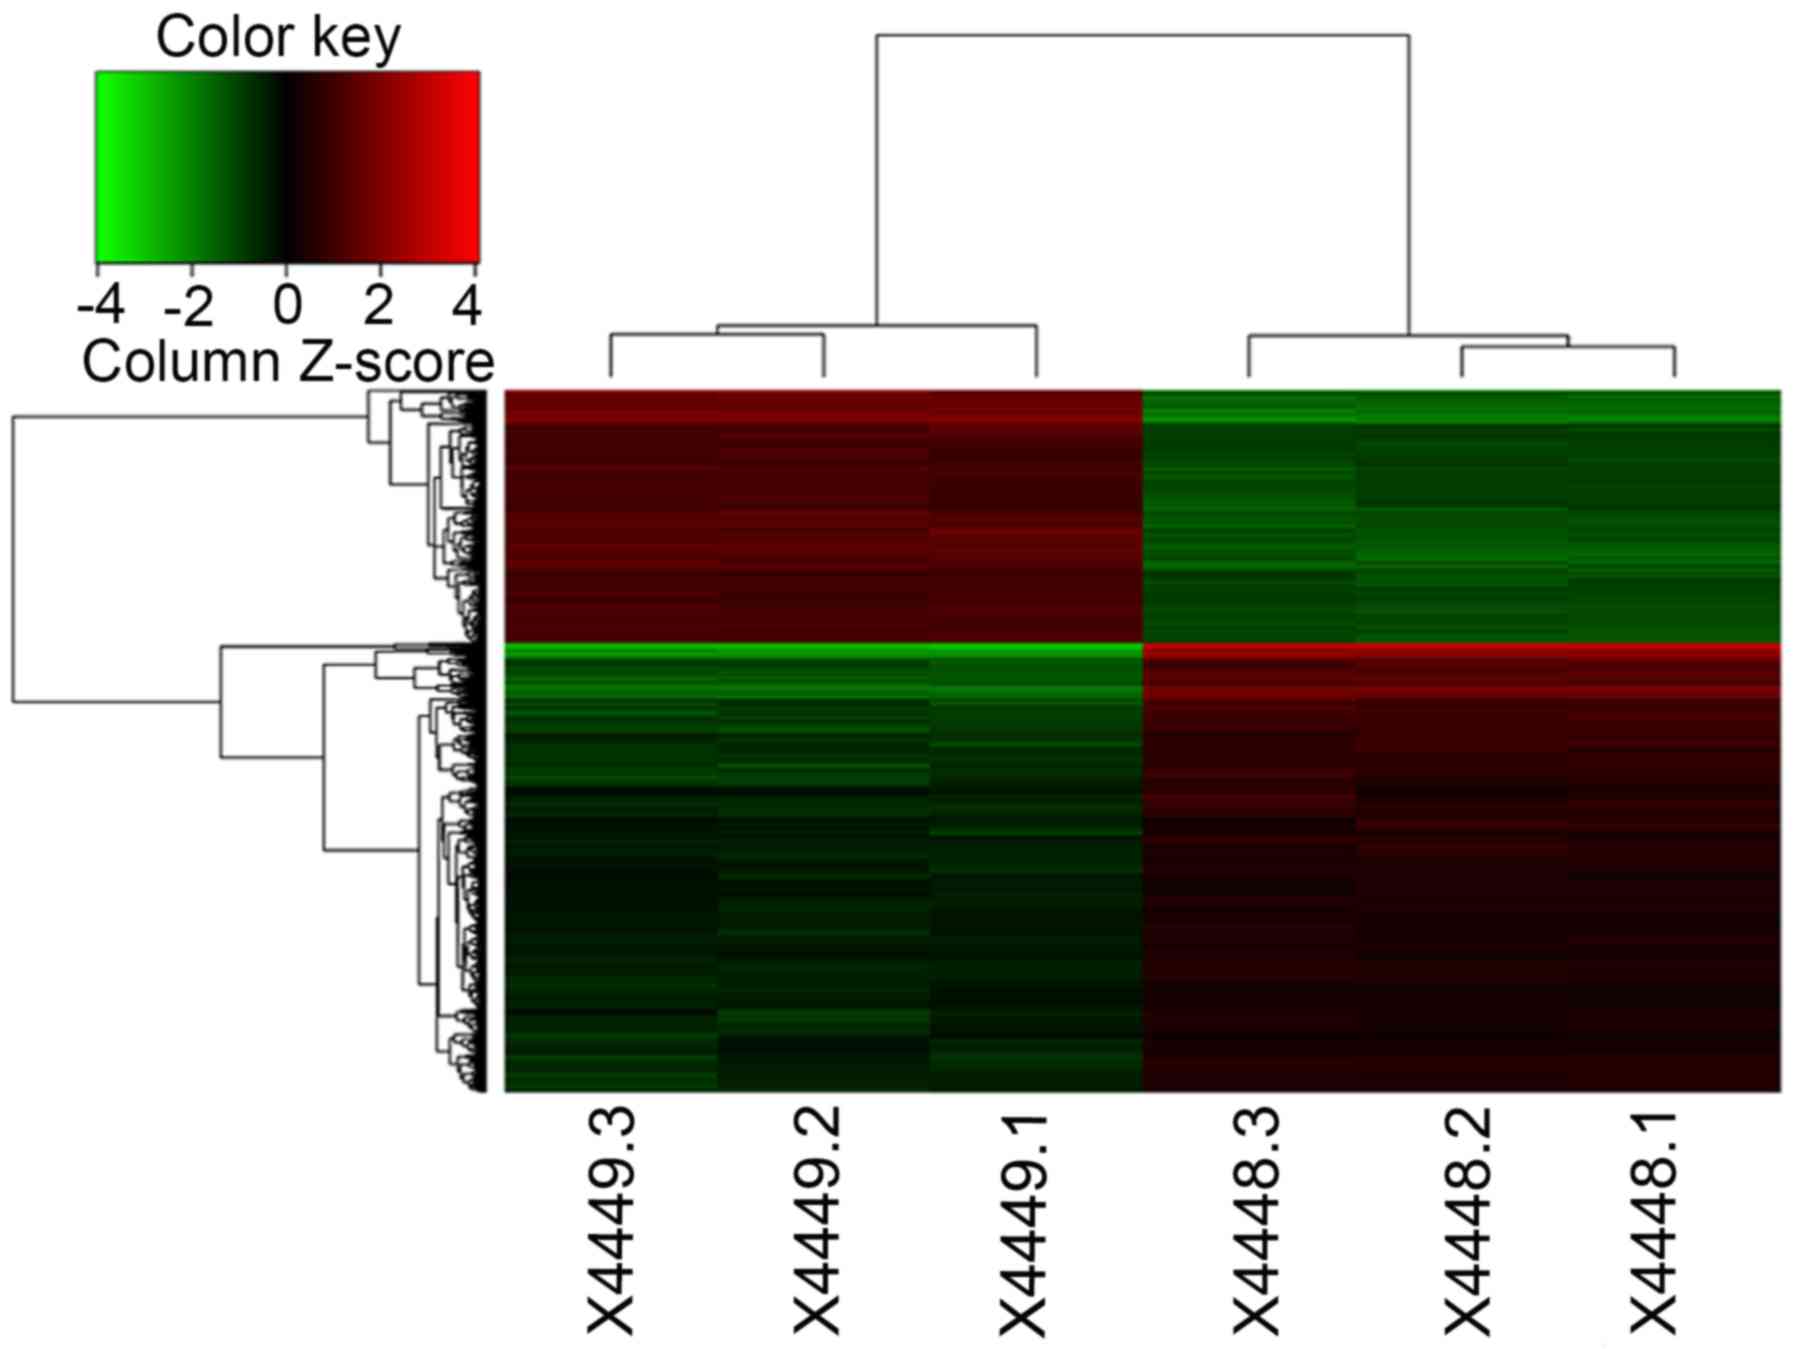
cells and to explore the changes in gene expression. A total of
1,388 genes were identified as DEGs between normal and FRAT1
knockdown cells. Of these DEGs, 493 were identified as upregulated
and 895 as downregulated in FRAT1 knockdown cells compared with
control U251 cells. Hierarchical cluster analysis revealed that the
three clusters of FRAT1 knockdown cells were distributed within the
FRAT1 knockdown cells and that the three glioma samples (4449-1,
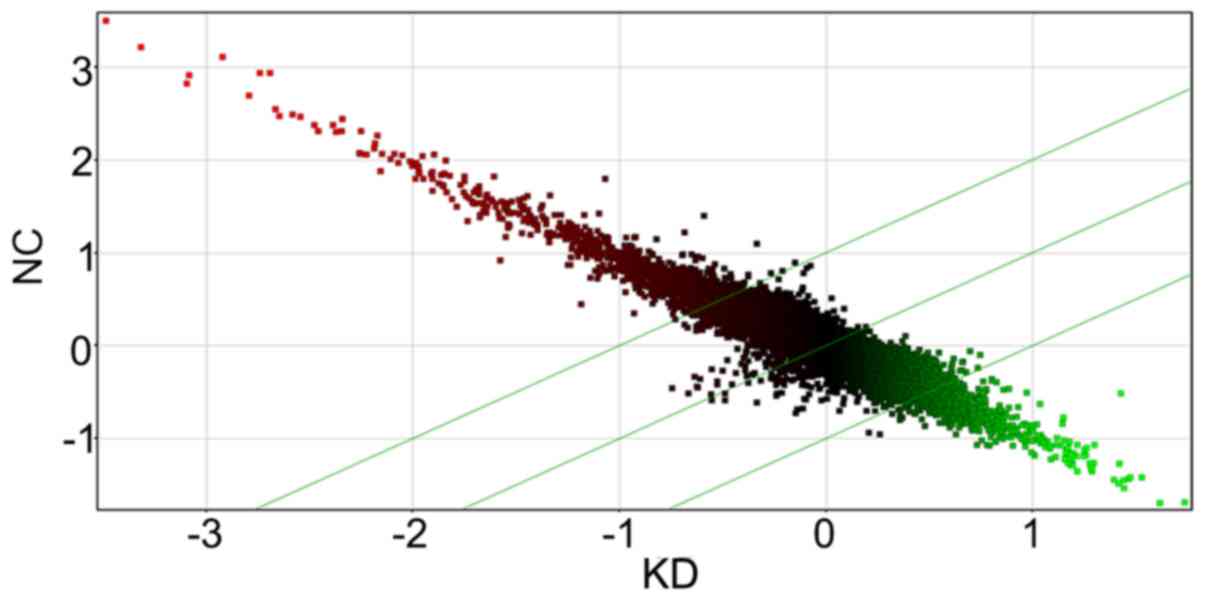
4449-2 and 4449-3) were within the glioma sample cluster (Fig. 1). In addition, the generated scatter
plot also demonstrated the differential genes expression in FRAT1
knockdown cells in comparison with the control (Fig. 2).
Functional enrichment of DEGs
To investigate the biological functions of DEGs in
FRAT1 knockdown U251 cells, GO enrichment and KEGG pathway
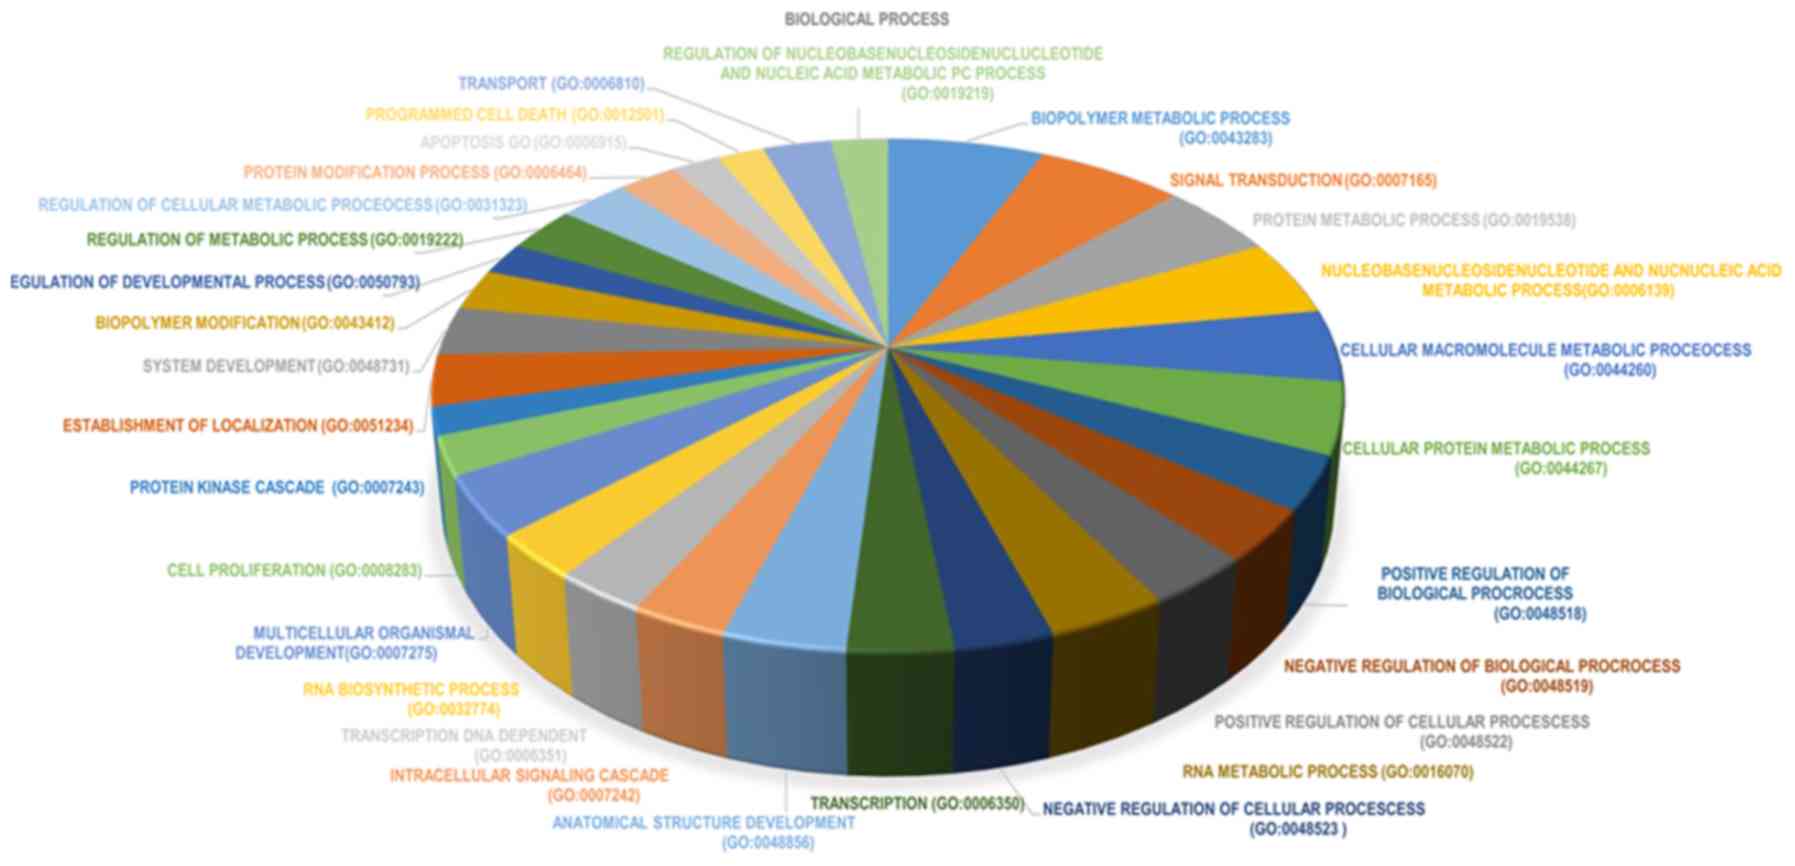
enrichment analyses were conducted. In GO enrichment analysis, the
majority of enriched GO terms were biological processes (39% of the
terms). DEGs were mainly enriched in the following biological
processes: i) ‘Biopolymer metabolic process’; ii) ‘signal
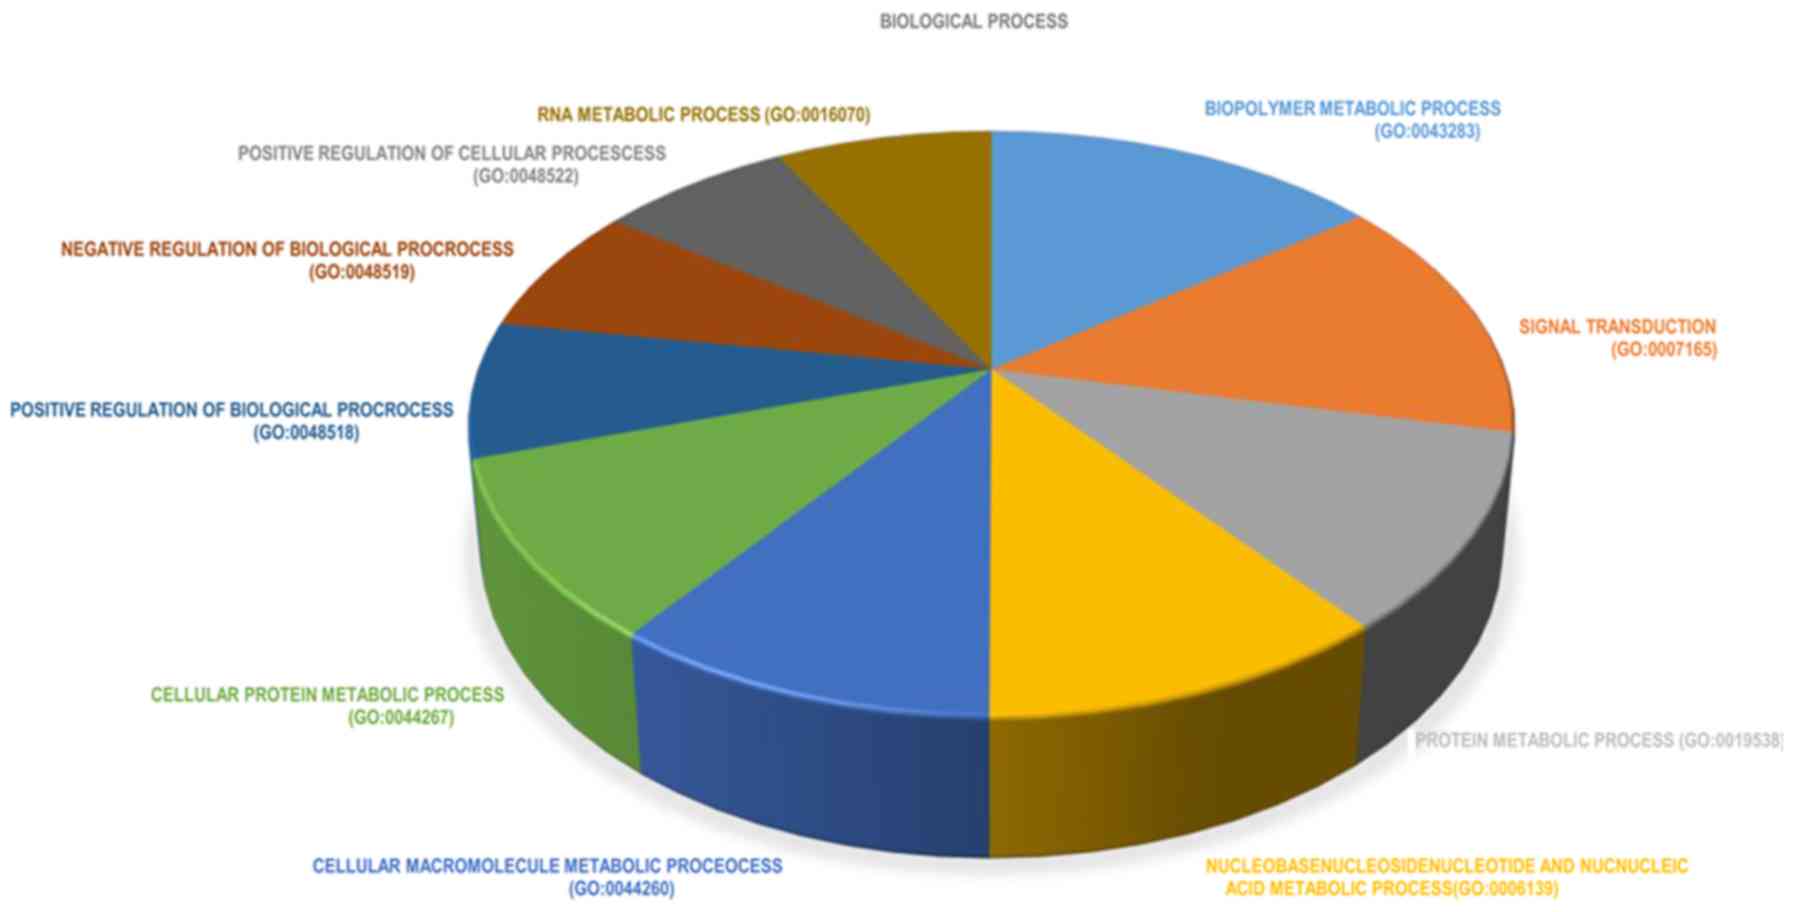
transduction’; and iii) ‘protein metabolic process’ (Fig. 3). The top 10 significantly enriched
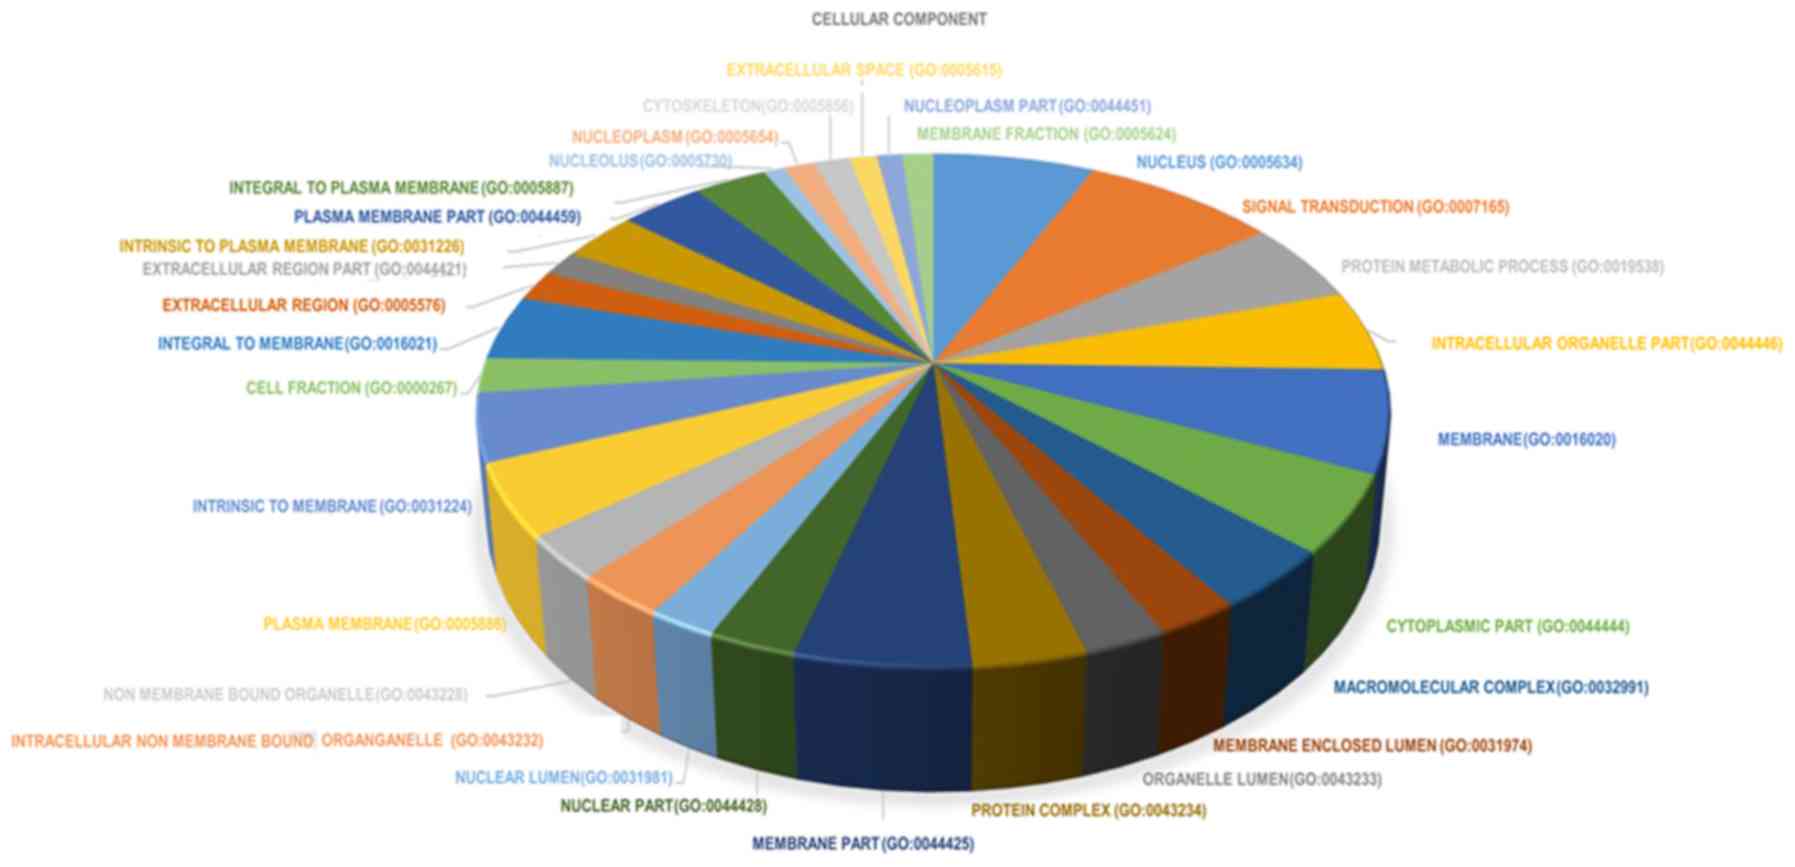
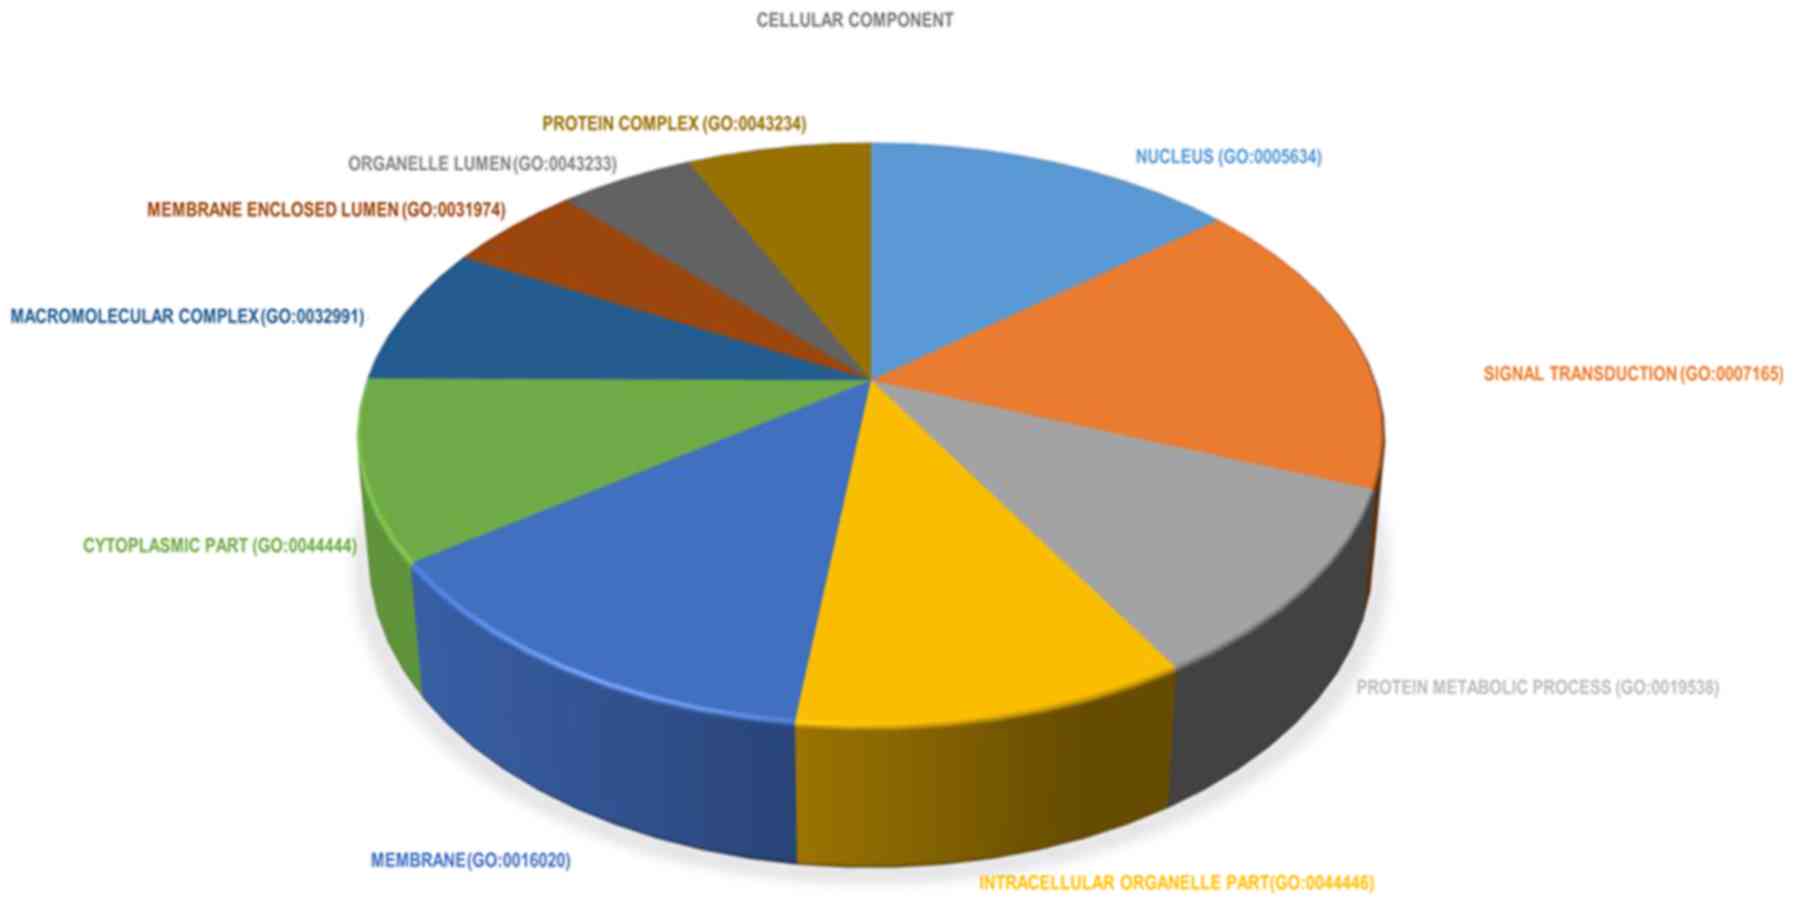
terms in biological processes were also identified (Fig. 4). In the cellular component group,
DEGs were primarily enriched in the following terms: i) ‘Nucleus’;
ii) ‘cytoplasm’; and ‘organelles’ (Fig.
5). In order to conduct a comprehensive analysis, the top 10
significantly enriched cellular component terms were also
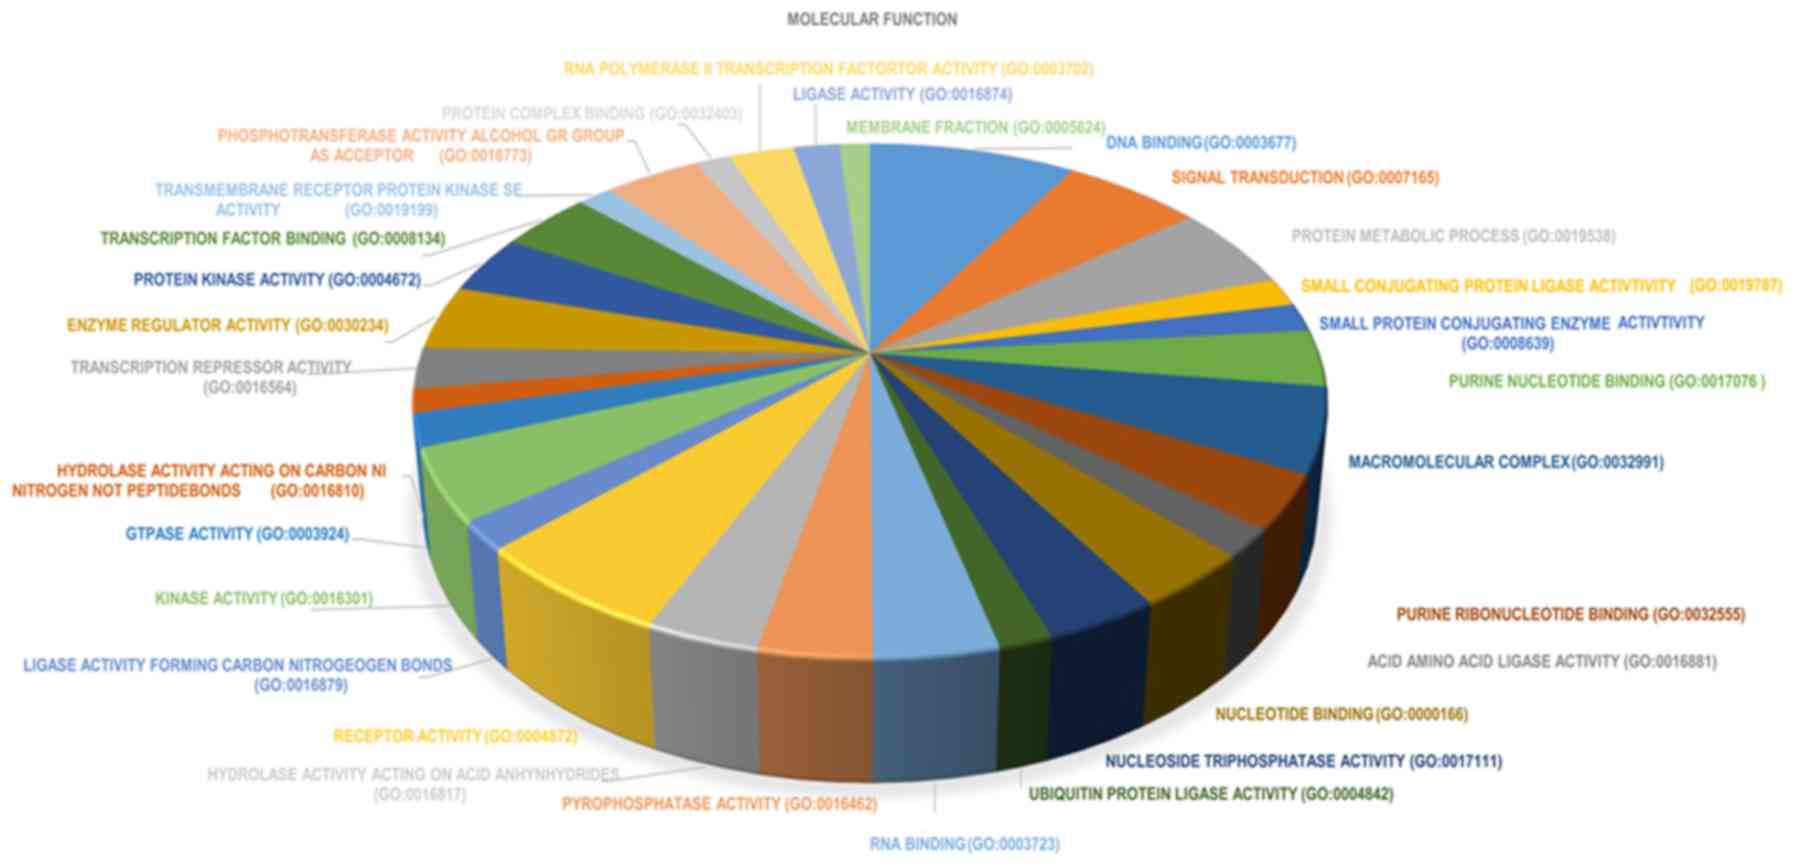
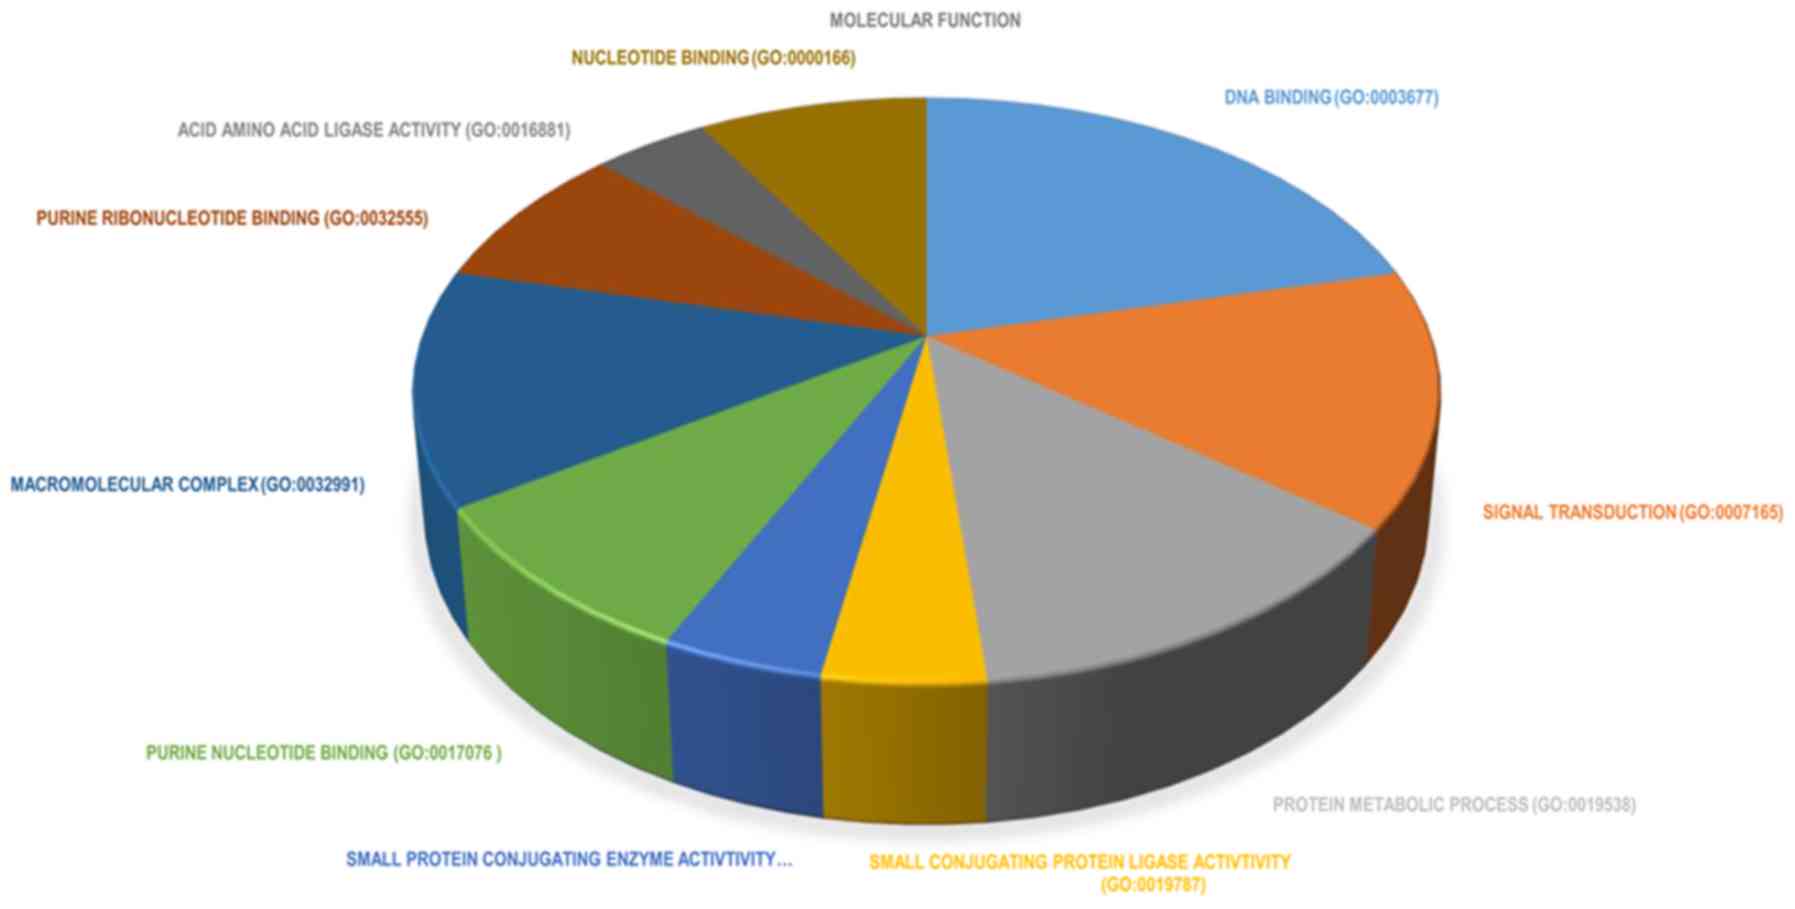
identified (Fig. 6). In the
molecular function group, DEGs were significantly enriched in: i)
‘DNA binding’; ii) ‘transcription factor activity’; and iii)
‘receptor binding’ (Fig. 7). The top
10 significantly enriched terms in molecular function are presented
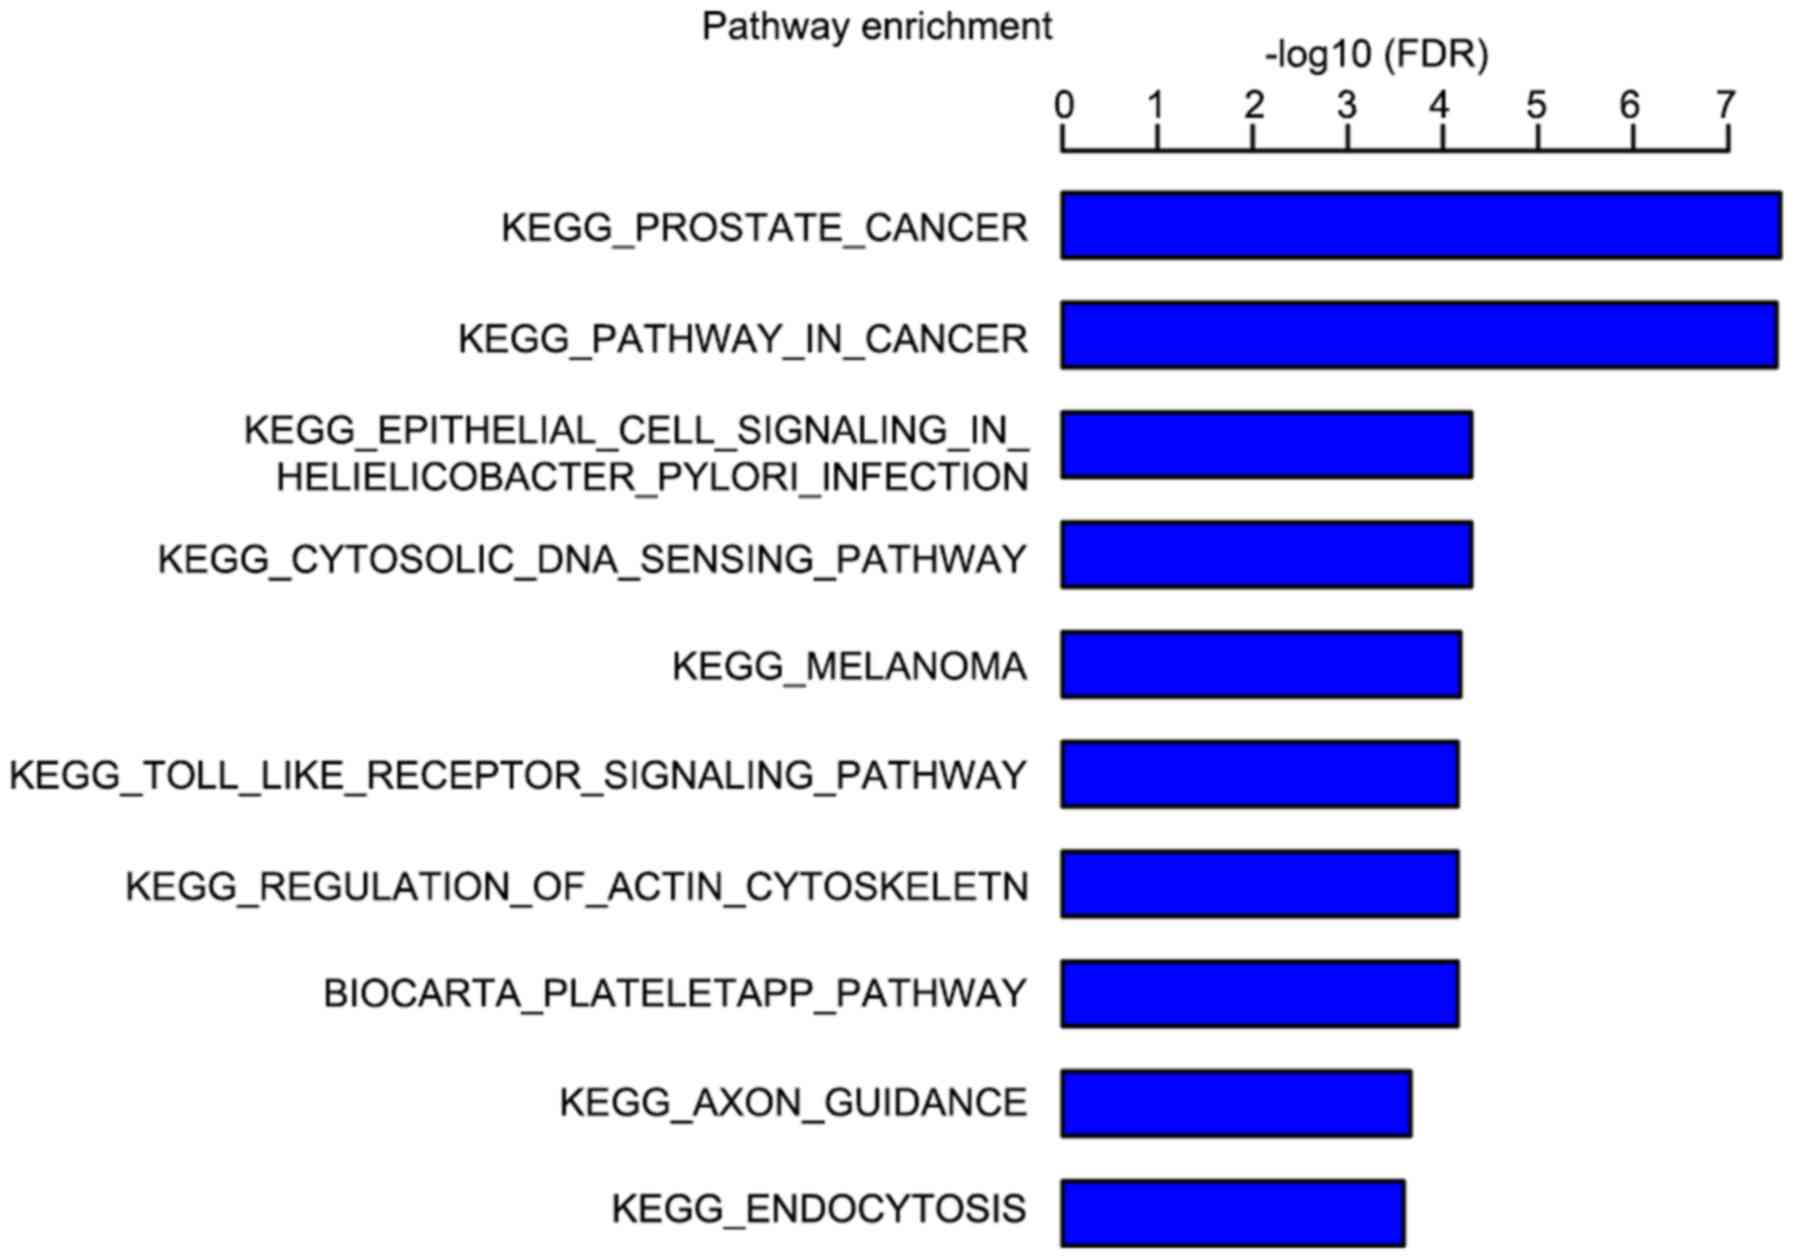
in Fig. 8. The results of the KEGG
pathway analysis revealed that differentially expressed genes
mainly enriched in the prostate cancer and cytosolic DNA-sensing
pathways following FRAT1 knockdown in glioma cells (Fig. 9).
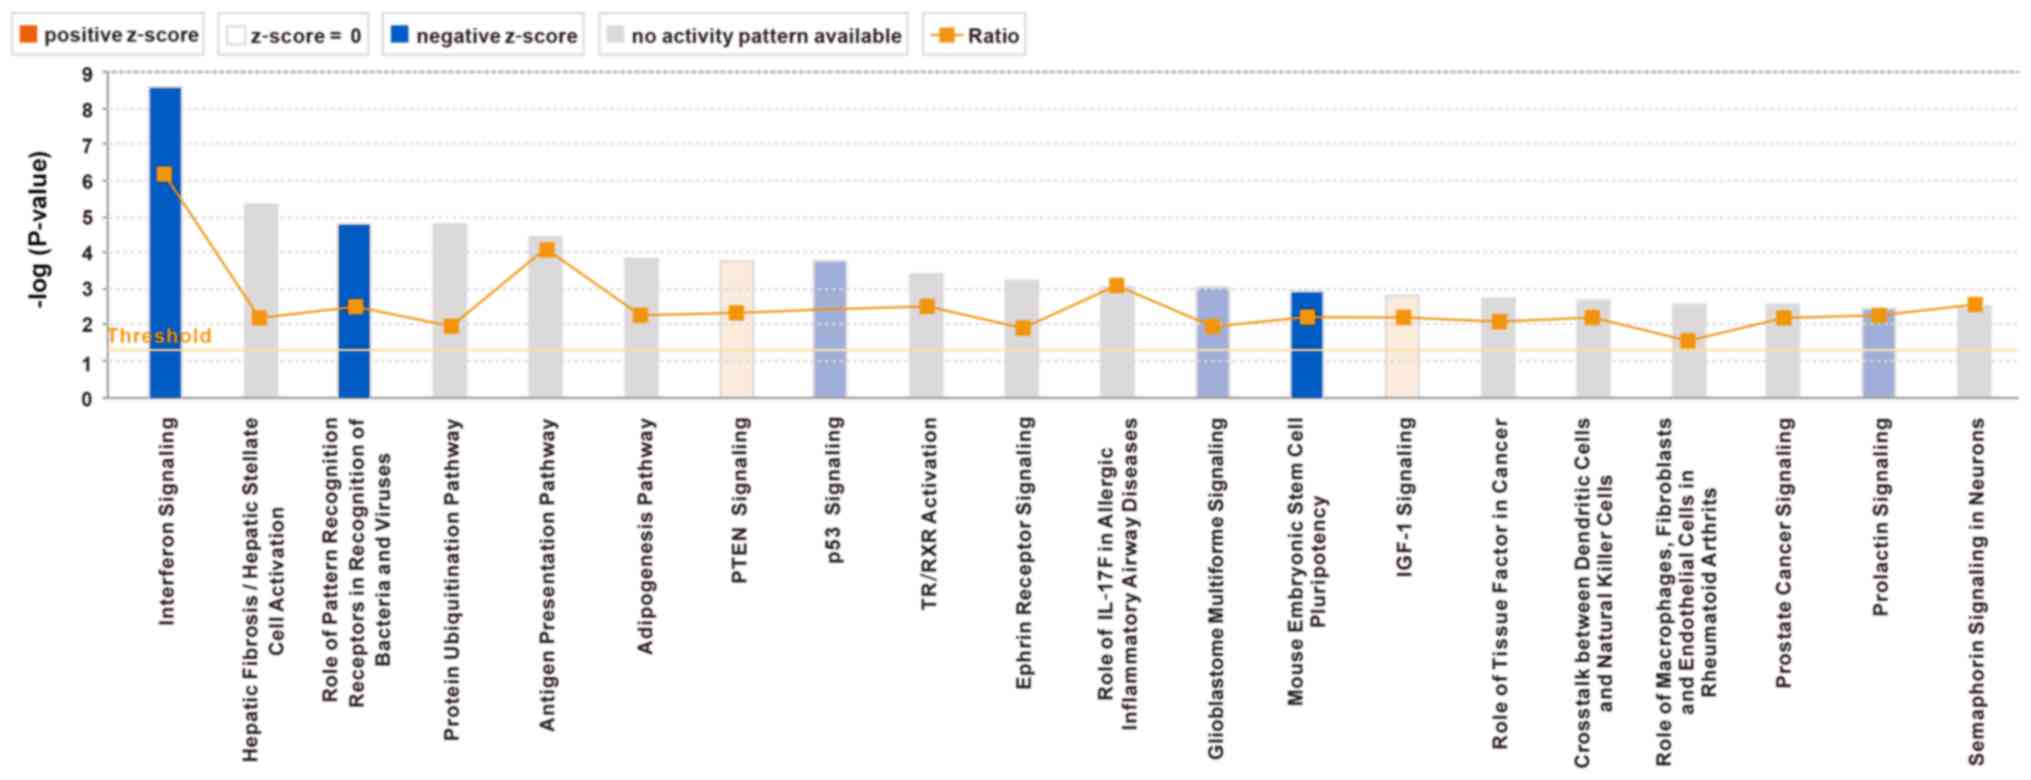
IPA
To further identify the key genes and pathways
involved in FRAT1 knockdown cells and establish the associations
among these genes, IPA was performed. Based on IPA, several
pathways that were associated with enriched genes were identified.
‘Interferon signaling’ was the most enriched pathway, and the
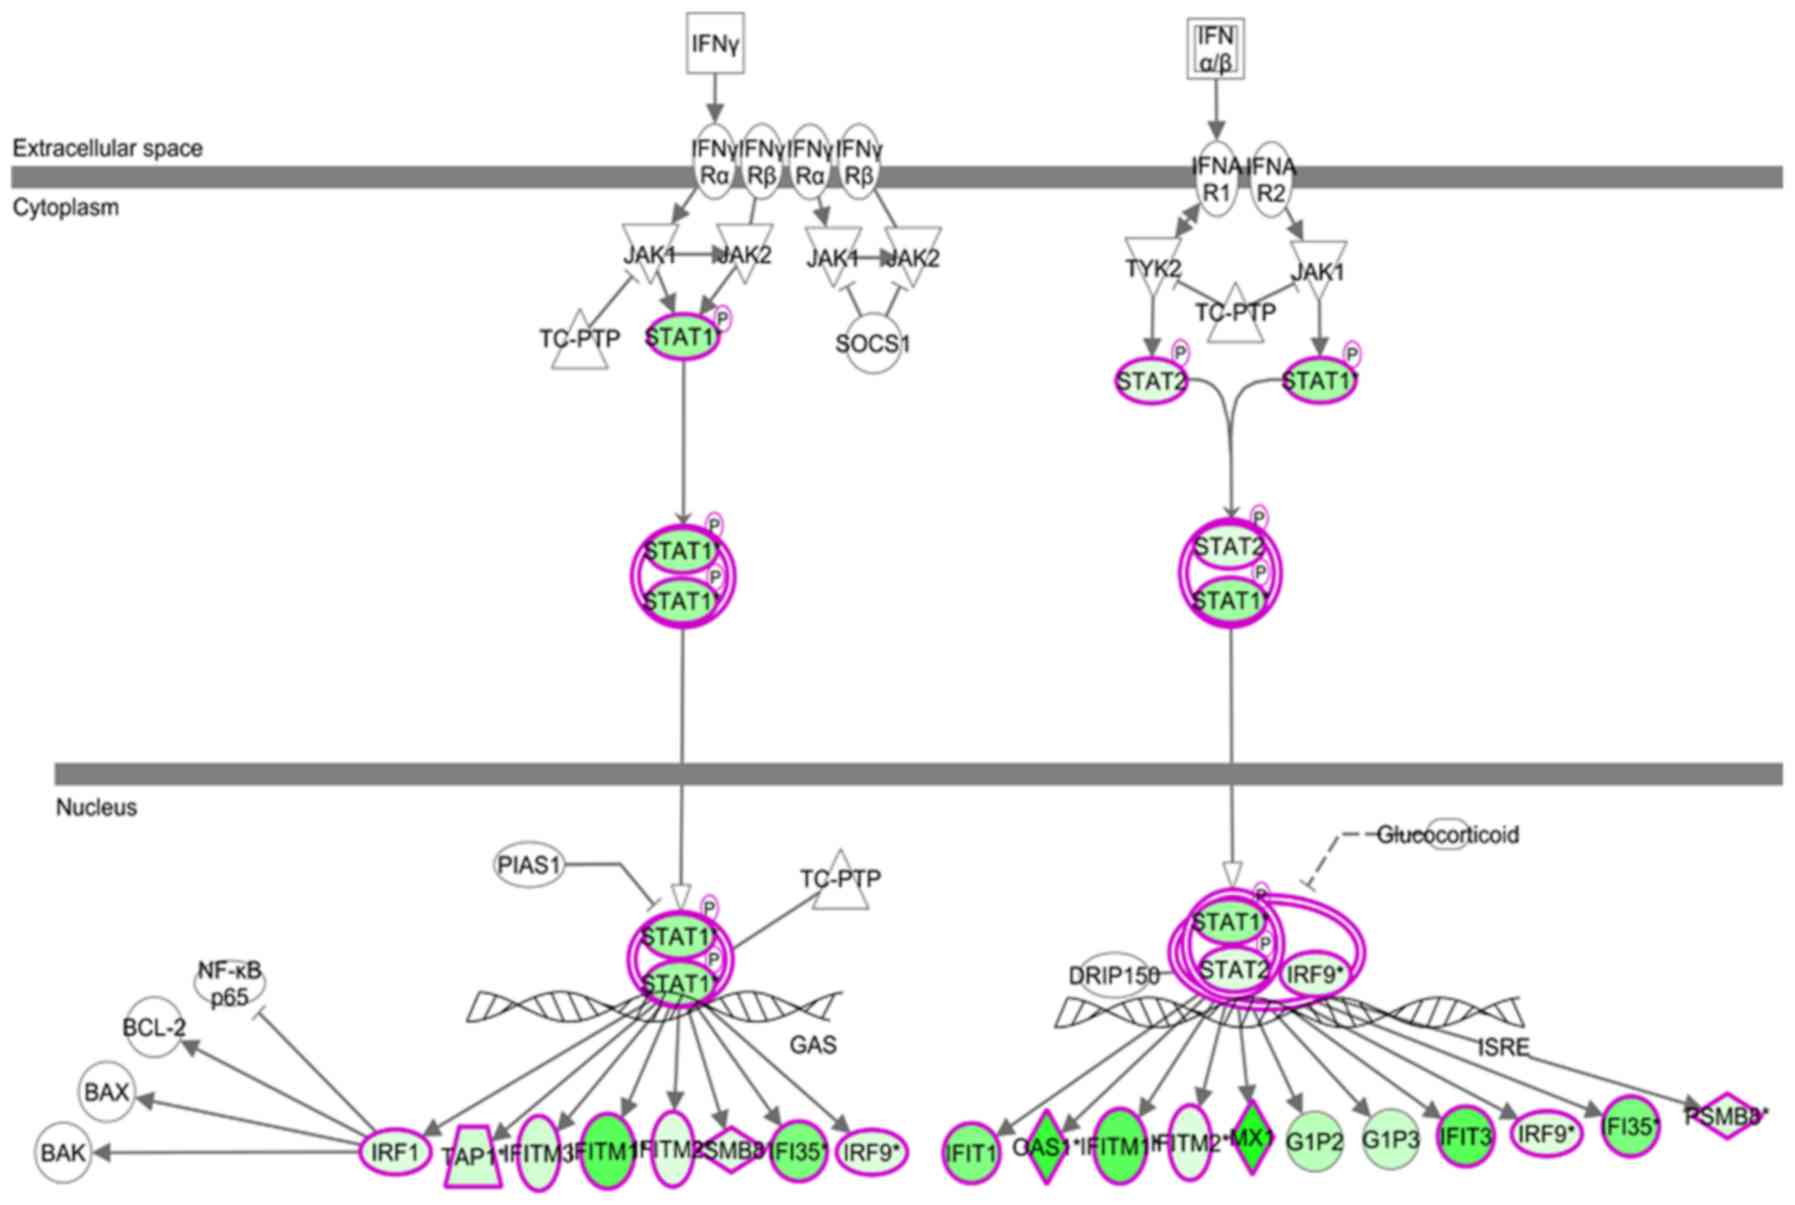
activation of this pathway was significantly inhibited (Fig. 10). A diagram presenting the genes
involved in the interferon (IFN) signaling pathway was generated
(Fig. 11). The results demonstrated
that the IFN signaling pathway may be a major pathway of FRAT1
activity in U251 cells, and demonstrated that STAT1 may act as a
crucial downstream molecule of FRAT1. The expression level of STAT1
was downregulated in FRAT1 knockdown cells.
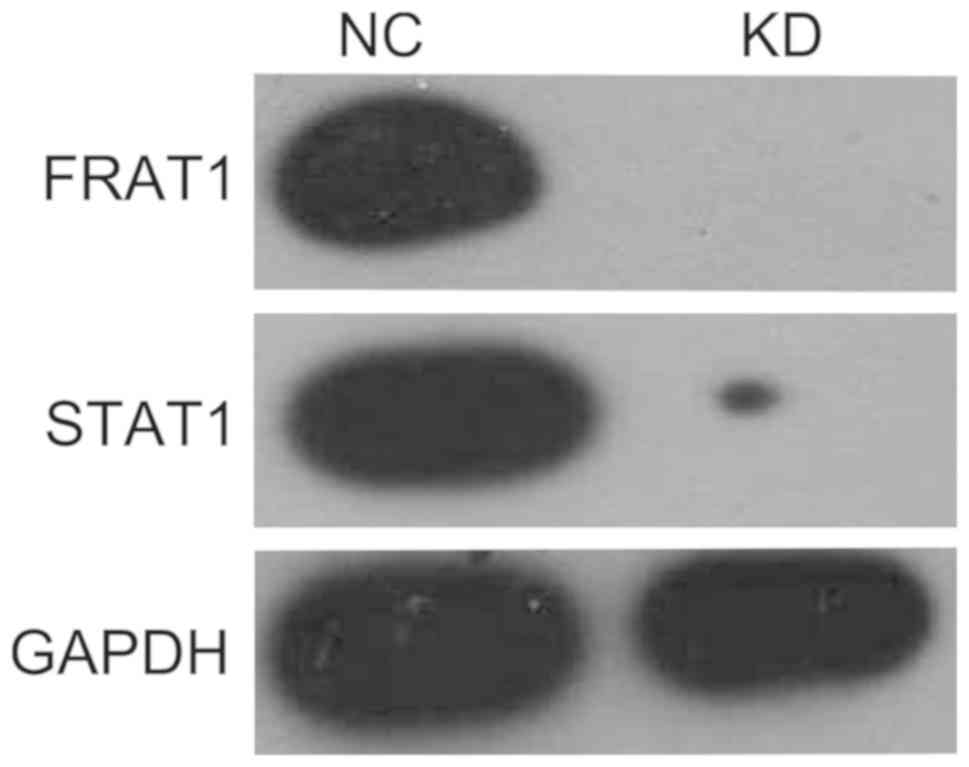
FRAT1 improves the expression of STAT1
in U251 cells
To further explore the role of FRAT1 in the
expression of STAT1 in glioma cells, FRAT1 knockdown clones and
control cells were used to analyze STAT1 protein expression by
western blot analysis. As presented in Fig. 12, FRAT1 and STAT1 protein expression
was significantly downregulated in FRAT1 knockdown clones compared
with the levels in untreated cells. Thus, this experiment validated
the study hypothesis that FRAT1 regulated the expression of STAT1
protein in U251 cells, suggesting the involvement of
FRAT1-regulated STAT1 modulation in the occurrence and progression
of glioma.
Discussion
FRAT1 is one of the main components of the Wnt
signaling pathway and has been considered to positively regulate
the Wnt/β-catenin signaling transduction pathway via the
dissociation of GSK-3β from axin and inhibition of β-catenin
phosphorylation (36–39). As a result, unphosphorylated
β-catenin allows nuclear translocation and transcription activation
of Wnt target genes, including c-myc and CCND1, thus leading to
subsequent abnormal cancer cell proliferation (40). Recently, upregulation of FRAT1 has
been identified in several types of cancer and is believed to serve
a role in cancer invasion, metastasis and other malignant
phenotypes (41). A number of
studies have demonstrated that FRAT1 serves a major role in tumor
progression (21–26). Previous studies revealed that low
expression of FRAT1 resulted in the inhibition of human glioma cell
proliferation, migration and invasion (28,42). In
the current study, a total of 1,388 genes significantly
differentially expressed between normal U251 and FRAT1 knockdown
U251 cells were identified. Of these, 493 were upregulated and 895
were downregulated following FRAT1 knockdown. Next, GO, KEGG and
IPA pathway analyses were conducted. In GO enrichment analysis, the
majority of enriched GO terms were in the category of biological
process. In KEGG pathway analysis, the most significant pathways
were associated with cancer. The results of IPA pathway analysis
revealed that 155 genes were associated with immune response, and
the majority of these genes were involved in the IFN pathway. In
addition, the interaction of these genes in the IFN pathway
demonstrated that STAT1 was one of the main modules associated with
the response to the knockdown of FRAT1, the module most
significantly associated with immune response.
STATs, the downstream targets of IFN, are stimulated
by tyrosine phosphorylation in the C-termini (43). Previous studies have indicated that
STATs contribute to the upregulation of several genes associated
with tumor cell proliferation, including c-myc, pim-1
proto-oncogene, serine/threonine kinase and CCND1 (44–47). In
addition, recent studies have demonstrated that pim-1 serves two
distinct roles in cancer; it increases the rate of cancer cell
proliferation and inhibits apoptosis (48,49).
STAT1 overexpression has been reported to markedly increase the
proliferation of glioma cells, whereas its suppression evidently
inhibits cell proliferation (50).
In addition, western blot analysis confirmed that STAT1 protein was
highly expressed in U251 cells, which was reduced following the
knockdown of FRAT1 in U251 cells.
The activated STAT proteins are present in various
types of malignancies including leukemia, prostate cancer and neck
tumors (51,52). Recent studies have indicated that
STAT signaling was activated in cancer, such as in lymphoma, lung
cancer and head and neck cancer, and dysregulation of this factor
may contribute to oncogenesis (44,53,54).
Moreover, a recent study has demonstrated that STAT1 serves a
protumorigenic role in glioma (30).
Furthermore, it was hypothesized that poor prognosis may be
attributable to chemoresistance and/or radiation resistance of
tumors that express STAT1 (30).
Similarly, STATs have been identified to increase the expression of
certain anti-apoptotic regulatory proteins, including the Bcl
family proteins (55). STATs are
considered important regulators of the development and
differentiation of multicellular organisms; STAT proteins have been
suggested to have primarily evolved to mediate cytokine signaling,
particularly in cells of the immune system (56). Indeed, gene knockout experiments in
mice indicated a pivotal role of STAT proteins in the development
and regulation of the immune system (57). Thus, STAT1 may serve important roles
in glioma via immune response, including: i) Proliferation; ii)
inhibition of apoptosis; iii) chemoresistance; and/or iv) radiation
resistance. Therefore, targeting STAT1 may be a novel therapeutic
approach for the treatment of glioma. A recent study reported that
oncolytic virotherapy using herpes simplex virus type I promoted
glioma regression by inhibiting STAT1/3 activity; STAT1/3-induced
therapeutic resistance was inhibited and, as a result, oncolytic
action was promoted (58). These
findings are consistent with the results of the current study.
To the best of our knowledge, the present study
suggested for the first time that FRAT1 may positively regulate the
Wnt/β-catenin pathway, which in turn activates target genes,
including c-myc and CCND1. STAT1 mediated the upregulation of
c-myc, pim-1, CCND1 and Bcl family genes, thus enhancing the
proliferation of glioma cells. In addition, low expression levels
of STAT1 were identified in FRAT1 knockdown U251 cells, indicating
that STAT1 expression was positively regulated by FRAT1. Therefore,
it was concluded that FRAT1 acted as a positive regulator of STAT1,
which led to increased glioma cell proliferation, and that the
protumorigenic effect of STAT1 was mediated by FRAT1. Based on a
previous study on the effects of FRAT1, more experiments analyzing
the role of STAT1 in glioma should be conducted in the future to
validate the results of the present study. In addition, the
Wnt/β-catenin and IFN/STAT1 pathways were identified to be
associated in glioma through FRAT1. Investigation of the effect of
IFN on FRAT1in glioma would be of great benefit in future
studies.
Acknowledgements
Not applicable.
Funding
The present study was supported by the National
Natural Science Foundation of China (grant. no. 81201991), the
China Postdoctoral Science Foundation (grant. nos. 2015M571068 and
2016T90115) and the Beijing Postdoctoral Research Foundation
(grant. nos. 2015ZZ-56 and 2016ZZ-43). The funders had no role in
study design, data collection and analysis, decision to publish or
preparation of the manuscript.
Availability of data and materials
The datasets used and/or analyzed during the present
study are available from the corresponding author on reasonable
request.
Author's contributions
GG, SW and YW performed data analyses and wrote the
manuscript. YH, YR, JZ and DL contributed significantly to data
analyses and manuscript revision. GG, SW and YW conceived and
designed the study. All authors read and approved the final
manuscript.
Ethics approval and consent to
participate
Not applicable.
Patient consent for publication
Not applicable.
Competing interests
The authors declare that they have no competing
interests.
References
|
1
|
Kleihues P, Louis DN, Scheithauer BW,
Rorke LB, Reifenberger G, Burger PC and Cavenee WK: The WHO
classification of tumors of the nervous system. J Neuropathol Exp
Neurol. 61:215–225; discussion 226-229. 2002. View Article : Google Scholar : PubMed/NCBI
|
|
2
|
Schiffer D: Classification and biology of
astrocytic gliomas. Forum (Genova). 8:244–255. 1998.PubMed/NCBI
|
|
3
|
Kleihues P, Soylemezoglu F, Schauble B,
Scheithauer BW and Burger PC: Histopathology, classification, and
grading of gliomas. Glia. 15:211–221. 1995. View Article : Google Scholar : PubMed/NCBI
|
|
4
|
Wiestler OD and Wolf HK: Revised WHO
classification and new developments in diagnosis of central nervous
system tumors. Pathologe. 16:245–255. 1995.(In German). View Article : Google Scholar : PubMed/NCBI
|
|
5
|
Louis DN, Ohgaki H, Wiestler OD, Cavenee
WK, Burger PC, Jouvet A, Scheithauer BW and Kleihues P: The 2007
WHO classification of tumours of the central nervous system. Acta
Neuropathol. 114:97–109. 2007. View Article : Google Scholar : PubMed/NCBI
|
|
6
|
Kleihues P and Ohgaki H: Primary and
secondary glioblastomas: From concept to clinical diagnosis. Neuro
Oncol. 1:44–51. 1999. View Article : Google Scholar : PubMed/NCBI
|
|
7
|
Durmaz R, Erken S, Arslantas A, Atasoy MA,
Bal C and Tel E: Management of glioblastoma multiforme: With
special reference to recurrence. Clin Neurol Neurosurg. 99:117–123.
1997. View Article : Google Scholar : PubMed/NCBI
|
|
8
|
Hsu E, Keene D, Ventureyra E, Matzinger
MA, Jimenez C, Wang HS and Grimard L: Bone marrow metastasis in
astrocytic gliomata. J Neurooncol. 37:285–293. 1998. View Article : Google Scholar : PubMed/NCBI
|
|
9
|
Jubelirer SJ: A review of the treatment
and survival rates of 138 patients with glioblastoma multiforme. W
V Med J. 92:186–190. 1996.PubMed/NCBI
|
|
10
|
Park CC, Hartmann C, Folkerth R, Folkerth
R, Loeffler JS, Wen PY, Fine HA, Black PM, Shafman T and Louis DN:
Systemic metastasis in glioblastoma may represent the emergence of
neoplastic subclones. J Neuropathol Exp Neurol. 59:1044–1050. 2000.
View Article : Google Scholar : PubMed/NCBI
|
|
11
|
Scott JN, Rewcastle NB, Brasher PM, Fulton
D, Hagen NA, MacKinnon JA, Sutherland G, Cairncross JG and Forsyth
P: Long-term glioblastoma multiforme survivors: A population-based
study. Can J Neurol Sci. 25:197–201. 1998. View Article : Google Scholar : PubMed/NCBI
|
|
12
|
Burton EC, Lamborn KR, Feuerstein BG,
Prados M, Scott J, Forsyth P, Passe S, Jenkins RB and Aldape KD:
Genetic aberrations defined by comparative genomic hybridization
distinguish long-term from typical survivors of glioblastoma.
Cancer Res. 62:6205–6210. 2002.PubMed/NCBI
|
|
13
|
Krex D, Klink B, Hartmann C, von Deimling
A, Pietsch T, Simon M, Sabel M, Steinbach JP, Heese O, Reifenberger
G, et al: Long-term survival with glioblastoma multiforme. Brain.
130:2596–2606. 2007. View Article : Google Scholar : PubMed/NCBI
|
|
14
|
Bleeker FE, Molenaar RJ and Leenstra S:
Recent advances in the molecular understanding of glioblastoma. J
Neurooncol. 108:11–27. 2012. View Article : Google Scholar : PubMed/NCBI
|
|
15
|
Stupp R, Hegi ME, Mason WP, van den Bent
MJ, Taphoorn MJ, Janzer RC, Ludwin SK, Allgeier A, Fisher B,
Belanger K, et al: Effects of radiotherapy with concomitant and
adjuvant temozolomide versus radiotherapy alone on survival in
glioblastoma in a randomised phase III study: 5-year analysis of
the EORTC-NCIC trial. Lancet Oncol. 10:459–466. 2009. View Article : Google Scholar : PubMed/NCBI
|
|
16
|
Stupp R, Mason WP, van den Bent MJ, Weller
M, Fisher B, Taphoorn MJ, Belanger K, Brandes AA, Marosi C, Bogdahn
U, et al: Radiotherapy plus concomitant and adjuvant temozolomide
for glioblastoma. N Engl J Med. 352:987–996. 2005. View Article : Google Scholar : PubMed/NCBI
|
|
17
|
Freemantle SJ, Portland HB, Ewings K,
Dmitrovsky F, DiPetrillo K, Spinella MJ and Dmitrovsky E:
Characterization and tissue-specific expression of human
GSK-3-binding proteins FRAT1 and FRAT2. Gene. 291:17–27. 2002.
View Article : Google Scholar : PubMed/NCBI
|
|
18
|
Yost C, Farr GH III, Pierce SB, Ferkey DM,
Chen MM and Kimelman D: GBP, an inhibitor of GSK-3, is implicated
in Xenopus development and oncogenesis. Cell. 93:1031–1041. 1998.
View Article : Google Scholar : PubMed/NCBI
|
|
19
|
Yuan Y, Yang Z, Miao X, Li D, Liu Z and
Zou Q: The clinical significance of FRAT1 and ABCG2 expression in
pancreatic ductal adenocarcinoma. Tumour Biol. 36:9961–9968. 2015.
View Article : Google Scholar : PubMed/NCBI
|
|
20
|
Jonkers J, van Amerongen R, van der Valk
M, Robanus-Maandag E, Molenaar M, Destrée O and Berns A: In vivo
analysis of Frat1 deficiency suggests compensatory activity of
Frat3. Mech Dev. 88:183–194. 1999. View Article : Google Scholar : PubMed/NCBI
|
|
21
|
Saitoh T, Mine T and Katoh M: Molecular
cloning and expression of proto-oncogene FRAT1 in human cancer. Int
J Oncol. 20:785–789. 2002.PubMed/NCBI
|
|
22
|
Jonkers J, Korswagen HC, Acton D, Breuer M
and Berns A: Activation of a novel proto-oncogene, Frat1,
contributes to progression of mouse T-cell lymphomas. EMBO J.
16:441–450. 1997. View Article : Google Scholar : PubMed/NCBI
|
|
23
|
Jonkers J, Weening JJ, van der Valk M, van
der Valk M, Bobeldijk R and Berns A: Overexpression of Frat1 in
transgenic mice leads to glomerulosclerosis and nephrotic syndrome,
and provides direct evidence for the involvement of Frat1 in
lymphoma progression. Oncogene. 18:5982–5990. 1999. View Article : Google Scholar : PubMed/NCBI
|
|
24
|
Wang Y, Hewitt SM, Liu S, Zhou X, Zhu H,
Zhou C, Zhang G, Quan L, Bai J and Xu N: Tissue microarray analysis
of human FRAT1 expression and its correlation with the subcellular
localisation of beta-catenin in ovarian tumours. Br J Cancer.
94:686–691. 2006. View Article : Google Scholar : PubMed/NCBI
|
|
25
|
Zhang Y, Han Y, Zheng R, Yu JH, Miao Y,
Wang L and Wang EH: Expression of Frat1 correlates with expression
of β-catenin and is associated with a poor clinical outcome in
human SCC and AC. Tumour Biol. 33:1437–1444. 2012. View Article : Google Scholar : PubMed/NCBI
|
|
26
|
Zhang Y, Yu JH, Lin XY, Miao Y, Han Y, Fan
CF, Dong XJ, Dai SD and Wang EH: Overexpression of Frat1 correlates
with malignant phenotype and advanced stage in human non-small cell
lung cancer. Virchows Arch. 459:255–263. 2011. View Article : Google Scholar : PubMed/NCBI
|
|
27
|
Fan WH, Du FJ, Liu XJ and Chen N:
Knockdown of FRAT1 inhibits hypoxia-induced
epithelial-to-mesenchymal transition via suppression of the
Wnt/β-catenin pathway in hepatocellular carcinoma cells. Oncol Rep.
36:2999–3004. 2016. View Article : Google Scholar : PubMed/NCBI
|
|
28
|
Guo G, Kuai D, Cai S, Xue N, Liu Y, Hao J,
Fan Y, Jin J, Mao X, Liu B, et al: Knockdown of FRAT1 expression by
RNA interference inhibits human glioblastoma cell growth, migration
and invasion. PLoS One. 8:e612062013. View Article : Google Scholar : PubMed/NCBI
|
|
29
|
Gao YF, Mao XY, Zhu T, Mao CX, Liu ZX,
Wang ZB, Li L, Li X, Yin JY, Zhang W, et al: COL3A1 and SNAP91:
Novel glioblastoma markers with diagnostic and prognostic value.
Oncotarget. 7:70494–70503. 2016. View Article : Google Scholar : PubMed/NCBI
|
|
30
|
Duarte CW, Willey CD, Zhi D, Cui X, Harris
JJ, Vaughan LK, Mehta T, McCubrey RO, Khodarev NN, Weichselbaum RR
and Gillespie GY: Expression signature of IFN/STAT1 signaling genes
predicts poor survival outcome in glioblastoma multiforme in a
subtype-specific manner. PLoS One. 7:e296532012. View Article : Google Scholar : PubMed/NCBI
|
|
31
|
Wang L, Cao C, Ma Q, Zeng Q, Wang H, Cheng
Z, Zhu G, Qi J, Ma H, Nian H and Wang Y: RNA-seq analyses of
multiple meristems of soybean: Novel and alternative transcripts,
evolutionary and functional implications. BMC Plant Biol.
14:1692014. View Article : Google Scholar : PubMed/NCBI
|
|
32
|
Shannon P, Markiel A, Ozier O, Baliga NS,
Wang JT, Ramage D, Amin N, Schwikowski B and Ideker T: Cytoscape: A
software environment for integrated models of biomolecular
interaction networks. Genome Res. 13:2498–2504. 2003. View Article : Google Scholar : PubMed/NCBI
|
|
33
|
Wu J, Mao X, Cai T, Luo J and Wei L: KOBAS
server: A web-based platform for automated annotation and pathway
identification. Nucleic Acids Res. 34:W720–W724. 2006. View Article : Google Scholar : PubMed/NCBI
|
|
34
|
Sherman BT, Huang da W, Tan Q, Guo Y, Bour
S, Liu D, Stephens R, Baseler MW, Lane HC and Lempicki RA: DAVID
Knowledgebase: A gene-centered database integrating heterogeneous
gene annotation resources to facilitate high-throughput gene
functional analysis. BMC Bioinformatics. 8:4262007. View Article : Google Scholar : PubMed/NCBI
|
|
35
|
Kramer A, Green J, Pollard J Jr and
Tugendreich S: Causal analysis approaches in ingenuity pathway
analysis. Bioinformatics. 30:523–530. 2014. View Article : Google Scholar : PubMed/NCBI
|
|
36
|
Culbert AA, Brown MJ, Frame S, Hagen T,
Cross DA, Bax B and Reith AD: GSK-3 inhibition by adenoviral FRAT1
overexpression is neuroprotective and induces Tau dephosphorylation
and beta-catenin stabilisation without elevation of glycogen
synthase activity. FEBS Lett. 507:288–294. 2001. View Article : Google Scholar : PubMed/NCBI
|
|
37
|
Hagen T, Cross DA, Culbert AA, West A,
Frame S, Morrice N and Reith AD: FRAT1, a substrate-specific
regulator of glycogen synthase kinase-3 activity, is a cellular
substrate of protein kinase A. J Biol Chem. 281:35021–35029. 2006.
View Article : Google Scholar : PubMed/NCBI
|
|
38
|
Li L, Yuan H, Weaver CD, Mao J, Farr GH
III, Sussman DJ, Jonkers J, Kimelman D and Wu D: Axin and Frat1
interact with Dvl and GSK, bridging Dvl to GSK in Wnt-mediated
regulation of LEF-1. EMBO J. 18:4233–4240. 1999. View Article : Google Scholar : PubMed/NCBI
|
|
39
|
Thomas GM, Frame S, Goedert M, Nathke I,
Polakis P and Cohen P: A GSK3-binding peptide from FRAT1
selectively inhibits the GSK3-catalysed phosphorylation of axin and
beta-catenin. FEBS Lett. 458:247–251. 1999. View Article : Google Scholar : PubMed/NCBI
|
|
40
|
Jamieson C, Sharma M and Henderson BR: Wnt
signaling from membrane to nucleus: β-catenin caught in a loop. Int
J Biochem Cell Biol. 44:847–850. 2012. View Article : Google Scholar : PubMed/NCBI
|
|
41
|
Yong Z, Yu JH, Lin XY, Miao Y, Han Y, Fan
CF, Dong XJ, Dai SD and Wang EH: Overexpression of Frat1 correlates
with malignant phenotype and advanced stage in human non-small cell
lung cancer. Virchows Archiv. 459:255–263. 2011. View Article : Google Scholar : PubMed/NCBI
|
|
42
|
Guo G, Liu B, Zhong C, Zhang X, Mao X,
Wang P, Jiang X, Huo J, Jin J, Liu X and Chen X: FRAT1 expression
and its correlation with pathologic grade, proliferation, and
apoptosis in human astrocytomas. Med Oncol. 28:1–6. 2011.
View Article : Google Scholar : PubMed/NCBI
|
|
43
|
Ihle JN: STATs: Signal transducers and
activators of transcription. Cell. 84:331–334. 1996. View Article : Google Scholar : PubMed/NCBI
|
|
44
|
Bowman T, Garcia R, Turkson J and Jove R:
STATs in oncogenesis. Oncogene. 19:2474–2488. 2000. View Article : Google Scholar : PubMed/NCBI
|
|
45
|
Matikainen S, Sareneva T, Ronni T,
Lehtonen A, Koskinen PJ and Julkunen I: Interferon-alpha activates
multiple STAT proteins and upregulates proliferation-associated
IL-2Ralpha, c-myc, and pim-1 genes in human T cells. Blood.
93:1980–1991. 1999. View Article : Google Scholar : PubMed/NCBI
|
|
46
|
Bromberg JF, Wrzeszczynska MH, Devgan G,
Zhao Y, Pestell RG, Albanese C and Darnell JE Jr: Stat3 as an
oncogene. Cell. 98:295–303. 1999. View Article : Google Scholar : PubMed/NCBI
|
|
47
|
Kharma B, Baba T, Matsumura N, Kang HS,
Hamanishi J, Murakami R, McConechy MM, Leung S, Yamaguchi K, Hosoe
Y, et al: STAT1 drives tumor progression in serous papillary
endometrial cancer. Cancer Res. 74:6519–6530. 2014. View Article : Google Scholar : PubMed/NCBI
|
|
48
|
Lilly M and Kraft A: Enforced expression
of the Mr 33,000 Pim-1 kinase enhances factor-independent survival
and inhibits apoptosis in murine myeloid cells. Cancer Res.
57:5348–5355. 1997.PubMed/NCBI
|
|
49
|
Moroy T, Grzeschiczek A, Petzold S and
Hartmann KU: Expression of a Pim-1 transgene accelerates
lymphoproliferation and inhibits apoptosis in lpr/lpr mice. Proc
Natl Acad Sci USA. 90:10734–10738. 1993. View Article : Google Scholar : PubMed/NCBI
|
|
50
|
Meng D, Chen Y, Yun D, Zhao Y, Wang J, Xu
T, Li X, Wang Y, Yuan L, Sun R, et al: High expression of N-myc
(and STAT) interactor predicts poor prognosis and promotes tumor
growth in human glioblastoma. Oncotarget. 6:4901–4919. 2015.
View Article : Google Scholar : PubMed/NCBI
|
|
51
|
Gouilleux-Gruart V, Gouilleux F, Desaint
C, Claisse JF, Capiod JC, Delobel J, Weber-Nordt R, Dusanter-Fourt
I, Dreyfus F, Groner B and Prin L: STAT-related transcription
factors are constitutively activated in peripheral blood cells from
acute leukemia patients. Blood. 87:1692–1697. 1996. View Article : Google Scholar : PubMed/NCBI
|
|
52
|
Grandis JR, Drenning SD, Chakraborty A,
Zhou MY, Zeng Q, Pitt AS and Tweardy DJ: Requirement of Stat3 but
not Stat1 activation for epidermal growth factor receptor-mediated
cell growth In vitro. J Clin Invest. 102:1385–1392. 1998.
View Article : Google Scholar : PubMed/NCBI
|
|
53
|
Gouilleux-Gruart V, Debierre-Grockiego F,
Gouilleux F, Capiod JC, Claisse JF, Delobel J and Prin L: Activated
Stat related transcription factors in acute leukemia. Leuk
Lymphoma. 28:83–88. 1997. View Article : Google Scholar : PubMed/NCBI
|
|
54
|
Bromberg JF: Activation of STAT proteins
and growth control. Bioessays. 23:161–169. 2001. View Article : Google Scholar : PubMed/NCBI
|
|
55
|
Catlett-Falcone R, Dalton WS and Jove R:
STAT proteins as novel targets for cancer therapy. Signal
transducer an activator of transcription. Curr Opin Oncol.
11:490–496. 1999. View Article : Google Scholar : PubMed/NCBI
|
|
56
|
Darnell JE Jr, Kerr IM and Stark GR:
Jak-STAT pathways and transcriptional activation in response to
IFNs and other extracellular signaling proteins. Science.
264:1415–1421. 1994. View Article : Google Scholar : PubMed/NCBI
|
|
57
|
Hackenmiller R, Kim J, Feldman RA and
Simon MC: Abnormal Stat activation, hematopoietic homeostasis, and
innate immunity in c-fes-/- mice. Immunity. 13:397–407. 2000.
View Article : Google Scholar : PubMed/NCBI
|
|
58
|
Delwar ZM, Kuo Y, Wen YH, Rennie PS and
Jia W: Oncolytic virotherapy blockade by microglia and macrophages
requires STAT1/3. Cancer Res. 78:718–730. 2018. View Article : Google Scholar : PubMed/NCBI
|