Introduction
Colorectal cancer (CRC) is a type of malignant tumor
originated from colon and rectum epithelium (1). Most cases of CRC develop slowly through
normal mucosal adenoma-cancer sequence for several years and it is
one of the most common malignant tumors in the clinic worldwide
(2,3). In 2018, the global incidence of
colorectal cancer was third from the top among the 36 types of
cancer and the mortality rate ranked second and 1.8 million
individuals were diagnosed with colorectal cancer in the world
(4), the number of deaths due to
colorectal cancer was approximately 881,000. Colon cancer is a type
of colorectal cancer and accounts for a large proportion of
colorectal cancer cases approximately 60.9% in the world in 2018
(4,5). The primary risk factors associated with
the disease are elderly, male sex, increased levels of fat
consumption, high level of red meat and processed food consumption,
lack of exercise, smoking, high alcohol intake (>1 drink/day)
(6), obesity and being tall
(4,7). The treatment methods of COAD included
radiotherapy, surgery, targeted therapy and chemotherapy. Although
a great deal of effort has been made to understand the underlying
molecular mechanisms of the occurrence and development of COAD, the
prevention and treatment of early-onset COAD is still a challenge
for researchers (8). Therefore,
sensitive and specific biomarkers are needed to improve early
diagnosis, aid the management of individualized therapy and predict
the prognosis of patients at different stages of the COAD.
γ-Aminobutyric acid (GABA) is the principal
inhibitory neurotransmitter in the mammalian brain. γ-Aminobutyric
acid type A (GABAA) receptors are the primary
mediators of inhibitory neurotransmission in the mature brain,
which also functions as an agonist-gated ion channel that mediates
rapid synaptic inhibition in the mammalian central nervous system
(9). The GABAA
receptor subunit is mainly expressed in the cerebellum and its
receptor is located in cerebellum, but GABAA is
also expressed in testis and CD4-T-cells (10,11). The
GABAA receptor (GABR) subunits are a
superfamily consisting of 19 subunits: α1-α 6 (GABRA1, GABRA2,
GABRA3, GABRA4, GABRA5 and GABRA6); β 1-β 3 (GABRB1,
GABRB2 and GABRB3); γ 1-γ 3 (GABRG1, GABRG2 and
GABRG3); δ (GABRD); ε (GABRE); π
(GABRP); θ (GABRQ); and ρ 1-ρ 3 (GABRR1, GABRR2,
GABRR3) (9,12,13).
However, the data regarding the mRNA expression levels of five
GABAA family genes, including GABRA1, GABRA5, GABRG1, GABRA6
and GABRR3, were not available in The Cancer Genome Atlas (TCGA)
database. Thus, only 14 genes were analyzed in the present study.
Previous study showed that overexpressed GABRD was observed
in 89% of cases and had a weak negative correlation with tumor
proliferation, proliferative-independent genes are upregulated in
tumors and GABAA receptors might play a role in
the differentiation of tumor cells (14). However, the diagnostic and prognostic
value of GABRD and its family members had not been
thoroughly and systematically described. In the present study, the
role of the GABA family in colon cancer was studied using the TCGA
database to obtain survival-associated and GABAA
family expression in patients with COAD patients and the diagnostic
and prognosis value of the mRNA expression levels of
GABAA family genes were investigated. A few
online data portals were applied to analyze functions and signaling
pathways to predict the function of these genes.
Materials and methods
Data preparation
The mRNA expression levels and clinical information
associated with COAD, including sex, age and tumor-non-metastasis
(TNM) stage (8), were obtained from
TCGA (cancer.gov/tcga). Overall, 456 patients
were performed by mRNA sequencing. The expression data included 480
tumor tissues and 41 adjacent normal tissues. The Bioconductor
package (edgeR, version 3.24.3; R, version 3.6.0 software; rstudio,
version 1.2.5019) was used to standardize and correct the original
data (15). Genes with
P-value<0.05 and |log2 fold-change (FC)|>2 were
deemed to be significantly different. These genes were regarded as
differentially expressed genes (DEGs) (16). First, tumor tissues and adjacent
normal tissues data were isolated and then the gene expression data
were integrated with clinical information. Finally, patients who
had repetition of the data, a survival time of 0 days or no
follow-up data were excluded. In the end, 438 tumor tissues and 41
adjacent normal tissues were analyzed in the final research.
mRNA co-expression and functional
analysis
In order to analyze the biological pathways and
significance of the GABAA family genes, a set of
functional enrichment analyses were carried out using Database for
Annotation, Visualization and Integrated Discovery (DAVID 6.8,
david.ncifcrf.gov/home.jsp) (17,18).
Enriched P-values <0.05 had statistical significance. These
included the terms Gene Ontology (GO) functional examination and
the Kyoto Encyclopedia of Genes and Genomes (KEGG) pathway
analysis. The functional detection of Molecular functional (MF),
cell component (CC) and Biological process (BP) were based on the
analysis of GO terminology.
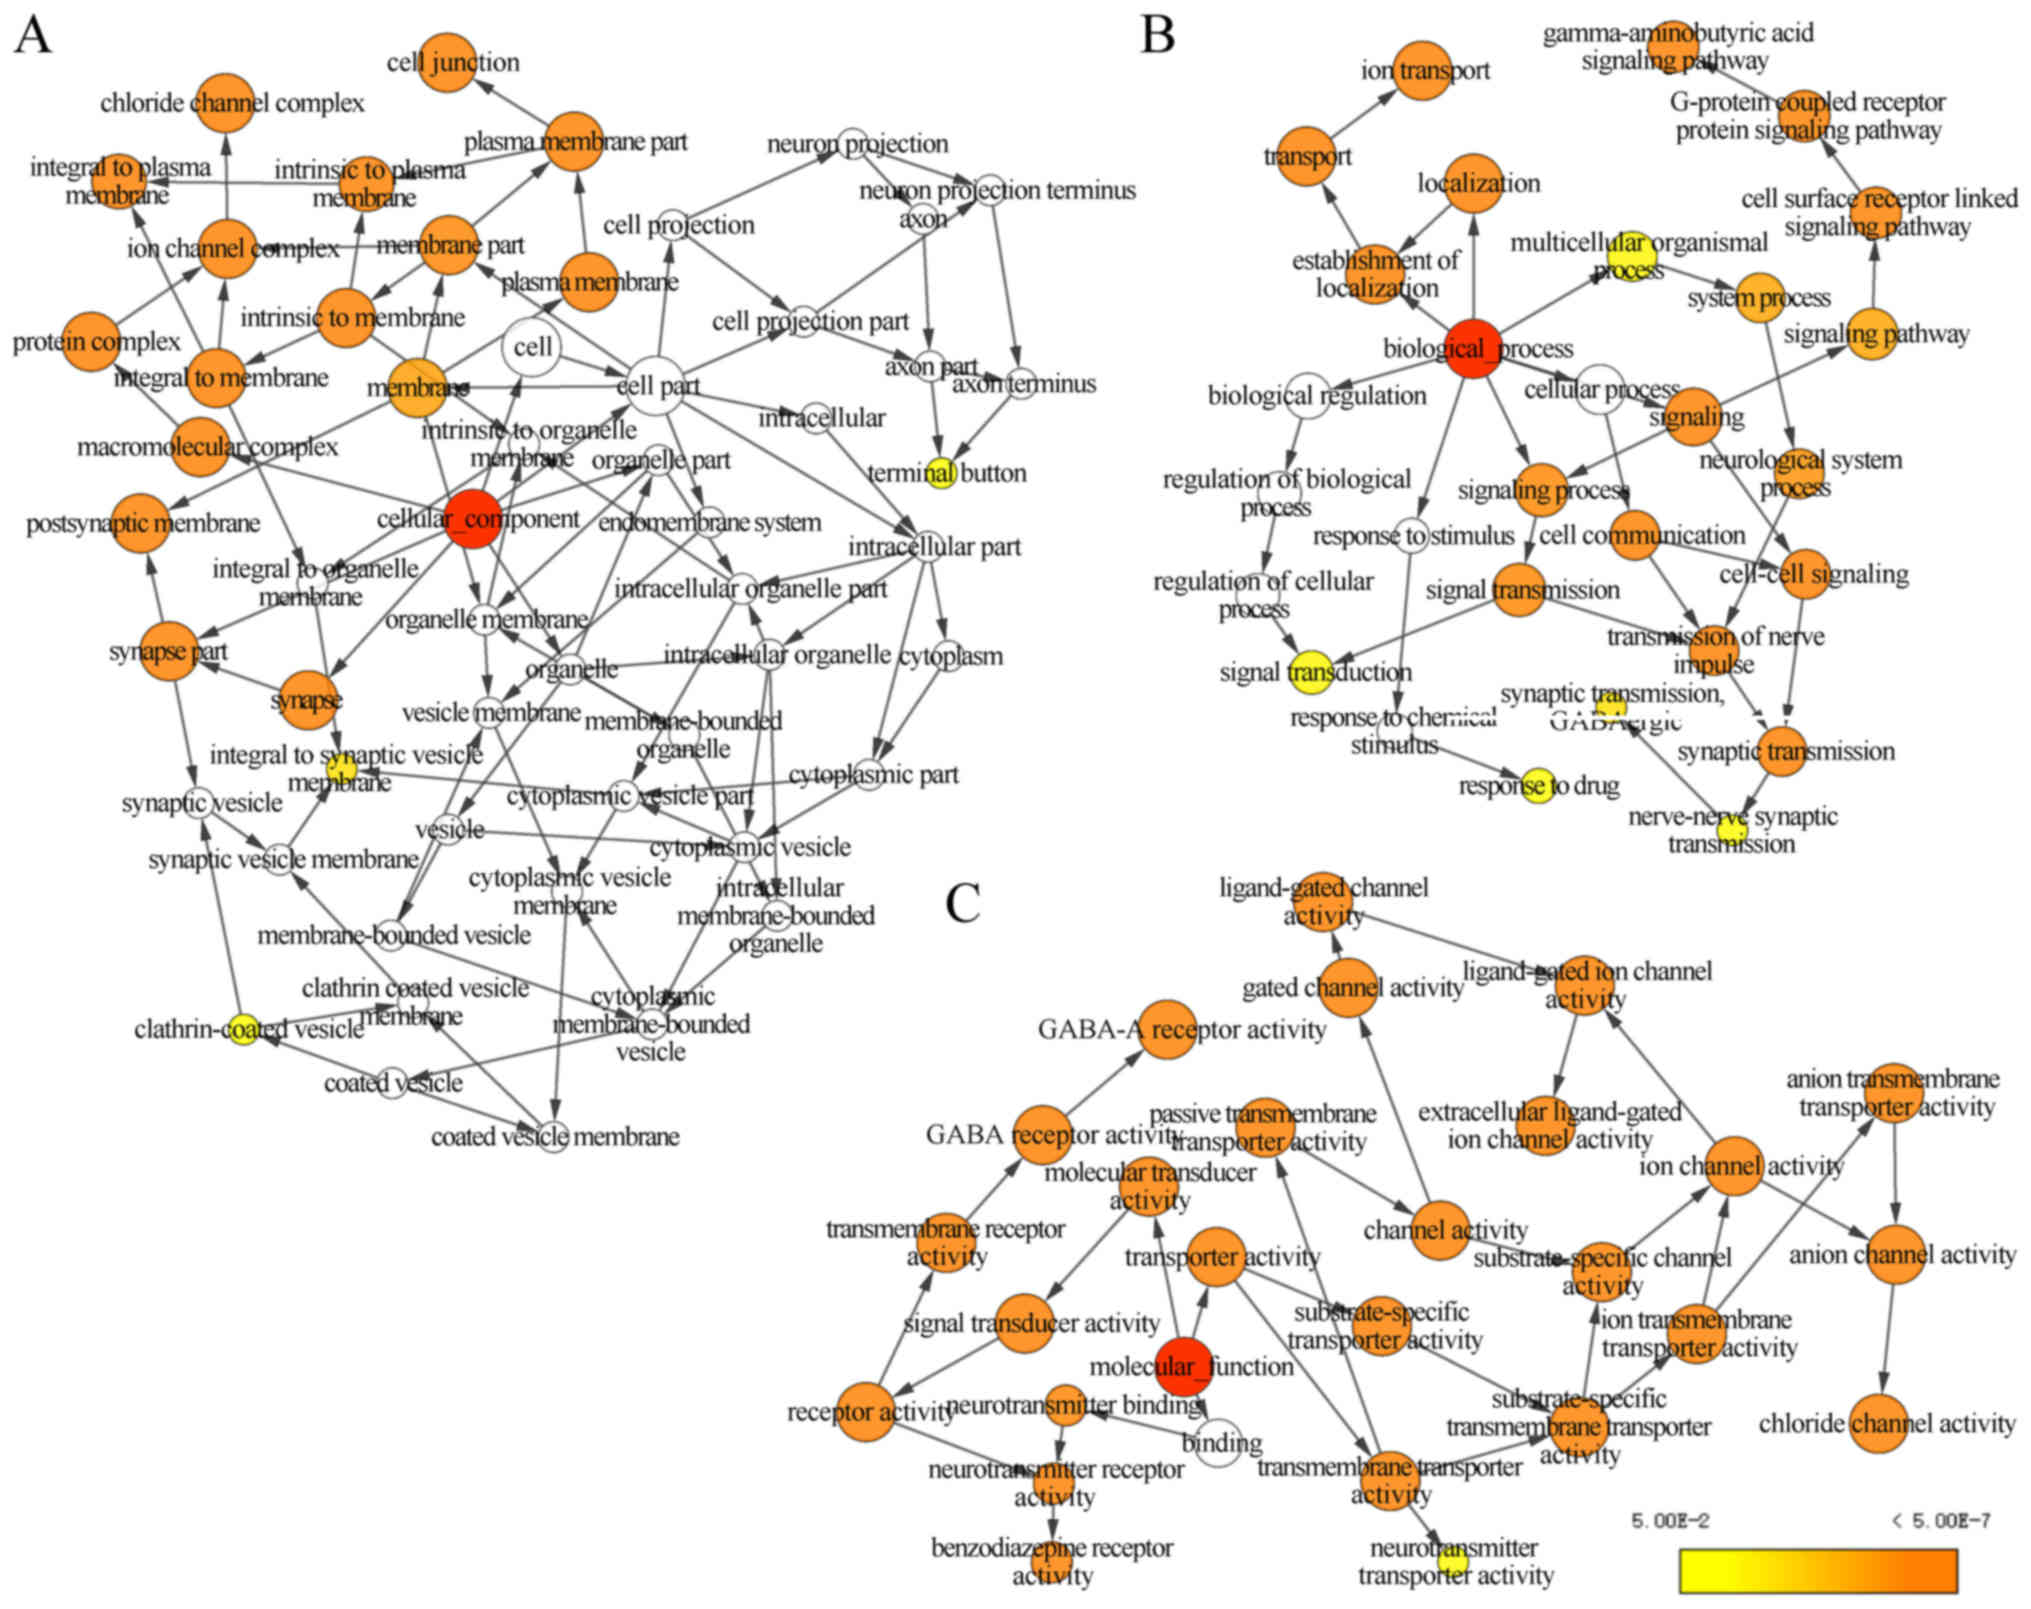
Biological Networks Gene Ontology
(BiNGO) (19) was chosen as a tool
for GO functional analysis
BiNGO predicted gene function through the
consequences of correlation analysis. Gene Multiple Association
Network Integration Algorithm (GeneMANIA) was applied for the
calculation of the 14 genes of GABAA family
(20,21). The Search Tool for the Retrieval of
Interacting Genes/Proteins (STRING) database was used to evaluate
protein-protein interactions (22)
and was applied to evaluate the function and physiological
relationships between the GABAA family genes. A
total score >0.15 was considered to be statistically
significant.
Co-representation matrix of
GABAA families
The correlation between GABAA
family genes in COAD was determined using Pearson correlation
coefficient analysis. An absolute value of correlation coefficient
>0.4 was considered strong correlation.
Gene expression level
characteristics
Metabolic Gene Rapid Visualizer (MERAV) was
performed to create boxplots of the differentially expressed genes
of the GABAA family in primary colon cancer
tissue and normal colon tissue (23). GABAA gene
expression levels in tumor and adjacent normal tissues were used to
construct vertical scatterplots. In addition, the differential
expressed genes of the GABAA family were screened
with the median cut-off values of all genes. Patients who possessed
higher value than the median values of GABAA
genes expression were classified as the high expression group and
the other patients were classified into the low expression
group.
Diagnostic forecast
GraphPad Prism version 7 (GraphPad Software) was
used to construct receiver operating characteristics (ROC) curves
to investigate the prognostic value of the GABAA
genes in patients with COAD in TCGA database. Then the correlation
between diagnosis associated genes and tumor stage was investigated
using a Spearman's test and Gene Expression Profiling Interactive
Analysis (24). The normalized
diagnostic value of P<0.05 was considered to indicate a
statistically significant difference.
Survival analysis
According to the median cut-off value of each
GABAA genes, the patients were categorized into
low and high expression groups. P-value and overall survival (OS)
of the GABAA gene family and clinical data were
calculated using Kaplan-Meier analysis and a log-rank test.
To assess the prognostic model thoroughly, a Cox
proportional risk regression model for univariate and multivariate
survival tests was performed. After adjusting the clinical
characteristics, 95% confidence intervals (CIs) and hazard ratios
(HRs) were calculated by conducting Cox proportional risk
regression model.
Joint-effects analysis
Based on previous survival analysis, joint-effects
analysis (25,26) of the prognostic associated genes
(GABRB1, GABRD, GABRP and GABRQ) was performed to
analyze the effect of polygenes on the survival of patients. Use
the following combinations for joint analysis:1) GABRB1 and
GABRD; 2) GABRB1 and GABRP; 3) GABRB1
and GABRQ; 4) GABRD and GABRP; 5) GABRD
and GABRQ; 6) GABRP and GABRQ; 7) GABRB1,
GABRD and GABRP; 8) GABRB1, GABRD and
GABRQ; 9) GABRB1, GABRP and GABRQ; 10)
GABRD, GABRP and GABRQ. Each combination was divided
groups based on the median gene expression mentioned earlier (e.g.
combination A and B: Group 1=low A+ low B, group 2=low A+ high B or
high A+ low B, group 3=high A +high B; combination A, B and C:
Group 1=low A+ low B+ low C, group 2=low A+ low B+ high C or low A+
high B+ low C or high A+ low B+ low C, group 3=high A+ high B+ low
C or high A+ low B + high C or low A+ high B + high C; group 4=high
A+ high B+ high C). According to the above combination, the Cox
proportional risk regression model was adjusted for statistical
significance factors (i.e., TNM stage). Kaplan-Meier method and
log-rank test were used to evaluate the prognostic value of
GABAA genes combination expression in each
group.
Nomogram
A nomogram was used to assess the association
between GABRB1, GABRD, GABRP, GABRQ and medical rank
(gender, age, stage) in terms of OS for patients with COAD. In
addition, the potential of these four genes in predicting clinical
grade was evaluated.
In terms of clinical data and survival analysis,
only tumor stage and GABRB1, GABRD, GABRP and GABRQ
expression level entered the risk model after being adjusted by cox
proportional hazard regression model. The risk score for all
factors were calculated as well as the 1-, 2-, 3-, 4- and 5-year
survival rates (27).
Gene set enrichment analysis
(GSEA)
In order to explore the differences in pathway and
biological functions between low- and high-expression groups of the
prognostic GABAA genes, the expression profile of
the full-genome dataset in TCGA group was divided into two groups
according to the median prognostic GABAA gene
value. GSEA version 3.0 (software.broadinstitute.org/gsea/index.jsp) was
applied to explore potential KEGG pathway and GO analysis within
the Molecular Signatures Database of c2 curated gene set and c5 GO
gene set (28). Criteria for
significant enrichment gene sets in GSEA were: P<0.05, False
discovery rate <0.25.
Statistical analysis
Statistical analyses were performed using SPSS 20.0
(IBM Corp.) and R version 3.6.0 software. P<0.05 was considered
to indicate a statistically significant difference. DAVID was
applied to analyze GO and KEGG pathways. The interactive network of
the target genes was constructed using Cytoscape version 3.6.1. An
unpaired t-test was used to compare data between COAD tumors and
adjacent normal tissues. A Spearman's test was performed for the
correlation analyses between TNM stages and GABRD expression
levels.
Results
Gene expression dataset
Detailed baseline characteristics of 438 patients
with COAD patients from TCGA database are summarized in Table I. Sex and age were not associated
with OS (all P>0.05), whereas TNM stage was significantly
associated with OS (adjusted log-rank test P<0.001).
 | Table I.Demographic and clinical data for 438
patients with colon adenocarcinoma. |
Table I.
Demographic and clinical data for 438
patients with colon adenocarcinoma.
| Variables | Patients, n | No. of
eventsa | MST (days) | HR (95% CI) | Log-rank
P-valueb |
|---|
| Sex |
|
|
|
| 0.545 |
|
Male | 234 | 54 | 2,475 | 1 |
|
|
Female | 204 | 44 | NA | 1.131
(0.759–1.686) |
|
| Agec (years) |
|
|
|
| 0.114 |
| ≥65 | 168 | 29 | 2,475 | 1 |
|
| <65 | 268 | 116 | NA | 1.420
(0.919–2.194) |
|
| Tumor stage |
|
|
|
|
<0.0°1d |
| IV | 61 | 31 | 858 | 1 |
|
| I | 73 | 4 | NA | 0.089
(0.031–0.251) |
|
| II | 167 | 27 | 2,821 | 0.198
(0.118–0.335) |
|
| III | 126 | 31 | NA | 0.360
(0.218–0.596) |
|
Bioinformatics analysis of
GABAA family genes
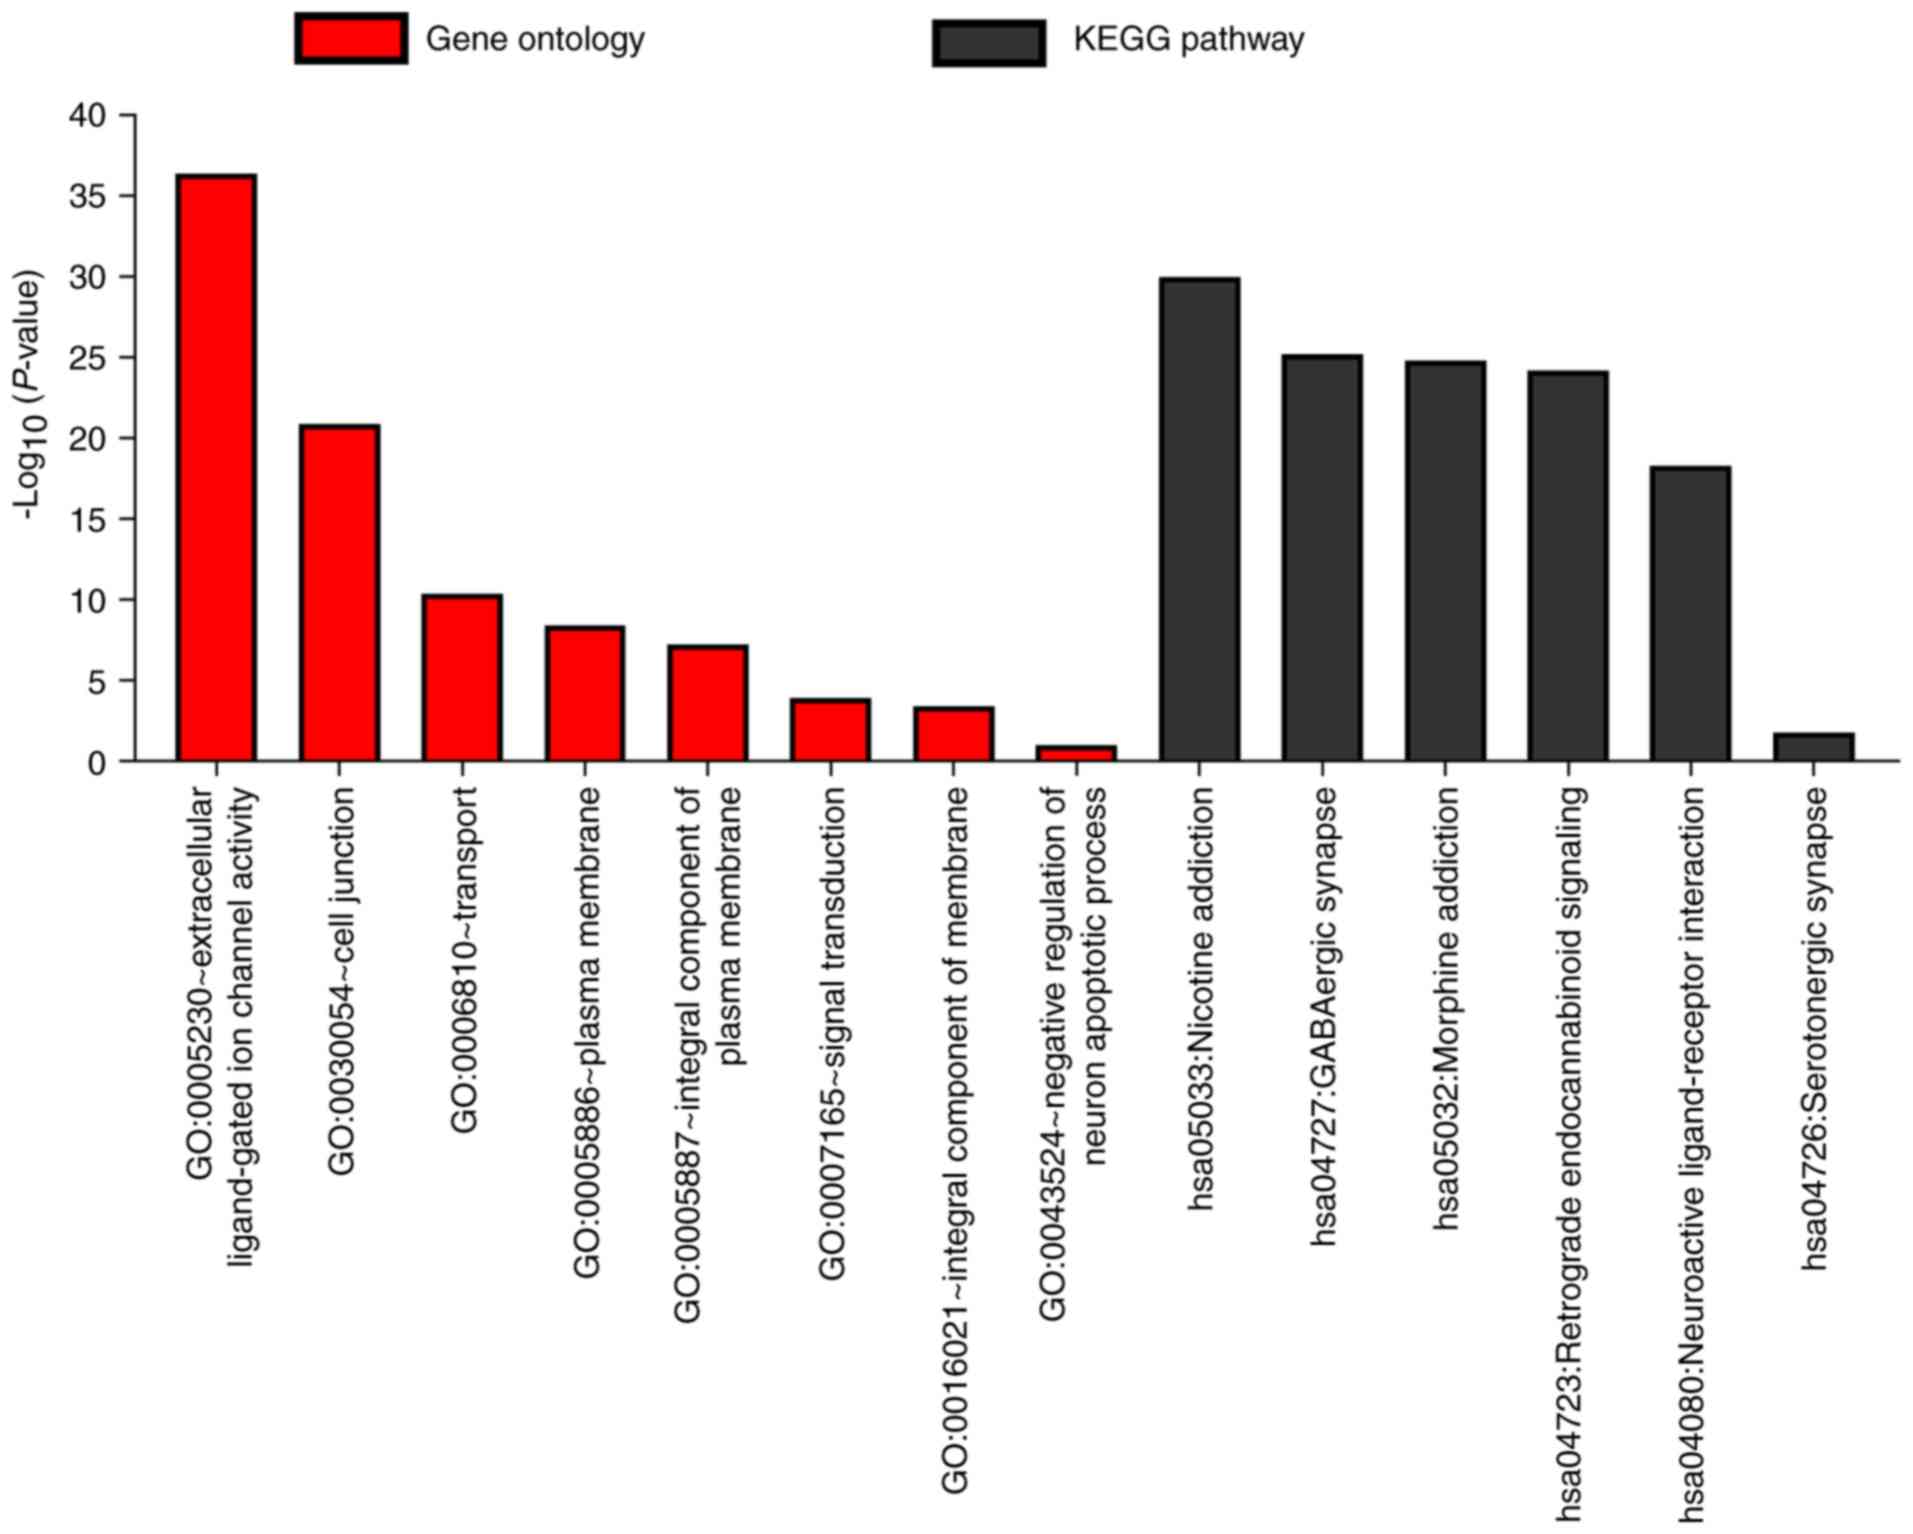
The biological functional of the
GABAA genes was investigated using DAVID to
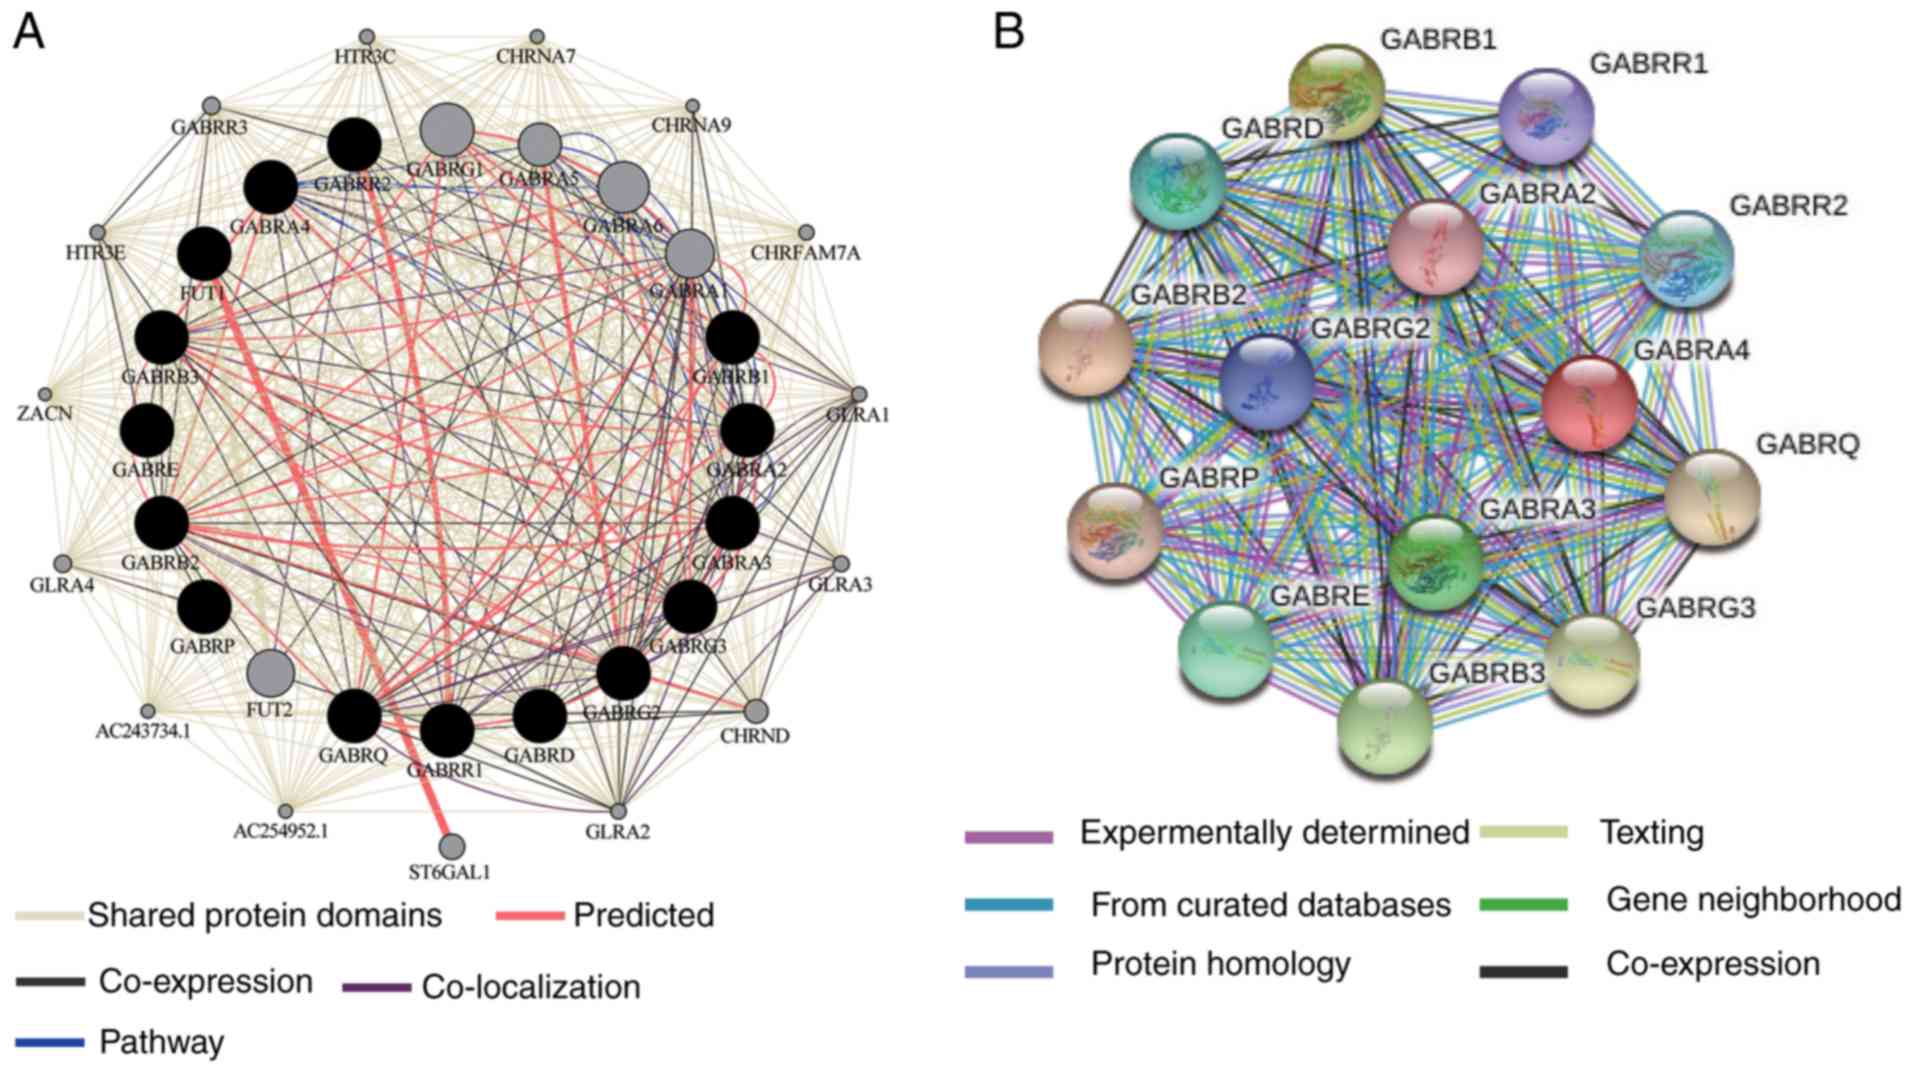
evaluate GO functions and KEGG pathways (Fig. 1), BiNGO was applied to examine the
enrichment outcomes (Fig. 2A) and
the co-expression of the protein level was examined as shown in
Fig. 2B. The interaction between
GABAA gene expression levels was presented in
Fig. 3. The above results indicate
that GABAA genes were involved in the transport
of substances and the formation of plasma membrane. In addition,
the genes are strongly co-expressed and have complex networks of
gene-gene and protein-protein interactions.
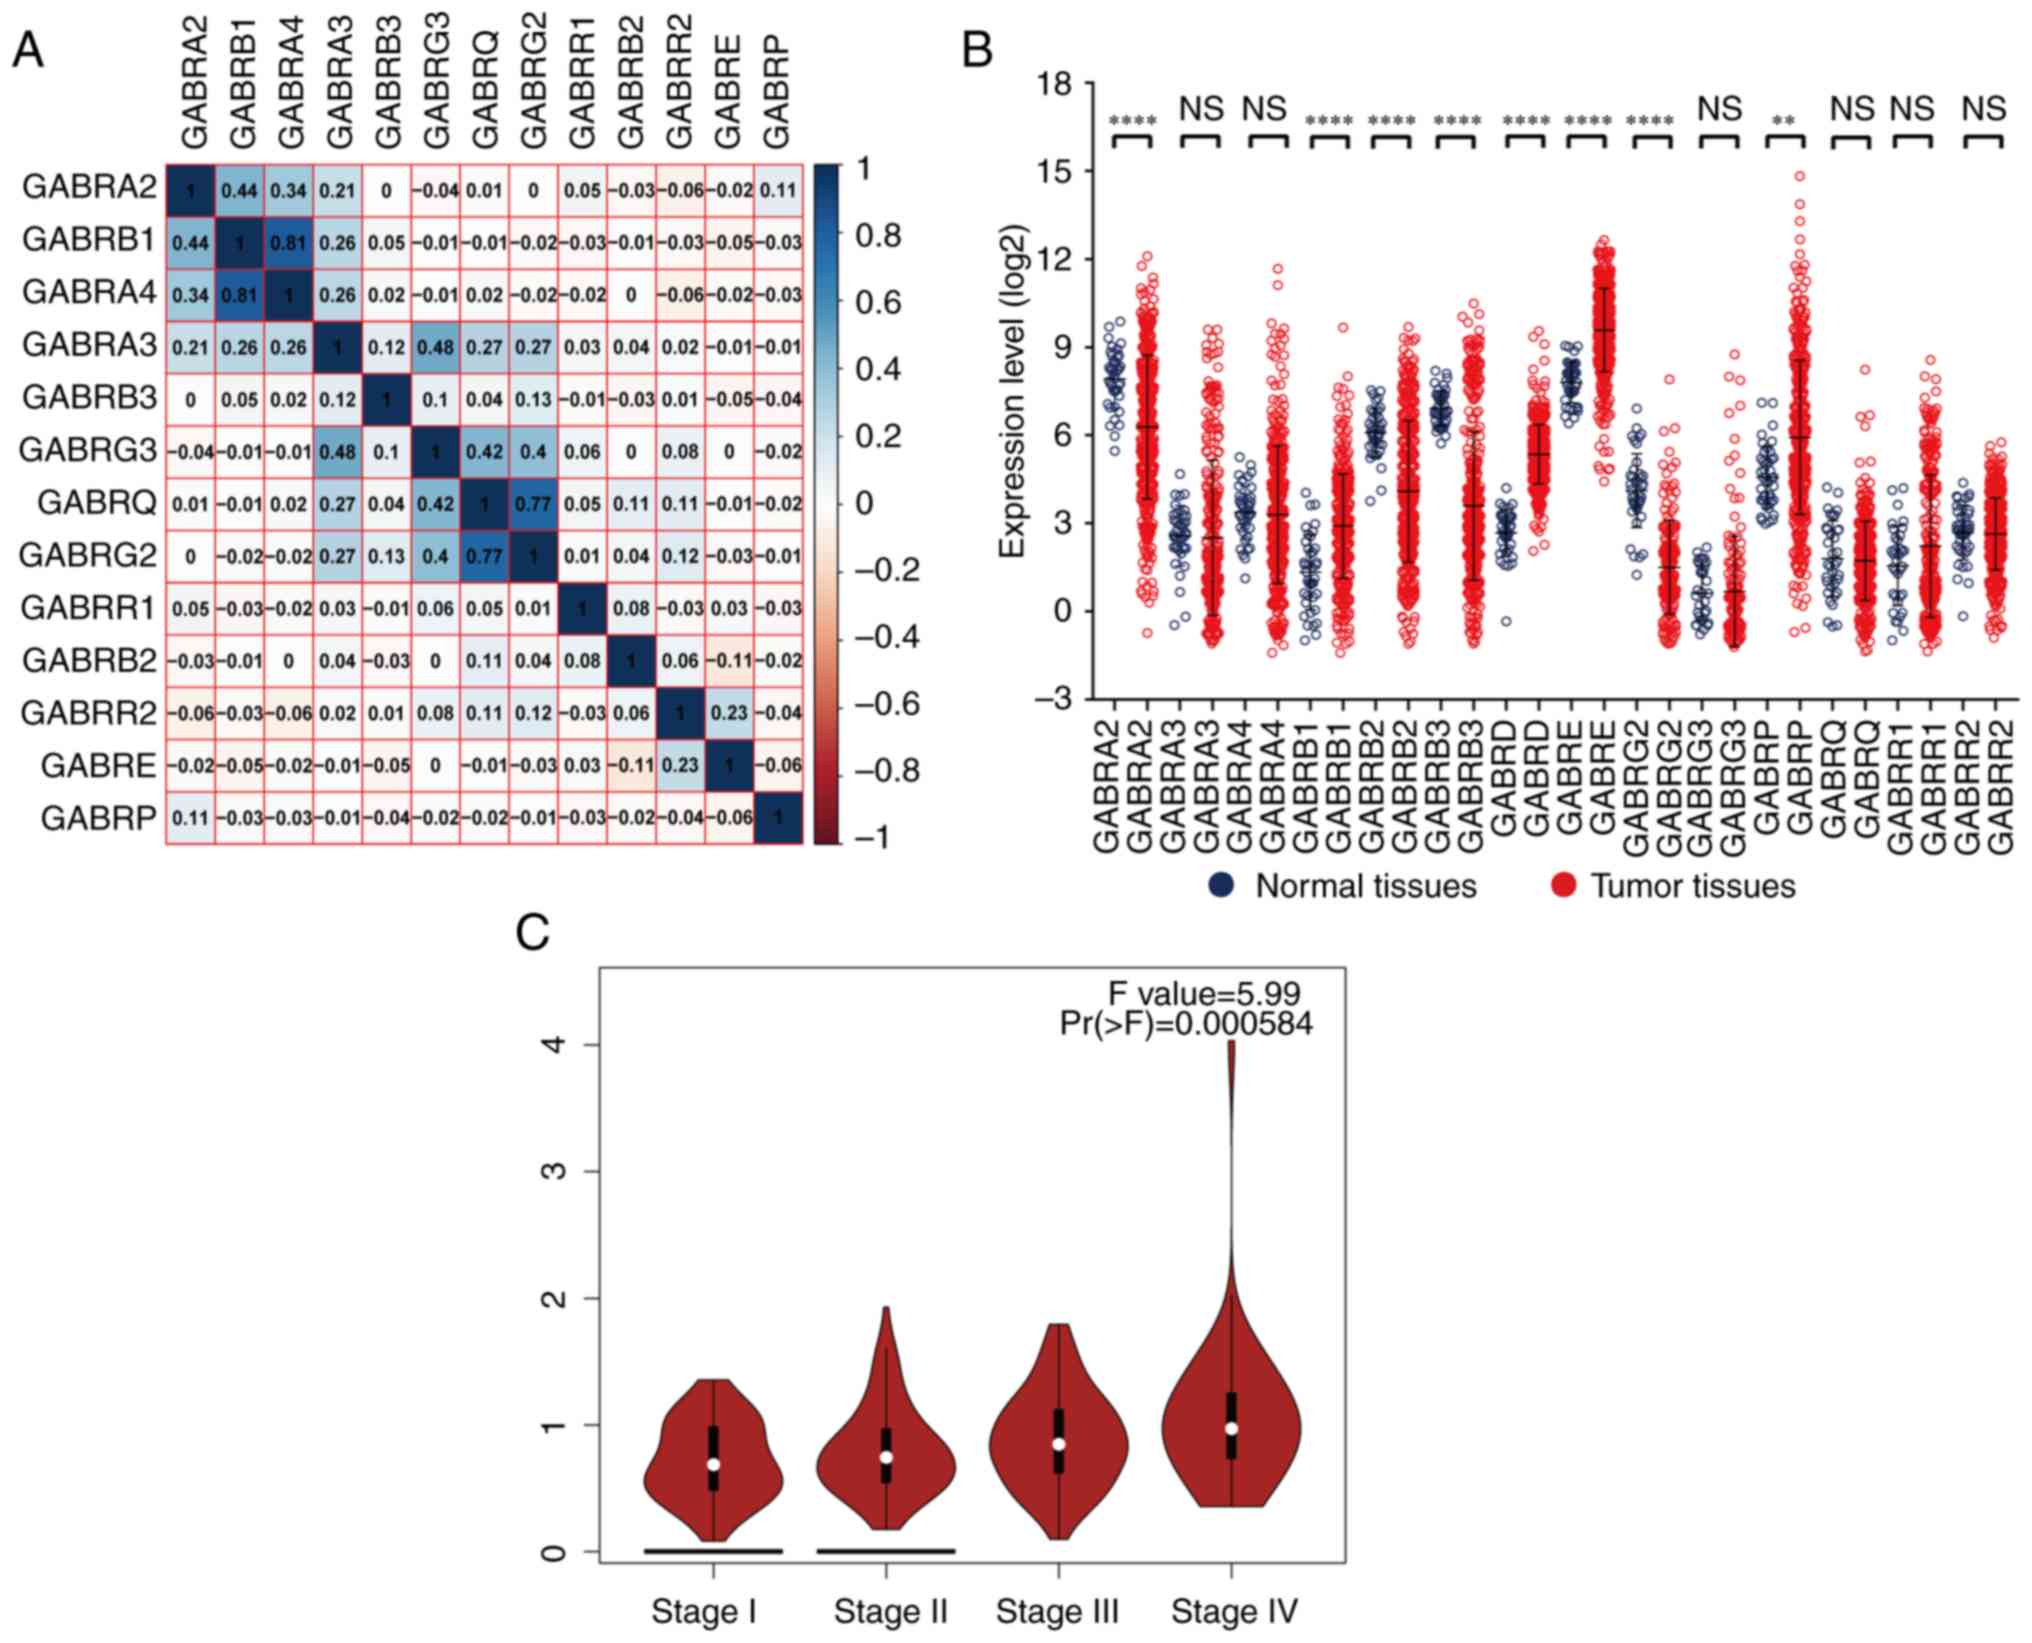
Through Pearson correlation coefficient analysis, it
was found that there was a correlation between the expression
levels of a single GABAA gene. The expression
level of GABRB1 was correlated with GABRA2 and
GABRA4; GABRA4 were correlated with GABRB1;
GABRA3 was correlated with GABRG3; GABRG3 were
correlated with GABRA3, GABRQ and GABRG2;
GABRQ were correlated with GABRG3 and GABRG2
(correlation coefficient >0.4; Fig.
4A).
Gene expression and diagnostic value
of the GABAA gene family
The vertical scattering map of
GABAA gene expression levels was shown in
Fig. 4B, it showed that the results
showed that GABRA2, GABRB2, GABRB3 and GABRG2 had low
expression in tumor tissues; GABRB1, GABRD, GABRE and
GABRP had high expression in tumor tissues. The correlation
between gene expression and TNM stage showed that the expression
levels of GABRD was significantly different in the four
tumor stages (I, II, III and IV) from GEPIA (Fig. 4C). In our TCGA database, GABRD
expression levels were associated with TNM stage also showed
significantly weak positive correlation (Correlation
Coefficient=0.174, Table II). The
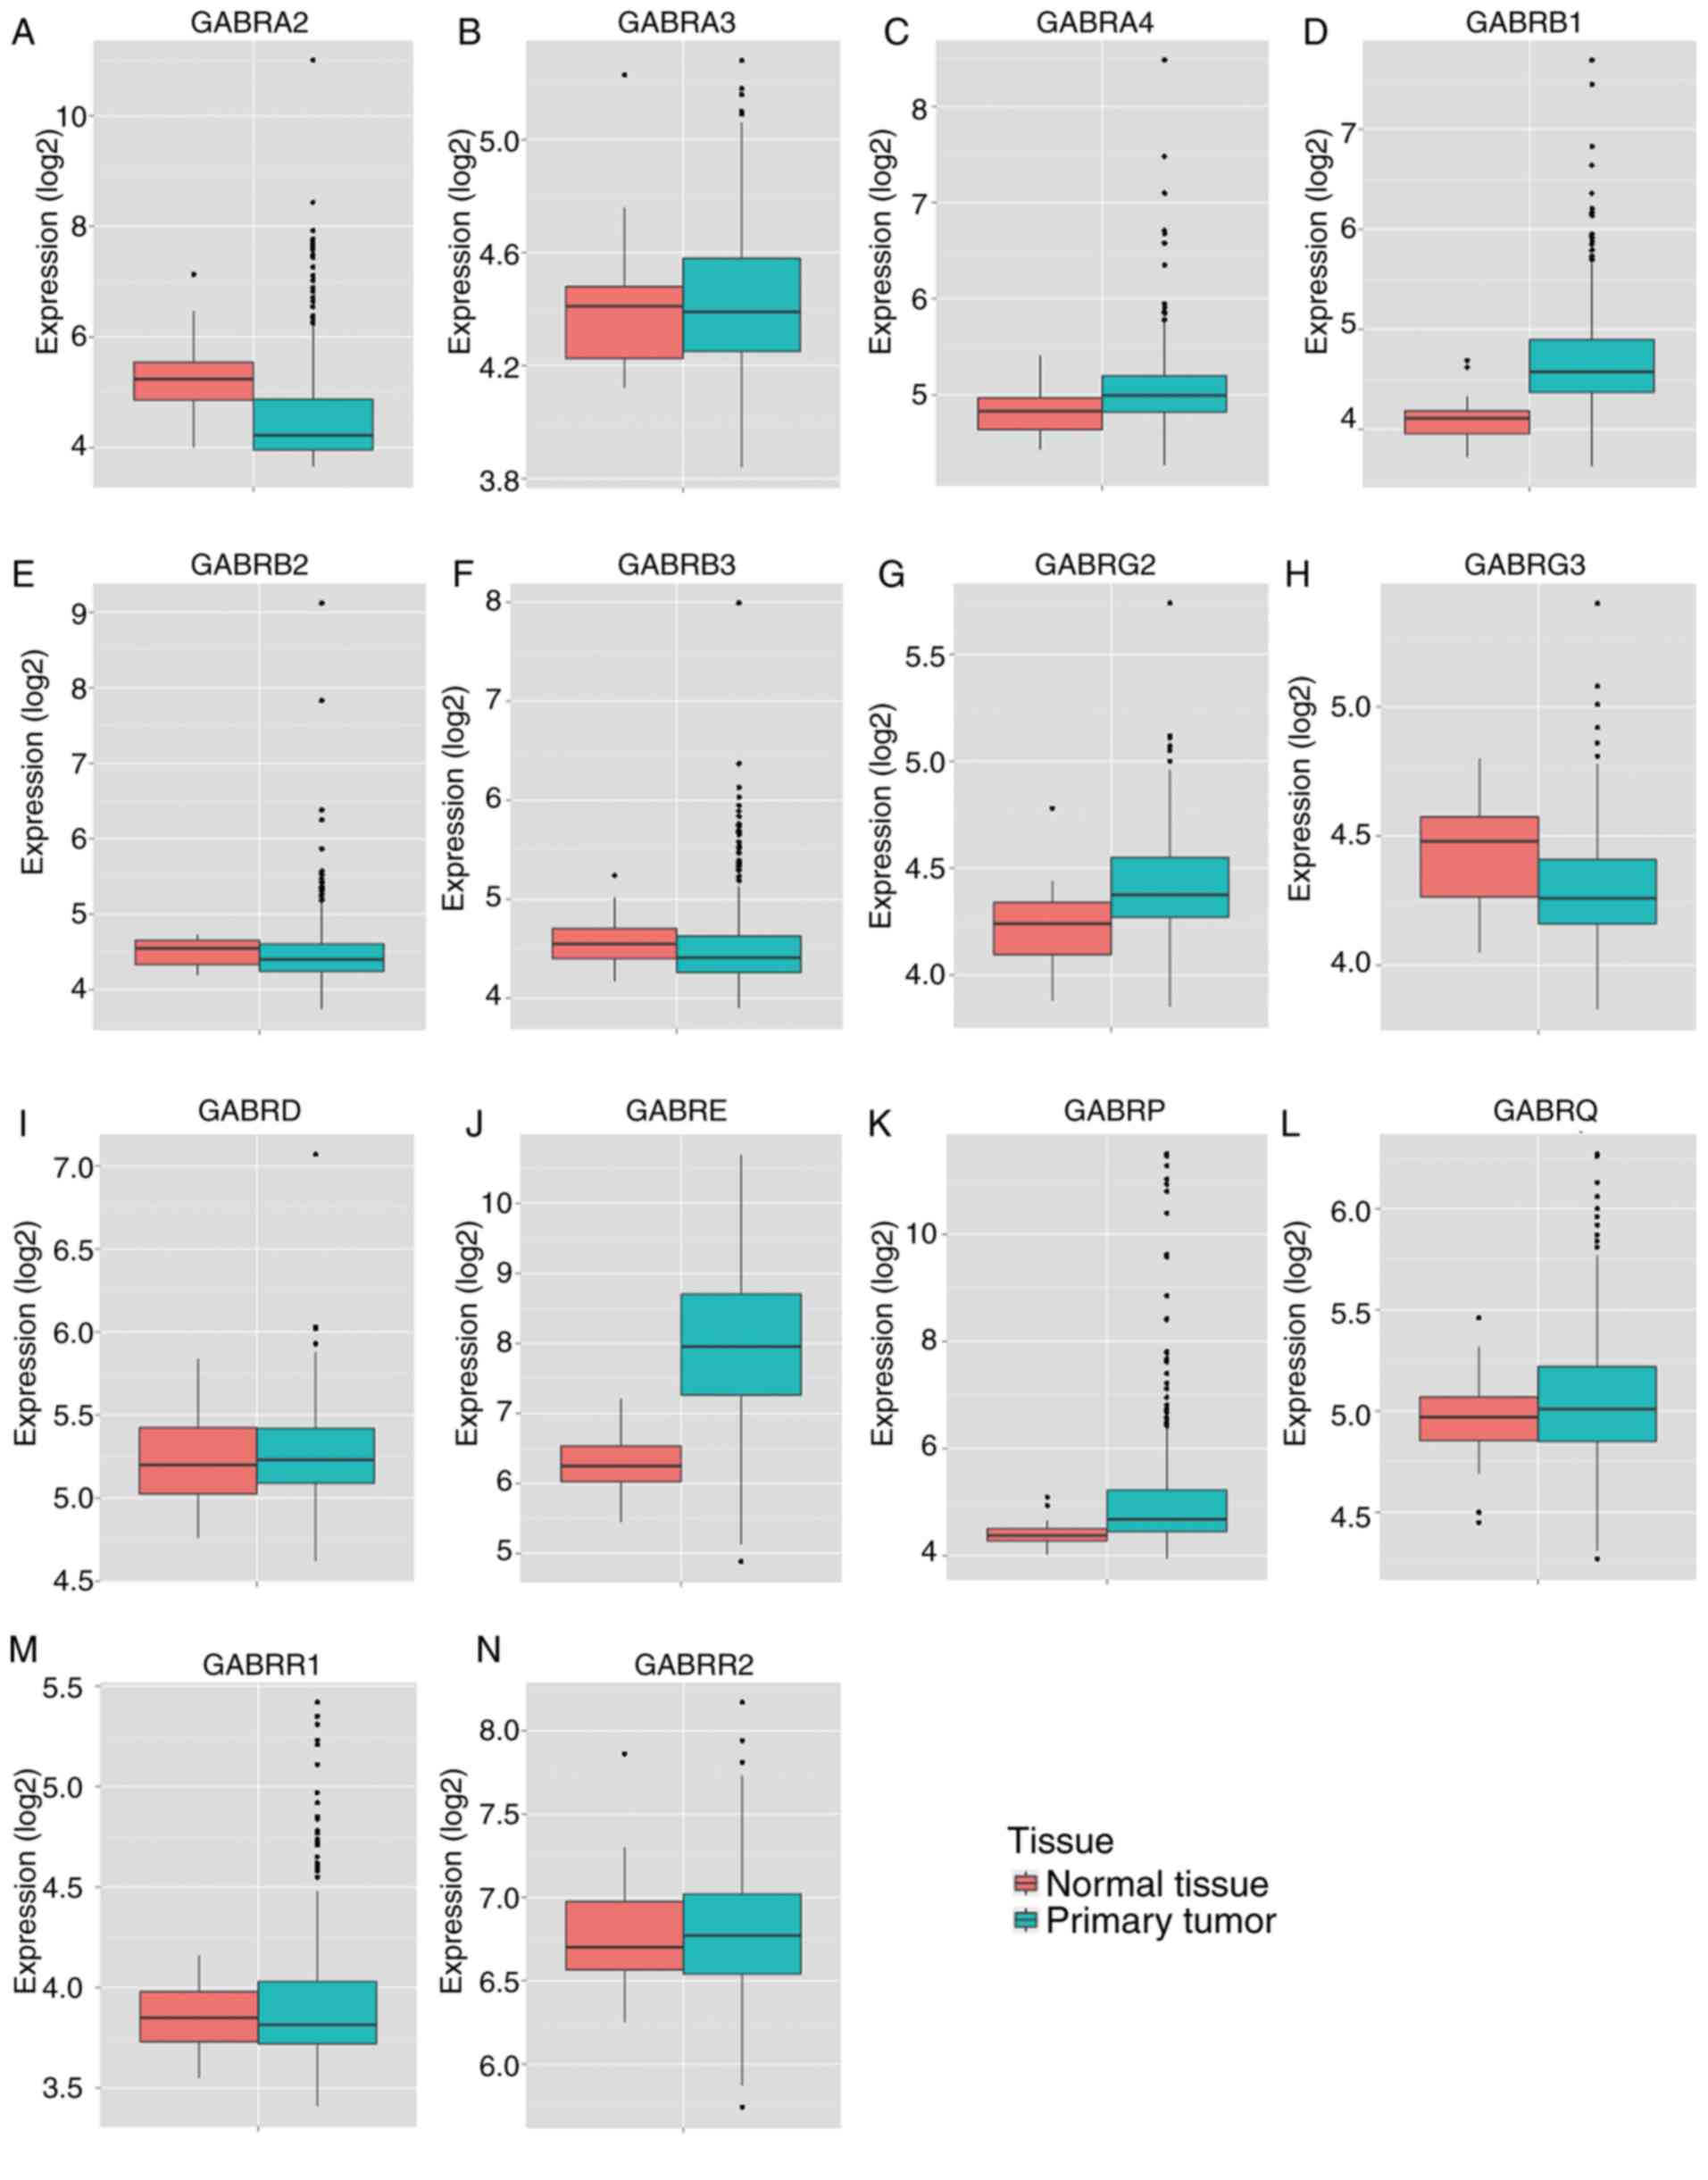
results of MERAV showed that the expression levels of GABRA2,
GABRA3, GABRB2, GABRB3, GABRG3 and GABRR1 in primary
colon tumor tissues were lower compared with normal tissue
(Fig. 5A, B, E, F, H and M), whereas
the expression levels of GABRA4, GABRB1, GABRG2, GEBRD, GABRE,
GABRP and GABRR2 in primary colon tumor tissues was
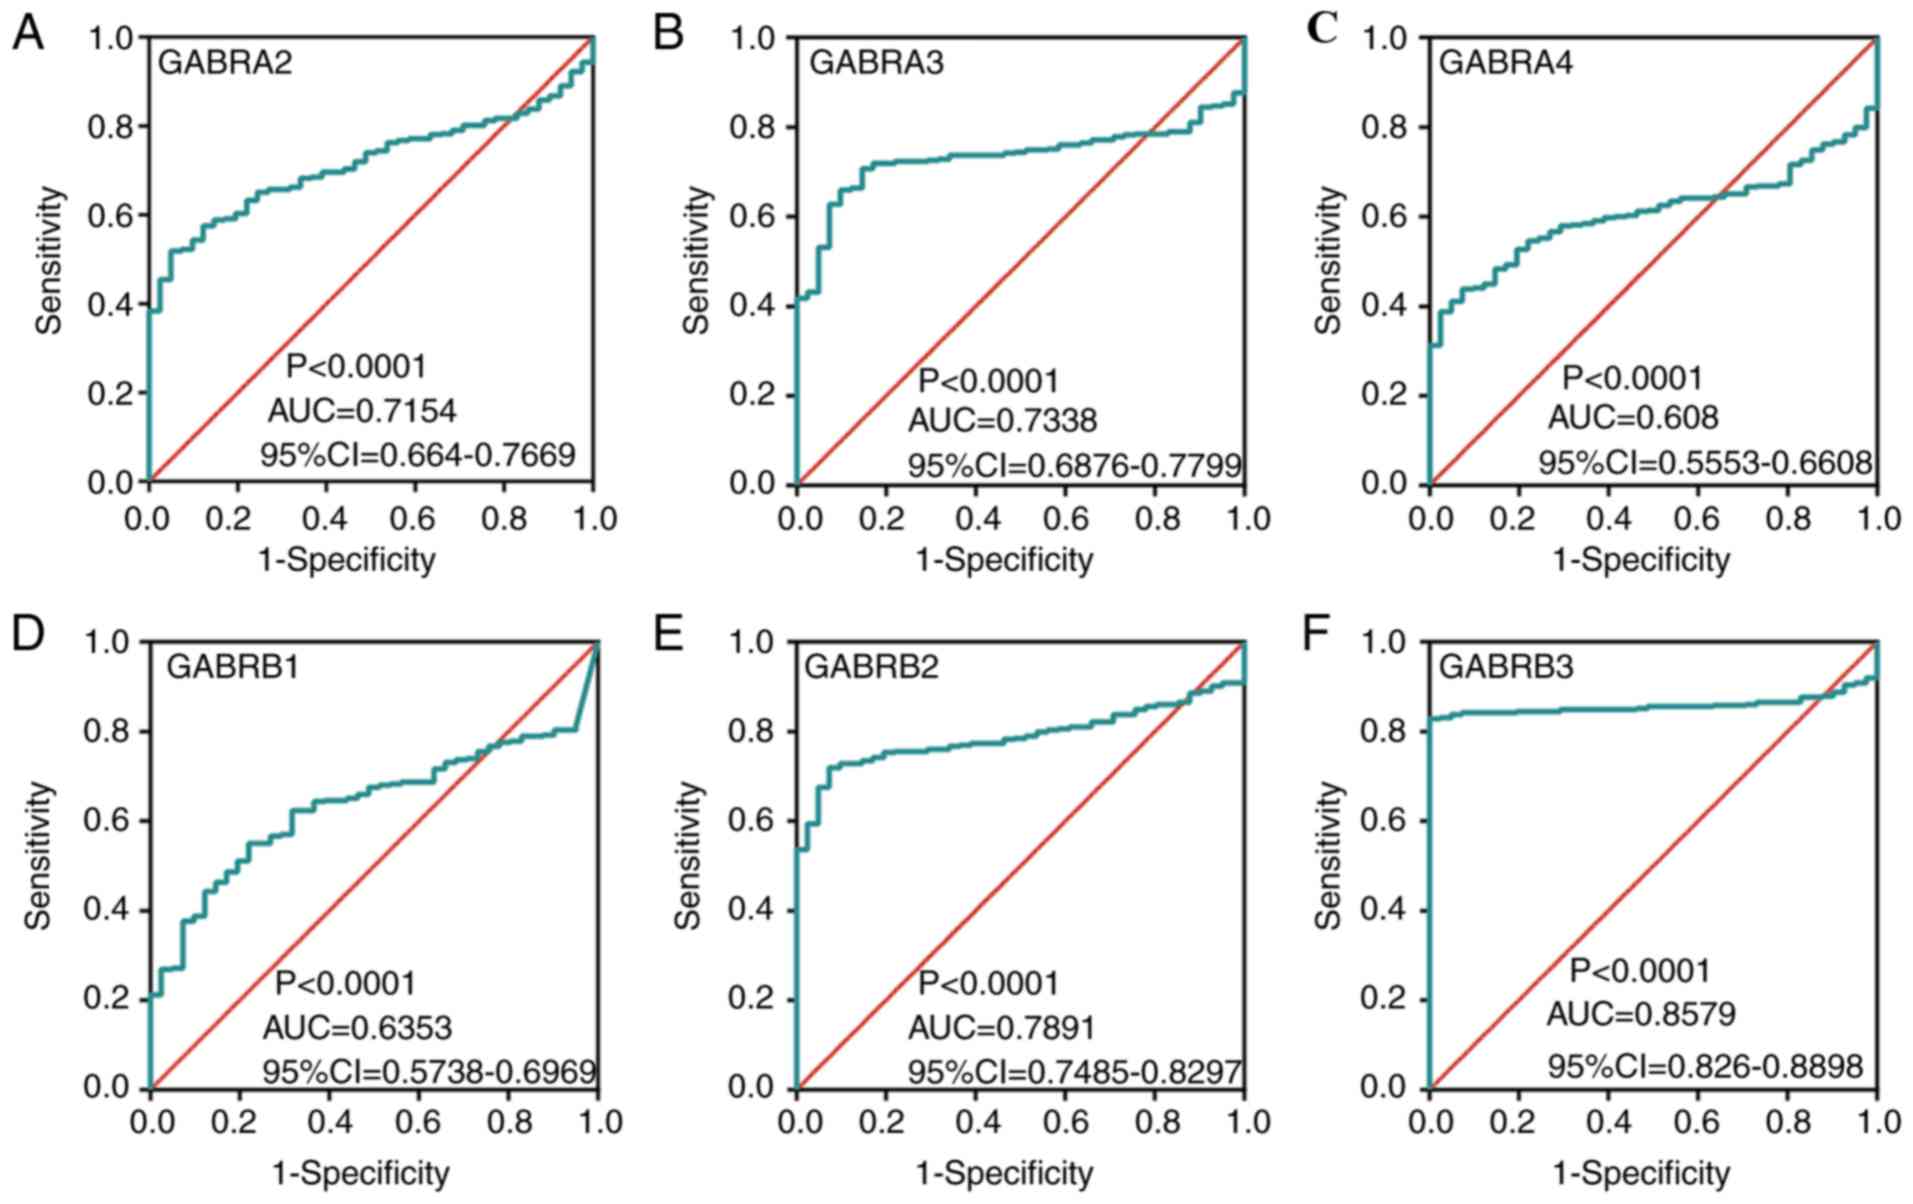
higher compared with normal colon tissue (Fig. 5C, D, G, I-L and N). In addition, ROC
curves of the predicted expression levels of the
GABAA family genes in tumors and paired colon
tissues was constructed (Fig. 6).
The expression levels of GABRA2 (Fig. 6A), GABRA3 (Fig. 6B), GABRB2 (Fig. 6E), GABRB3 (Fig. 6F), GABRG2 (Fig. 6G), GABRG3 (Fig. 6H), GABRD (Fig. 6I) and GABRE (Fig. 6J) were significantly associated with
the carcinogenesis of colon tumors (AUC >0.7).
| Table II.Spearman's correlations test between
GABRD expression and Tumor-Node-Metastasis stage in patients with
colon adenocarcinoma in The Cancer Genome Atlas dataset. |
Table II.
Spearman's correlations test between
GABRD expression and Tumor-Node-Metastasis stage in patients with
colon adenocarcinoma in The Cancer Genome Atlas dataset.
| Stage | Patients (n) | MST (days) | Spearman's
Correlations coefficient | P-value |
|---|
| I | 73 | NA | NA | NA |
| II | 167 | 2,821 | 0.090 | 0.164 |
| III | 126 | NA | 0.149 | 0.036a |
| IV | 61 | 858 | 0.318 |
<0.001b |
| Total | 427 | 2,821 | 0.174 |
<0.001b |
Survival analysis
Univariate survival analysis demonstrated that tumor
staging was the only factor associated with OS (P<0.001,
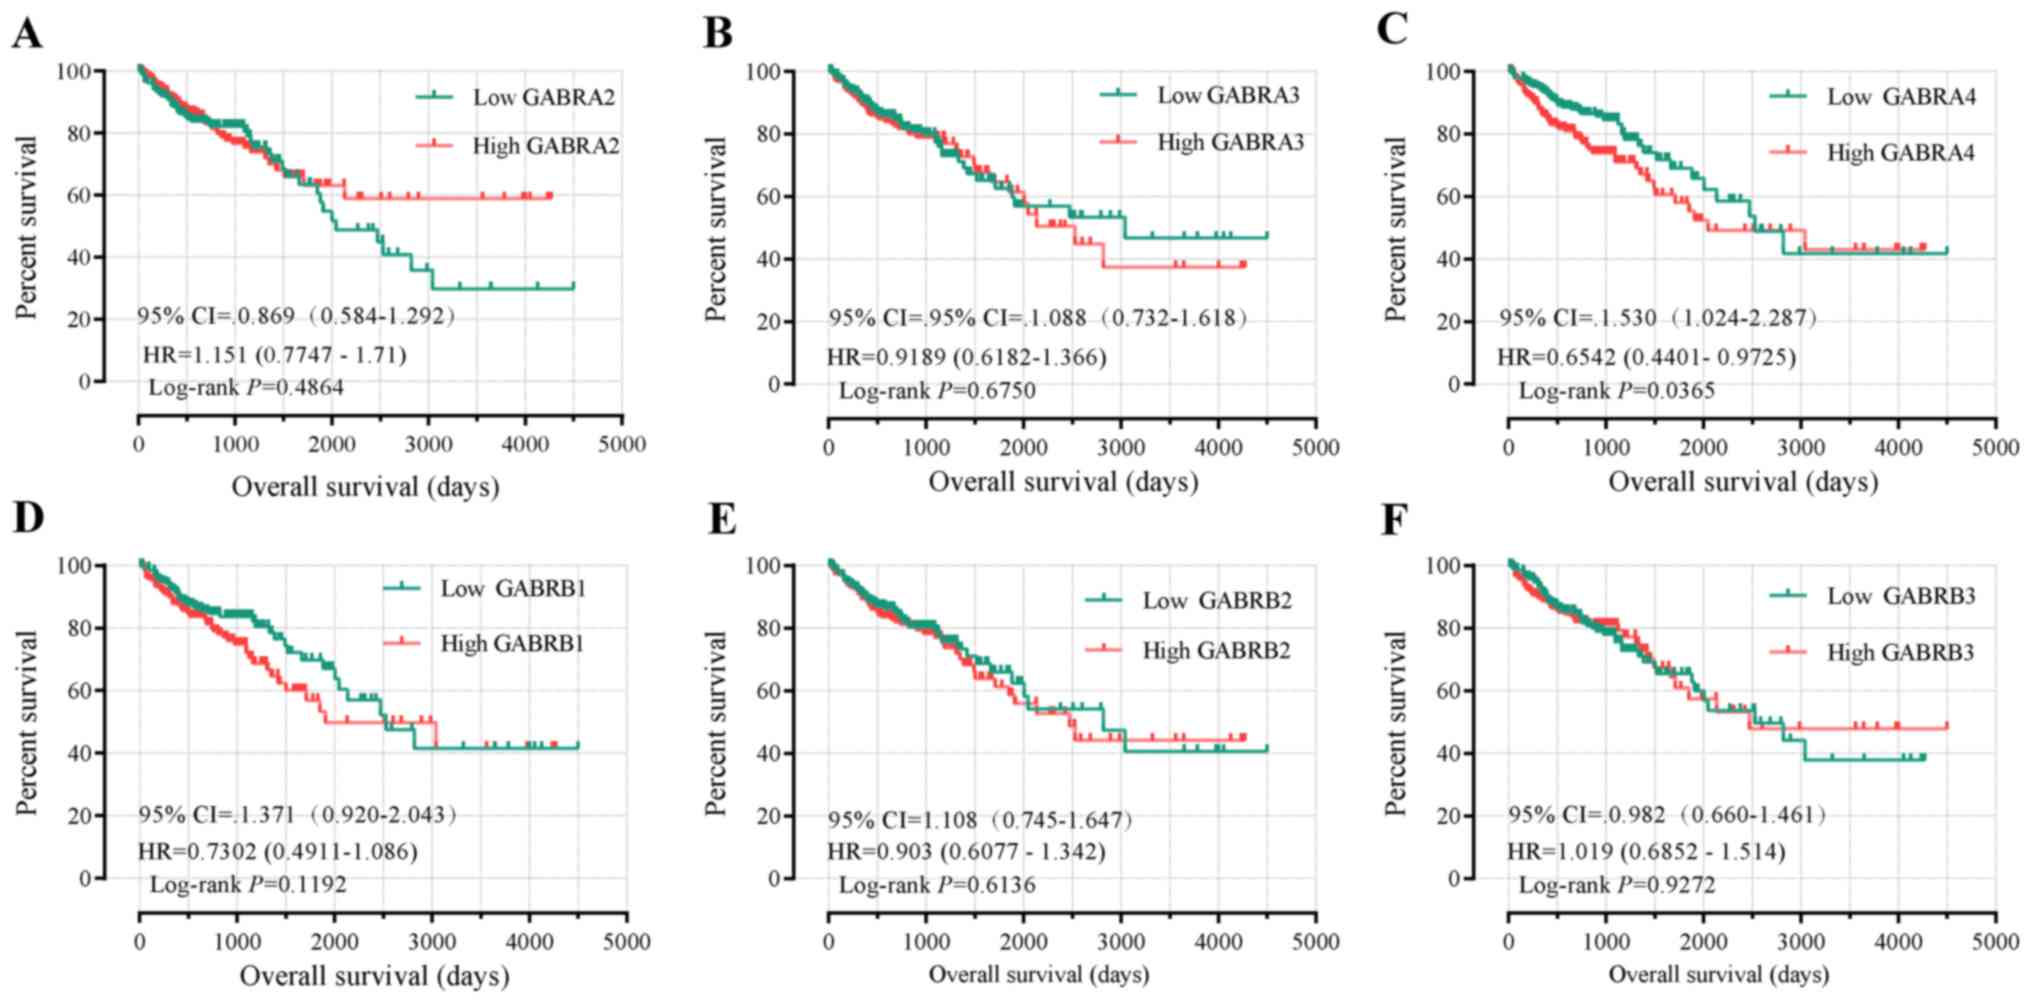
Table I). The Kaplan-Meier curve of
the GABAA family genes were presented in Fig. 7A-N. Tumor staging was investigated
using Cox proportional hazards regression model for multivariate
survival tests, wherein the lower expression levels of GABRB1,
GABRD, GABRP and GABRQ were significantly correlated
with favorable OS results (adjusted P=0.049, HR=1.517, 95%
CI=1.001–2.297; adjusted P=0.006, HR=1.807, 95% CI 1.180–2.765;
adjusted P=0.005, HR=1.833, 95% CI 1.196–2.810 and adjusted
P=0.034, HR=1.578, 95% CI 1.036–2.405, respectively; Table III).
| Table III.Prognostic survival analysis
according to high or low expression of γ-aminobutyric acid type A
receptor family genes in 438 patients with colon
adenocarcinoma. |
Table III.
Prognostic survival analysis
according to high or low expression of γ-aminobutyric acid type A
receptor family genes in 438 patients with colon
adenocarcinoma.
| Gene | Patients, n | Eventsc | MST, days | Crude HR (95%
CI) | Crude P-value | Adjusted HR (95%
CI) | Adjusted
P-valued |
|---|
| GABRA2 |
|
|
|
|
|
|
|
|
Low | 219 | 52 | 2,047 | 1 |
| 1 |
|
|
High | 219 | 46 | NA | 0.869
(0.584–1.292) | 0.487 | 0.792
(0.525–1.196) | 0.267 |
| GABRA3 |
|
|
|
|
|
|
|
|
Low | 219 | 49 | 3,042 | 1 |
| 1 |
|
|
High | 219 | 49 | 2,532 | 1.088
(0.732–1.618) | 0.675 | 1.099
(0.730–1.654) | 0.651 |
| GABRA4 |
|
|
|
|
|
|
|
|
Low | 219 | 41 | 2,532 | 1 |
| 1 |
|
|
High | 219 | 57 | 2,047 | 1.530
(1.024–2.287) | 0.038a | 1.499
(0.989–2.271) | 0.056 |
| GABRB1 |
|
|
|
|
|
|
|
|
Low | 219 | 44 | 2,532 | 1 |
| 1 |
|
|
High | 219 | 54 | 1,910 | 1.371
(0.920–2.043) | 0.121 | 1.517
(1.001–2.297) | 0.049a |
| GABRB2 |
|
|
|
|
|
|
|
|
Low | 219 | 46 | 2,821 | 1 |
| 1 |
|
|
High | 219 | 52 | 2,475 | 1.108
(0.745–1.647) | 0.614 | 1.343
(0.887–2.033) | 0.163 |
| GABRB3 |
|
|
|
|
|
|
|
|
Low | 219 | 52 | 2,532 | 1 |
| 1 |
|
|
High | 219 | 46 | 2,475 | 0.982
(0.660–1.461) | 0.927 | 1.170
(0.776–1.765) | 0.454 |
| GABRG2 |
|
|
|
|
|
|
|
|
Low | 219 | 51 | 2,821 | 1 |
| 1 |
|
|
High | 219 | 47 | 2,475 | 1.209
(0.809–1.808) | 0.355 | 1.296
(0.854–1.967) | 0.223 |
| GABRG3 |
|
|
|
|
|
|
|
|
Low | 219 | 51 | 2,532 | 1 |
| 1 |
|
|
High | 219 | 47 | NA | 0.971
(0.653–1.445) | 0.886 | 0.958
(0.635–1.445) | 0.839 |
| GABRD |
|
|
|
|
|
|
|
|
Low | 219 | 36 | NA | 1 |
| 1 |
|
|
High | 219 | 62 | 1,910 | 2.074
(1.374–3.130) | 0.001b | 1.807
(1.180–2.765) | 0.006b |
| GABRE |
|
|
|
|
|
|
|
|
Low | 219 | 57 | 2,134 | 1 |
| 1 |
|
|
High | 219 | 41 | NA | 0.744
(0.497–1.111) | 0.149 | 0.736
(0.486–1.112) | 0.145 |
| GABRP |
|
|
|
|
|
|
|
|
Low | 219 | 38 | NA | 1 |
| 1 |
|
|
High | 219 | 60 | 1,881 | 1.673
(1.113–2.513) | 0.013a | 1.833
(1.196–2.810) | 0.005b |
| GABRQ |
|
|
|
|
|
|
|
|
Low | 219 | 39 | NA | 1 |
| 1 |
|
|
High | 219 | 59 | 1,910 | 1.506
(1.005–2.258) | 0.047a | 1.578
(1.036–2.405) | 0.034a |
| GABRR1 |
|
|
|
|
|
|
|
|
Low | 219 | 49 | 2,532 | 1 |
| 1 |
|
|
High | 219 | 49 | 2,134 | 1.070
(0.720–1.591) | 0.736 | 1.079
(0.717–1.625) | 0.714 |
| GABRR2 |
|
|
|
|
|
|
|
|
Low | 219 | 49 | 3,042 | 1 |
| 1 |
|
|
High | 219 | 49 | 2,134 | 1.070
(0.720–1.591) | 0.738 | 1.259
(0.833–1.902) | 0.274 |
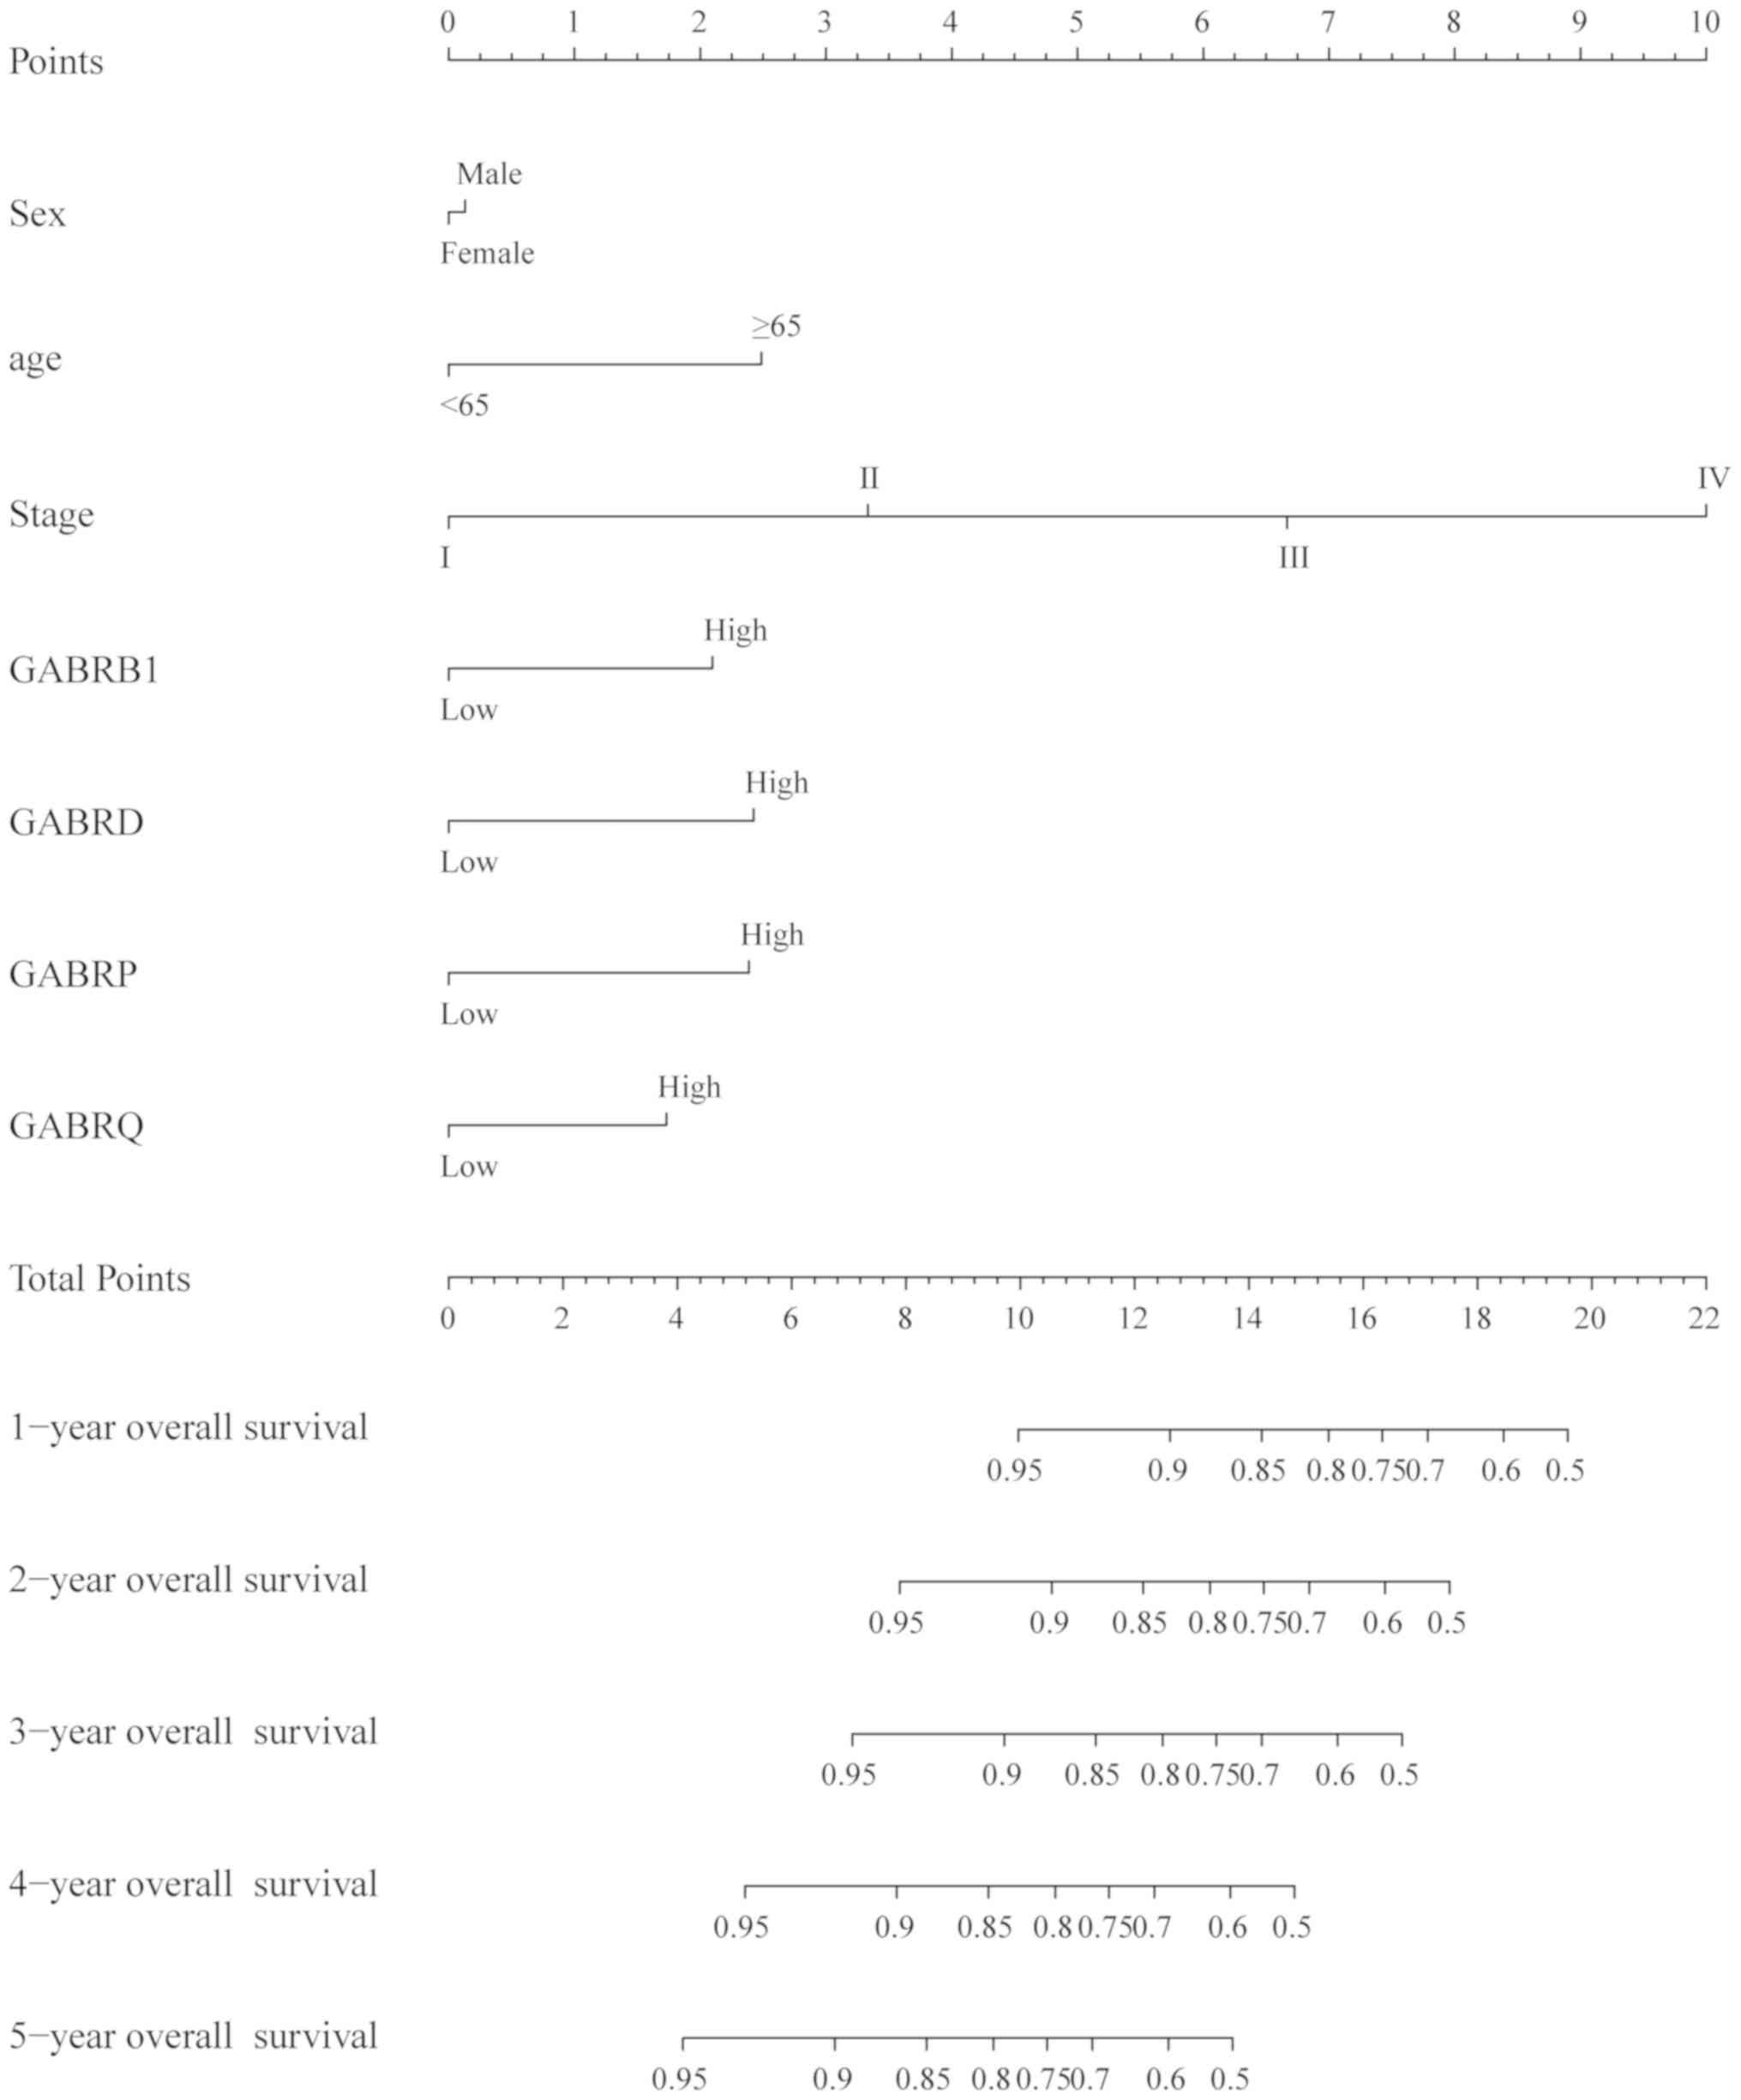
The nomogram of scoring risk included the expression
levels of GABRB1, GABRD, GABRP and GABRQ and
predictive TNM stage, sex, age and 1-, 2-, 3, 4- and 5-year
survival rates (Fig. 8), it showed
that the above risk factors contribute to the risk points, among
which the age contribution is the smallest one and the stage
contribution is the largest one, The higher the risk points, the
lower the survival rates.
Effect of GABAA genes
expression combination on OS
Based on the survival analysis of
GABAA genes, GABRB1, GABRD, GABRP and
GABRQ were selected as prognostic genes by multivariate
survival analysis. The joint-effects of these four
GABAA genes on OS in patients with COAD were
determined by the joint-effects model. According to the expression
levels of GABRB1, GABRD, GABRP and GABRQ, different
combinations for this analysis were generated (Tables IV–V). Log-rank tests were performed using
Kaplan-Meier analysis to evaluate the effect of gene expression
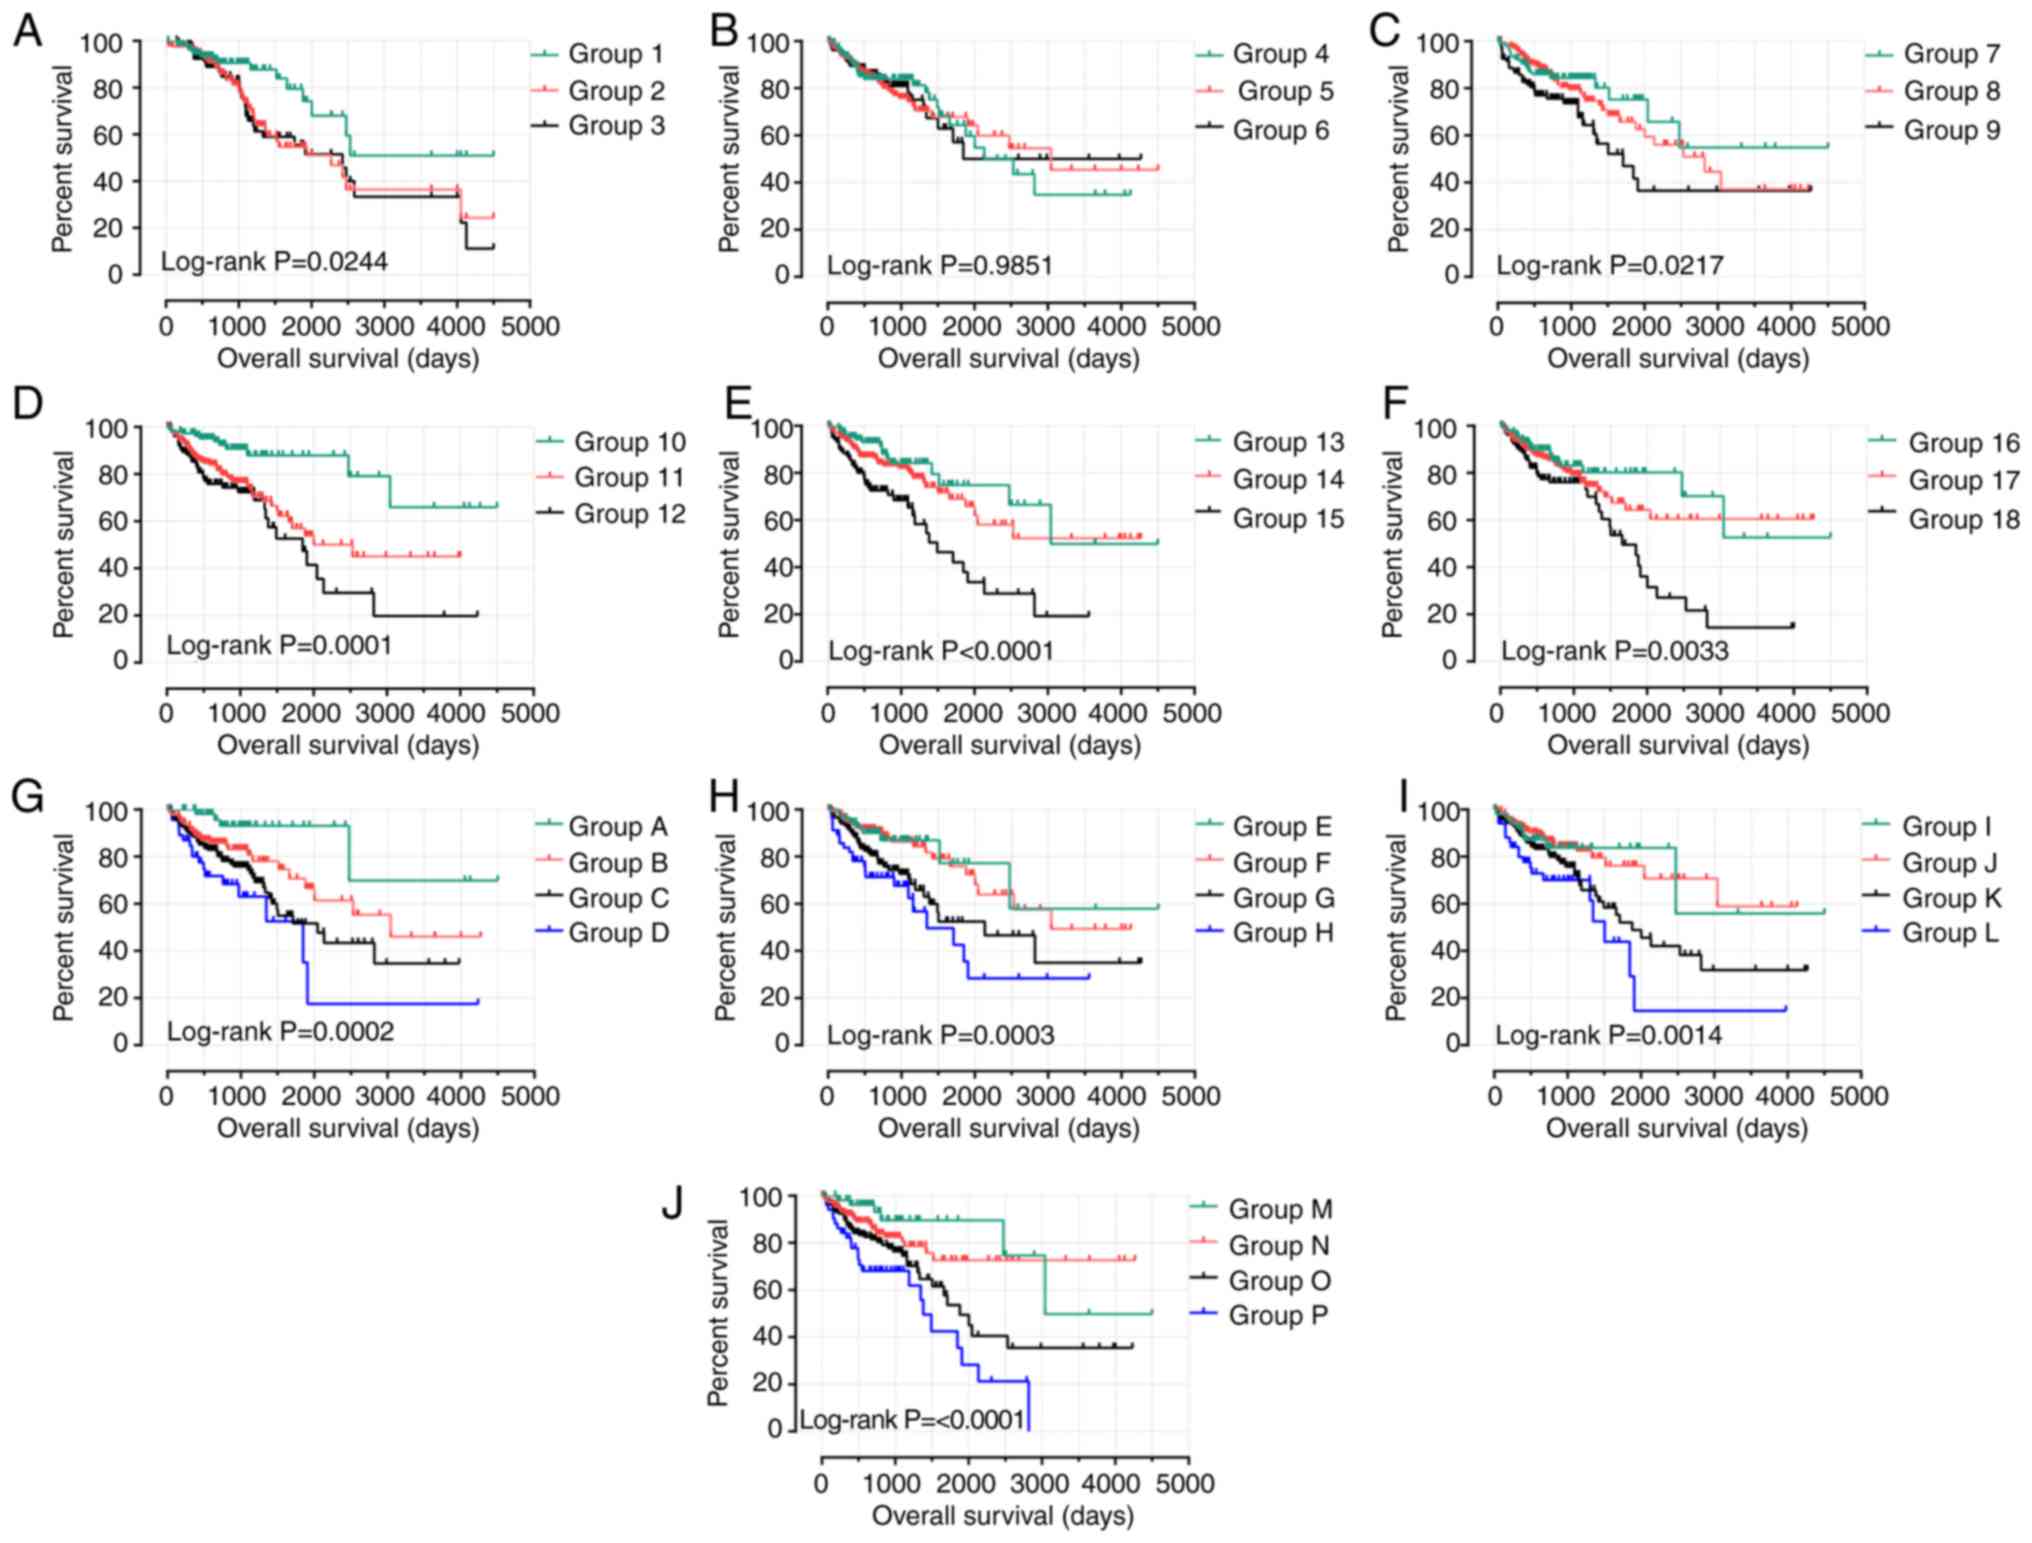
combinations on the prognosis of patients with COAD (Fig. 9). In the analysis of high expression
levels of GABRB1, GABRD, GABRP and GABRQ, the
combinations in groups 3, 9, 12, 15, 18, H and P were highly
correlated with poor OS (all P<0.05; Table VI). Within the evaluation of low
GABRB1, GABRD, GABRP and GABRQ expression levels, the
combination of groups 1, 7, 10, 13, 16, A, E, I and M were highly
correlated with favorable OS (all P<0.05; Table VII).
| Table IV.Grouping according to combination of
2 genes in GABRB1, GABRD, GABRP and GABRQ. |
Table IV.
Grouping according to combination of
2 genes in GABRB1, GABRD, GABRP and GABRQ.
| Group | Combination |
|---|
| 1 | Low GABRB1 + Low
GABRD |
| 2 | Low GABRB1 + High
GABRD |
|
| High GABRB1 + Low
GABRD |
|
| High GABRD + Low
GABRP |
| 3 | High GABRB1 + High
GABRD |
| 4 | Low GABRB1 + Low
GABRP |
| 5 | Low GABRB1 + High
GABRP |
|
| High GABRB1 + Low
GABRP |
|
| High GABRD + Low
GABRQ |
| 6 | High GABRB1 + High
GABRP |
| 7 | Low GABRB1 + Low
GABRQ |
| 8 | Low GABRB1 + High
GABRQ |
|
| High GABRB1 + Low
GABRQ |
|
| High GABRP + Low
GABRQ |
| 9 | High GABRB1 + High
GABRQ |
| 10 | Low GABRD + Low
GABRP |
| 11 | Low GABRD + High
GABRP |
| 12 | High GABRD + High
GABRP |
| 13 | Low GABRD + Low
GABRQ |
| 14 | Low GABRD + High
GABRQ |
| 15 | High GABRD + High
GABRQ |
| 16 | Low GABRP + Low
GABRQ |
| 17 | Low GABRP + High
GABRQ |
| 18 | High GABRP + High
GABRQ |
| Table V.Grouping according to combination of
3 genes in GABRB1, GABRD, GABRP and GABRQ. |
Table V.
Grouping according to combination of
3 genes in GABRB1, GABRD, GABRP and GABRQ.
| Group | Combination | Group | Combination |
|---|
| A | Low GABRB1 + Low
GABRD + Low GABRP | I | Low GABRB1 + Low
GABRP + Low GABRQ |
| B | Low GABRB1 + High
GABRD + Low GABRP | J | Low GABRB1 + High
GABRP + Low GABRQ |
|
| Low GABRB1 + Low
GABRD + High GABRP |
| Low GABRB1 + Low
GABRP + High GABRQ |
|
| High GABRB1 + Low
GABRD + Low GABRP |
| High GABRB1 + Low
GABRP + Low GABRQ |
| C | High GABRB1 + High
GABRD + Low GABRP | K | High GABRB1 + High
GABRP + Low GABRQ |
|
| High GABRB1 + Low
GABRD + High GABRP |
| High GABRB1 + Low
GABRP + High GABRQ |
|
| Low GABRB1 + High
GABRD + High GABRP |
| Low GABRB1 + High
GABRP + High GABRQ |
| D | High GABRB1 + High
GABRD+ High GABRP | L | High GABRB1 + High
GABRP + High GABRQ |
| E | Low GABRB1 + Low
GABRD + Low GABRQ | M | Low GABRD + Low
GABRP + Low GABRQ |
| F | Low GABRB1 + High
GABRD + Low GABRQ | N | Low GABRD + High
GABRP + Low GABRQ |
|
| Low GABRB1 + Low
GABRD + High GABRQ |
| Low GABRD + Low
GABRP + High GABRQ |
|
| High GABRB1 + Low
GABRD + Low GABRQ |
| High GABRD + Low
GABRP + Low GABRQ |
| G | High GABRB1 + High
GABRD + Low GABRQ | O | High GABRD + High
GABRP + Low GABRQ |
|
| High GABRB1 + Low
GABRD + High GABRQ |
| High GABRD + Low
GABRP + High GABRQ |
|
| Low GABRB1 + High
GABRD + High GABRQ |
| Low GABRD + High
GABRP + High GABRQ |
| H | High GABRB1 + High
GABRD + High GABRQ | P | High GABRD + High
GABRP + High GABRQ |
| Table VI.Joint analysis of the prognostic
value of 2-gene combinations in GABRB1, GABRD, GABRP and
GABRQ expression of patients with colon adenocarcinoma. |
Table VI.
Joint analysis of the prognostic
value of 2-gene combinations in GABRB1, GABRD, GABRP and
GABRQ expression of patients with colon adenocarcinoma.
| Group | Patients | MST, days | Crude P-value | Crude HR | Adjusted
P-value | Adjusted HR (95%
CI)d |
|---|
| 1 | 115 | 1 | 0.003b | 1 | 0.007b | 1 |
| 2 | 208 | 2,821 | 0.021a | 1.947
(1.105–3.431) | 0.020a | 2.009
(1.118–3.611) |
| 3 | 115 | 1,849 | 0.001b | 2.814
(1.551–5.104) | 0.002b | 2.712
(1.460–5.039) |
| 4 | 112 | 2,134 | 0.985 | 1 | 0.921 | 1 |
| 5 | 214 | 3,042 | 0.865 | 1.042
(0.648–1.676) | 0.966 | 1.011
(0.616–1.659) |
| 6 | 112 | 1 | 0.947 | 1.019
(0.587–1.768) | 0.720 | 1.110
(0.628–1.962) |
| 7 | 110 | 1 | 0.024a | 1 | 0.011a | 1 |
| 8 | 218 | 2,821 | 0.506 | 1.200
(0.702–2.051) | 0.263 | 1.381
(0.784–2.431) |
| 9 | 110 | 1,711 | 0.016a | 1.994
(1.137–3.497) | 0.005b | 2.333
(1.287–4.231) |
| 10 | 112 | 1 | 0.000c | 1 | 0.001b | 1 |
| 11 | 214 | 2,532 | 0.001b | 2.936
(1.530–5.634) | 0.006b | 2.620
(1.318–5.207) |
| 12 | 112 | 1,849 | 0.000c | 4.026
(2.042–7.937) | 0.000c | 4.033
(1.967–8.270) |
| 13 | 110 | 3,042 | 0.000 | 1 | 0.001b | 1 |
| 14 | 218 | 1 | 0.249 | 1.402
(0.790–2.490) | 0.332 | 1.342
(0.741–2.431) |
| 15 | 110 | 1,493 | 0.000c | 2.934
(1.639–5.255) | 0.002b | 2.658
(1.453–4.863) |
| 16 | 110 | 1 | 0.001b | 1 | 0.000c | 1 |
| 17 | 218 | 1 | 0.332 | 1.342
(0.741–2.431) | 0.249 | 1.402
(0.790–2.490) |
| 18 | 110 | 1,661 | 0.002b | 2.658
(1.453–4.863) | 0.000c | 2.934
(1.639–5.255) |
| Table VII.Joint analysis of the prognostic
value of 3 genes combination in GABRB1, GABRD, GABRP and
GABRQ expression of patients with colon adenocarcinoma. |
Table VII.
Joint analysis of the prognostic
value of 3 genes combination in GABRB1, GABRD, GABRP and
GABRQ expression of patients with colon adenocarcinoma.
| Group | Patients | MST, days | Crude P-value | Crude HR | Adjusted
P-value | Adjusted HR (95%
CI)d |
|---|
| A | 61 | 1 | 0.001b | 1 | 0.000c | 1 |
| B | 148 | 3,042 | 0.000 | 0.130
(0.044–0.386) | 0.000c | 0.103
(0.030–0.357) |
| C | 178 | 2,047 | 0.007b | 0.439
(0.241–0.801) | 0.002b | 0.374
(0.201–0.695) |
| D | 51 | 1,849 | 0.127 | 0.649
(0.373–1.131) | 0.060 | 0.581
(0.330–1.023) |
| E | 57 | 1 | 0.001b | 1 | 0.000c | 1 |
| F | 164 | 3,042 | 0.864 | 1.072
(0.487–2.359) | 0.945 | 0.971
(0.418–2.255) |
| G | 158 | 2,134 | 0.047a | 2.159
(1.011–4.607) | 0.030a | 2.439
(1.089–5.462) |
| H | 59 | 1,348 | 0.007b | 3.067
(1.365–6.892) | 0.028a | 2.626
(1.110–6.231) |
| I | 52 | 1 | 0.002b | 1 | 0.000c | 1 |
| J | 168 | 1 | 0.015a | 0.360
(0.157–0.823) | 0.003b | 0.249
(0.099–0.629) |
| K | 165 | 1,881 | 0.001b | 0.349
(0.193–0.632) | 0.000c | 0.304
(0.166–0.556) |
| L | 53 | 1,503 | 0.119 | 0.651
(0.380–1.116) | 0.046 | 0.573
(0.332–0.989) |
| M | 59 | 3,042 | 0.000c | 1 | 0.000c | 1 |
| N | 155 | 1 | 0.250 | 1.685
(0.693–4.096) | 0.106 | 2.222
(0.845–5.843) |
| O | 170 | 1,881 | 0.014a | 2.914
(1.240–6.852) | 0.026a | 2.883
(1.136–7.318) |
| P | 54 | 1,381 | 0.000c | 5.003
(2.034–12.307) | 0.000c | 7.157
(2.689–19.053) |
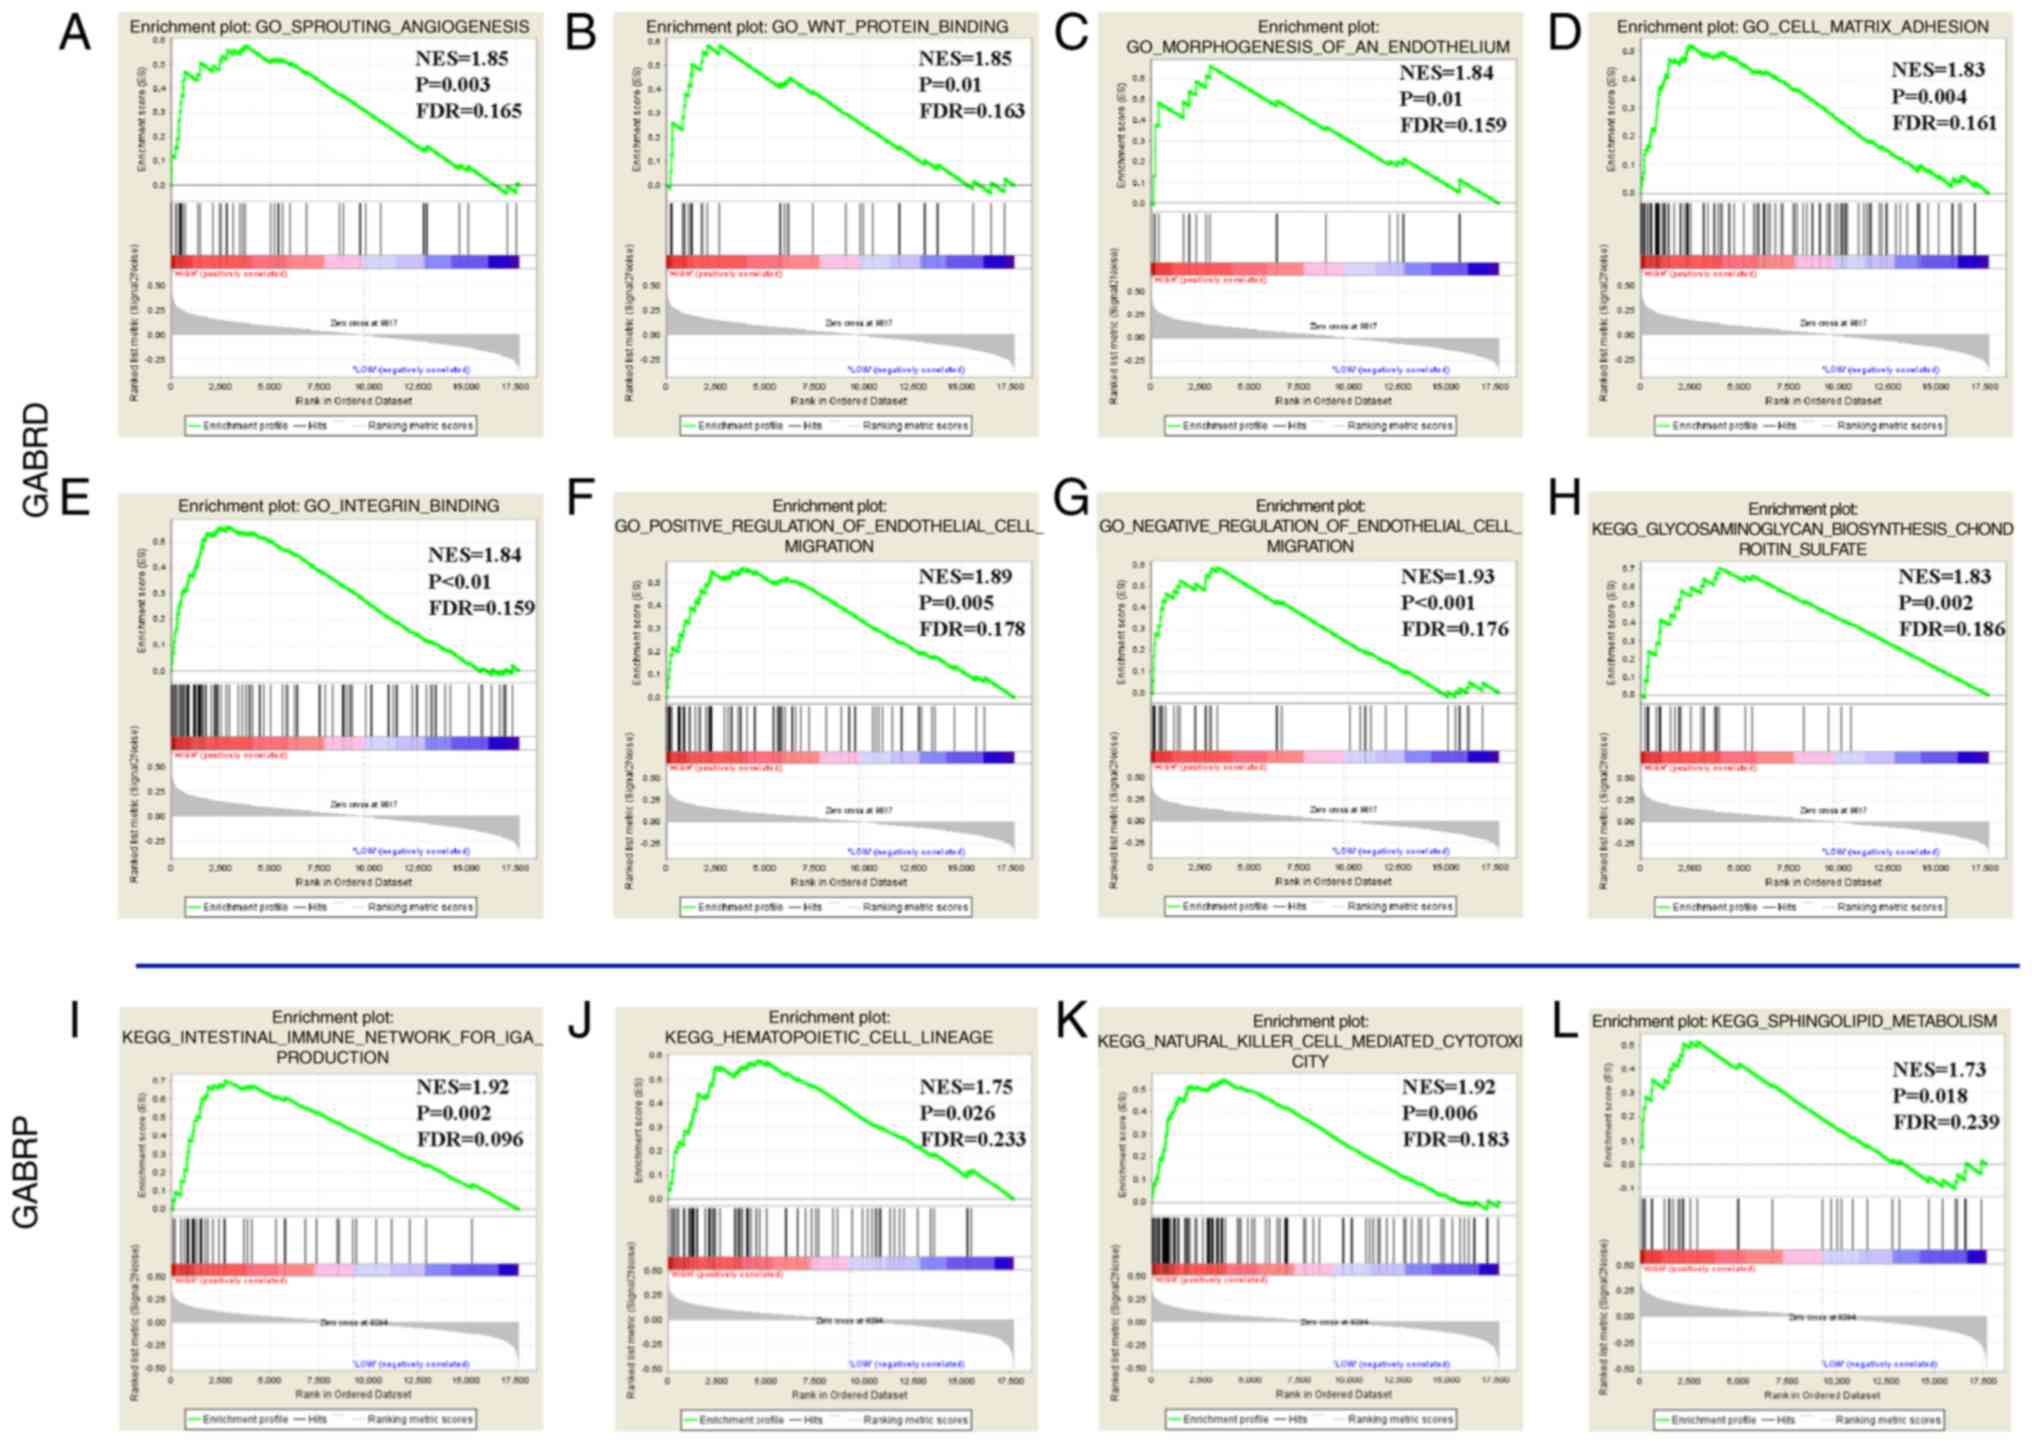
GSEA
GSEA of the prognostic genes GABRB1, GABRD,
GABRP and GABRQ were performed in the TCGA cohorts
(Fig. 10). In the GSEA of KEGG
pathways, the expression levels of the GABRD were associated
with the chondroitin sulfate pathway (Fig. 10H) and GABRP was associated
with the intestinal immune network for Immunoglobulin A (IGA)
production, hematopoietic cell lineage, the natural killer cell
mediated cytotoxicity pathway, sphingolipid metabolism (Fig. 10I-L). GO function enriched
examination demonstrated that that GABRD expression levels
were associated with the cell matrix adhesion, integrin,
angiogenesis, endothelial growth factor, endothelial migration
regulation, and so on (Fig. 10A-G);
whereas GABRB1 and GABRQ had no significant
outcomes.
Discussion
In the present study, the diagnostic and prognosis
value of the GABAA family genes based on TCGA
database were investigated. The results of ROC curves showed that
expression levels of GABRB3, GABRG2, GABRD and GABRE
had high values to predict the occurrence of colon cancer, among
them, GABRD was associated with COAD stage and may have
value as an early diagnostic index of COAD. The results were
roughly the same as verified in MERAV and Vertical scatterplots.
Low expression levels of GABRB1, GABRD, GABRP and
GABRQ were associated with favorable COAD OS and the
nomogram indicated these four genes had different degrees of
influence on the prognosis of the patients, high expression of
GABRB1, GABRD, GABRP have high contribution to the risk score than
high expression of GABRQ. In the functional evaluation of GO and
KEGG, it was found that the functions of the
GABAA gene family were significantly enriched in
cell junction, integral component of membrane, signal transduction,
integral component of plasma membrane.
GABAA receptors have the same
structure with nicotinic acetylcholine receptors, the
5-hydroxytryptamine type 3 receptor and zinc-activated channel, all
with pentameric structures and belonging to the agonist-gated ion
channel superfamily (29). STRING
results showed that obvious gene fusions, gene co-occurrence and
co-expression between GABAA genes. Pearson
correlation coefficient analysis showed that there was a
correlation between the expression levels of some genes in the
GABAA family, especially between GABRB1
and GABA4, and GABRQ and GABRG2.
The GABAA family genes also serve
a role in several types of cancer, Gumireddy et al (30) found that the high expression levels
of GABRA3 were inversely proportional to the survival rate
of patients with breast cancer and that GABRA3 activated the
AKT pathway which promoted the migration, invasion and metastasis
of breast cancer cells. Therefore, GABRA4 might serve a role
in COAD, which requires further study. Bautista et al
(31) observed that the expression
levels of GABRA6 in tumor initiating stem cells (TISCS) and
hepatocellular carcinoma (HCC) were reduced, whereas the expression
levels of GABRG3 were abundant in TISCS and limited in HCC.
A previous study showed that the specific activation of
GABAA receptor decreased cell activity, induced
apoptosis and inhibited the growth and survival signal pathway of
neuroblastoma cells (32). Chen
et al (33) found that
GABAA receptor could inhibit the migration and
invasion of human hepatocellular carcinoma cells and Minuk et
al (34) reported downregulated
expression of the GABRB3 receptor in liver tissue of human
hepatocellular carcinoma, which was consistent with COAD in the
present study. Takehara et al (35)found that GABA promoted the
growth of pancreatic cancer by expressing GABAA
receptor GABRP subunit. Zhang et al showed that RNA
binding protein nova 1 and GABRG2 interacted in the central
nervous system and in liver cancer. Nova 1, as a potential
mechanism of oncogene, might interact with GABRG2 (36). To sum up, the GABAA
family plays an important role in many cancer types, Nevertheless,
the correlation between GABAA family and COAD is
unclear. Here, we use the TCGA database to study the correlation of
GABAA gene family expression with diagnosis and prognosis.
GSEA analysis showed that GABRD was
associated with cell matrix adhesion and integrin binding. Cell
adhesion is an important cellular process that could lead to cancer
(37,38). As the main receptor of cell matrix
adhesion, integrin exists on the surface of tumor and stroma cells,
which had a profound impact on cancer cell's ability to survive in
a specific location, cell adhesion and integrin can worked together
to lead to apoptosis (39). In
addition, integrin also serves a role in promoting the phenotype of
tumor cells (40). The present study
also suggested that GABRD was significantly associated with
angiogenesis and endothelial migration regulation in GSEA. These
factors serve a role in tumor invasion and migration (41–43). In
addition, tumor angiogenesis is also one of the markers of tumor
progression and the increase of tumor microvessel density is an
index of poor prognosis (44). Park
et al reported that human γ-aminobutyrate type A
receptor-binding protein (GABARBP) could inhibit angiogenesis by
directly binding to vascular endothelial growth factor receptor 2
(VEGFR-2) to inhibit the phosphorylation of PI3K/AKT pathway
related proteins (45). GABARBP
served a role in regulating the activity of GABAA
receptor, a key participant in intracellular trafficking in all the
GABAA receptors (46–48).
Therefore, the GABAA family genes may affect angiogenesis
through regulating GABRBP, which needs to be verified in future
experiments. In the present study, KEGG pathway analysis showed
that GABRD was associated with chondroitin sulfate
synthesis. Chondroitin sulfate serves a role in cancer metastasis
and chondroitin sulfate-E negatively adjusted breast cancer cell
motility through the Wnt/β-catenin-Collagen I axis (49,50).
In the present study, it was observed that the
expression of GABRD mRNA in adjacent tissues was
significantly lower compared with COAD tumor tissues, which was
consistent with the results of a previous study (14). KEGG pathway analysis of the present
study showed that GABRP was associated with intestinal
immune network for IGA production, hematopoietic cell lineage,
natural killer (NK) cell mediated cytotoxicity and sphingolipid
metabolism. In previous studies, people with IgA deficiency were
found to have a moderately increased risk of cancer, especially
gastrointestinal cancer (51). NK
cells also play an important role in mediating immune surveillance
for human cancer (52). As the
structural molecules of cell membranes, sphingolipids play an
important role in maintaining barrier function and fluidity
2)(53), Besim considered that
signaling nodes in sphingolipid metabolism, such as sphingolipids,
metabolic enzymes, and/or receptors, are new therapeutic targets
for the development of new anticancer intervention strategies
(54).
At present, few reports have been reported on
GABRB1 in tumor field, our present study showed that GABRB1
was differentially expressed in tumor and adjacent normal tissues
and that high expression levels of GABRB1 in patients with
COAD was associated with a less favorable OS. Hence, GABRB1
may also have potential as a prognosis biomarker of COAD.
In a previous study, GABRD was upregulated
in patients with COAD and was not associated with proliferation
(14), which is consistent with the
results of the present study. Sarathi et al found GABRD was
significantly monotonically upregulated across stages in
hepatocellular carcinoma (55). In
the present study, it was demonstrated that the expression of
GABRD in COAD was significantly upregulated compared with
normal tissues. Low expression levels of GABRD were
associated with a more favorable prognosis and could be used as a
biomarker for prognosis.
At present, it is known that GABRP serves a
role in cancer development and progression. Menelaos et al
found that GABRP gradually downregulated as tumors
progressed, and it may serve as a prognostic marker for breast
cancer (56). In contrast, Symmans
et al (57) found increased
expression of GABRP gene in undifferentiated cell type
breast cancer and is significantly associated with shorter lifetime
history of breastfeeding and with high-grade breast cancer in
Hispanic women. Sung et al found that GABRP enhances
aggressive phenotype of ovarian cancer cells (58). Jiang et al found that the
expression of GABRP in pancreatic cancer tissues was
significantly increased and associated with poor prognosis,
contributing to tumor growth and metastasis (59). In our study, we found that the
expression of GABRP in cancer tissues was higher than in
adjacent normal tissues and high expression of GABRP are
associated with poor prognosis of patients with COAD, which were
consistent with the previous studies. It was also shown that OS was
less favorable in patients with COAD with high expression levels of
GABRP compared with patients with low expression levels of
COAD.
Li et al (60) demonstrated that the overexpression of
GABRQ was associated with the occurrence and development of
HCC and might to become a molecular target for new diagnosis and
treatment strategies for HCC. The multivariate COX proportional
hazards model in the present study divided patients with COAD into
groups based on high and low expression levels of GABRQ and
showed that patients with high expression levels had a less
favorable OS.
There were some limitations in the present study.
First, the sample size was relatively small. Second, the clinical
data were slightly inadequate, such as Event-free Survival (EFS)
information, smoking, drinking history, tumor size and lymph node
metastasis were not available from TCGA database. Therefore, it was
not possible to perform a far-reaching survival analysis of
GABAA genes considering each potential prognostic
variable of COAD in the multivariate Cox proportional hazards
regression model. Third, although the association between the
GABAA gene family mRNA levels and COAD prognosis
was investigated, the association between GABAA
family protein levels and COAD, GABAA genes and
GSEA still require further experimental research. Experiments like
cell migration assays, detection of sulfuric acid related pathways
at protein level and the functions of these genes in common
cancer-related pathways, such as PI3K/AKT signaling pathway
(61), JAK/STAT signaling pathway
(62), should be conducted in
future. However, despite these limitations, the present study
further showed that the downregulated expression levels of
GABRB1, GABRD, GABRP and GABRQ in COAD was associated
with a more favorable prognosis and the potential mechanisms of
GSEA associated with to GABRD and GABRP in the
prognosis of COAD were studied. These results need to be verified
with a larger sample size to confirm the role of the
GABAA family genes in the diagnosis and prognosis
of COAD in the future.
Overall, the present study showed that the
upregulated expression levels of GABRA2, GABRA3, GABRB2, GABRB3,
GABRG2, GABRG3, GABRD and GABRE in COAD may have
potential diagnostic value in COAD. In addition, the low expression
levels of GABRB1, GABRD, GABRP and GABRQ were
associated with a more favorable prognosis of patients with COAD
and could be used as a prognostic biomarker. Multivariate survival
analysis, nomograms and joint survival analysis showed that the
high expression of GABRB1, GABRD, GABRP and GABRQ
were associated with poor prognosis of COAD. GSEA suggested that
GABRD may impact cell adhesion, integrin binding,
angiogenesis and so on; GABRP was associated with intestinal immune
network for IGA production, hematopoietic cell lineage, and so on.
However, the results of the present need to be confirmed by further
research.
Acknowledgements
The authors thank the contributors of The Cancer
Genome Atlas (portal.gdc.cancer.gov/) and proteinatlas.org for their contribution to share the
colon adenocarcinoma dataset on open access.
Funding
The present study was supported by the Innovation
Project of Guangxi Graduate Education (grant no. JGY2019052) and
Self-financing Scientific Research Project of Guangxi Zhuang
Autonomous Region Health Commission, China (grant no.
Z20180959).
Availability of data and materials
The analyzed datasets generated during the study
are available in The Cancer Genome Atlas repository (cancer.gov/tcga).
Authors' contributions
LY, MS and JG conceived and designed the study. XL,
XW, QH, YG, HX and GR processed the data and performed the
statistical analysis and they also generated and modified the
figures. LY, LZ, XZ and FG wrote and revised the manuscript and
helped to perform the analysis and interpretation of data. All
authors read and approved the final manuscript.
Ethics approval and consent to
participate
Not applicable.
Patient consent for publication
Not applicable.
Competing interests
The authors declare that they have no competing
interests.
References
|
1
|
Fessler E and Medema JP: Colorectal cancer
subtypes: Developmental origin and microenvironmental regulation.
Trends Cancer. 2:505–518. 2016. View Article : Google Scholar : PubMed/NCBI
|
|
2
|
Takayama T, Ohi M, Hayashi T, Miyanishi K,
Nobuoka A, Nakajima T, Satoh T, Takimoto R, Kato J, Sakamaki S and
Niitsu Y: Analysis of K-ras, APC, and beta-catenin in aberrant
crypt foci in sporadic adenoma, cancer, and familial adenomatous
polyposis. Gastroenterology. 121:599–611. 2001. View Article : Google Scholar : PubMed/NCBI
|
|
3
|
IJspeert JE, Vermeulen L, Meijer GA and
Dekker E: Serrated neoplasia-role in colorectal carcinogenesis and
clinical implications. Nat Rev Gastroenterol Hepatol. 12:401–409.
2015. View Article : Google Scholar : PubMed/NCBI
|
|
4
|
Bray F, Ferlay J, Soerjomataram I, Siegel
RL, Torre LA and Jemal A: Global cancer statistics 2018: GLOBOCAN
estimates of incidence and mortality worldwide for 36 cancers in
185 countries. CA Cancer J Clin. 68:394–424. 2018. View Article : Google Scholar : PubMed/NCBI
|
|
5
|
Labianca R, Beretta GD, Kildani B, Milesi
L, Merlin F, Mosconi S, Pessi MA, Prochilo T, Quadri A, Gatta G, et
al: Colon cancer. Crit Rev Oncol Hematol. 74:106–133. 2010.
View Article : Google Scholar : PubMed/NCBI
|
|
6
|
Fedirko V, Tramacere I, Bagnardi V, Rota
M, Scotti L, Islami F, Negri E, Straif K, Romieu I, La Vecchia C,
et al: Alcohol drinking and colorectal cancer risk: An overall and
dose-response meta-analysis of published studies. Ann Oncol.
22:1958–1972. 2011. View Article : Google Scholar : PubMed/NCBI
|
|
7
|
Campbell PT, Cotterchio M, Dicks E,
Parfrey P, Gallinger S and McLaughlin JR: Excess body weight and
colorectal cancer risk in Canada: Associations in subgroups of
clinically defined familial risk of cancer. Cancer Epidemiol
Biomarkers Prev. 16:1735–1744. 2007. View Article : Google Scholar : PubMed/NCBI
|
|
8
|
Kuipers EJ, Grady WM, Lieberman D,
Seufferlein T, Sung JJ, Boelens PG, van de Velde CJ and Watanabe T:
Colorectal cancer. Nat Rev Dis Primers. 1:150652015. View Article : Google Scholar : PubMed/NCBI
|
|
9
|
Darlison MG, Pahal I and Thode C:
Consequences of the evolution of the GABA(A) receptor gene family.
Cell Mol Neurobiol. 25:607–624. 2005. View Article : Google Scholar : PubMed/NCBI
|
|
10
|
Mele M, Ferreira PG, Reverter F, DeLuca
DS, Monlong J, Sammeth M, Young TR, Goldmann JM, Pervouchine DD,
Sullivan TJ, et al: Human genomics. The human transcriptome across
tissues and individuals. Science. 348:660–665. 2015. View Article : Google Scholar : PubMed/NCBI
|
|
11
|
Tian J, Lu Y, Zhang H, Chau CH, Dang HN
and Kaufman DL: Gamma-aminobutyric acid inhibits T cell
autoimmunity and the development of inflammatory responses in a
mouse type 1 diabetes model. J Immunol. 173:5298–5304. 2004.
View Article : Google Scholar : PubMed/NCBI
|
|
12
|
Macdonald RL and Olsen RW: GABAA receptor
channels. Annu Rev Neurosci. 17:569–602. 1994. View Article : Google Scholar : PubMed/NCBI
|
|
13
|
Neelands TR and Macdonald RL:
Incorporation of the pi subunit into functional gamma-aminobutyric
Acid(A) receptors. Mol Pharmacol. 56:598–610. 1999. View Article : Google Scholar : PubMed/NCBI
|
|
14
|
Gross AM, Kreisberg JF and Ideker T:
Analysis of matched tumor and normal profiles reveals common
transcriptional and epigenetic signals shared across cancer types.
PLoS One. 10:e01426182015. View Article : Google Scholar : PubMed/NCBI
|
|
15
|
Robinson MD, McCarthy DJ and Smyth GK:
EdgeR: A bioconductor package for differential expression analysis
of digital gene expression data. Bioinformatics. 26:139–140. 2010.
View Article : Google Scholar : PubMed/NCBI
|
|
16
|
Mounir M, Lucchetta M, Silva TC, Olsen C,
Bontempi G, Chen X, Noushmehr H, Colaprico A and Papaleo E: New
functionalities in the TCGAbiolinks package for the study and
integration of cancer data from GDC and GTEx. PLoS Comput Biol.
15:e10067012019. View Article : Google Scholar : PubMed/NCBI
|
|
17
|
Huang da W, Sherman BT and Lempicki RA:
Bioinformatics enrichment tools: Paths toward the comprehensive
functional analysis of large gene lists. Nucleic Acids Res.
37:1–13. 2009. View Article : Google Scholar : PubMed/NCBI
|
|
18
|
Huang da W, Sherman BT and Lempicki RA:
Systematic and integrative analysis of large gene lists using DAVID
bioinformatics resources. Nat Protoc. 4:44–57. 2009. View Article : Google Scholar : PubMed/NCBI
|
|
19
|
Maere S, Heymans K and Kuiper M: BiNGO: A
cytoscape plugin to assess overrepresentation of gene ontology
categories in biological networks. Bioinformatics. 21:3448–3449.
2005. View Article : Google Scholar : PubMed/NCBI
|
|
20
|
Warde-Farley D, Donaldson SL, Comes O,
Zuberi K, Badrawi R, Chao P, Franz M, Grouios C, Kazi F, Lopes CT,
et al: The GeneMANIA prediction server: Biological network
integration for gene prioritization and predicting gene function.
Nucleic Acids Res 38 (Web Server Issue). W214–W220. 2010.
View Article : Google Scholar
|
|
21
|
Montojo J, Zuberi K, Rodriguez H, Kazi F,
Wright G, Donaldson SL, Morris Q and Bader GD: GeneMANIA cytoscape
plugin: Fast gene function predictions on the desktop.
Bioinformatics. 26:2927–2928. 2010. View Article : Google Scholar : PubMed/NCBI
|
|
22
|
Szklarczyk D, Franceschini A, Wyder S,
Forslund K, Heller D, Huerta-Cepas J, Simonovic M, Roth A, Santos
A, Tsafou KP, et al: STRING v10: Protein-protein interaction
networks, integrated over the tree of life. Nucleic Acids Res 43
(Database Issue). D447–D452. 2015. View Article : Google Scholar
|
|
23
|
Shaul YD, Yuan B, Thiru P, Nutter-Upham A,
McCallum S, Lanzkron C, Bell GW and Sabatini DM: MERAV: A tool for
comparing gene expression across human tissues and cell types.
Nucleic Acids Res. 44(D1): D560–D566. 2016. View Article : Google Scholar : PubMed/NCBI
|
|
24
|
Tang Z, Li C, Kang B, Gao G, Li C and
Zhang Z: GEPIA: A web server for cancer and normal gene expression
profiling and interactive analyses. Nucleic Acids Res 45 (W1).
W98–W102. 2017. View Article : Google Scholar
|
|
25
|
Liao X, Han C, Wang X, et al: Prognostic
value of minichromosome maintenance mRNA expression in early-stage
pancreatic ductal adenocarcinoma patients after
pancreaticoduodenectomy. Cancer Manag Res. 10:3255–3271. 2018.
View Article : Google Scholar : PubMed/NCBI
|
|
26
|
Tu HP, Ko AM, Chiang SL, Lee SS, Lai HM,
Chung CM, Huang CM, Lee CH, Kuo TM, Hsieh MJ and Ko YC: Joint
effects of alcohol consumption and ABCG2 Q141K on chronic
tophaceous gout risk. J Rheumatol. 41:749–758. 2014. View Article : Google Scholar : PubMed/NCBI
|
|
27
|
Balachandran VP, Gonen M, Smith JJ and
DeMatteo RP: Nomograms in oncology: More than meets the eye. Lancet
Oncol. 16:e173–e180. 2015. View Article : Google Scholar : PubMed/NCBI
|
|
28
|
Subramanian A, Tamayo P, Mootha VK,
Mukherjee S, Ebert BL, Gillette MA, Paulovich A, Pomeroy SL, Golub
TR, Lander ES and Mesirov JP: Gene set enrichment analysis: A
knowledge-based approach for interpreting genome-wide expression
profiles. Proc Natl Acad Sci USA. 102:15545–15550. 2005. View Article : Google Scholar : PubMed/NCBI
|
|
29
|
Nayeem N, Green TP, Martin IL and Barnard
EA: Quaternary structure of the native GABAA receptor determined by
electron microscopic image analysis. J Neurochem. 62:815–818. 1994.
View Article : Google Scholar : PubMed/NCBI
|
|
30
|
Gumireddy K, Li A, Kossenkov AV, Sakurai
M, Yan J, Li Y, Xu H, Wang J, Zhang PJ, Zhang L, et al: The
mRNA-edited form of GABRA3 suppresses GABRA3-mediated Akt
activation and breast cancer metastasis. Nat Commun. 7:107152016.
View Article : Google Scholar : PubMed/NCBI
|
|
31
|
Bautista W, Perez-Alvarez V, Burczynski F,
Raouf A, Klonisch T and Minuk G: Membrane potential differences and
GABAA receptor expression in hepatic tumor and non-tumor stem
cells. Can J Physiol Pharmacol. 92:85–91. 2014. View Article : Google Scholar : PubMed/NCBI
|
|
32
|
Hackett CS, Quigley DA, Wong RA, Chen J,
Cheng C, Song YK, Wei JS, Pawlikowska L, Bao Y, Goldenberg DD, et
al: Expression quantitative trait loci and receptor pharmacology
implicate Arg1 and the GABA-A receptor as therapeutic targets in
neuroblastoma. Cell Rep. 9:1034–1046. 2014. View Article : Google Scholar : PubMed/NCBI
|
|
33
|
Chen ZA, Bao MY, Xu YF, Zha RP, Shi HB,
Chen TY and He XH: Suppression of Human liver cancer cell migration
and invasion via the GABAA receptor. Cancer Biol Med. 9:90–98.
2012.PubMed/NCBI
|
|
34
|
Minuk GY, Zhang M, Gong Y, Minuk L, Dienes
H, Pettigrew N, Kew M, Lipschitz J and Sun D: Decreased hepatocyte
membrane potential differences and GABAa-beta3 expression in human
hepatocellular carcinoma. Hepatology. 45:735–745. 2007. View Article : Google Scholar : PubMed/NCBI
|
|
35
|
Takehara A, Hosokawa M, Eguchi H, Ohigashi
H, Ishikawa O, Nakamura Y and Nakagawa H: Gamma-aminobutyric acid
(GABA) stimulates pancreatic cancer growth through overexpressing
GABAA receptor pi subunit. Cancer Res. 67:9704–9712. 2007.
View Article : Google Scholar : PubMed/NCBI
|
|
36
|
Zhang YA, Liu HN, Zhu JM, Zhang DY, Shen
XZ and Liu TT: RNA binding protein Nova1 promotes tumor growth in
vivo and its potential mechanism as an oncogene may due to its
interaction with GABAA Receptor-ү2. J Biomed Sci.
23:712016. View Article : Google Scholar : PubMed/NCBI
|
|
37
|
Okegawa T, Pong RC, Li Y and Hsieh JT: The
role of cell adhesion molecule in cancer progression and its
application in cancer therapy. Acta Biochim Pol. 51:445–457. 2004.
View Article : Google Scholar : PubMed/NCBI
|
|
38
|
Kawauchi T: Cell adhesion and its
endocytic regulation in cell migration during neural development
and cancer metastasis. Int J Mol Sci. 13:4564–4590. 2012.
View Article : Google Scholar : PubMed/NCBI
|
|
39
|
Desgrosellier JS and Cheresh DA: Integrins
in cancer: Biological implications and therapeutic opportunities.
Nat Rev Cancer. 10:9–22. 2010. View Article : Google Scholar : PubMed/NCBI
|
|
40
|
Mouw JK, Yui Y, Damiano L, Bainer RO,
Lakins JN, Acerbi I, Ou G, Wijekoon AC, Levental KR, Gilbert PM, et
al: Tissue mechanics modulate microRNA-dependent PTEN expression to
regulate malignant progression. Nat Med. 20:360–367. 2014.
View Article : Google Scholar : PubMed/NCBI
|
|
41
|
Kimura C, Hayashi M, Mizuno Y and Oike M:
Endothelium-dependent epithelial-mesenchymal transition of tumor
cells: Exclusive roles of transforming growth factor β1 and β2.
Biochim Biophys Acta. 1830:4470–4481. 2013. View Article : Google Scholar : PubMed/NCBI
|
|
42
|
Ghesquiere B, Wong BW, Kuchnio A and
Carmeliet P: Metabolism of stromal and immune cells in health and
disease. Nature. 511:167–176. 2014. View Article : Google Scholar : PubMed/NCBI
|
|
43
|
Lee E, Pandey NB and Popel AS: Crosstalk
between cancer cells and blood endothelial and lymphatic
endothelial cells in tumour and organ microenvironment. Expert Rev
Mol Med. 17:e32015. View Article : Google Scholar : PubMed/NCBI
|
|
44
|
Hanahan D and Weinberg RA: Hallmarks of
cancer: The next generation. Cell. 144:646–674. 2011. View Article : Google Scholar : PubMed/NCBI
|
|
45
|
Park SH, Kim BR, Lee JH, Park ST, Lee SH,
Dong SM and Rho SB: GABARBP down-regulates HIF-1α expression
through the VEGFR-2 and PI3K/mTOR/4E-BP1 pathways. Cell Signal.
26:1506–1513. 2014. View Article : Google Scholar : PubMed/NCBI
|
|
46
|
Ohsumi Y: Molecular dissection of
autophagy: Two ubiquitin-like systems. Nat Rev Mol Cell Biol.
2:211–216. 2001. View Article : Google Scholar : PubMed/NCBI
|
|
47
|
Mizushima N: The pleiotropic role of
autophagy: From protein metabolism to bactericide. Cell Death
Differ. 12 (Suppl 2):S1535–S1541. 2005. View Article : Google Scholar
|
|
48
|
Zhu JH, Horbinski C, Guo F, Watkins S,
Uchiyama Y and Chu CT: Regulation of autophagy by extracellular
signal-regulated protein kinases during
1-methyl-4-phenylpyridinium-induced cell death. Am J Pathol.
170:75–86. 2007. View Article : Google Scholar : PubMed/NCBI
|
|
49
|
Mizumoto S, Yamada S and Sugahara K:
Molecular interactions between chondroitin-dermatan sulfate and
growth factors/receptors/matrix proteins. Curr Opin Struct Biol.
34:35–42. 2015. View Article : Google Scholar : PubMed/NCBI
|
|
50
|
Willis CM and Kluppel M: Chondroitin
sulfate-E is a negative regulator of a pro-tumorigenic
Wnt/beta-catenin-Collagen 1 axis in breast cancer cells. PLoS One.
9:e1039662014. View Article : Google Scholar : PubMed/NCBI
|
|
51
|
Ludvigsson JF, Neovius M, Ye W and
Hammarstrom L: IgA deficiency and risk of cancer: A
population-based matched cohort study. J Clin Immunol. 35:182–188.
2015. View Article : Google Scholar : PubMed/NCBI
|
|
52
|
Malmberg KJ, Carlsten M, Bjorklund A,
Sohlberg E, Bryceson YT and Ljunggren HG: Natural killer
cell-mediated immunosurveillance of human cancer. Semin Immunol.
31:20–29. 2017. View Article : Google Scholar : PubMed/NCBI
|
|
53
|
Hannun YA and Obeid LM: Principles of
bioactive lipid signalling: Lessons from sphingolipids. Nat Rev Mol
Cell Biol. 9:139–150. 2008. View Article : Google Scholar : PubMed/NCBI
|
|
54
|
Ogretmen B: Sphingolipid metabolism in
cancer signalling and therapy. Nat Rev Cancer. 18:33–50. 2018.
View Article : Google Scholar : PubMed/NCBI
|
|
55
|
Sarathi A and Palaniappan A: Novel
significant stage-specific differentially expressed genes in
hepatocellular carcinoma. BMC Cancer. 19:6632019. View Article : Google Scholar : PubMed/NCBI
|
|
56
|
Zafrakas M, Chorovicer M, Klaman I,
Kristiansen G, Wild PJ, Heindrichs U, Knüchel R and Dahl E:
Systematic characterisation of GABRP expression in sporadic breast
cancer and normal breast tissue. Int J Cancer. 118:1453–1459. 2006.
View Article : Google Scholar : PubMed/NCBI
|
|
57
|
Symmans WF, Fiterman DJ, Anderson SK,
Ayers M, Rouzier R, Dunmire V, Stec J, Valero V, Sneige N,
Albarracin C, et al: A single-gene biomarker identifies breast
cancers associated with immature cell type and short duration of
prior breastfeeding. Endocr Relat Cancer. 12:1059–1069. 2005.
View Article : Google Scholar : PubMed/NCBI
|
|
58
|
Sung HY, Yang SD, Ju W and Ahn JH:
Aberrant epigenetic regulation of GABRP associates with aggressive
phenotype of ovarian cancer. Exp Mol Med. 49:e3352017. View Article : Google Scholar : PubMed/NCBI
|
|
59
|
Jiang SH, Zhu LL, Zhang M, Li RK, Yang Q,
Yan JY, Zhang C, Yang JY, Dong FY, Dai M, et al: GABRP regulates
chemokine signalling, macrophage recruitment and tumour progression
in pancreatic cancer through tuning KCNN4-mediated Ca2+
signalling in a GABA-independent manner. Gut. 68:1994–2006. 2019.
View Article : Google Scholar : PubMed/NCBI
|
|
60
|
Li YH, Liu Y, Li YD, Liu YH, Li F, Ju Q,
Xie PL and Li GCl: GABA stimulates human hepatocellular carcinoma
growth through overexpressed GABAA receptor theta subunit. World J
Gastroenterol. 18:2704–2711. 2012. View Article : Google Scholar : PubMed/NCBI
|
|
61
|
Engelman JA: Targeting PI3K signalling in
cancer: Opportunities, challenges and limitations. Nat Rev Cancer.
9:550–562. 2009. View Article : Google Scholar : PubMed/NCBI
|
|
62
|
Yu H, Lee H, Herrmann A, Buettner R and
Jove R: Revisiting STAT3 signalling in cancer: New and unexpected
biological functions. Nat Rev Cancer. 14:736–746. 2014. View Article : Google Scholar : PubMed/NCBI
|