Introduction
Breast cancer is a global problem that primarily
threatens the health of women, but can also affect men. In 2011, a
study based on patients with breast cancer in Denmark, Finland,
Geneva, Norway, Singapore and Sweden over the past 40 years
reported that world standardized incidence rates of female breast
cancer were 66.7 per 105 individuals per year and those
of male breast cancer were 0.40 per 105 individuals per
year (1). Epidemiological studies
have demonstrated that breast cancer is closely associated with
social factors, particularly quality of healthcare and ethnicity
(2,3). In the United States, the mortality rate
of non-Hispanic black women with breast cancer was 8.8% higher
compared with that of non-Hispanic white women with breast cancer
between 2010 and 2014 (4). The
incidence rates of breast cancer have increased from about 100 per
105 women in 1975 to about 125 per 105 women
in 2015 (5). As the breast is not an
essential organ, cancer in situ does not usually lead
directly to death. With invasive breast carcinoma (BRCA), some of
the tumorigenic cells are in a poorly differentiated state and lose
proper regulation ability. These cells can leave the lesion and
spread with the blood to other tissues or lymph nodes and develop
into new tumors, leading to organ dysfunction and patient
death.
Alternative splicing (AS) is a tumorigenesis
mechanism that has been studied in a number of tumors and is widely
accepted as explaining the aforementioned phenomenon. Through AS,
an mRNA precursor can produce a number of mRNA splicing isoforms,
which generates protein diversity (6). Proteins created by AS exhibit a number
of molecular properties and interactions that have a significant
role in both normal and abnormal life activities (7,8).
The role of AS in BRCA has recently been
investigated, with studies analyzing certain AS events in breast
cancer; these studies have demonstrated the potential for specific
AS events to classify and diagnose cancer (9,10). Tien
et al (11) demonstrated that
the mutation of cyclin-dependent kinase 12, which disrupts DNA
repair, affected a DNAJB6 isoform and the DNA damage
response activator by regulating last-exon splicing; thereby
causing tumorigenesis and invasion. The complexes of transactive
response DNA binding protein 43 (TDP43) and serine/arginine-rich
splicing factor 3 (SRSF3) can modulate the AS events of
protease-activated receptor 3 (PAR3) and endocytic adaptor protein,
which suggests that TDP43 or SRSF3 knockdown inhibits tumor
progression, and the higher expression level of TDP43 in
triple-negative breast cancer may suggest a poor patient prognosis
(12).
As previous studies have demonstrated the potential
of AS events as molecular markers and therapeutic targets (13,14), the
investigation of full transcriptome AS events and survival-related
alternative splicing events (SREs) in BRCA should be a priority in
research. The aim of the present study was to reveal new features
of BRCA by integrating and comparing AS events at the full
transcriptome level and to validate their clinical values using a
number of models.
Materials and methods
Acquisition of data on alternative
splicing events
The Cancer Genome Atlas (TCGA), which comprises
high-throughput sequencing data and clinical information on 33
types of tumor, including BRCA, was used in the present study
(www.cancer.gov/tcga). TCGA SpliceSeq
database calculates the percent-spliced-in (PSI) value for all AS
events in each tumor, which can then be used for AS analyses
(15). The PSI value is a ratio that
presents the efficiency of splicing exons into transcripts
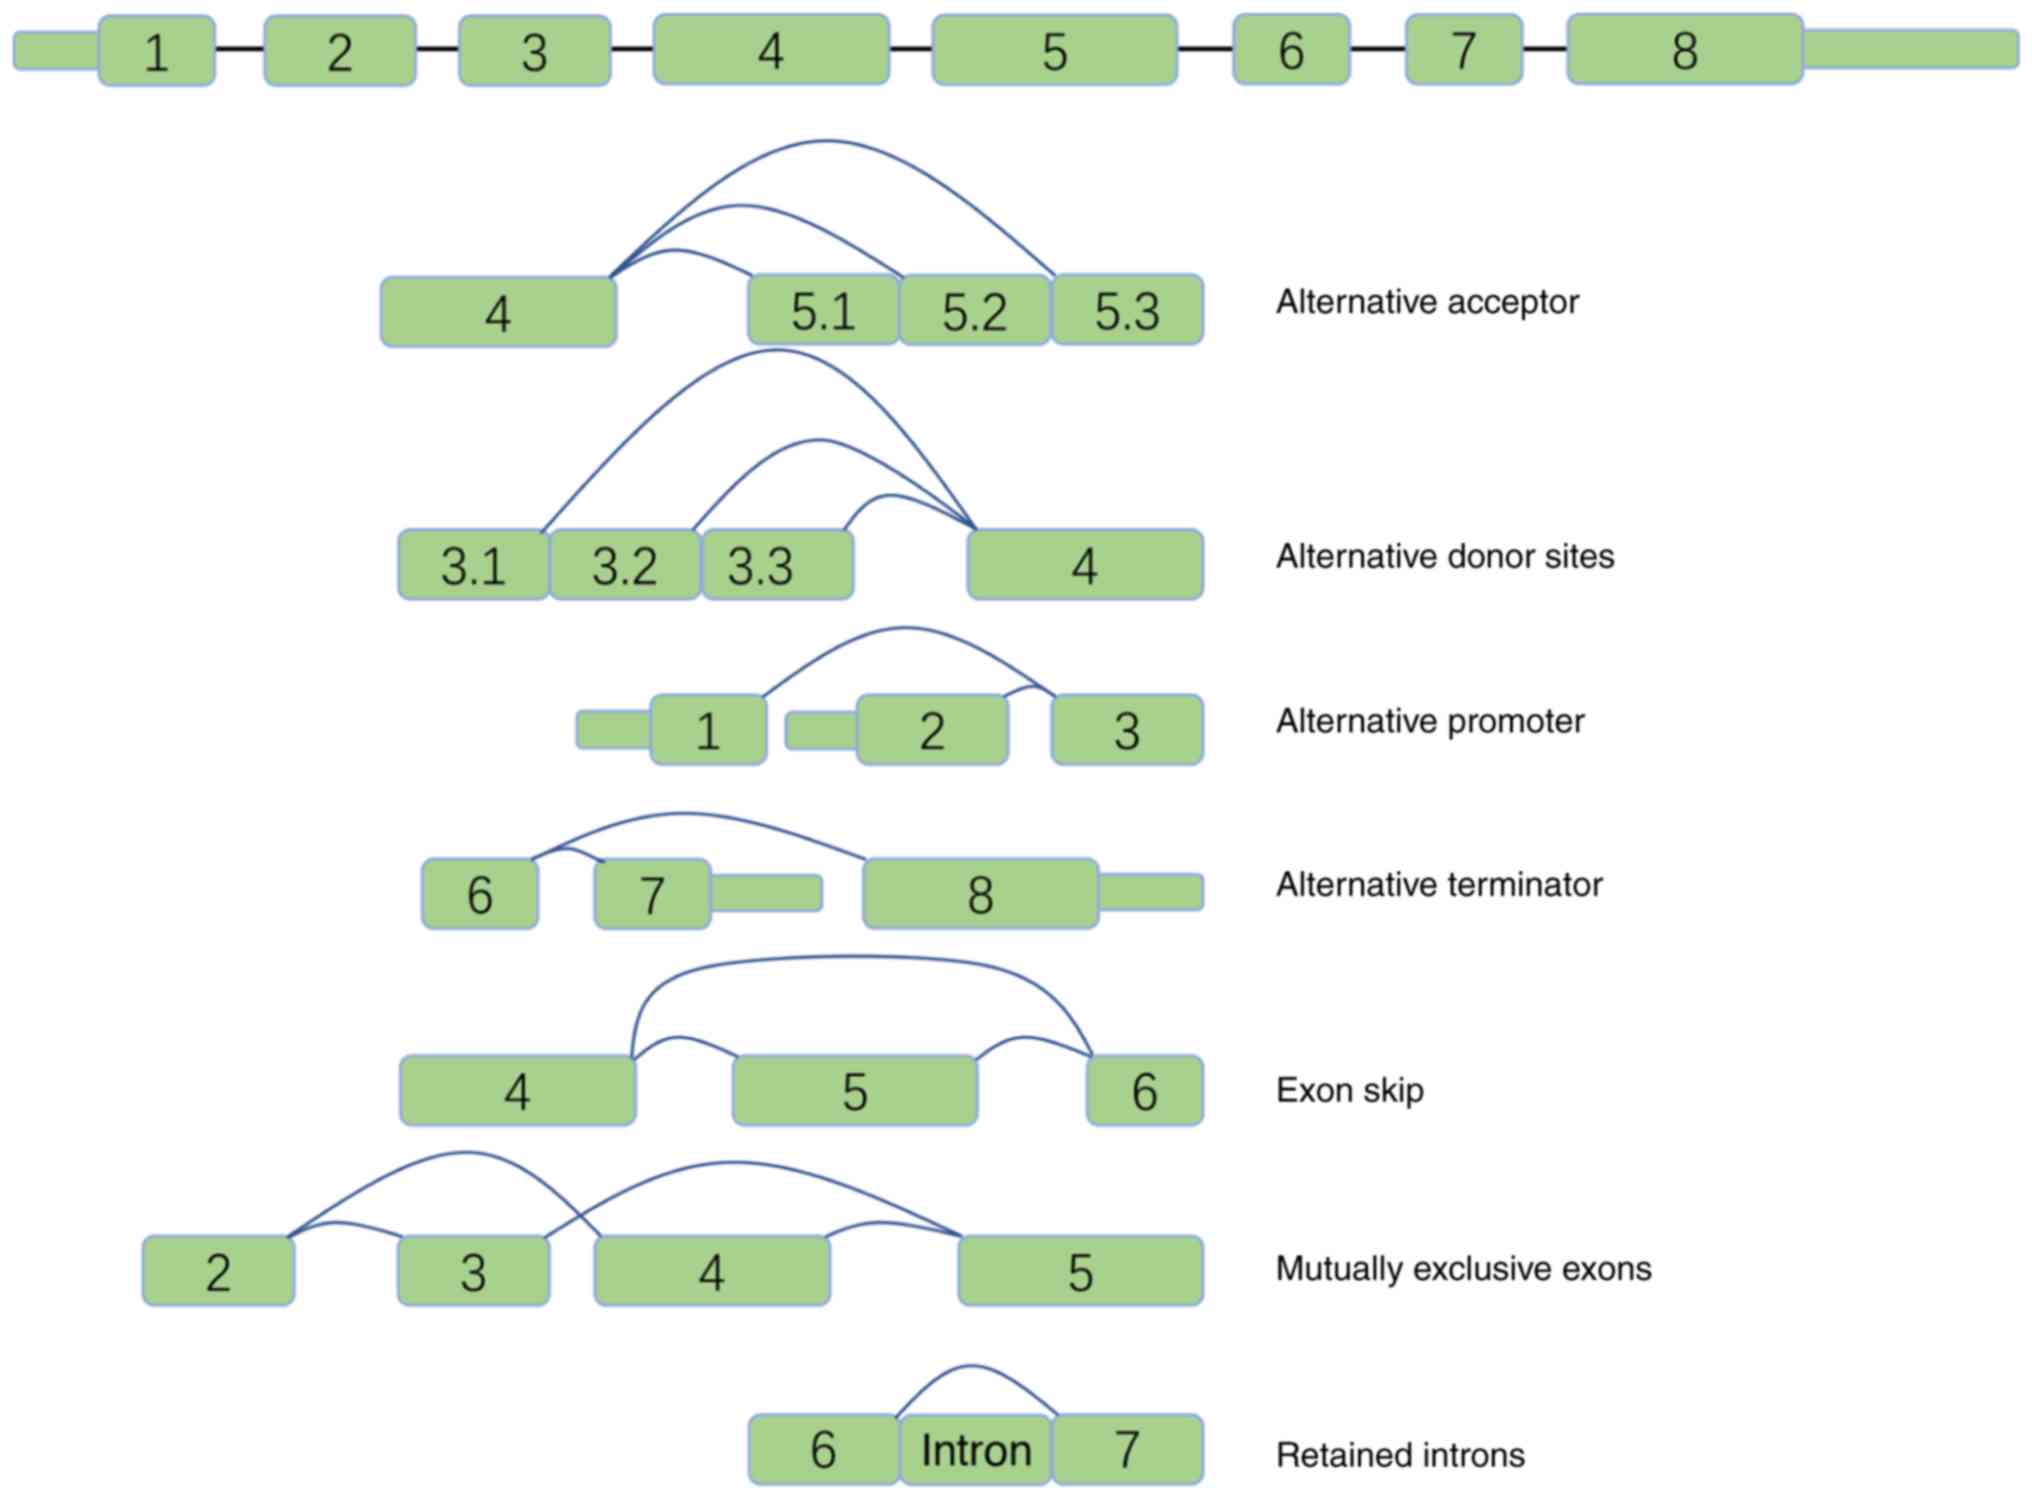
(splicing isoforms). As presented in Fig. 1, AS events were further divided into
seven types: Alternative promoter (AP), alternative donor site
(AD), alternative terminator (AT), exon skipping (ES), mutually
exclusive exons (ME), alternative acceptor site (AA) and retained
intron (RI). The PSI values for the AS events in 1,207 tissue
samples were downloaded from TCGA SpliceSeq comprising 1,094
samples from cancerous tissues and 113 samples from healthy
tissues. As some volunteers donated both cancerous and healthy
tissues, the present study contains 1,097 sets of clinical data,
which means that each sample has the corresponding clinical
information.
Identification of SREs
Some of the 1,094 cancerous tissue samples were
removed by integrating clinical information to make the results
more objective. Although males can also have breast cancer, the
present study considered the large differences in sex hormones
between men and women and selected 1,081 samples from only female
patients. This slightly reduces the clinical significance; however,
it notably avoids the bias caused by biological differences
(16). From the 1,081 female
samples, 1,019 patients with an overall survival (OS) from 31 days
to >13 years were selected for univariate survival analysis. The
R package survival (version 3.1–11) was used to conduct univariate
survival analysis, which calculated the relationship between each
AS event and OS. This step is performed in RStudio software
(version 1.1.442) (17) using R
language (v3.5.1) (18). OS is the
time from the start of the random assignment to death. For patients
who were lost to follow-up or survived until the end of the study,
OS was considered to be the time from the start of the random
assignment to the date of the last follow-up. Cox's proportional
hazards regression analysis quantitatively demonstrated the
association between the PSI values and OS using the following four
key values: Hazard ratio (HR), coefficient (coef) value and maximum
and minimum values for 95% confidence intervals. Generally, in
cancer studies, a factor is considered to have a bad effect on a
prognosis if its HR >1. The coef value is associated with the
direction and extent of the event and its influence on the outcome.
Specifically, when an event decreases OS, the corresponding coef
value is positive. Conversely, when an event increases OS, the
corresponding coef value is negative. The stronger the influence of
the event on the outcome, the greater the absolute coef value. The
smaller P-value is, the more the reliable the result. Therefore,
when the number of SREs of an AS type was >10, the present study
chosen 10 SREs with the smallest P-value were used to calculate the
weighted PSI value. As an aberrant biological process is caused by
several AS events, the weighted PSI value of each AS type is
theoretically more biologically significant compared with the PSI
value of a single AS event. The weighted PSI value of AA is the sum
of the PSI values of the top 10 survival-associated AS events
multiplied by the corresponding coef values. In addition, the PSI
values were calculated for the top 10 most significant AS events in
all SREs and the weighted PSI value that was obtained was
considered to represent all AS events. Samples were divided into
two groups according to these weighted PSI values. The Kaplan-Meier
estimator and the log-rank test were used to determine whether
there was a significant difference in survival rates between the
two groups. These calculations were performed by R packages:
Survival (version 3.1–11) and survminer (version 0.4.6) and the
result of P<0.05 has statistical significance.
Distribution of AS events and the
UpSet plot
For its greater efficiency, an UpSet plot, rather
than a Venn plot, was used to display the intersections among
multiple datasets. Using this plot, the present study could sort
the data by gene frequency or by the number of AS types contained
within the set to more clearly represent distribution features.
Survival-related genes (SRGs) were those involved in SREs. The
UpSet plot was used to visualize the distribution of AS
event-related genes and SRGs within the different AS types. The
plot was created using R package: UpSetR (v1.4.0) (19).
Protein-protein interaction (PPI)
network and enrichment analysis
In order to identify the genes at the core of the
pathological process and determine how they regulate each other,
the present study submitted SRGs to the Search Tool for the
Retrieval of Interacting Genes/Proteins (www.string-db.org/). The PPI network was constructed
using a threshold of 0.4 to avoid missing key genes. The degree of
connectivity was used to describe the association between nodes. A
node with a high degree of connectivity may have a wide impact on
other nodes and was considered a hub gene. Gene Ontology (GO),
Kyoto Encylcopedia of Genes and Genomes (KEGG), and Reactome
contain a large number of canonical descriptions of genes and
pathways that can be used to study the functions and pathways with
which target genes may be involved (20,21). The
present study used ClueGO (v2.5.6) (22), a plugin for Cytoscape (v3.7.2)
(23), to annotate the physiological
functions of SRGs.
Diagnostic test and 5-year survival
model
Diagnostics were conducted to test the ability of
the weighted PSI values to distinguish between cancerous and
healthy tissues. A receiver operating characteristic (ROC) curve
was plotted to determine whether the weighted PSI values from the
top 10 SREs with the most prognostic significance and those for
each AS type could be used to predict a prognosis. A total of two
models in the present study consisted of some weighted PSI values,
although it was unclear whether these values could be used as
indicators for distinguishing the different groups; however, the
area-under-curve (AUC) value could be used as an indicator.
Therefore, the ROC curves were used to present the value of the
indicators for distinguishing between cancerous and healthy tissues
in the present study, and to assess the ability to predict whether
patient OS could be >5 years. The distinction between the two
models was that one reflected the impact of AS events on initiation
of the disease, while the other was associated with its
progression. After performing the diagnostic tests, a 5-year
survival model was created using SPSS v19.0 (IBM Corp.).
SFs and regulation network
SFs comprise numerous types of proteins, such as
serine/arginine-rich (SR) protein, which contains a protein domain
with long repeats of serine and arginine amino acid residues
(24). SpliceAid 2 (www.introni.it/spliceaid.html) is a
database of SFs in cancerous and healthy tissues (25); 71 SFs that were identified in BRCA
and their corresponding genes were obtained from this database.
TCGA provided the third-level transcriptome data for these BRCA
genes. In order to exclude interferences, such as gene length,
sequencing amount and sample specificity, the original read counts
were normalized to increase reliability. SR SFs were identified
using Cox's proportional hazards regression model. If the Pearson
correlation coefficient >0.4, the corresponding SF was
positively correlated with AS events. The regulatory network was
visualized using Cytoscape (v3.7.2) (21).
Results
Characteristics of AS in invasive
breast carcinoma
The present study identified 45,421 AS events in
BRCA, which were associated with 10,480 genes (Fig. 2A). ES had the most AS events
(17,702). A total of 233 AS events was found in ME, notably fewer
compared with other AS types. ES had the largest number of
associated genes (6,811). The number of genes associated with ME
was 227, which was smaller than that of any other AS type. Some
genes were found in only one type of AS event in BRCA, while others
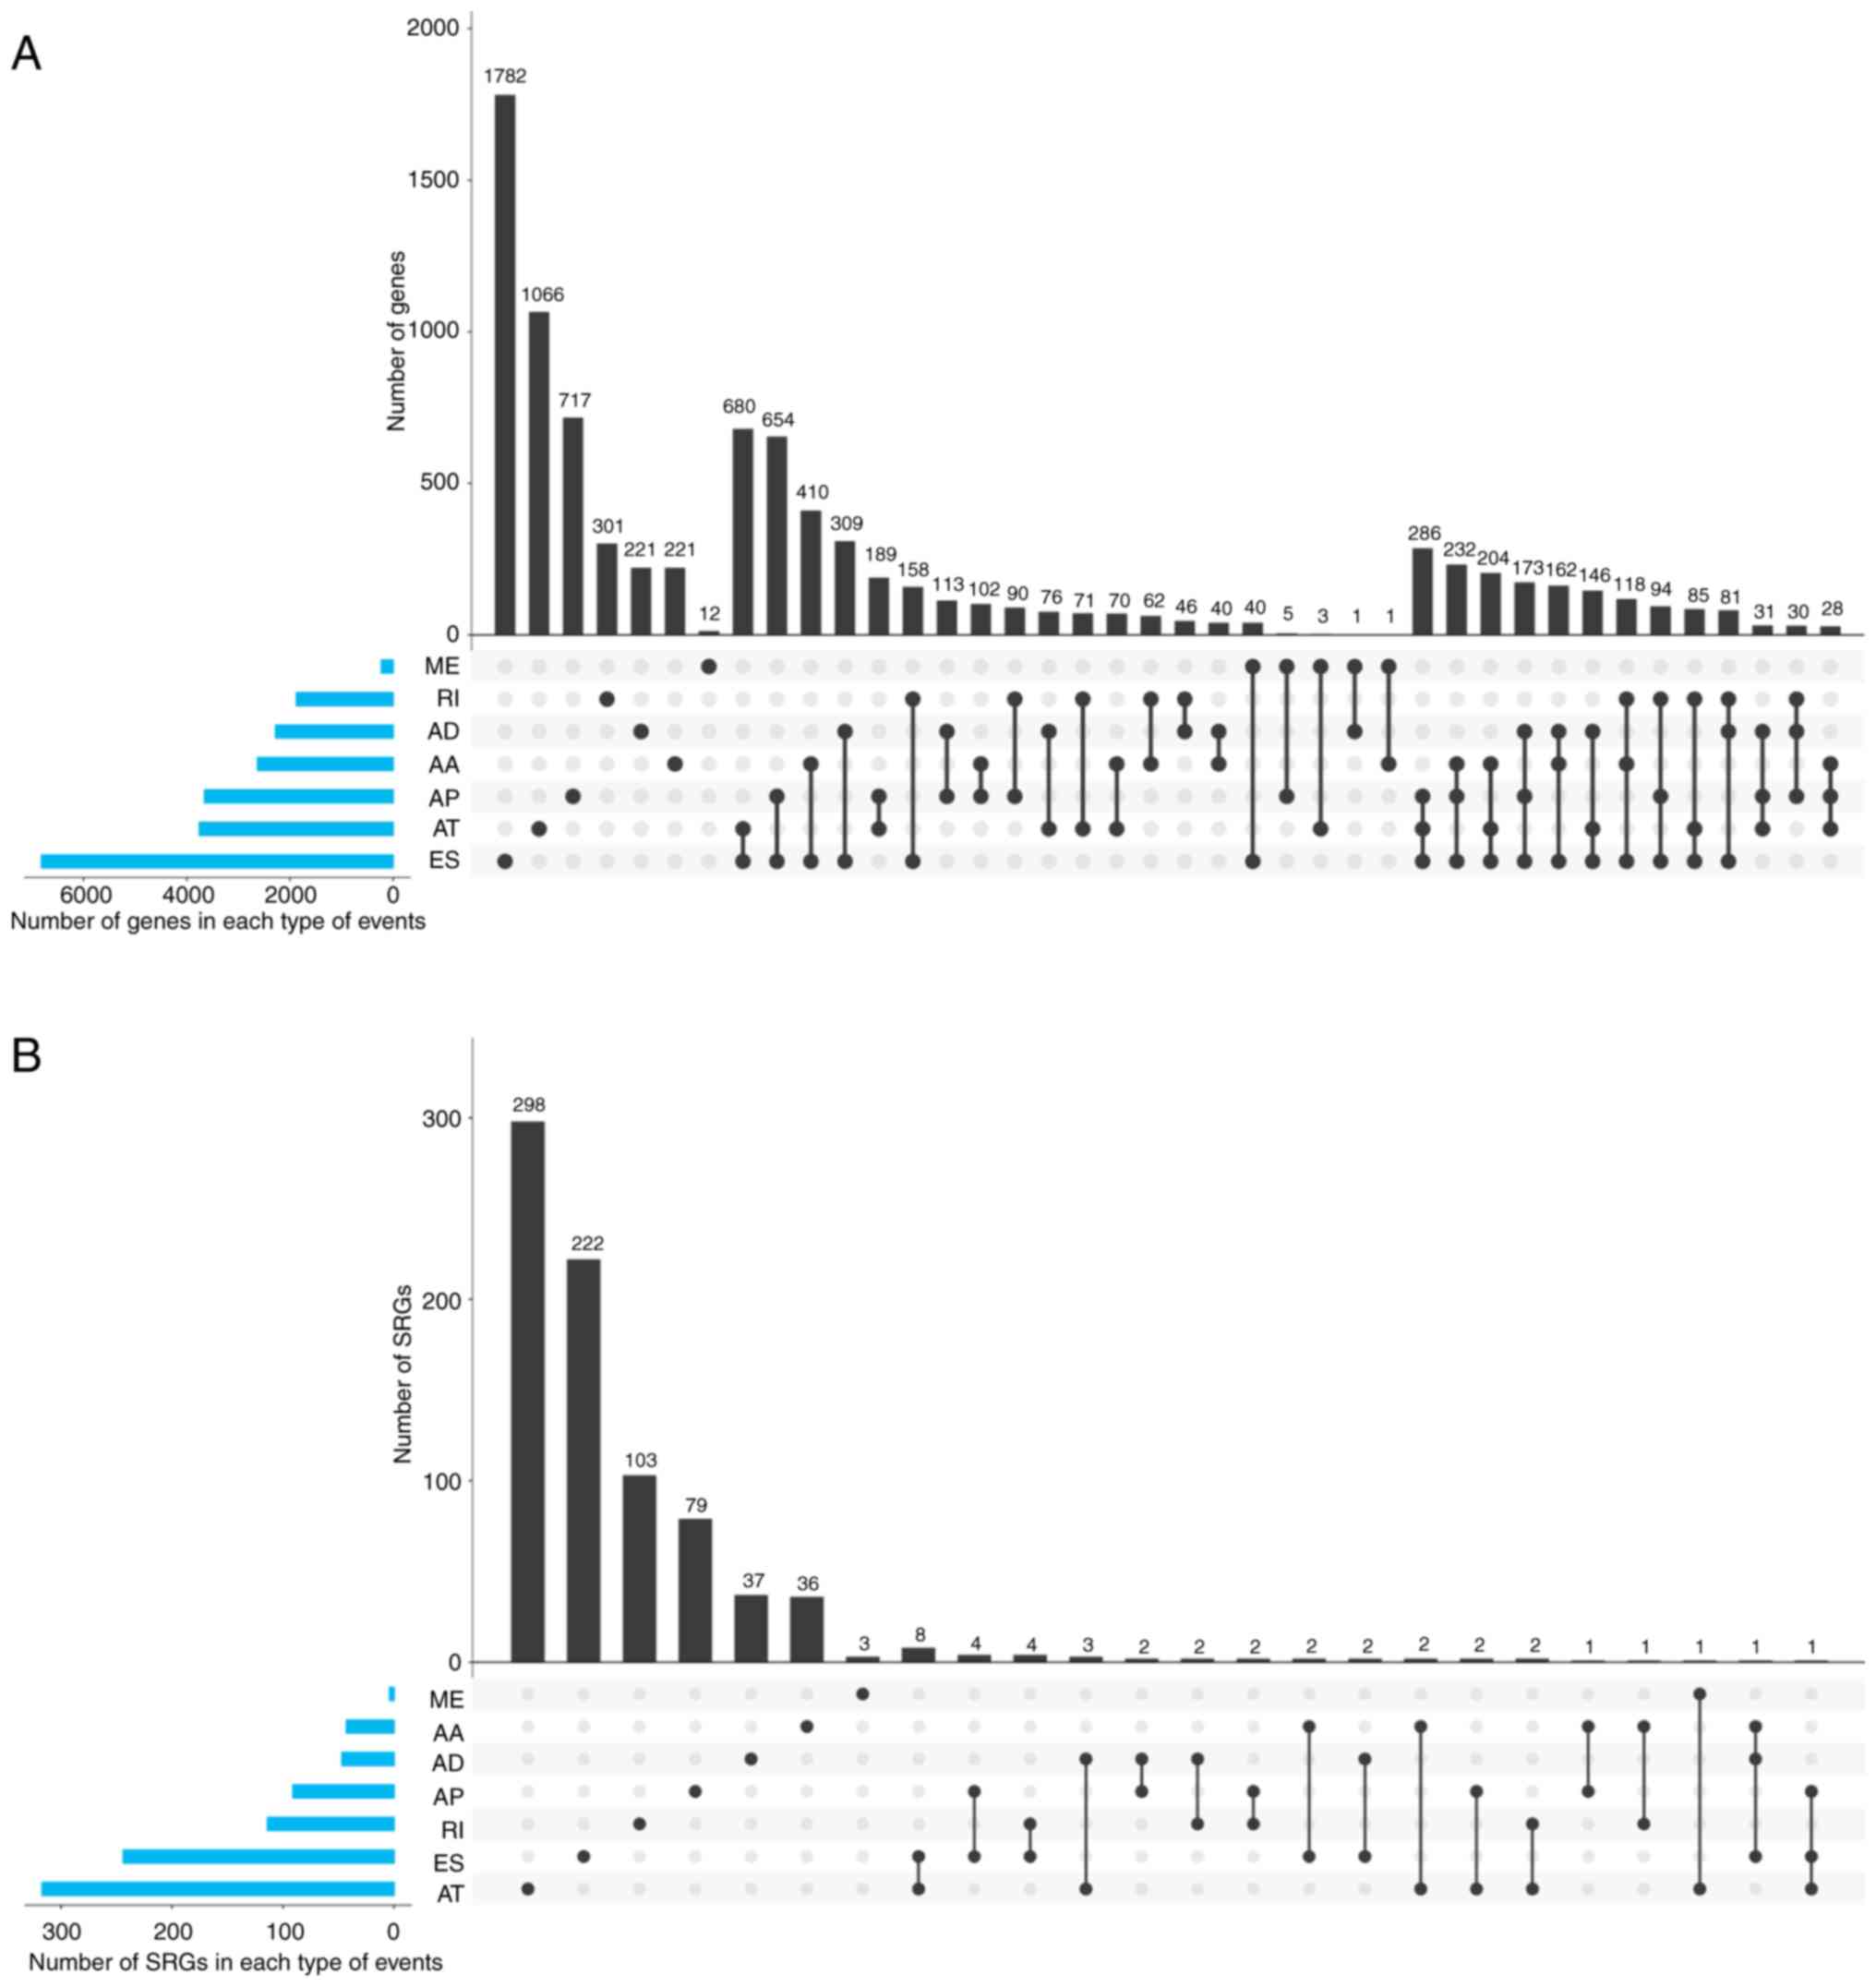
were demonstrated to be involved in several types (Fig. 3A). The largest group of genes (1,782)
was contained in only the ES type, which accounted for 26.1% of the
associated ES genes. The proportion of genes only associated with
one AS type were 8.4, 9.7, 19.6, 28.3, 5.2 and 16.0% in AA, AD, AP,
AT, ME and RI, respectively, which indicated that only a few genes
were involved in only one type of AS. Therefore, the majority of
event-associated genes were involved in more than one type of AS
event. The group consisting of AT and ES contained most genes (680)
compared with other groups with only two AS types. The group
consisting of AP, AT and ES was the largest group (286 genes) among
the groups that contained three types of AS events.
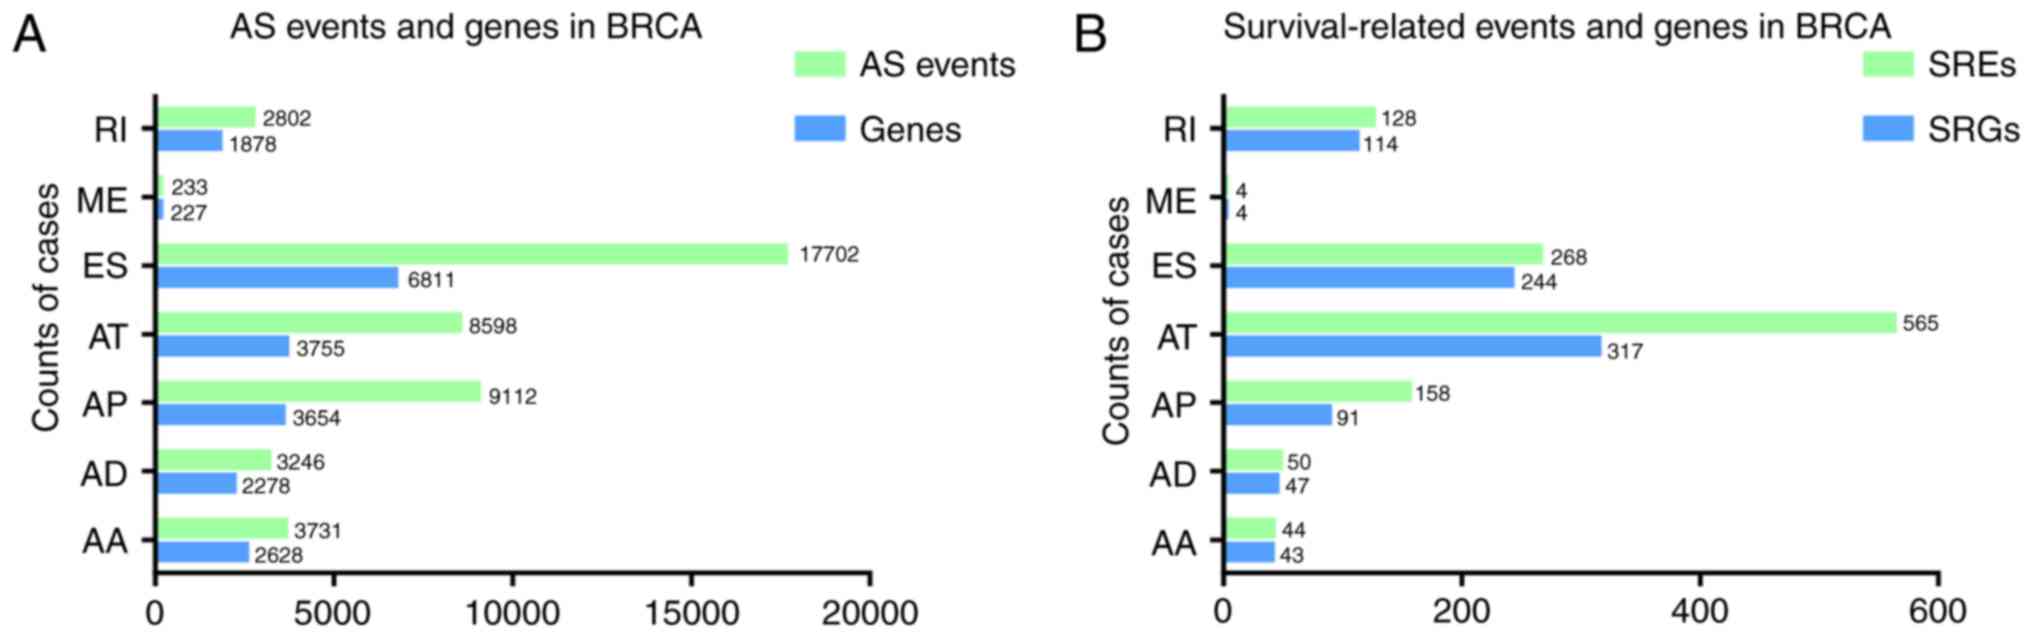 | Figure 2.Distribution of SREs and related
genes in invasive breast carcinoma. The y-axis is AS type. The
x-axis is the number of cases. (A) Green strips represent the
number of AS events. Blue strips represent the number of AS
event-associated genes. (B) Green strips represent the number of
SREs. Blue strips represent the number of SRGs. AS, alternative
splicing; SRE, survival-related alternative splicing event; SRG,
survival-related gene; BRCA, breast carcinoma; RI, retained intron;
ME, mutually exclusive exons; ES, exon skipping; AT, alternative
terminator; AP, alternative promoter; AD, alternative donor site;
AA, alternative acceptor site. |
SREs and SRGs identified using
survival analysis
A series of SREs and SRGs identified using Cox's
proportional hazards regression model (P<0.05) were
investigated; the results of the survival analyses are presented in
Table SI. In general, 1,215 events
in 818 genes appeared to have potential links to OS. Although there
were 17,702 AS events in ES, only 268 were associated with a
prognosis. The AS type with the largest number of events and genes
was not ES, but AT. Fig. 2B presents
the number of SREs and SRGs in each type of AS.
The largest percentage of SRGs (778; 95.1%) was
associated with only one type of AS event. The different
distributions of AS event-associated genes and SRGs indicated that
mRNA produced by SRGs appeared to be more specific. The group that
included genes from only AT contained 298 SRGs and represented the
group with the most genes. The intersections of the seven AS types
are presented in Fig. 3.
Prognostic models based on the
weighted PSI value of AS types
The PSI values of the 10 most significant splicing
events in each AS type were weighted to obtain a weighted PSI value
for each type. As ME had only four SREs, its weighted PSI value was
calculated using only these four events (Table I). P-value was <0.01 for all
items, which indicated that the weighted calculation method was
reliable. In the present study, AP and ME had higher hazard ratios
(HRs) than the other AS types, which suggested that the AS events
contained in AP and ME may increase both the risk of disease and a
poor prognosis. All coef values for AA, AD, AT, ES, RI and the 10
most significant splicing events were negative, which indicated
that their effects on prognosis were positive. Kaplan-Meier
survival curves were plotted to display the differences in survival
rate over time (Fig. 4). The ends of
the curves for AA, AP and AT were very close and may have been
affected by other factors, such as age (Fig. 4A, C and D). In addition, the weighted
PSI values based on the 10 AS events in each AS type (a total of 70
events) were also calculated. The corresponding survival curve is
presented in Fig. S1, which shows
trends similar to those in Fig. 4G
and indicates that the weighted PSI value was a good measure for
distinguishing between groups with a longer and shorter OS.
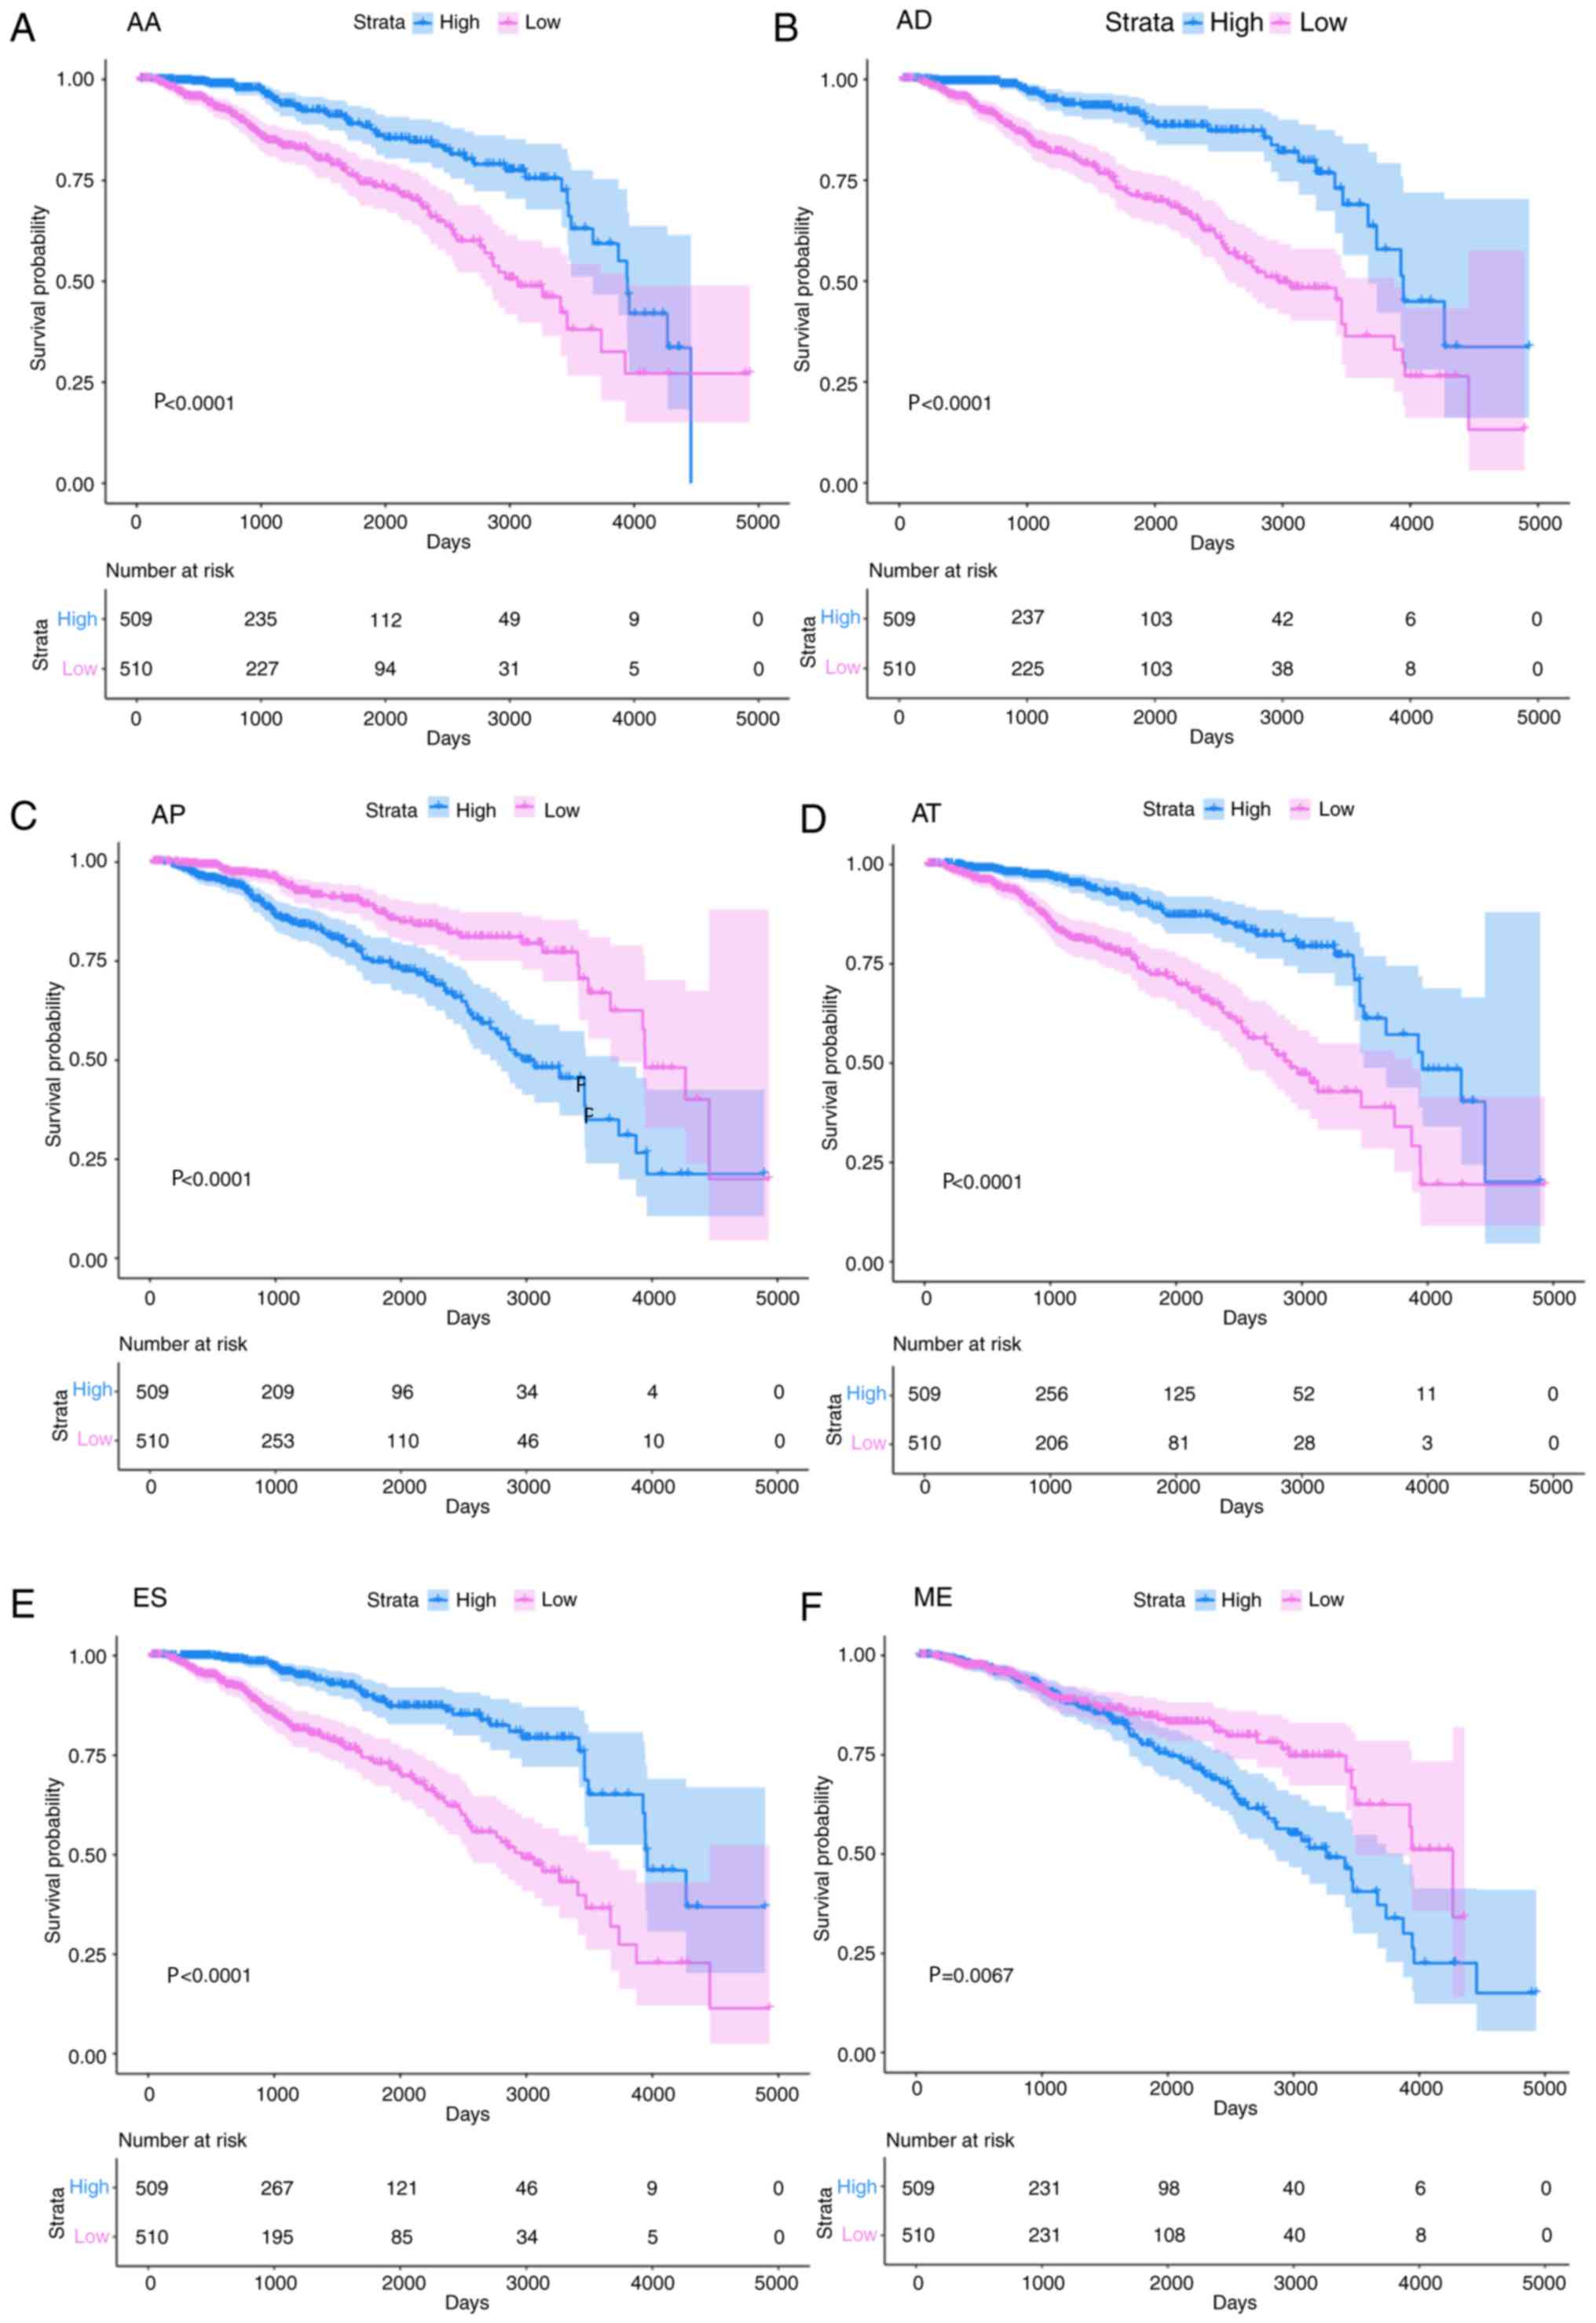 | Figure 4.Survival curve for the weighted
percent-spliced-in value. Red and blue lines represent changes in
survival probability in days in the group with lower and higher
values, respectively. Red and blue areas represent the 95%
confidence interval. The number of individuals in a group who
remain alive at a certain point in time is the number at risk,
which was exhibited in the lower part of each plot. (A) The AA
type, (B) AD type, (C) AP type, (D) AT type, (E) ES type and (F) ME
type. (G) RI type, (H) based on the 10 most significant SREs. (I)
Third-level transcriptome data for ELAVL4. AA, alternative
acceptor; AD, alternative donor; AP, alternative promoter; AT,
alternative promoter; ES, exon skipping; ME, mutually exclusive
exon; RI, retained intron; SRE, alternative splicing event. |
 | Table I.Information of survival analysis
based on the weighted PSI value. |
Table I.
Information of survival analysis
based on the weighted PSI value.
| AS type | HR | Coef | 95% CI lower | 95% CI upper | P-value |
|---|
| AA | 0.487 | −0.720 | −0.916 | −0.523 | <0.001 |
| AD | 0.443 | −0.815 | −0.998 | −0.632 | <0.001 |
| AP | 1.511 | 0.413 | 0.292 | 0.533 | <0.001 |
| AT | 0.697 | −0.361 | −0.449 | −0.273 | <0.001 |
| ES | 0.564 | −0.572 | −0.685 | −0.459 | <0.001 |
| ME | 2.079 | 0.732 | 0.347 | 1.116 | <0.001 |
| RI | 0.701 | −0.356 | −0.482 | −0.230 | <0.001 |
| TOP10 | 0.682 | −0.382 | −0.475 | −0.290 | <0.001 |
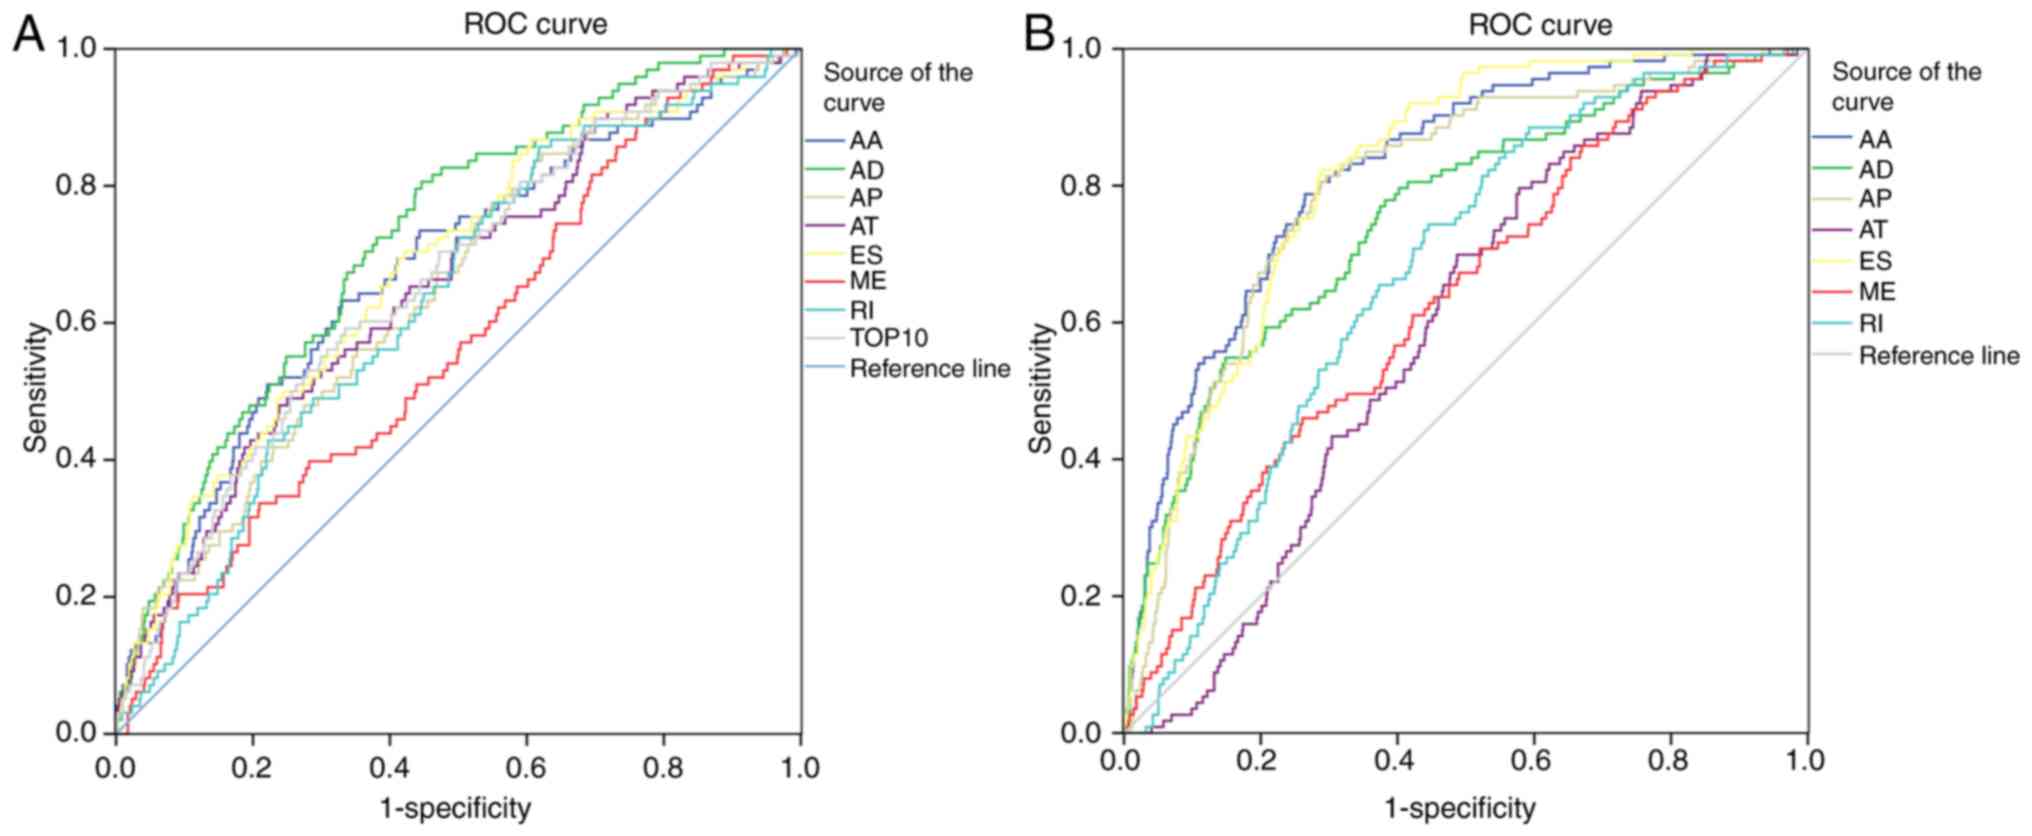
Fig. 5A presents the
ROC curves that tested the ability of the weighted PSI value to
determine the patients' 5-year OS rate; the quantitative results
are presented in Table II. AD
(AUC=0.723) was considered to be the best indicator of a prognostic
model; AUC of all other values were <0.7.
| Table II.Information of ROC curve on
predicting 5-year survival. |
Table II.
Information of ROC curve on
predicting 5-year survival.
| AS type | Cut-off | Sensitivity | Specificity | AUC | 95% CI lower | 95% CI upper | P-value |
|---|
| AA | −76.343 | 0.633 | 0.670 | 0.675 | 0.616 | 0.733 | <0.001 |
| AD | −16.144 | 0.806 | 0.554 | 0.723 | 0.672 | 0.773 | <0.001 |
| AP | 12.169 | 0.776 | 0.452 | 0.648 | 0.591 | 0.705 | <0.001 |
| AT | −0.797 | 0.480 | 0.762 | 0.655 | 0.598 | 0.713 | <0.001 |
| ES | −504.463 | 0.704 | 0.578 | 0.680 | 0.623 | 0.736 | <0.001 |
| ME | 68.350 | 0.888 | 0.240 | 0.575 | 0.516 | 0.634 | 0.016 |
| RI | −249.080 | 0.857 | 0.382 | 0.632 | 0.576 | 0.687 | <0.001 |
| TOP10 | −332.922 | 0.592 | 0.666 | 0.660 | 0.603 | 0.716 | <0.001 |
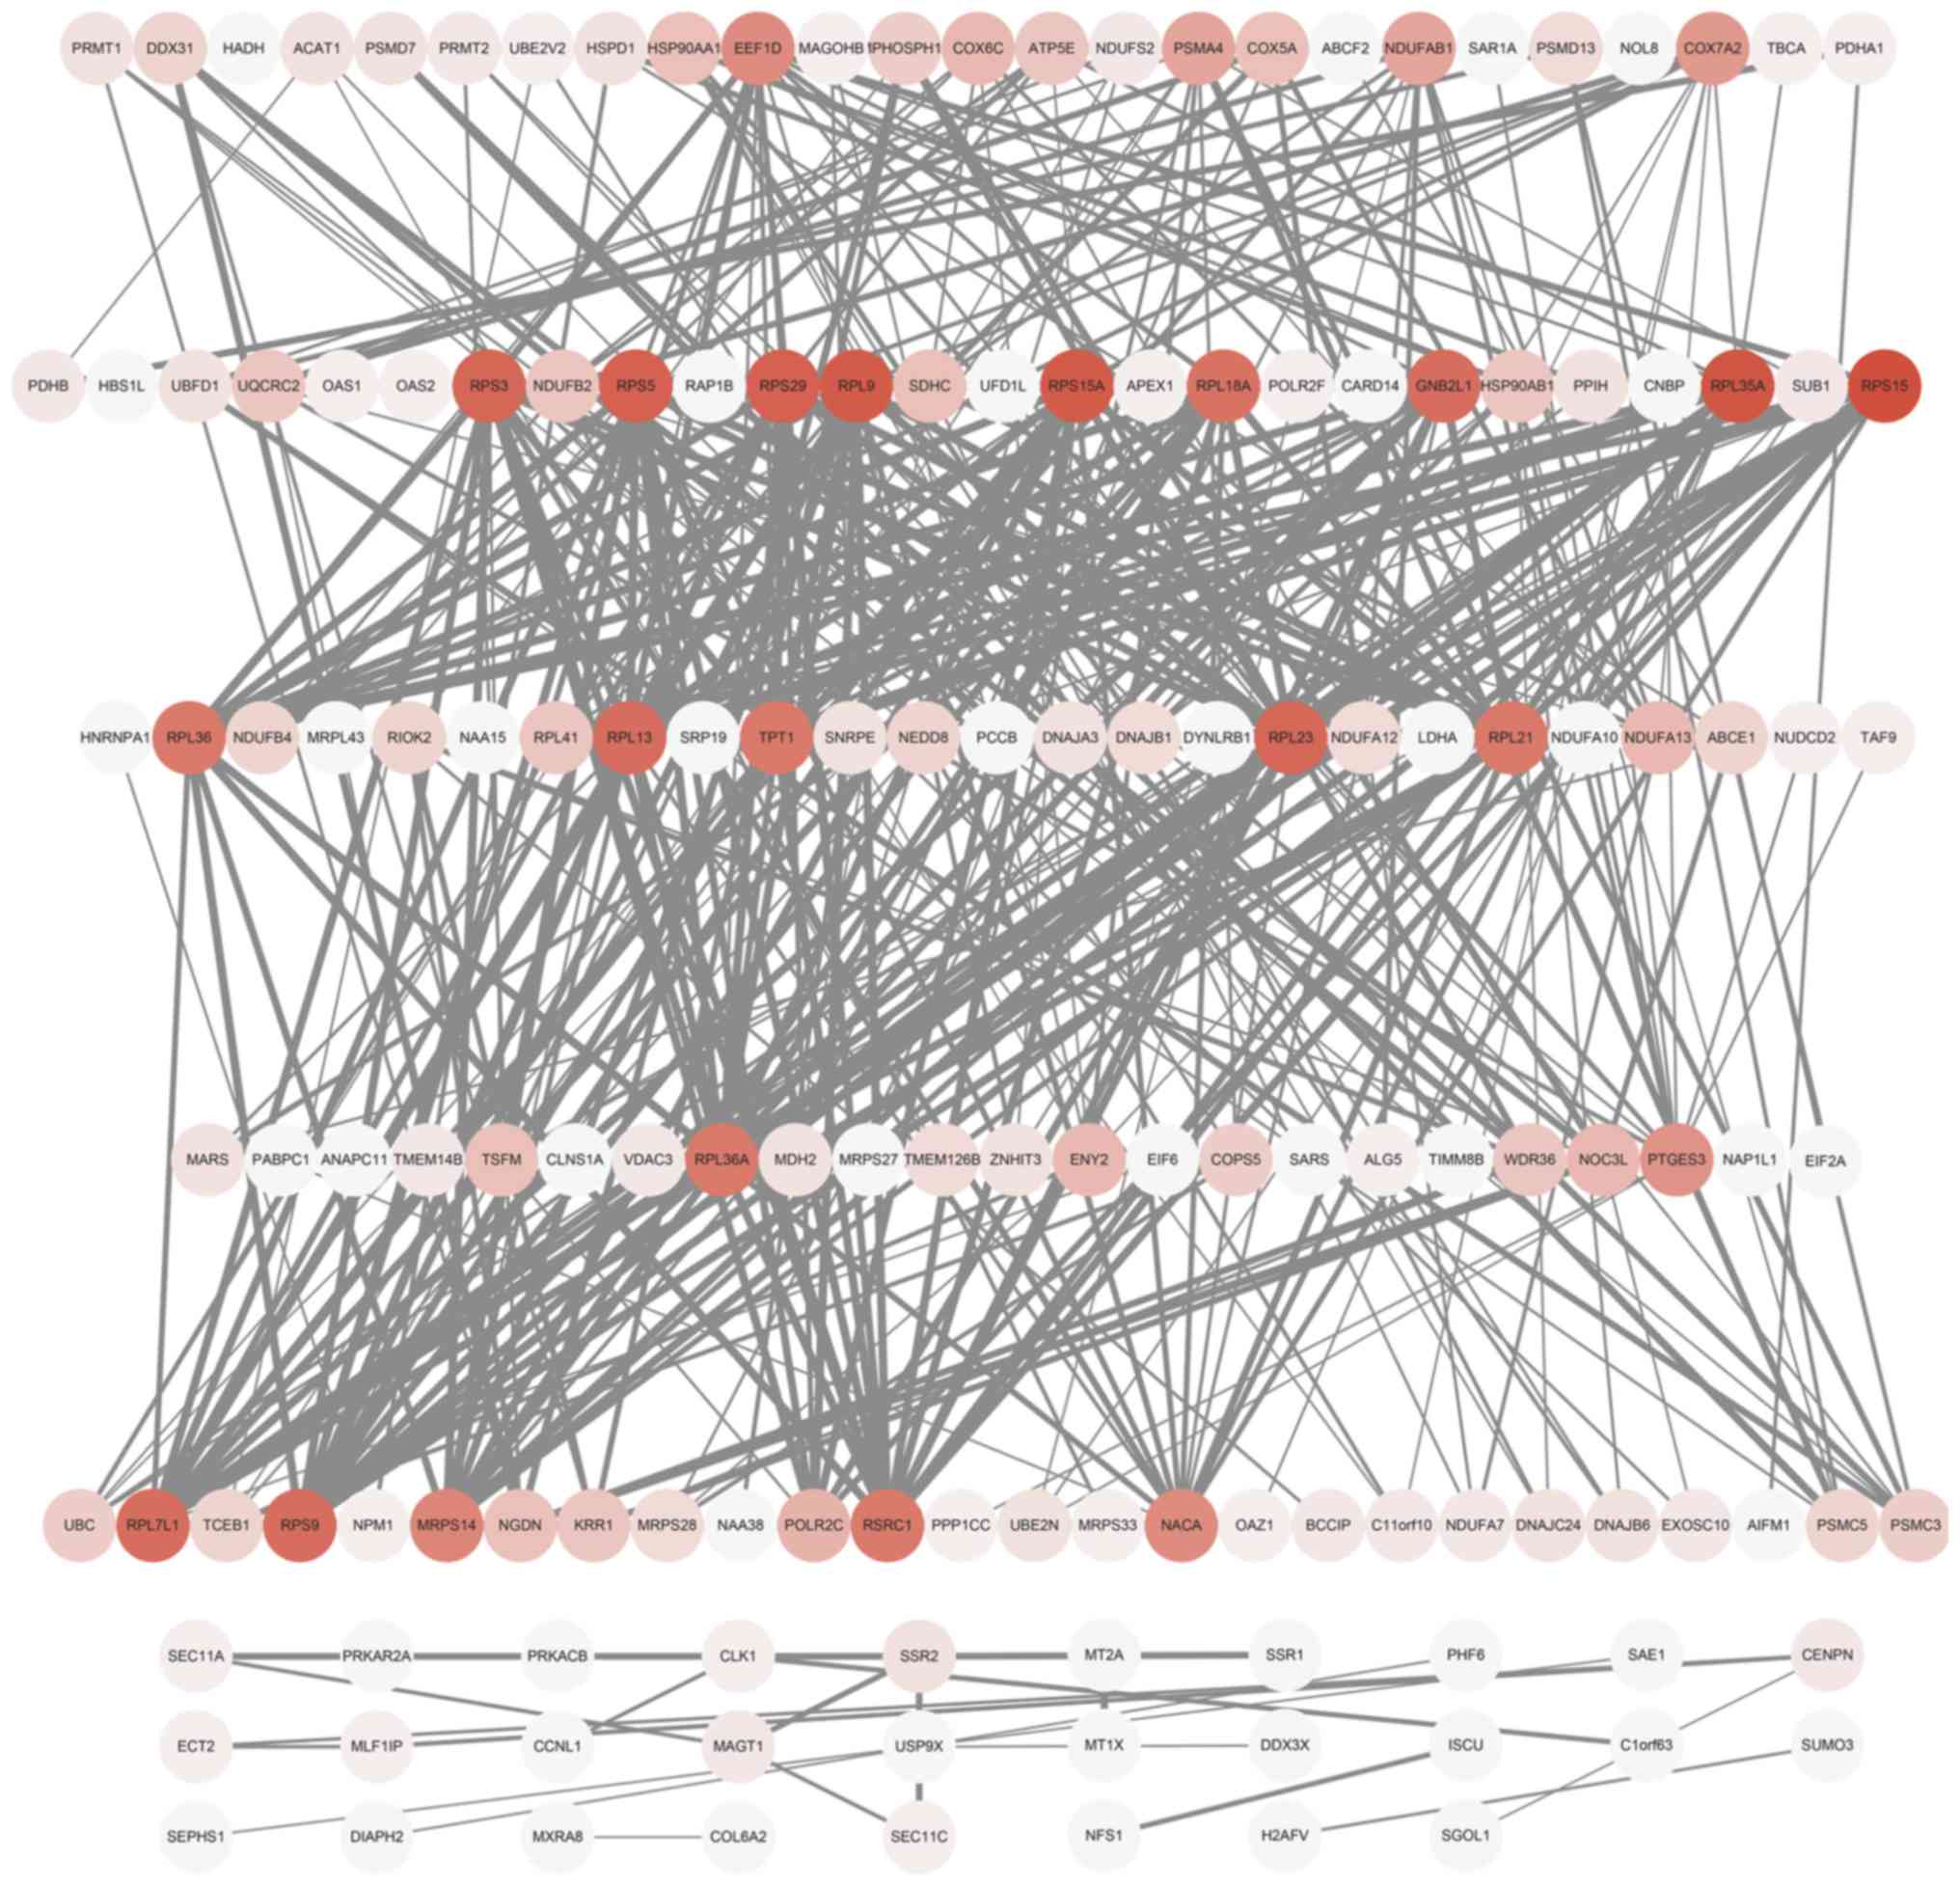
PPI network and enrichment analysis
based on SREs
The PPI network (Fig.
6) indicated that there were 13 hub genes connecting >20
nodes, the majority of which were ribosomal protein genes; these
were listed in Table III. A total
of 22, 7 and 29 items were enriched in the GO, KEGG and Reactome
databases, respectively. The results of the enrichment analysis are
presented in Table IV and the
P-values of all items were <0.05. The items in this table were
sorted by the percentage of associated genes, which clearly showed
the proportion of the submitted genes occupying the genes contained
in each function or pathway. The items enriched in GO (biological
processes), KEGG and Reactome databases with the highest percentage
of associated genes were ‘regulation of ribonuclease activity’,
‘ubiquinone and other terpenoid-quinone biosynthesis’ and ‘PKA
activation in glucagon signaling’, respectively.
| Table III.Degree value of hub genes in
protein-protein interaction network. |
Table III.
Degree value of hub genes in
protein-protein interaction network.
| Gene | Degree value |
|---|
| RPS15 | 27 |
| RPL35A | 26 |
| RPL9 | 25 |
| RPS15A | 25 |
| RPS29 | 24 |
| RPS5 | 24 |
| RPS3 | 23 |
| RPL23 | 23 |
| GNB2L1 | 22 |
| RPL13 | 22 |
| RPL7L1 | 22 |
| RPS9 | 22 |
| RPL18A | 21 |
| Table IV.Items with higher percent of
associated genes in enrichment analysis. |
Table IV.
Items with higher percent of
associated genes in enrichment analysis.
| A, Gene Ontology
(Biological Processes) |
|---|
|
|---|
| Items | P-value | Associated genes,
% | Gene number |
|---|
| 1. Regulation of
ribonuclease activity | <0.01 | 42.86 | 3 |
| 2. Ribosomal small
subunit export from nucleus | <0.01 | 42.86 | 3 |
| 3. Ribosomal
subunit export from nucleus | <0.01 | 35.71 | 5 |
| 4. Ribosomal
RNA-containing ribonucleoprotein complex export from nucleus | <0.01 | 31.25 | 5 |
| 5. Cotranslational
protein targeting to membrane | <0.01 | 17.14 | 18 |
|
| B, Kyoto
Encyclopedia of Genes and Genome |
|
| Items | P-value | Associated
genes, % | Gene
number |
|
| 1. Ubiquinone and
other terpenoid-quinone biosynthesis | 0.01 | 27.27 | 3 |
| 2. Thiamine
metabolism | 0.01 | 25.00 | 4 |
| 3.
Vasopressin-regulated water reabsorption | <0.01 | 18.18 | 8 |
| 4. Pyruvate
metabolism | <0.01 | 17.95 | 7 |
| 5. Thyroid
cancer | 0.01 | 16.22 | 6 |
|
| C,
Reactome |
|
| Items | P-value | Associated
genes, % | Gene
number |
|
| 1. PKA activation
in glucagon signaling | <0.01 | 29.41 | 5 |
| 2. TP53 regulates
transcription of genes involved in G2 cell cycle
arrest | <0.01 | 27.78 | 5 |
| 3. Constitutive
signaling by ligand-responsive EGFR cancer variants | <0.01 | 26.32 | 5 |
| 4. Signaling by
EGFR in Cancer | <0.01 | 26.32 | 5 |
| 5. Signaling by
ligand-responsive EGFR variants in cancer | <0.01 | 26.32 | 5 |
Diagnostic tests
The diagnostic tests comprised eight indicators with
weighted PSI values for the seven AS types and those calculated
from the PSI values of the 10 most significant SREs. Fig. 5B shows the ROC curve for each
indicator in the diagnostic test, which imply that certain AS
types, such as AT and ME, are unsuitable for use as diagnostic
indicators. The AUC values of AT and ME were 0.593 and 0.633,
respectively, and, in general, an indicator with AUC <0.7 was
not considered to be useful. AA appeared to be the most efficient
indicator for distinguishing between the two groups (AUC=0.823).
Quantitative results of each ROC curve are provided in Table V.
| Table V.Information of receiver operating
characteristic curve on diagnostic test. |
Table V.
Information of receiver operating
characteristic curve on diagnostic test.
| AS type | Cut-off | Sensitivity | Specificity | AUC | 95% CI lower | 95% CI upper | P-value |
|---|
| AA | −77.313 | 0.788 | 0.735 | 0.823 | 0.786 | 0.861 | <0.001 |
| AD | −16.946 | 0.549 | 0.852 | 0.756 | 0.707 | 0.804 | <0.001 |
| AP | 11.661 | 0.805 | 0.712 | 0.798 | 0.757 | 0.839 | <0.001 |
| AT | −1.520 | 0.796 | 0.422 | 0.593 | 0.548 | 0.638 | 0.001 |
| ES | −505.318 | 0.823 | 0.711 | 0.819 | 0.785 | 0.853 | <0.001 |
| ME | 68.415 | 0.460 | 0.739 | 0.633 | 0.582 | 0.684 | <0.001 |
| RI | −248.709 | 0.743 | 0.555 | 0.672 | 0.628 | 0.717 | <0.001 |
| TOP10 | −333.612 | 0.832 | 0.478 | 0.692 | 0.652 | 0.733 | <0.001 |
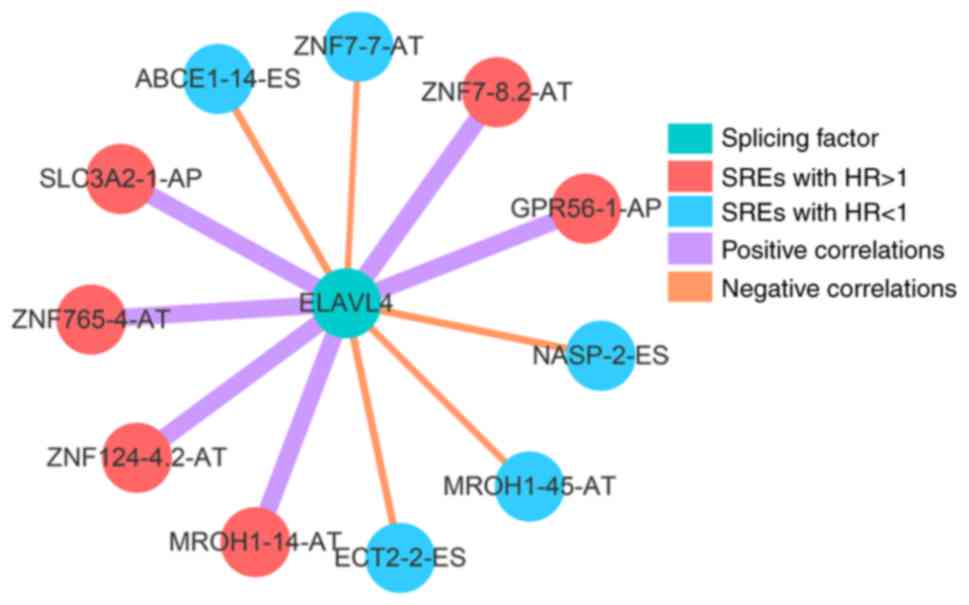
Regulatory network based on SFs and
SREs
A total of 51 SFs were matched with read counts,
which were used for survival analysis using Cox's proportional
hazards regression model; however, under the condition that
P<0.05 was considered to be significant, only one gene, ELAVL4,
was selected. The HR of ELAVL4 was 1.01, which suggested that it
was a risk factor that may indicate a poor prognosis. The present
study also demonstrated that OS changed with time (Fig. 4I). The group with a lower expression
level of ELAVL4 had a higher OS rate than that with a higher
expression level, which was more notable in patients with OS >7
years. By calculating the Pearson correlation coefficient, 11 SREs
were selected, six of which were positively associated and five of
which were negatively associated with ELAVL4 expression levels. In
particular, the six that were positively associated were associated
with a poor prognosis, while the five that were negatively
associated were associated with an improved prognosis, which
suggested the positive and negative effects of the association
between SREs and ELAVL4 expression levels (Fig. 7).
Discussion
Biomarkers do not simply classify tumors into
several types, but rather represent certain properties of the
tumor, which are of significance for precision medical treatment.
The traditional classification of a tumor is based primarily on its
location, pathological morphology and distant metastasis; however,
more molecular level-based classification methods have previously
been proposed. For example, the presence of estrogen and/or
progesterone receptors suggests that endocrine therapy has a
favorable therapeutic effect (26).
Gene expression level profiling is used to understand the
differences in gene expression levels and pathogenesis of cancerous
and healthy tissues in BRCA and could be used in BRCA
classification for different prognoses (27–29).
Although gene expression level profiling has been extensively
studied, little is currently known about the AS profile of BRCA.
Previous research has focused on elucidating the pathological
mechanisms of a single AS event or SF, which may lead to neglecting
their population characteristics, regulatory relationships and
clinical values. The present study identified a series of SREs
through survival analysis and used a 5-year survival model and
diagnostic tests to evaluate the ability of AS events to diagnose
BRCA and predict a prognosis. Identification of SREs and the
construction of the SF-AS event regulatory network has laid the
foundation for subsequent classification.
Gene mutations are considered to be the major cause
of tumorigenesis and >90% of coding genes are considered to have
undergone AS events (25).
Independently of gene mutations, AS events can also result in
products expressed by deviant genes (8,26). For
example, TP53 is one of the first-discovered
tumor-suppressor genes, and its isoform, produced by AS, modulates
its tumor-suppressor function; whereas, the dysregulation of the
TP53 isoforms are found in a variety of tumors, which are
closely associated with aberrant AS events (30). Aberrant AS produces cancer-specific
mRNA that could further disrupt the normal function of tumor
suppressors and activate oncogenic pathways (13). Furthermore, aberrant AS events are
involved in the establishment of the tumor microenvironment, thus
promoting tumor growth, invasion and metastasis (31). For example, RNA-binding proteins
participate in the specific expression of isoforms of vascular
endothelial growth factor through AS, resulting in a unique
angiogenic profile of colorectal cancer (32). In the present study, AS events were
represented by PSI values, which allowed them to be quantitatively
analyzed. Based on the correlation between PSI values and
prognosis, a series of SREs were identified, and their distribution
characteristics in BRCA were exhibited using an UpSet plot.
The present study demonstrated that ES was the type
with the most AS events, while AT had the most SREs. The
distribution of AS-associated genes was consistent with AS events,
which means that AT also has the most SRGs. The difference in the
distribution between AS events and SREs suggested that AT had a
notable effect on prognosis. The pathological role of ES is worthy
of further investigation because the number of SREs in ES ranks
second. In other tumor studies, ES is the most common type of AS,
with ME events being the least common (33,34). SRE
distribution exhibits different characteristics. Overall, for BRCA
and colon adenocarcinoma, the majority of SREs are found in AT, not
in ES, while for esophageal, stomach and rectal adenocarcinomas,
and diffuse large B-cell lymphoma, the ES type contains more SREs
than the AT type. This difference may correspond to the common
properties of tumors from different tissues (35). In addition, SRGs exhibit
characteristics different from those in AS-associated genes.
Although the number of SRGs with only one AS event is highest,
which may be due to the stability of the associated pre-mRNA, there
are also a number of genes with two or more AS events; however, the
pathways that influence a prognosis remain unclear.
AS events could be further regulated by a group of
SFs. A previous study demonstrated that individual SR proteins can
restore pre-mRNA splicing in cell extracts depleted of multiple SR
family proteins (36). The SR
protein family contains a number of proteins with phylogenetic
conservation and structural relevance, with their characteristic
domains containing multiple serine and arginine residues. Numerous
human diseases, such as cancer and human immunodeficiency virus,
are associated with the SR protein family (37,38).
SpliceAid 2 integrates existing research and includes 71 SFs and
their distributions in various tissues (25). SF gene mutations constitute early
events that most likely play a role in initiation of the
tumorigenesis of certain types of tumor (37). The results of a cohort study
demonstrated that SF3B1 mutations occur in >20% of
patients with uveal melanoma (39).
SFs are also involved in the biological processes of BRCA, such as
tumorigenesis, growth, infiltration and metastasis, and are thus
involved in prognosis (9,12,40–42). SFs
and AS have been found in the immune-evasion pathway of tumors
(43). As one SF may regulate more
than one AS event, each SF has multiple pathogenic pathways; this
suggests that SF-based treatment may be a broad spectrum. AS events
and SFs may be key targets for the treatment of cancer and merit
further investigation. In addition, the present study incorporated
SFs into the regulatory network to clarify the results. Enrichment
analysis was used to determine the physiological functions and
signaling pathways involved in SREs. The present study also
examined whether SREs can be markers for diagnosis and prognosis,
which will provide a reference for subsequent studies. Given the
prognostic relevance of SRGs, their regulatory networks and
biological functions in BRCA merit further study.
The PPI network examined the hub genes, which are
primarily ribosomal protein genes. Previous studies reported that a
number of ribosomal proteins were involved in the initiation and
progress of BRCA. Knockdown of ribosomal protein S15A represses the
proliferation of breast cancer cells in vitro by inducing
apoptosis (44). Studies have
demonstrated that ribosomal protein S6 kinase 4 had anti-invasive
and anti-metastatic activities (45,46).
Ribosomal protein S3 upregulates the X-linked inhibitor of
apoptosis to confer the resistance of breast cancer cells to
certain chemotherapeutic drugs (47). The PPI network suggests that AS may
be one of the pathways by which ribosomal protein genes are
involved in tumorigenesis. In previous studies, functional
enrichment analyses were used to identify that the signaling
pathways associated with ribosomes are found in esophageal, colon
and rectal adenocarcinomas (33,34). The
annotation of functions and pathways found in the GO, KEGG and
Reactome databases were used to understand their pathological
mechanisms. The results of enrichment analysis based on the GO
database indicated that the proportion of SRGs within the gene
group involved in the ribosome-associated biological processes was
higher than that in other functional gene groups, such as the
regulation of ribonuclease activity, ribosomal small-subunit export
from the nucleus and ribosomal subunit export from the nucleus. To
the best of our knowledge, few studies have previously noted
changes in these biological processes and how SRGs involved in
these processes affect the prognosis for patients with BRCA.
In the present study, survival curves demonstrated
that the combined effects of SREs were highly associated with
patient OS; however, not all AS types represented by weighted PSI
values were able to predict a prognosis. Some AS types with lower
AUC values, such as AT and ME, did not appear to be suitable
predictors for the 5-year survival outcome, which may have three
possible explanations. First, the number of AS events used to
calculate the weighted PSI values may have been too small to
reflect the overall characteristics. Secondly, the calculation of
SRGs participating in different functions may have masked some of
the original attributes. The third cause may have been the special
properties of BRCA as the indicators based on weighted PSI values
were excellent in predicting a prognosis in gastrointestinal
pan-adenocarcinomas (34). The
diagnostic model implies that the weighted PSI values of AA, AD, AP
and ES are reliable predictors. It is worth noting that although
the sensitivity of AD is only 0.549, the specificity is 0.852,
which suggests that there may be some AS events in AD that create
significant changes in cancerous and healthy tissues; therefore,
more research on SREs in AD is required.
ELAVL4 was associated with OS in patients with BRCA,
which was consistent with the results of previous studies on
non-small-cell lung cancer and meningioma (48,49). The
present study indicates that ELAVL4 has a potential regulatory
relationship with multiple SRGs, and that the AS is the potential
mechanism by which they affect BRCA. Another uncertainty of the
analyses in the present study is that it is difficult to infer the
functional impact of AS and the altered protein structure. Certain
AS events will totally drive structural changes in protein outputs;
however, current algorithms may not precisely quantify those
variations. New computational methods are necessary to replicate
the present study to confirm the results. In addition, all results
should be tested using another set of samples to determine the
reliability of the results of the present study.
The present study systematically identified a number
of SREs in BRCA, described the distribution characteristics of SREs
and SRGs and mapped the regulatory networks based on the SRGs, as
well as investigating potential pathological mechanisms. ELAVL4 has
a potential regulatory relationship with multiple SRGs and is worth
further investigation. Further studies are needed to examine the
potential of AS events as prognostic biomarkers and to provide
insight on subsequent identification of therapeutic targets.
Supplementary Material
Supporting Data
Acknowledgements
The authors would like to thank Mrs. Xuemei Guan
(Suzhou Ninth People's Hospital) and Dr. Yongchun Gu (Suzhou Ninth
People's Hospital) for their support and suggestions.
Funding
The present study was supported by a grant from
Nantong ‘226 Project’ (grant no. 2018436) and Excellent Key
Teachers in the ‘Qing Lan Project’ of Jiangsu Colleges and
Universities (grant no. 06190025).
Availability of data and materials
The datasets generated and/or analyzed during the
present study are available in the figures, tables and
supplementary files; TCGA database (https://portal.gdc.cancer.gov/); TCGA SpliceSeq
database (https://bioinformatics.mdanderson.org/public-software/tcgaspliceseq/);
SpliceAid 2 database (www.introni.it/spliceaid.html).
Authors' contributions
HQW, KRJ and YCW conceived and designed the current
research. KRJ, JH, JNC and HGW collected and preprocessed the data.
KRJ and YCW performed data analysis and wrote the manuscript. All
authors had read and agreed with the final version of
manuscript.
Ethics approval and consent for
participation
Not applicable.
Patient consent for publication
Not applicable.
Competing interests
The authors declare that they have no competing
interests.
References
|
1
|
Miao H, Verkooijen HM, Chia KS, Bouchardy
C, Pukkala E, Larønningen S, Mellemkjær L, Czene K and Hartman M:
Incidence and outcome of male breast cancer: An international
population-based study. J Clin Oncol. 29:4381–4386. 2011.
View Article : Google Scholar : PubMed/NCBI
|
|
2
|
Coughlin SS: Social determinants of breast
cancer risk, stage, and survival. Breast Cancer Res Treat.
177:537–548. 2019. View Article : Google Scholar : PubMed/NCBI
|
|
3
|
San Miguel Y, Gomez SL, Murphy JD, Schwab
RB, McDaniels-Davidson C, Canchola AJ, Molinolo AA, Nodora JN and
Martinez ME: Age-related differences in breast cancer mortality
according to race/ethnicity, insurance, and socioeconomic status.
BMC Cancer. 20:2282020. View Article : Google Scholar
|
|
4
|
DeSantis CE, Ma J, Goding Sauer A, Newman
LA and Jemal A: Breast cancer statistics, 2017, racial disparity in
mortality by state. CA Cancer J Clin. 67:439–448. 2017. View Article : Google Scholar : PubMed/NCBI
|
|
5
|
Siegel RL, Miller KD and Jemal A: Cancer
statistics, 2019. CA Cancer J Clin. 69:7–34. 2019. View Article : Google Scholar : PubMed/NCBI
|
|
6
|
Black DL: Protein diversity from
alternative splicing: A challenge for bioinformatics and
post-genome biology. Cell. 103:367–370. 2000. View Article : Google Scholar : PubMed/NCBI
|
|
7
|
Yang X, Coulombe-Huntington J, Kang S,
Sheynkman GM, Hao T, Richardson A, Sun S, Yang F, Shen YA, Murray
RR, et al: Widespread expansion of protein interaction capabilities
by alternative splicing. Cell. 164:805–817. 2016. View Article : Google Scholar : PubMed/NCBI
|
|
8
|
Parikshak NN, Swarup V, Belgard TG, Irimia
M, Ramaswami G, Gandal MJ, Hartl C, Leppa V, Ubieta LT, Huang J, et
al: Genome-wide changes in lncRNA, splicing, and regional gene
expression patterns in autism. Nature. 540:423–427. 2016.
View Article : Google Scholar : PubMed/NCBI
|
|
9
|
Read A and Natrajan R: Splicing
dysregulation as a driver of breast cancer. Endocr Relat Cancer.
25:R467–R478. 2018. View Article : Google Scholar : PubMed/NCBI
|
|
10
|
Tian N, Li J, Shi J and Sui G: From
general aberrant alternative splicing in cancers and its
therapeutic application to the discovery of an oncogenic DMTF1
isoform. Int J Mol Sci. 18:E1912017. View Article : Google Scholar : PubMed/NCBI
|
|
11
|
Tien JF, Mazloomian A, Cheng SG, Hughes
CS, Chow CCT, Canapi LT, Oloumi A, Trigo-Gonzalez G, Bashashati A,
Xu J, et al: CDK12 regulates alternative last exon mRNA splicing
and promotes breast cancer cell invasion. Nucleic Acids Res.
45:6698–6716. 2017. View Article : Google Scholar : PubMed/NCBI
|
|
12
|
Ke H, Zhao L, Zhang H, Feng X, Xu H, Hao
J, Wang S, Yang Q, Zou L, Su X, et al: Loss of TDP43 inhibits
progression of triple-negative breast cancer in coordination with
SRSF3. Proc Natl Acad Sci USA. 115:E3426–E3435. 2018. View Article : Google Scholar : PubMed/NCBI
|
|
13
|
Climente-González H, Porta-Pardo E, Godzik
A and Eyras E: The functional impact of alternative splicing in
cancer. Cell Rep. 20:2215–2226. 2017. View Article : Google Scholar : PubMed/NCBI
|
|
14
|
Martinez-Montiel N, Rosas-Murrieta NH,
Anaya Ruiz M, Monjaraz-Guzman E and Martinez-Contreras R:
Alternative splicing as a target for cancer treatment. Int J Mol
Sci. 19:E5452018. View Article : Google Scholar : PubMed/NCBI
|
|
15
|
Ryan M, Wong WC, Brown R, Akbani R, Su X,
Broom B, Melott J and Weinstein J: TCGASpliceSeq a compendium of
alternative mRNA splicing in cancer. Nucleic Acids Res.
44:D1018–D1022. 2016. View Article : Google Scholar : PubMed/NCBI
|
|
16
|
Gucalp A, Traina TA, Eisner JR, Parker JS,
Selitsky SR, Park BH, Elias AD, Baskin-Bey ES and Cardoso F: Male
breast cancer: A disease distinct from female breast cancer. Breast
Cancer Res Treat. 173:37–48. 2019. View Article : Google Scholar : PubMed/NCBI
|
|
17
|
RStudio Team (2015), . RStudio: Integrated
Development for R. RStudio, Inc. (Boston, MA). 2015.
|
|
18
|
R Core Team, . 2012.R: A language and
environment for statistical computing. R Foundation for Statistical
Computing. (Vienna, Austria, 2012).
|
|
19
|
Conway JR, Lex A and Gehlenborg N: UpSetR:
An R package for the visualization of intersecting sets and their
properties. Bioinformatics. 33:2938–2940. 2017. View Article : Google Scholar : PubMed/NCBI
|
|
20
|
The Gene Ontology Consortium, . Expansion
of the gene ontology knowledgebase and resources. Nucleic Acids
Res. 45:D331–D338. 2017. View Article : Google Scholar : PubMed/NCBI
|
|
21
|
Fabregat A, Jupe S, Matthews L,
Sidiropoulos K, Gillespie M, Garapati P, Haw R, Jassal B, Korninger
F, May B, et al: The reactome pathway knowledgebase. Nucleic Acids
Res. 46:D649–D655. 2018. View Article : Google Scholar : PubMed/NCBI
|
|
22
|
Bindea G, Mlecnik B, Hackl H, Charoentong
P, Tosolini M, Kirilovsky A, Fridman WH, Pagès F, Trajanoski Z and
Galon J: ClueGO: A cytoscape plug-in to decipher functionally
grouped gene ontology and pathway annotation networks.
Bioinformatics. 25:1091–1093. 2009. View Article : Google Scholar : PubMed/NCBI
|
|
23
|
Shannon P, Markiel A, Ozier O, Baliga NS,
Wang JT, Ramage D, Amin N, Schwikowski B and Ideker T: Cytoscape: A
software environment for integrated models of biomolecular
interaction networks. Genome Res. 13:2498–2504. 2003. View Article : Google Scholar : PubMed/NCBI
|
|
24
|
Sahebi M, Hanafi MM, van Wijnen AJ, Azizi
P, Abiri R, Ashkani S and Taheri S: Towards understanding pre-mRNA
splicing mechanisms and the role of SR proteins. Gene. 587:107–119.
2016. View Article : Google Scholar : PubMed/NCBI
|
|
25
|
Piva F, Giulietti M, Burini AB and
Principato G: SpliceAid 2: A database of human splicing factors
expression data and RNA target motifs. Hum Mutat. 33:81–85. 2012.
View Article : Google Scholar : PubMed/NCBI
|
|
26
|
Woolston C: Breast cancer. Nature.
527:S1012015. View
Article : Google Scholar : PubMed/NCBI
|
|
27
|
Stricker TP, Brown CD, Bandlamudi C,
McNerney M, Kittler R, Montoya V, Peterson A, Grossman R and White
KP: Robust stratification of breast cancer subtypes using
differential patterns of transcript isoform expression. PLoS Genet.
13:e10065892017. View Article : Google Scholar : PubMed/NCBI
|
|
28
|
Kim SY, Kawaguchi T, Yan L, Young J, Qi Q
and Takabe K: Clinical relevance of microRNA expressions in breast
cancer validated using the cancer genome atlas (TCGA). Ann Surg
Oncol. 24:2943–2949. 2017. View Article : Google Scholar : PubMed/NCBI
|
|
29
|
Heng YJ, Lester SC, Tse GM, Factor RE,
Allison KH, Collins LC, Chen YY, Jensen KC, Johnson NB, Jeong JC,
et al: The molecular basis of breast cancer pathological
phenotypes. J Pathol. 241:375–391. 2017. View Article : Google Scholar : PubMed/NCBI
|
|
30
|
Wang ET, Sandberg R, Luo S, Khrebtukova I,
Zhang L, Mayr C, Kingsmore SF, Schroth GP and Burge CB: Alternative
isoform regulation in human tissue transcriptomes. Nature.
456:470–476. 2008. View Article : Google Scholar : PubMed/NCBI
|
|
31
|
Biamonti G, Catillo M, Pignataro D,
Montecucco A and Ghigna C: The alternative splicing side of cancer.
Semin Cell Dev Biol. 32:30–36. 2014. View Article : Google Scholar : PubMed/NCBI
|
|
32
|
Hamdollah Zadeh MA, Amin EM,
Hoareau-Aveilla C, Domingo E, Symonds KE, Ye X, Heesom KJ, Salmon
A, D'Silva O, Betteridge KB, et al: Alternative splicing of TIA-1
in human colon cancer regulates VEGF isoform expression,
angiogenesis, tumour growth and bevacizumab resistance. Mol Oncol.
9:167–178. 2015. View Article : Google Scholar : PubMed/NCBI
|
|
33
|
Xiong Y, Deng Y, Wang K, Zhou H, Zheng X,
Si L and Fu Z: Profiles of alternative splicing in colorectal
cancer and their clinical significance: A study based on
large-scale sequencing data. EBioMedicine. 36:183–195. 2018.
View Article : Google Scholar : PubMed/NCBI
|
|
34
|
Lin P, He RQ, Ma FC, Liang L, He Y, Yang
H, Dang YW and Chen G: Systematic analysis of survival-associated
alternative splicing signatures in gastrointestinal
pan-adenocarcinomas. EBioMedicine. 34:46–60. 2018. View Article : Google Scholar : PubMed/NCBI
|
|
35
|
Zhang R, Lin P, Yang X, He RQ, Wu HY, Dang
YW, Gu YY, Peng ZG, Feng ZB and Chen G: Survival associated
alternative splicing events in diffuse large B-cell lymphoma. Am J
Transl Res. 10:2636–2647. 2018.PubMed/NCBI
|
|
36
|
Zahler AM, Lane WS, Stolk JA and Roth MB:
SR proteins: A conserved family of pre-mRNA splicing factors. Genes
Dev. 6:837–847. 1992. View Article : Google Scholar : PubMed/NCBI
|
|
37
|
Kedzierska H and Piekielko-Witkowska A:
Splicing factors of SR and hnRNP families as regulators of
apoptosis in cancer. Cancer Lett. 396:53–65. 2017. View Article : Google Scholar : PubMed/NCBI
|
|
38
|
Mahiet C and Swanson CM: Control of HIV-1
gene expression by SR proteins. Biochem Soc Trans. 44:1417–1425.
2016. View Article : Google Scholar : PubMed/NCBI
|
|
39
|
Decatur CL, Ong E, Garg N, Anbunathan H,
Bowcock AM, Field MG and Harbour JW: Driver mutations in uveal
melanoma: Associations with gene expression profile and patient
outcomes. JAMA Ophthalmol. 134:728–733. 2016. View Article : Google Scholar : PubMed/NCBI
|
|
40
|
Hu Y, Sun Z, Deng J, Hu B, Yan W, Wei H
and Jiang J: Splicing factor hnRNPA2B1 contributes to tumorigenic
potential of breast cancer cells through STAT3 and ERK1/2 signaling
pathway. Tumour Biol. 39:10104283176943182017. View Article : Google Scholar : PubMed/NCBI
|
|
41
|
Koedoot E, Fokkelman M, Rogkoti VM, Smid
M, van de Sandt I, de Bont H, Pont C, Klip JE, Wink S, Timmermans
MA, et al: Uncovering the signaling landscape controlling breast
cancer cell migration identifies novel metastasis driver genes. Nat
Commun. 10:29832019. View Article : Google Scholar : PubMed/NCBI
|
|
42
|
Singh R, Gupta SC, Peng WX, Zhou N,
Pochampally R, Atfi A, Watabe K, Lu Z and Mo YY: Regulation of
alternative splicing of Bcl-x by BC200 contributes to breast cancer
pathogenesis. Cell Death Dis. 7:e22622016. View Article : Google Scholar : PubMed/NCBI
|
|
43
|
Oltean S and Bates DO: Hallmarks of
alternative splicing in cancer. Oncogene. 33:5311–5318. 2014.
View Article : Google Scholar : PubMed/NCBI
|
|
44
|
Feng W, Liang C, Wang C, Yu X, Li Q and
Yang H: Knockdown of ribosomal protein S15A inhibits proliferation
of breast cancer cells through induction of apoptosis in vitro.
Cytotechnology. 70:1315–1323. 2018. View Article : Google Scholar : PubMed/NCBI
|
|
45
|
Thakur A, Sun Y, Bollig A, Wu J, Biliran
H, Banerjee S, Sarkar FH and Liao DJ: Anti-invasive and
antimetastatic activities of ribosomal protein S6 kinase 4 in
breast cancer cells. Clin Cancer Res. 14:4427–4436. 2008.
View Article : Google Scholar : PubMed/NCBI
|
|
46
|
Zhu J, Li QY, Liu JL, Wei W, Yang HW and
Tang W: RSK4 knockdown promotes proliferation, migration and
metastasis of human breast adenocarcinoma cells. Oncol Rep.
34:3156–3162. 2015. View Article : Google Scholar : PubMed/NCBI
|
|
47
|
Ono H, Iizumi Y, Goi W, Sowa Y, Taguchi T
and Sakai T: Ribosomal protein S3 regulates XIAP expression
independently of the NF-kB pathway in breast cancer cells. Oncol
Rep. 38:3205–3210. 2017. View Article : Google Scholar : PubMed/NCBI
|
|
48
|
Wang F, Lu J, Li S, Huo X, Liu X, Du X, Li
C, Wang J and Chen Z: Application of serum ELAVL4 (HuD) antigen
assay for small cell lung cancer diagnosis. Anticancer Res.
37:4515–4522. 2017.PubMed/NCBI
|
|
49
|
Wong KK, Rostomily R and Wong STC:
Prognostic gene discovery in glioblastoma patients using deep
learning. Cancers (Basel). 11:E532019. View Article : Google Scholar : PubMed/NCBI
|