Introduction
GBM is the most aggressive form of brain tumor, with
high recurrence (~37%) and mortality rates (median survival time
<1 year) in 2018 (1,2). GBM originates from astrocytes and is
comprised of different types of cell (3), which multiply rapidly and support GBM
development via large vascular networks (4). The current standard treatment for GBM
includes surgery, followed by radiation therapy and temozolomide
chemotherapy (5). However, the
median survival time for this procedure is <1 year and very few
patients survive >3 years. Despite great efforts, little
progress has been made in the treatment of GBM over the past decade
(6,7). Furthermore, a series of phase III
clinical trials for targeted drugs has failed to improve the
overall survival of patients with GBM (8). Thus, it is critical to investigate
potential biomarkers of GBM and provide novel insights into the
diagnosis and treatment of the disease.
Changes in the expression of biomarkers are commonly
described in oncological research. Biomarkers provide a framework
and assurance for the strategy of diagnostic and therapeutic
methods, with the aim of eradicating complications. Previous
studies have identified prognostic biomarkers for GBM, such as long
coding RNAs, circular RNAs, microRNAs and somatic mutations
(9–12). In the past decade, epigenetic
modification, especially DNA methylation in carcinogenesis, has
become a focus for cancer research. Several methylated markers have
been reported. For example, O6-methylguanine DNA methyltransferase
promoter methylation is the major emblematic biomarker in GBM,
which may predict the response to temozolomide treatment (13–15).
Epigenetic changes are heritable and reversible, affecting the
spatial conformation of DNA and its transcriptional activities
(16). DNA methylation is one of the
main epigenetic mechanisms of gene expression regulation in
eukaryotes (17). Changes in DNA
methylation may affect gene expression and feedback mechanisms,
with various positive and negative interactions (18). Thus, abnormally methylated CpG sites
are considered potential prognostic factors for GBM.
As the majority of previous studies were performed
on relatively small sample sizes and limited to a single epigenetic
level, the present study integrated 152 GBM RNA-sequencing
(RNA-seq) samples and 151 GBM DNA methylation samples from public
databases. Bioinformatics-based methods were implemented to
identify novel markers of phenotypically important associations
among DNA methylation, gene expression and survival time in
patients with GBM, using The Cancer Genome Atlas (TCGA)
datasets.
Materials and methods
Data preparation
RNA-seq data of 174 GBM samples were downloaded from
the TCGA (https://portal.gdc.cancer.gov/) database in October,
2018 according to ‘glioblastoma’ search term. Repeat samples,
non-cancerous samples, paracancerous samples and samples without
follow-up information were removed using gdcRNA tools (version
4.6.3) (19). Thus, a total of 152
GBM samples were included in the present study. RNA-seq data were
normalized using the trimmed mean of M-values method (20).
DNA methylation data of 155 GBM samples were
downloaded from the University of California Santa Cruz (UCSC)-Xena
database (https://xenabrowser.net/datapages/) in October, 2018
according to ‘glioblastoma’ search term. UCSC-Xena is a
bioinformatics tool used to visualize functional genomics data from
several sources, including TCGA database. DNA methylation was
represented as β values, which are bounded variables of the form
[M/(M + U + 100)] that are generated by the Illumina 450 k BeadChip
array (Illumina, Inc.) (21).
Samples without follow-up information were removed, thus a total of
151 samples were used in the present study.
The DNA methylation dataset (151 patients) and the
RNA-seq dataset (152 patients) were compared, and 49 patients were
found to be shared between the two datasets. The research flow
chart is presented in Fig. S1.
Identification of differentially
expressed genes (DEGs) according to survival time
Gene expression data were used for the differential
expression analysis. The median survival time of patients with GBM
is <1 year (1). Thus, the
patients (n=152) were divided into two groups, survival time <1
year and survival time ≥1 year, according to the median survival
time. Differential expression analysis was performed between the
two groups using the edgeR package (version 3.8) (22). P<0.05 and |logFC|>0.585 were
considered to indicate DEGs.
Identification of differentially
methylated genes
Methylation data were used for the differential
methylation analysis. The patients (n=151) were divided into two
groups, survival time <1 year and survival time ≥1 year,
according to the median survival time. Differentially methylated
CpG sites were identified by comparing the two groups. CpG sites
with ≥50% missing values were removed and CpG sites with <50%
missing values were filled using K-means (23). The remaining missing values were
imputed using the ChAMP package (version 3.8) (24). Low-quality probes were removed if
they met the following criteria: Probes with non-CpG sites, probes
associated with single-nucleotide polymorphisms, cross-reactive
probes and probes on the X and Y chromosomes. The β-Mixture
Quantile Normalization method was used for further type I and II
probe correction (25,26). P<0.01 was considered to indicate
differentially methylated CpG sites.
Identification of differentially
expressed and methylated genes
DNA methylation analysis focused on CpG sites that
were located simultaneously in differentially methylated sites and
differentially expressed genes. Thus, the differentially expressed
genes and the differentially methylated genes were integrated.
Protein-protein (PPI) network
construction
The Search Tool for the Retrieval of interacting
Genes/Proteins (STRING) database (http://string-db.org) is used to identify associations
between known proteins and predicted proteins (27), and was used in the pwresent study to
construct a PPI network. The PPI network was visualized using
Cytoscape software (version 3.8.0) (28). Each node represents a gene, protein
or molecule. Furthermore, the connections between nodes represent
the interactions of these biological molecules, which can be used
to identify interactions between the proteins encoded by DEGs and
methylated genes in GBM. The corresponding protein in the central
node can be a core protein or a key candidate gene with critical
physiological regulatory functions.
Gene ontology (GO) and kyoto
encyclopedia of genes and genomes (KEGG) pathway enrichment
analyses
Functional enrichment analyses were performed to
determine potential biological processes and pathways enriched by
the DEGs and methylated genes in GBM. KEGG pathway enrichment
analysis of the differentially expressed and methylated genes was
performed using the clusterProfiler package (version 3.8) (29,30), and
GO enrichment analysis was performed using Cytoscape plug-in ClueGO
(version 2.5.3), which visualizes the non-redundant biological
terms for large clusters of genes in a functionally grouped network
(31). The cut-off value for
significant terms was set as P<0.05.
Identification of hub genes
Cytoscape plug-in cytoHubba (version 1.6) is
commonly used to identify hub genes and subnetworks from complex
interactomes (32). The four
local-based methods; Density of maximum neighborhood component
(DMNC), MNC, maximal clique centrality (MCC) and degree, were used
to predict and evaluate essential proteins according to ranking
nodes in the network. The top 30 genes within the four methods were
screened and overlapped, and the overlapping genes were considered
to be hub genes.
Survival analysis
The expression values of the hub genes were
visualized in box plots and heat maps. Survival analysis was
performed using the survminer package (version 0.4.6; http://cran.r-project.org/) and the cut-off values
were identified according to the surv_cutpoint function. Survival
times were evaluated using Kaplan-Meier survival curves and
differences were analyzed using the log-rank test. P<0.05 was
considered to indicate a statistically significant difference.
Subsequently, Cox proportional hazards regression analysis was
performed to further assess the results of Kaplan-Meier survival
analysis.
Results
Identification of DEGs according to
survival time
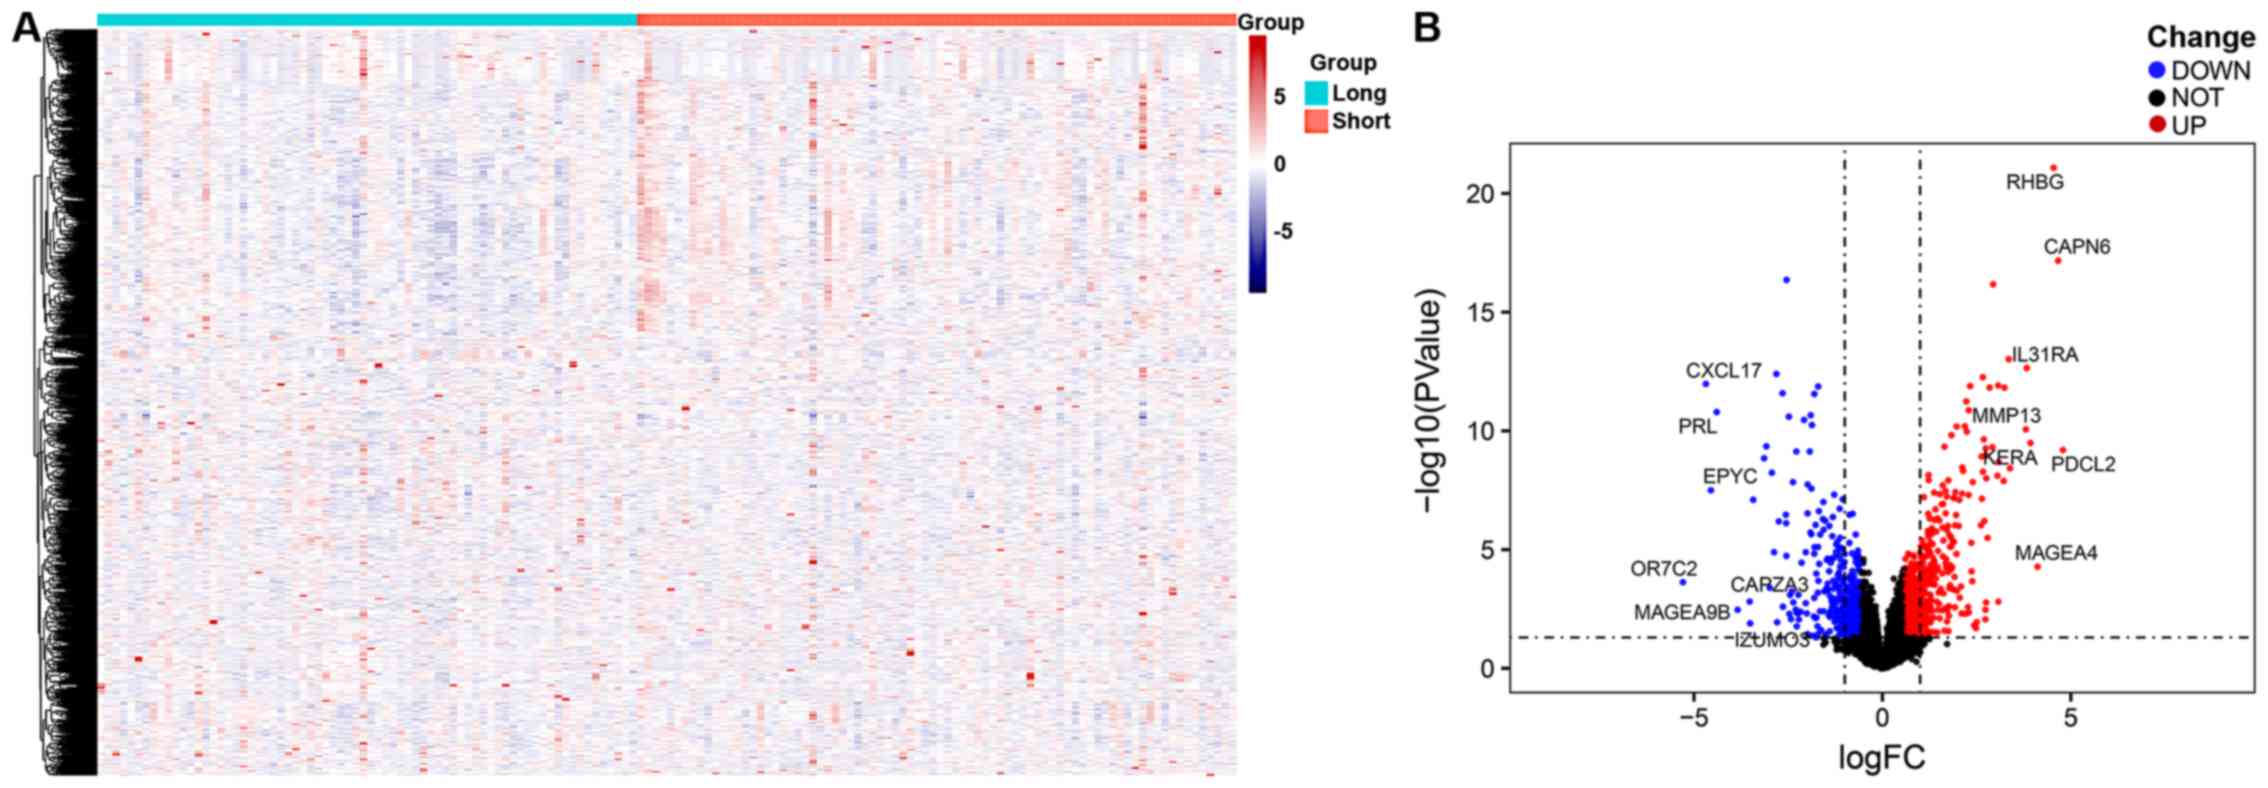
A total of 152 GBM gene expression profiles were
obtained from the UCSC-Xena database. The patients were divided
into 2 groups; survival time <1 year (short group) and survival
time ≥1 year (long group) according to the median survival time. A
total of 429 downregulated genes and 672 upregulated genes were
identified, according to survival time, with P<0.05 and
|logFC|>0.585. The results were visualized as hierarchical
clusters and volcano plots, as presented in Fig. 1.
Identification of differentially
methylated genes
A total of 151 GBM DNA methylation profiles were
obtained from TCGA database. The clinical characteristics of
patients with GBM in the TCGA database are presented in Table I. A total of 4,079 differentially
methylated CpG sites were identified, including 509 hypermethylated
sites and 3,570 hypomethylated sites (P<0.01; Fig. S2A). The present study screened the
top 50 methylation sites in descending order of the absolute value
of logFC, as presented in Fig. S2B.
Following annotation of the differentially methylated CpG sites,
370 hypermethylated genes and 1,987 hypomethylated genes were
identified.
 | Table I.Clinical characteristics of patients
with glioblastoma. |
Table I.
Clinical characteristics of patients
with glioblastoma.
| Characteristic | TCGA (n=152) | UCSC-Xena
(n=151) |
|---|
| Age, years |
|
|
|
Median | 61 | 60 |
|
Range | 21-89 | 21-85 |
| Sex |
|
|
|
Male | 98 | 88 |
|
Female | 54 | 63 |
| Ethnicity, n |
|
|
|
Asian | 5 | 0 |
| Black
or African American | 10 | 24 |
|
White | 136 | 118 |
|
N/A | 1 | 9 |
| Vital status,
n |
|
|
|
Living | 30 | 45 |
|
Dead | 122 | 106 |
Identification of differentially
expressed and methylated genes
DNA methylation may downregulate gene expression.
Thus, the present study examined the intersection of the
differentially expressed and methylated genes. A total of 49 genes
from 152 patients overlapped the DNA methylation array data from
151 patients. The clinical characteristics of patients with GBM
from TCGA dataset are presented in Table
I. A total of 71 genes that were hypomethylated and expressed
at high levels, and four genes that were hypermethylated and
expressed at low levels in GBM were identified.
PPI network construction and
functional enrichment analyses
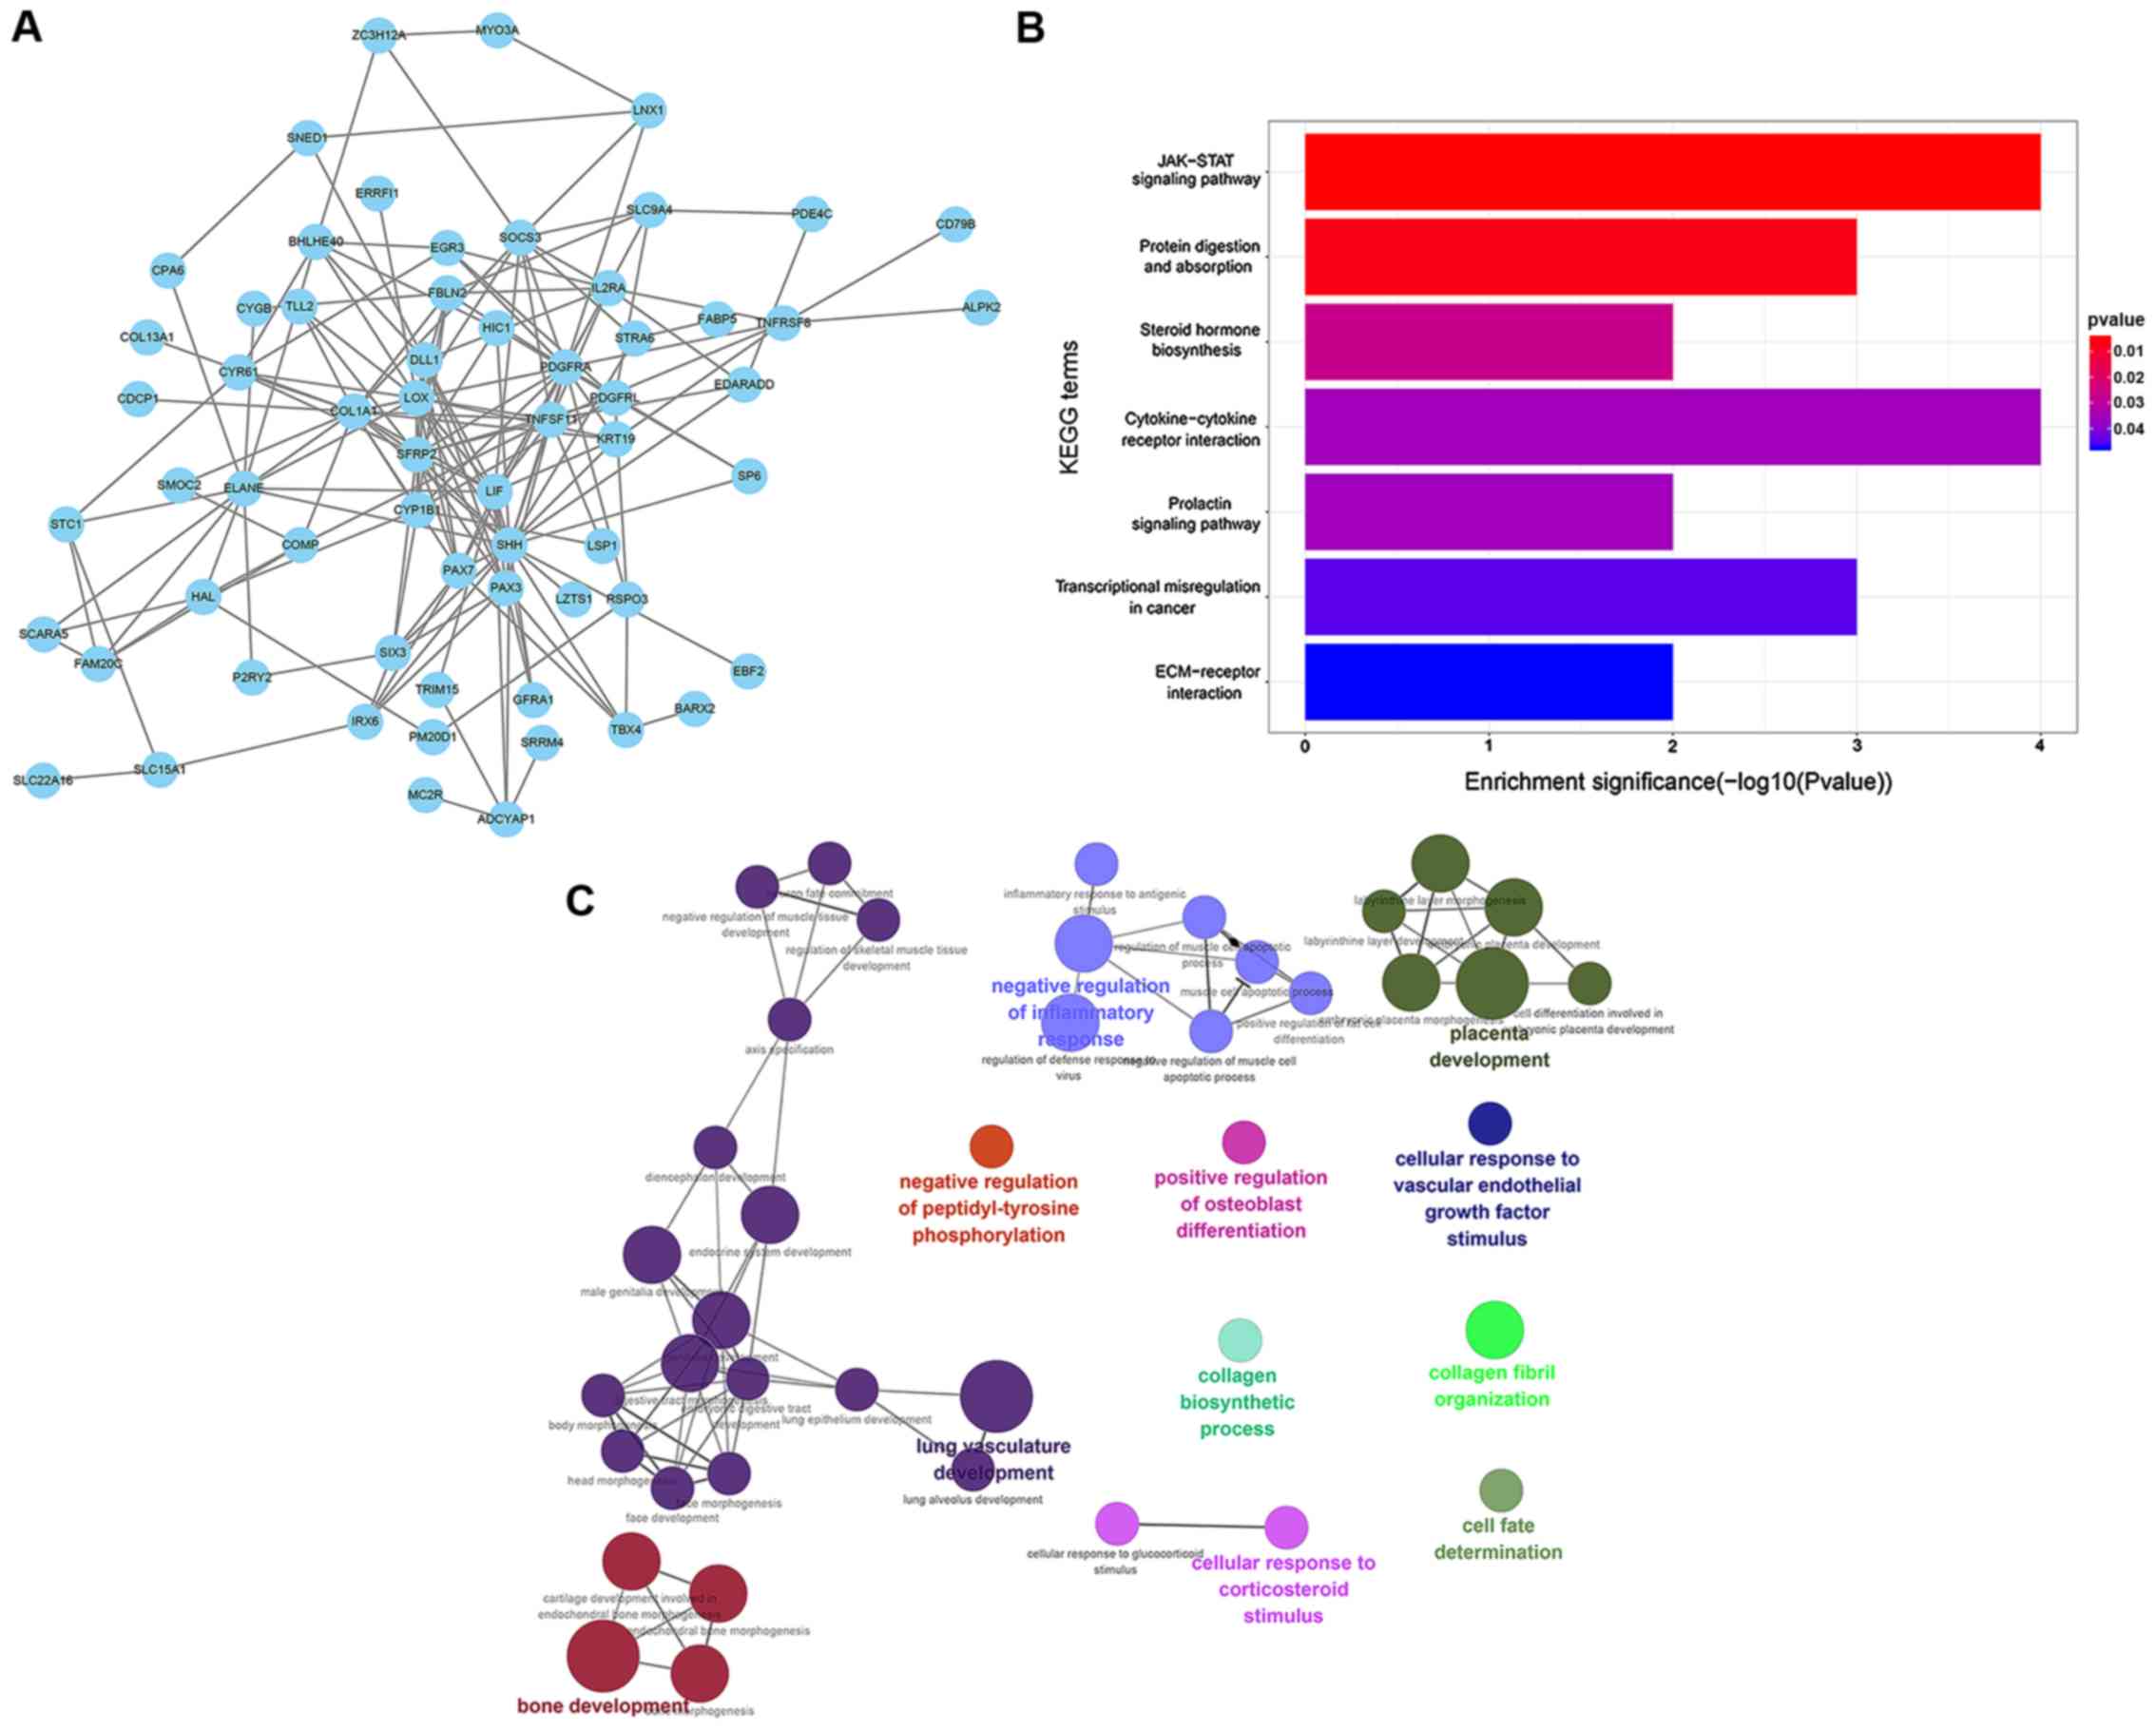
Within the STRING database, the expression products
of the differentially expressed and methylated genes in GBM were
used to construct the PPI network (Fig.
2A), with a total of 63 genes (confidence score, >0.15).
KEGG pathway enrichment analysis demonstrated that these genes were
predominantly enriched in the ‘JAK-STAT signaling pathway’,
‘protein digestion and absorption’, ‘steroid hormone biosynthesis’,
‘cytokine-cytokine receptor interaction’, ‘prolactin signaling
pathway’, ‘transcriptional misregulation in cancer’ and
‘ECM-receptor interaction’ (Fig.
2B). GO enrichment analysis demonstrated that these genes were
predominantly enriched in ‘cellular response to corticosteroid
stimulus’, ‘cell fate determination’, ‘collagen fibril
organization’ and ‘collagen biosynthetic process’ (Fig. 2C), which may contribute to GBM
development.
Hub genes and survival analysis
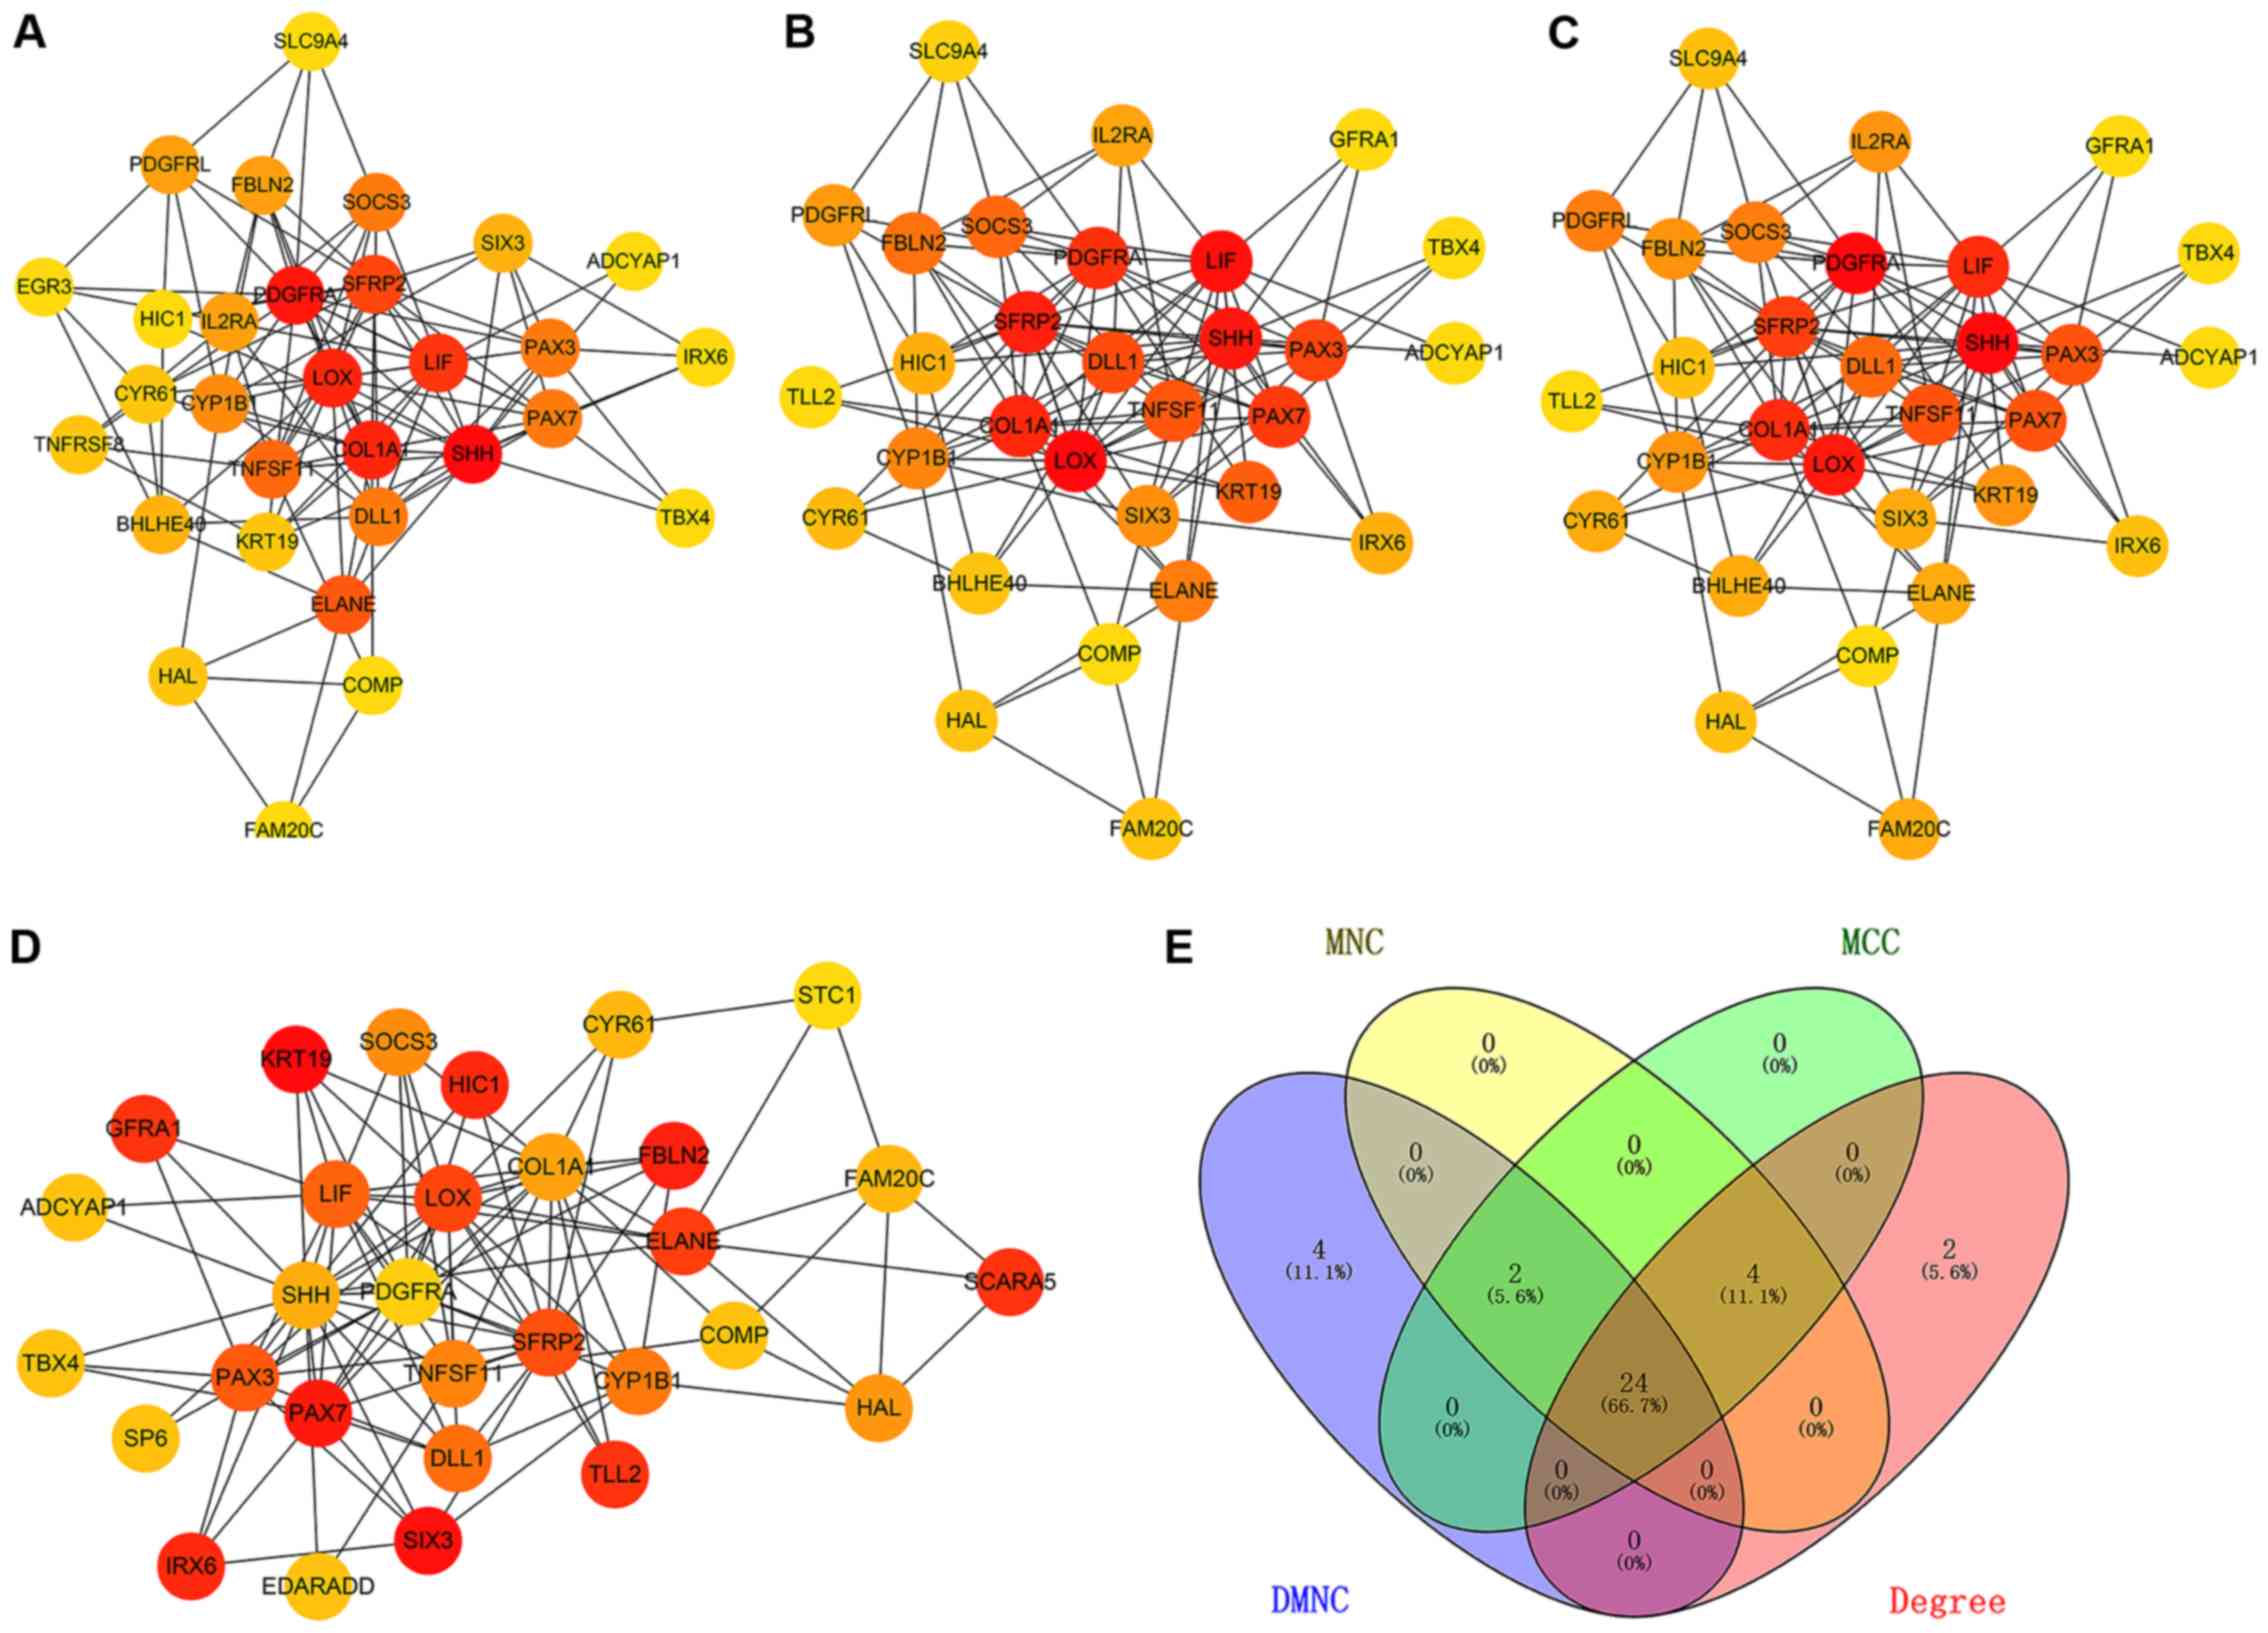
The top 30 genes were screened by combining the four
local-based methods (DMNC, MNC, MCC and degree) in the Cytoscape
plug-in cytoHubba based on differentially expressed and methylated
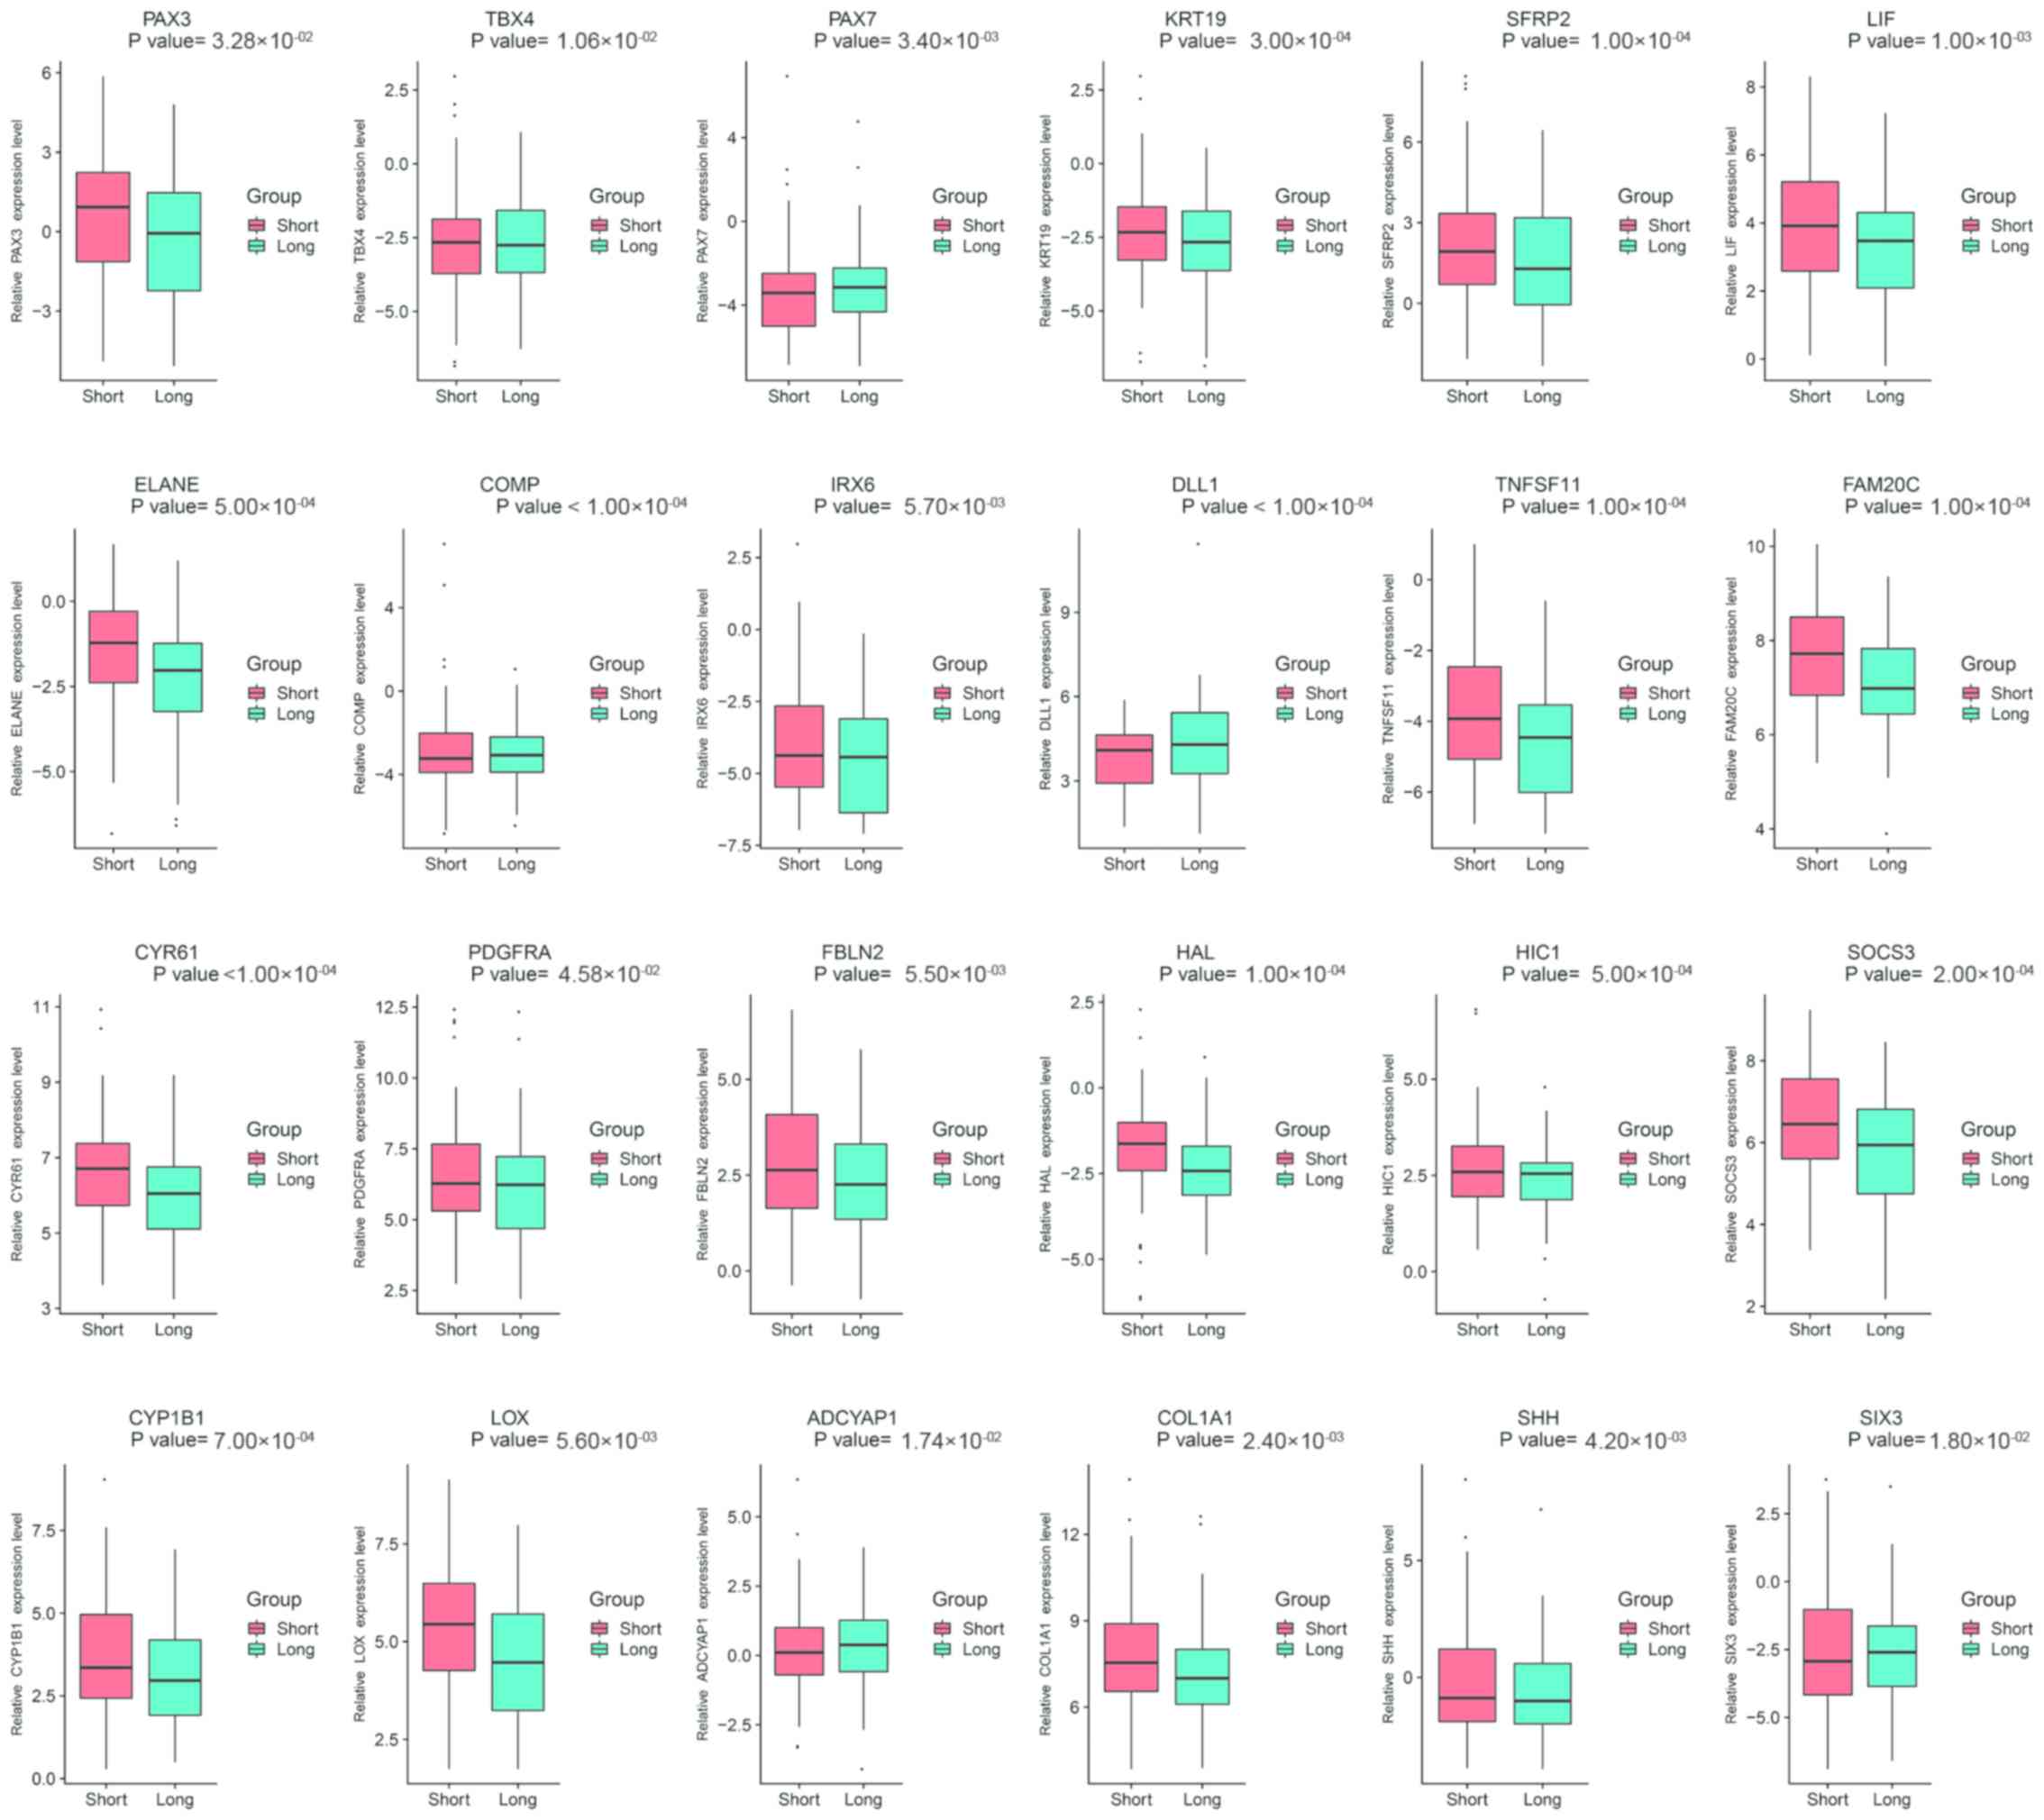
genes. The 24 overlapping genes were considered hub genes (Fig. 3). Subsequently, the expression values
of the 24 hub genes were visualized as box plots, as presented in
Figs. 4 and S3. These hub genes had significantly
differential expression in patients who had a survival time ≥1 year
(long group) compared with patients who had a survival time <1
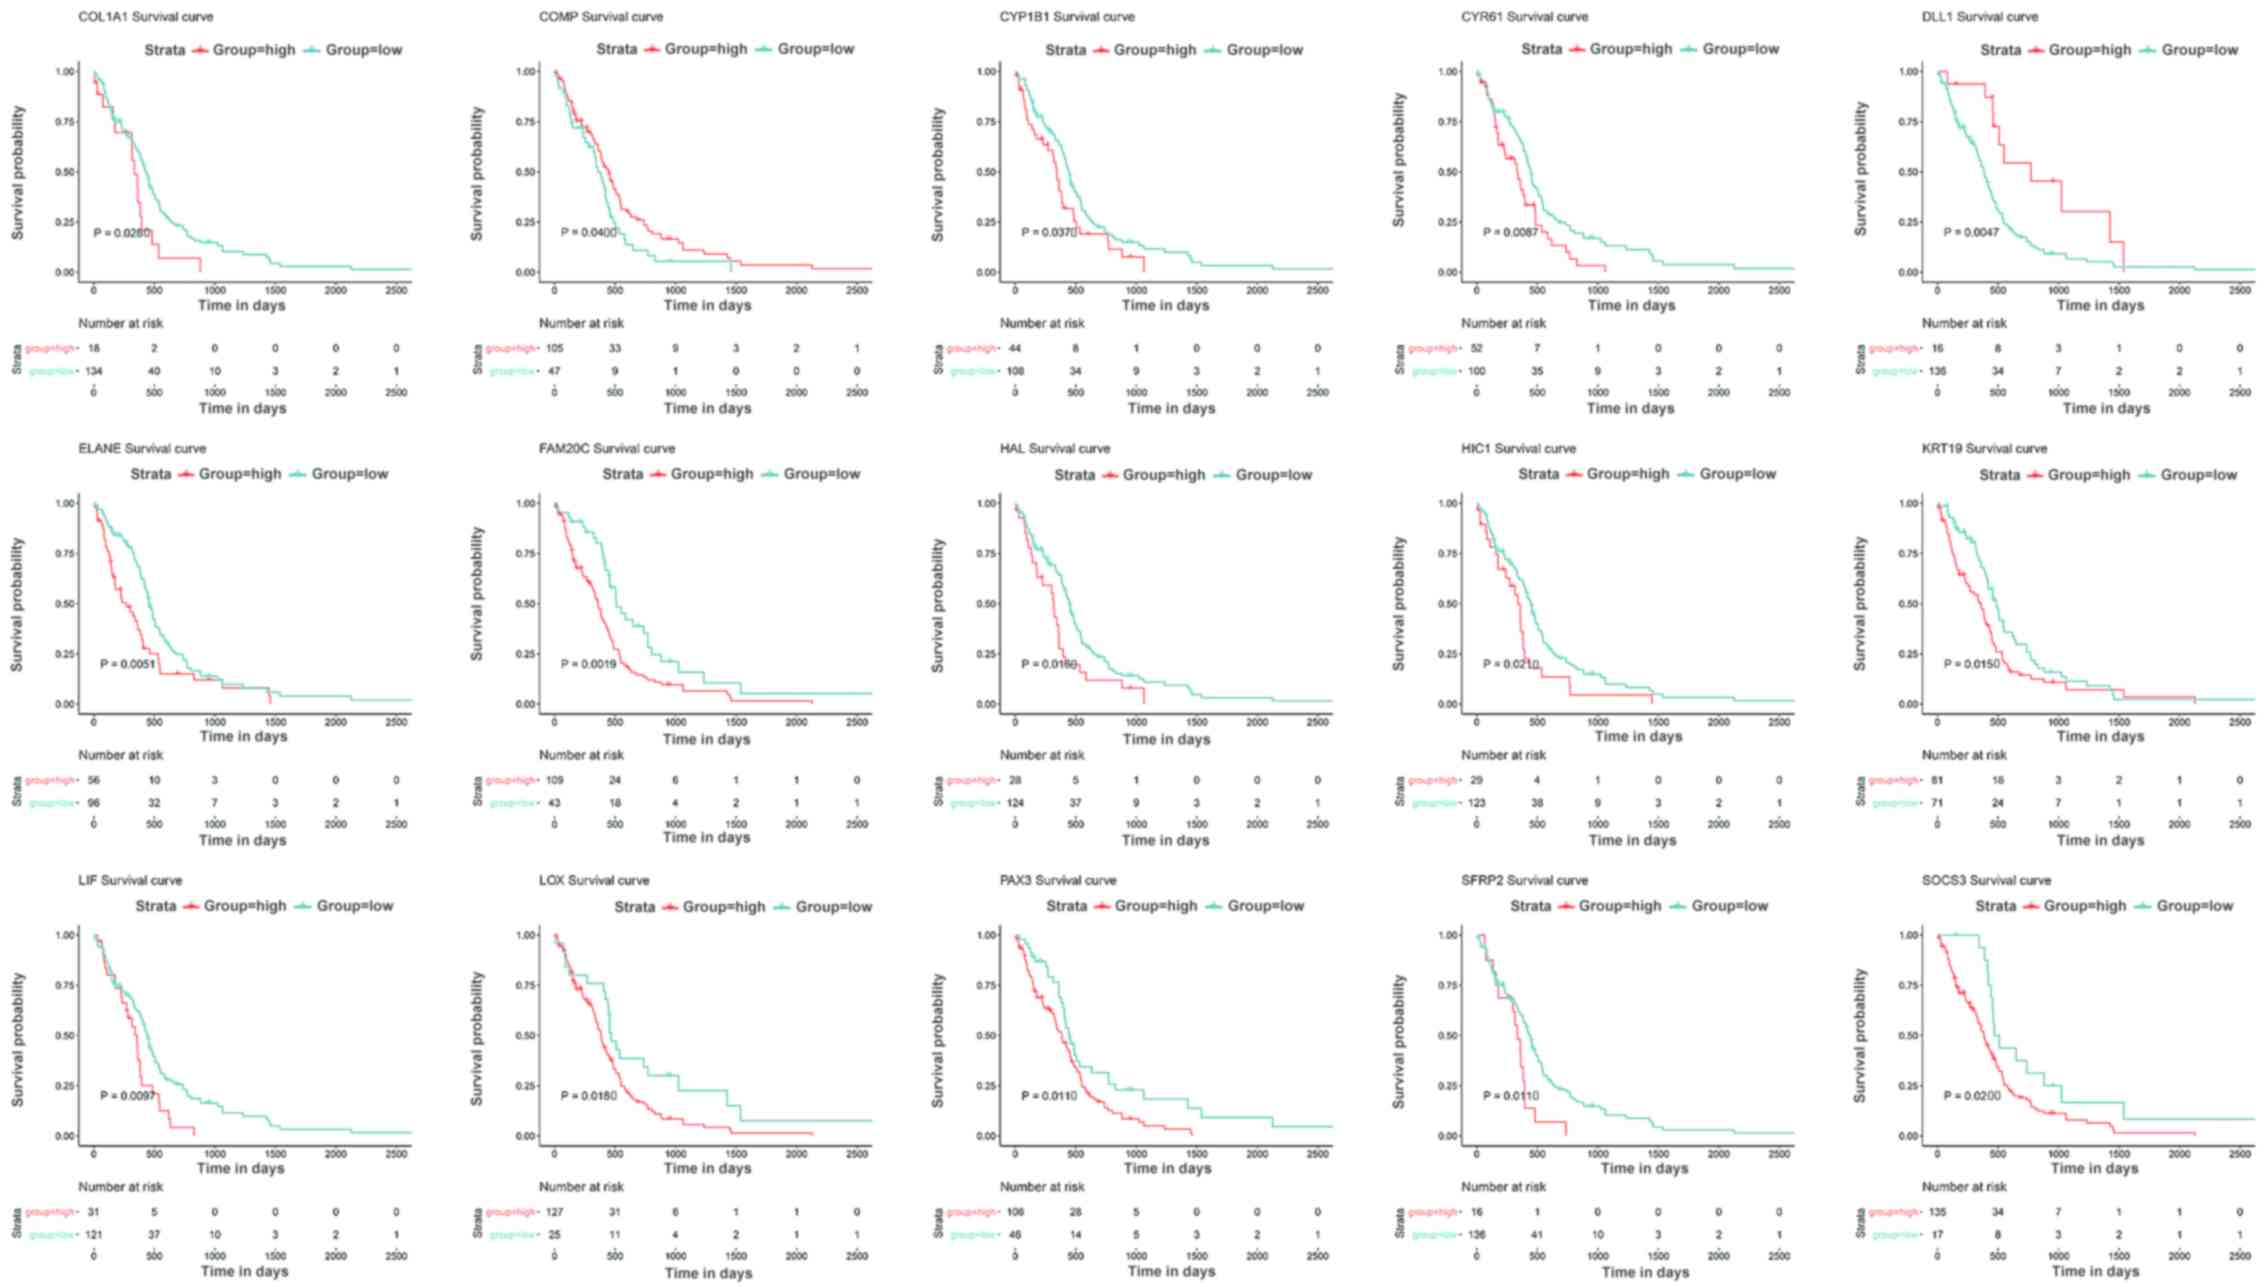
year (short group) (P<0.05). Survival analysis was performed in
order to further assess the prognostic values of the hub genes.
Among the 24 hub genes, 15 possessed potential prognostic value by
comparing patients who experienced longer survival times with
patients who experienced shorter survival times. Patients with
hypomethylated genes expressed at high levels had shorter survival
times compared with patients expressing hypermethylated genes at
low levels, including COL1A1 (P=0.0280), CYP1B1 (P=0.0370), CYR61
(P=0.0087), ELANE (P=0.0051), FAM20C (P=0.0019), HAL (P=0.0160),
HIC1 (P=0.0210), KRT19 (P=0.0150), LIF (P=0.0097), LOX (P=0.0180),
PAX3 (P=0.0110), SFRP2 (P=0.0110) and SOCS3 (P=0.0200) (Fig. 5). Furthermore, patients with high
expression levels of the hypomethylated COMP gene had longer
survival times compared with patients with low levels of the
hypermethylated COMP gene (P=0.0400). In addition, patients with
low levels of the hypermethylated DLL1 gene had shorter survival
times compared with patients with high expression levels of the
hypomethylated DLL1 gene (P=0.0047). The details of the 15 hub
genes are presented in Table II.
Cox proportional hazards regression analysis was performed to
evaluate Kaplan-Meier survival analysis results, which are
presented in Table III.
| Table II.Hub genes (n=15) in glioblastoma. |
Table II.
Hub genes (n=15) in glioblastoma.
| Symbol | Group | LogFC | LogCPM | P-value | FDR | Change | Methylation |
|---|
| COL1A1 | protein_coding | 0.948349 | 9.177457 |
2.369×10⁻³ | 0.116097 | UP |
Hypomethylation |
| CYP1B1 | protein_coding | 0.905022 | 4.648310 |
7.350×10⁻⁴ | 0.053914 | UP |
Hypomethylation |
| CYR61 | protein_coding | 0.857787 | 7.004545 |
4.660×10⁻⁵ | 0.007693 | UP |
Hypomethylation |
| ELANE | protein_coding | 0.820009 | −0.896520 |
5.280×10⁻⁴ | 0.043721 | UP |
Hypomethylation |
| FAM20C | protein_coding | 0.645844 | 7.793972 |
1.160×10⁻⁴ | 0.015224 | UP |
Hypomethylation |
| HAL | protein_coding | 0.860970 | −1.280750 |
5.460×10⁻⁵ | 0.008582 | UP |
Hypomethylation |
| HIC1 | protein_coding | 0.620305 | 2.999093 |
5.230×10⁻⁴ | 0.043431 | UP |
Hypomethylation |
| KRT19 | protein_coding | 0.967123 | −1.356580 |
2.650×10⁻⁴ | 0.027310 | UP |
Hypomethylation |
| LIF | protein_coding | 0.878622 | 4.793528 |
1.020×10⁻³ | 0.066857 | UP |
Hypomethylation |
| LOX | protein_coding | 0.635535 | 5.807618 |
5.588×10⁻³ | 0.190609 | UP |
Hypomethylation |
| PAX3 | protein_coding | 0.704507 | 1.890802 |
3.279×10⁻² | 0.430150 | UP |
Hypomethylation |
| SFRP2 | protein_coding | 1.350652 | 3.849805 |
6.910×10⁻⁵ | 0.010316 | UP |
Hypomethylation |
| SOCS3 | protein_coding | 0.759382 | 6.741612 |
1.930×10⁻⁴ | 0.021922 | UP |
Hypomethylation |
| COMP | protein_coding | 3.352002 | 0.442354 |
9.550×10⁻¹⁴ | 5.78E-10 | UP |
Hypomethylation |
| DLL1 | protein_coding | −1.806420 | 5.384099 |
2.780×10⁻¹² | 6.22E-09 | DOWN |
Hypermethylation |
| Table III.Cox proportional-hazards regression
model analysis of the 15 hub genes. |
Table III.
Cox proportional-hazards regression
model analysis of the 15 hub genes.
| Hub gene | HR | CI | P-value |
|---|
| COMP | 0.972 | 0.848–1.115 | 0.688 |
| DLL1 | 0.860 | 0.703–1.053 | 0.144 |
| CYR61 | 0.978 | 0.776–1.234 | 0.853 |
| HAL | 1.032 | 0.873–1.219 | 0.715 |
| SFRP2 | 0.995 | 0.866–1.143 | 0.947 |
| FAM20C | 0.930 | 0.676–1.279 | 0.656 |
| SOCS3 | 1.308 | 0.975–1.754 | 0.073 |
| KRT19 | 1.003 | 0.868–1.159 | 0.967 |
| HIC1 | 1.085 | 0.784–1.503 | 0.622 |
| ELANE | 1.028 | 0.884–1.196 | 0.722 |
| CYP1B1 | 0.971 | 0.752–1.253 | 0.819 |
| LIF | 0.878 | 0.717–1.074 | 0.206 |
| COL1A1 | 0.928 | 0.712–1.210 | 0.580 |
| LOX | 1.000 | 0.789–1.268 | 0.999 |
| PAX3 | 0.901 | 0.821–0.989 | 0.029 |
Functional enrichment analysis of the
15 hub genes
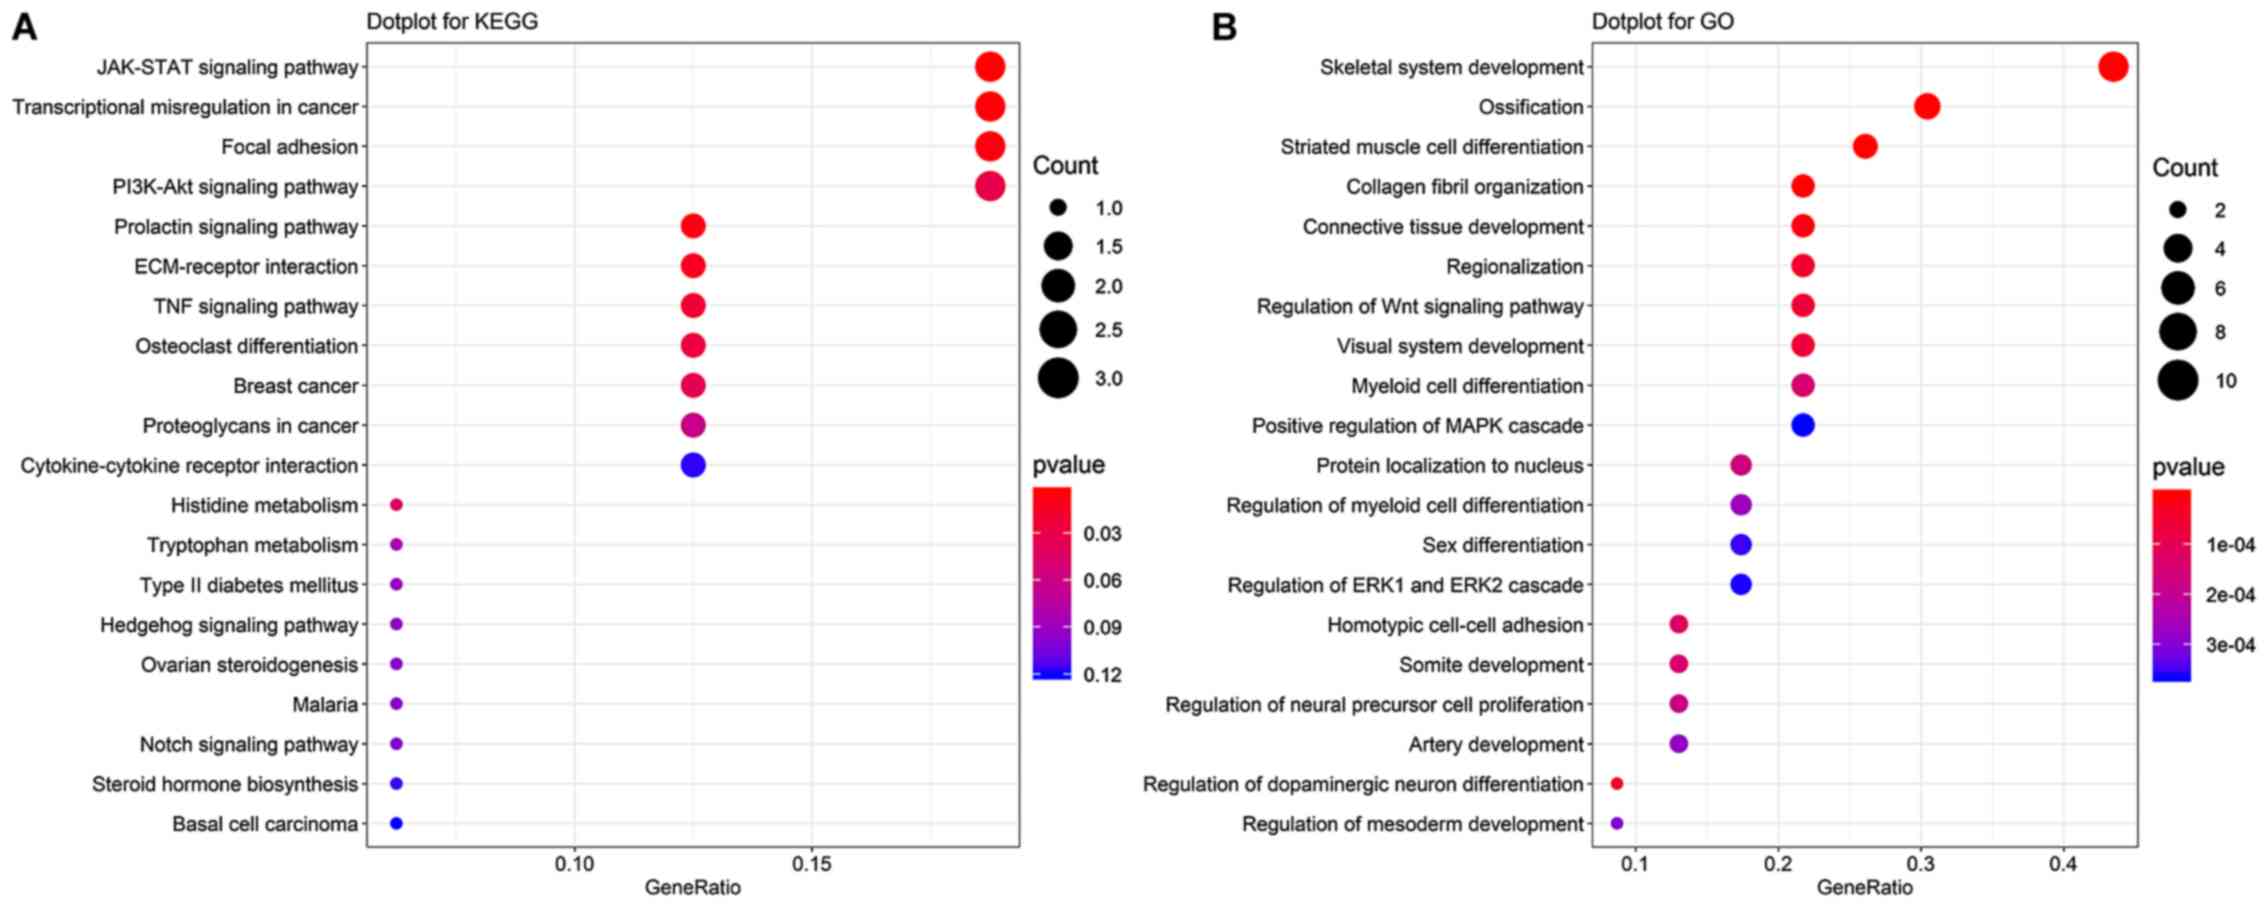
Functional enrichment analyses were performed to
determine the potential biological processes and signaling pathways
enriched by the differentially expressed and methylated genes in
GBM. KEGG pathway analysis demonstrated that the hub genes were
predominantly enriched in the ‘JAK-STAT signaling pathway’,
‘transcriptional misregulation in cancer’, ‘focal adhesion’ and
‘PI3K-Akt signaling pathway’ (Fig.
6A). These pathways have been confirmed to be involved in GBM
development and progression. GO enrichment analysis demonstrated
that these hub genes were predominantly enriched in ‘skeletal
system development’, ‘ossification’ and ‘striated muscle cell
differentiation’ (Fig. 6B).
Discussion
GBM is a brain tumor associated with a poor
prognosis. Despite advancements made in the treatment of GBM, the
median survival time remains <1 year, and few patients survive
>3 years (33,34). In the present study, patients from
TCGA database were divided into two groups, survival time <1
year and survival time ≥1 year, according to the median survival
time. Gene expression and DNA methylation were compared between the
genes in both groups. DNA methylation has been demonstrated to be
associated with survival outcome via changes in gene expression
(35). A previous study of GBM used
a joint analysis method of DNA methylation and changes in gene
expression to identify prognostic biomarkers for patients with GBM
(36). The hypermethylation or
hypomethylation of DEGs has a major impact on the development and
progression of different types of tumor, either acting as oncogenes
or anticancer genes. The current study successfully presented a
number of genes that were significantly modulated by DNA
methylation.
In the present study, KEGG pathway enrichment
analysis demonstrated that the differentially expressed and
methylated genes were predominantly enriched in the ‘JAK-STAT
signaling pathway’. Along with the ‘JAK-STAT signaling pathway’,
‘transcriptional misregulation in cancer’ and ‘ECM-receptor
interaction’ have been confirmed to serve a critical role in GBM
development (37–41). GO enrichment analysis demonstrated
that these genes were predominantly enriched in ‘cell fate
determination’, ‘collagen fibril organization’ and ‘collagen
biosynthetic process’, which may contribute to GBM development
(42–45).
Cancer involves a complex regulatory network and the
integration of multiple biomarkers into an aggregation model can
improve the prognostic value compared with a single biomarker
(46). For example, the expression
of transmembrane protein 41A is associated with metastasis by
modulating E-cadherin in radically resected gastric cancer
(47). In the present study, 24 hub
genes were identified by overlapping the top 30 genes within four
local-based methods (DMNC, MNC, MCC and degree), in the Cytoscape
plug-in cytoHubba. Among the 24 hub genes, 15 possessed potential
prognostic value between patients who experienced longer survival
times and patients who experienced shorter survival times. The
hypomethylated genes expressed at high levels, including COL1A1,
CYP1B1, CYR61, ELANE, FAM20C, HAL, HIC1, KRT19, LIF, LOX, PAX3,
SFRP2 and SOCS3, were associated with a poor prognosis of GBM.
Furthermore, the hypermethylated DLL1 gene and hypomethylated COMP
gene, expressed at low levels, were demonstrated to have worse
clinical outcomes. Among the 15 hub genes corresponding with
candidate CpG sites, 7 have been reported as GBM-associated genes.
For example, COL1A1 has the potential to stratify patients with GBM
into subgroups, to determine the risk of recurrence (48). Overexpression of CYR61 has been
reported to enhance the tumorigenicity of glioma cells and
stimulate the β-catenin-TCF/Lef and Akt signaling pathways via the
activation of integrin-linked kinase (49,50).
Furthermore, LIF possesses a self-renewal capacity that prevents
the differentiation of glioma-initiating cells (51). As an evolutionarily conserved
metabolic gene, LOX is involved in gliomagenesis (52). PAX3 is overexpressed in GBM and
strictly regulates the tumorigenicity of glioma cells (53). The transcriptional inhibition of p53
by PAX3 may contribute to glioma formation and the differentiation
of glioma stem cells (54). The
hypermethylation of SFRP2 occurs in >40% of primary GBMs
(55,56). A previous study demonstrated that
patients with hypermethylated SOCS3 were associated with a
significantly poor prognosis compared with healthy controls
(57). However, the results of the
present study demonstrated that patients with hypomethylated SOCS3
at low levels had a shorter survival time compared with patients
with hypermethylated SOCS3 at high levels Thus, further research is
required in order to clarify these inconsistencies.
Overall, the present study identified 15 prognostic
biomarkers for GBM based on DNA methylation and mRNA expression
levels, including COL1A1, CYP1B1, CYR61, ELANE, FAM20C, HAL, HIC1,
KRT19, LIF, LOX, PAX3, SFRP2, SOCS3, COMP and DLL1. The results of
the current study demonstrated that these genes are regulated by
aberrant methylation, which could serve a crucial role in GBM.
These genes have the potential to serve as candidate prognostic
biomarkers and therapeutic targets in GBM; however, the results
require validation within larger cohorts to evaluate their
potential as biomarkers in GBM. Furthermore, future studies are
required to determine the molecular mechanisms underlying these
genes.
The present study implemented an integrative
analysis approach to analyze DNA methylation with changes in gene
expression and assess the association of gene expression changes
with GBM survival time. A total of 15 CpG-based genes were
identified to possess potential value to predict the prognosis of
patients with GBM. However, future studies are required on these
gene methylation and/or gene expression biomarkers to develop
personalized treatments for patients with GBM.
There are a number of limitations associated with
the present study. GBM isocitrate dehydrogenase (IDH)-wild-type is
the most common astrocytic glioma (58). Thus, existing prognostic factors for
this type of tumor should commonly be used for comparative analysis
of novel prognostic factors for GBM. However, there are currently
no available data within TCGA cohorts. Thus, the present study
lacks comparative analyses between the status of IDH-1/2 genes and
the 15 CpG-based genes. Furthermore, although GBM-specific
prognostic biomarkers were identified via integrative analysis of
DNA methylation and gene expression, the present study lacks
validation by functional studies both in vitro and in
vivo.
Supplementary Material
Supporting Data
Acknowledgements
Not applicable.
Funding
The present study was funded by The Health Care of
Yellow Crane Talent Plan (grant no. 17).
Availability of data and materials
The datasets generated and/or analyzed during the
current study are available in the TCGA repository (https://portal.gdc.cancer.gov/).
Authors' contributions
LC, YM and ZL designed the present study and
reviewed the manuscript. ZL acquired the data, YM interpreted the
data, and YM and ZL analyzed the data. YM drafted the initial
manuscript. All authors read and approved the final manuscript.
Ethics approval and consent to
participate
Not applicable.
Patient consent for publication
Not applicable.
Competing interests
The authors declare that they have no competing
interest.
Glossary
Abbreviations
Abbreviations:
|
GBM
|
glioblastoma
|
|
TCGA
|
The Cancer Genome Atlas
|
|
PPI
|
protein-protein interaction
|
|
KEGG
|
Kyoto Encyclopedia of Genes and
Genomes
|
|
GO
|
Gene Ontology
|
|
MNC
|
maximum neighborhood component
|
|
DMNC
|
density of MNC
|
|
MCC
|
maximal clique centrality
|
References
|
1
|
Jackson CM, Choi J and Lim M: Mechanisms
of immunotherapy resistance: Lessons from glioblastoma. Nat
Immunol. 20:1100–1109. 2019. View Article : Google Scholar : PubMed/NCBI
|
|
2
|
Lu VM, Jue TR, McDonald KL and Rovin RA:
The survival effect of repeat surgery at glioblastoma recurrence
and its trend: A systematic review and meta-analysis. World
Neurosurg. 115:453–459. 2018. View Article : Google Scholar : PubMed/NCBI
|
|
3
|
Brandao M, Simon T, Critchley G and Giamas
G: Astrocytes, the rising stars of the glioblastoma
microenvironment. Glia. 67:779–790. 2019. View Article : Google Scholar : PubMed/NCBI
|
|
4
|
Saadatpour L, Fadaee E, Fadaei S, Mansour
RN, Mohammadi M, Mousavi SM, Goodarzi M, Verdi J and Mirzaei H:
Glioblastoma: Exosome and microRNA as novel diagnosis biomarkers.
Cancer Gene Ther. 23:415–418. 2016. View Article : Google Scholar : PubMed/NCBI
|
|
5
|
Brandes AA, Franceschi E, Paccapelo A,
Tallini G, Biase DD, Ghimenton C, Danieli D, Zunarelli E, Lanza G,
Silini EM, et al: Role of MGMT methylation status at time of
diagnosis and recurrence for patients with glioblastoma: Clinical
implications. Oncologist. 22:432–437. 2017. View Article : Google Scholar : PubMed/NCBI
|
|
6
|
Jhanwar-Uniyal M, Amin AG, Cooper JB, Das
K, Schmidt MH and Murali R: Discrete signaling mechanisms of mTORC1
and mTORC2: Connected yet apart in cellular and molecular aspects.
Adv Biol Regul. 64:39–48. 2017. View Article : Google Scholar : PubMed/NCBI
|
|
7
|
Jhanwar-Uniyal M, Wainwright JV, Mohan AL,
Tobias ME, Murali R, Gandhi CD and Schmidt MH: Diverse signaling
mechanisms of mTOR complexes: MTORC1 and mTORC2 in forming a
formidable relationship. Adv Biol Regul. 72:51–62. 2019. View Article : Google Scholar : PubMed/NCBI
|
|
8
|
Klughammer J, Kiesel B, Roetzer T,
Fortelny N, Nemc A, Nenning KH, Furtner J, Sheffield NC, Datlinger
P, Peter N, et al: The DNA methylation landscape of glioblastoma
disease progression shows extensive heterogeneity in time and
space. Nat Med. 24:1611–1624. 2018. View Article : Google Scholar : PubMed/NCBI
|
|
9
|
Tan SK, Pastori C, Penas C, Komotar RJ,
Ivan ME, Wahlestedt C and Ayad NG: Serum long noncoding RNA HOTAIR
as a novel diagnostic and prognostic biomarker in glioblastoma
multiforme. Mol Cancer. 17:742018. View Article : Google Scholar : PubMed/NCBI
|
|
10
|
Li X and Diao H: Circular RNA circ_0001946
acts as a competing endogenous RNA to inhibit glioblastoma
progression by modulating miR-671-5p and CDR1. J Cell Physiol.
234:13807–13819. 2019. View Article : Google Scholar : PubMed/NCBI
|
|
11
|
Zhao H, Shen J, Hodges TR, Song R, Fuller
GN and Heimberger AB: Serum microRNA profiling in patients with
glioblastoma: A survival analysis. Mol Cancer. 16:592017.
View Article : Google Scholar : PubMed/NCBI
|
|
12
|
Shajani-Yi Z, de Abreu FB, Peterson JD and
Tsongalis GJ: Frequency of somatic TP53 mutations in combination
with known pathogenic mutations in colon adenocarcinoma, non-small
cell lung carcinoma, and gliomas as identified by next-generation
sequencing. Neoplasia. 20:256–262. 2018. View Article : Google Scholar : PubMed/NCBI
|
|
13
|
Chen X, Zhang M, Gan H, Wang H, Lee JH,
Fang D, Kitange GJ, He L, Hu Z, Parney IF, et al: A novel enhancer
regulates MGMT expression and promotes temozolomide resistance in
glioblastoma. Nat Commun. 9:29492018. View Article : Google Scholar : PubMed/NCBI
|
|
14
|
Kessler T, Sahm F, Sadik A, Stichel D,
Hertenstein A, Reifenberger G, Zacher A, Sabel M, Tabatabai G,
Steinbach J, et al: Molecular differences in IDH wildtype
glioblastoma according to MGMT promoter methylation. Neuro Oncol.
20:367–379. 2018. View Article : Google Scholar : PubMed/NCBI
|
|
15
|
Cloughesy T, Finocchiaro G, Belda-Iniesta
C, Recht L, Brandes AA, Pineda E, Mikkelsen T, Chinot OL, Balana C,
Macdonald DR, et al: Randomized, double-blind, placebo-controlled,
multicenter phase II study of onartuzumab plus bevacizumab versus
placebo plus bevacizumab in patients with recurrent glioblastoma:
Efficacy, safety, and hepatocyte growth factor and
O6-Methylguanine-DNA methyltransferase biomarker analyses. J Clin
Oncol. 35:343–351. 2017. View Article : Google Scholar : PubMed/NCBI
|
|
16
|
Arantes LM, de Carvalho AC, Melendez ME,
Carvalho AL and Goloni-Bertollo EM: Methylation as a biomarker for
head and neck cancer. Oral Oncol. 50:587–592. 2014. View Article : Google Scholar : PubMed/NCBI
|
|
17
|
Anastasiadi D, Esteve-Codina A and
Piferrer F: Consistent inverse correlation between DNA methylation
of the first intron and gene expression across tissues and species.
Epigenetics Chromatin. 11:372018. View Article : Google Scholar : PubMed/NCBI
|
|
18
|
Portela A and Esteller M: Epigenetic
modifications and human disease. Nat Biotechnol. 28:1057–1068.
2010. View
Article : Google Scholar : PubMed/NCBI
|
|
19
|
Li R, Qu H, Wang S, Wei J, Zhang L, Ma R,
Lu J, Zhu J, Zhong WD and Jia Z: GDCRNATools: An R/bioconductor
package for integrative analysis of lncRNA, miRNA and mRNA data in
GDC. Bioinformatics. 34:2515–2517. 2018. View Article : Google Scholar : PubMed/NCBI
|
|
20
|
Robinson MD and Oshlack A: A scaling
normalization method for differential expression analysis of
RNA-seq data. Genome Biol. 11:R252010. View Article : Google Scholar : PubMed/NCBI
|
|
21
|
Weinhold L, Wahl S, Pechlivanis S,
Hoffmann P and Schmid M: A statistical model for the analysis of
beta values in DNA methylation studies. BMC Bioinformatics.
17:4802016. View Article : Google Scholar : PubMed/NCBI
|
|
22
|
Robinson MD, McCarthy DJ and Smyth GK:
EdgeR: A bioconductor package for differential expression analysis
of digital gene expression data. Bioinformatics. 26:139–140. 2010.
View Article : Google Scholar : PubMed/NCBI
|
|
23
|
Tseng GC: Penalized and weighted K-means
for clustering with scattered objects and prior information in
high-throughput biological data. Bioinformatics. 23:2247–2255.
2007. View Article : Google Scholar : PubMed/NCBI
|
|
24
|
Morris TJ, Butcher LM, Feber A,
Teschendorff AE, Chakravarthy AR, Wojdacz TK and Beck S: ChAMP: 450
k chip analysis methylation pipeline. Bioinformatics. 30:428–430.
2014. View Article : Google Scholar : PubMed/NCBI
|
|
25
|
Chen YA, Lemire M, Choufani S, Butcher DT,
Grafodatskaya D, Zanke BW, Gallinger S, Hudson TJ and Weksberg R:
Discovery of cross-reactive probes and polymorphic CpGs in the
illumina infinium humanmethylation450 microarray. Epigenetics.
8:203–209. 2013. View Article : Google Scholar : PubMed/NCBI
|
|
26
|
Teschendorff AE, Marabita F, Lechner M,
Bartlett T, Tegner J, Cabrero DG and Beck S: A beta-mixture
quantile normalization method for correcting probe design bias in
illumina infinium 450 k DNA methylation data. Bioinformatics.
29:189–196. 2013. View Article : Google Scholar : PubMed/NCBI
|
|
27
|
Szklarczyk D, Morris JH, Cook H, Kuhn M,
Wyder S, Simonovic M, Santos A, Doncheva NT, Roth A, Bork P, et al:
The STRING database in 2017: Quality-controlled protein-protein
association networks, made broadly accessible. Nucleic Acids Res.
45(D1): D362–D368. 2017. View Article : Google Scholar : PubMed/NCBI
|
|
28
|
Shannon P, Markiel A, Ozier O, Baliga NS,
Wang JT, Ramage D, Amin N, Schwikowski B and Ideker T: Cytoscape: A
software environment for integrated models of biomolecular
interaction networks. Genome Res. 13:2498–2504. 2003. View Article : Google Scholar : PubMed/NCBI
|
|
29
|
Yu G, Wang LG, Han Y and He QY:
clusterProfiler: An R package for comparing biological themes among
gene clusters. OMICS. 16:284–287. 2012. View Article : Google Scholar : PubMed/NCBI
|
|
30
|
Kanehisa M and Goto S: KEGG: Kyoto
encyclopedia of genes and genomes. Nucleic Acids Res. 28:27–30.
2000. View Article : Google Scholar : PubMed/NCBI
|
|
31
|
Bindea G, Mlecnik B, Hackl H, Charoentong
P, Tosolini M, Kirilovsky A, Fridman WH, Pagès F, Trajanoski Z and
Galon J: ClueGO: A cytoscape plug-in to decipher functionally
grouped gene ontology and pathway annotation networks.
Bioinformatics. 25:1091–1093. 2009. View Article : Google Scholar : PubMed/NCBI
|
|
32
|
Chin CH, Chen SH, Wu HH, Ho CW, Ko MT and
Lin CY: cytoHubba: Identifying hub objects and sub-networks from
complex interactome. BMC Syst Biol. 8 (Suppl 4):S112014. View Article : Google Scholar : PubMed/NCBI
|
|
33
|
Woehrer A, Bauchet L and Barnholtz-Sloan
JS: Glioblastoma survival: Has it improved? Evidence from
population-based studies. Curr Opin Neurol. 27:666–674.
2014.PubMed/NCBI
|
|
34
|
Ramos AR, Elong Edimo W and Erneux C:
Phosphoinositide 5-phosphatase activities control cell motility in
glioblastoma: Two phosphoinositides PI(4,5)P2 and PI(3,4)P2 are
involved. Adv Biol Regul. 67:40–48. 2018. View Article : Google Scholar : PubMed/NCBI
|
|
35
|
Etcheverry A, Aubry M, de Tayrac M,
Vauleon E, Boniface R, Guenot F, Saikali S, Hamlat A, Riffaud L,
Menei P, et al: DNA methylation in glioblastoma: Impact on gene
expression and clinical outcome. BMC Genomics. 11:7012010.
View Article : Google Scholar : PubMed/NCBI
|
|
36
|
Smith AA, Huang YT, Eliot M, Houseman EA,
Marsit CJ, Wiencke JK and Kelsey KT: A novel approach to the
discovery of survival biomarkers in glioblastoma using a joint
analysis of DNA methylation and gene expression. Epigenetics.
9:873–883. 2014. View Article : Google Scholar : PubMed/NCBI
|
|
37
|
Senft C, Priester M, Polacin M, Schröder
K, Seifert V, Kögel D and Weissenberger J: Inhibition of the
JAK-2/STAT3 signaling pathway impedes the migratory and invasive
potential of human glioblastoma cells. J Neurooncol. 101:393–403.
2011. View Article : Google Scholar : PubMed/NCBI
|
|
38
|
Mukthavaram R, Ouyang X, Saklecha R, Jiang
P, Nomura N, Pingle SC, Guo F, Makale M and Kesari S: Effect of the
JAK2/STAT3 inhibitor SAR317461 on human glioblastoma tumorspheres.
J Transl Med. 13:2692015. View Article : Google Scholar : PubMed/NCBI
|
|
39
|
Park AK, Kim P, Ballester LY, Esquenazi Y
and Zhao Z: Subtype-specific signaling pathways and genomic
aberrations associated with prognosis of glioblastoma. Neuro Oncol.
21:59–70. 2019. View Article : Google Scholar : PubMed/NCBI
|
|
40
|
Nawaz Z, Patil V, Paul Y, Hegde AS,
Arivazhagan A, Santosh V and Somasundaram K: PI3 kinase pathway
regulated miRNome in glioblastoma: Identification of miR-326 as a
tumour suppressor miRNA. Mol Cancer. 15:742016. View Article : Google Scholar : PubMed/NCBI
|
|
41
|
Agrawal R, Garg A, Benny Malgulwar P,
Sharma V, Sarkar C and Kulshreshtha R: P53 and miR-210 regulated
NeuroD2, a neuronal basic helix-loop-helix transcription factor, is
downregulated in glioblastoma patients and functions as a tumor
suppressor under hypoxic microenvironment. Int J Cancer.
142:1817–1828. 2018. View Article : Google Scholar : PubMed/NCBI
|
|
42
|
Park NI, Guilhamon P, Desai K, McAdam RF,
Langille E, O'Connor M, Lan X, Whetstone H, Coutinho FJ, Vanner RJ,
et al: ASCL1 reorganizes chromatin to direct neuronal fate and
suppress tumorigenicity of glioblastoma stem cells. Cell Stem Cell.
21:209–224. 2017. View Article : Google Scholar : PubMed/NCBI
|
|
43
|
John S, Sivakumar KC and Mishra R:
Extracellular proton concentrations impacts ln229 glioblastoma
tumor cell fate via differential modulation of surface lipids.
Front Oncol. 7:202017. View Article : Google Scholar : PubMed/NCBI
|
|
44
|
Mammoto T, Jiang A, Jiang E, Panigrahy D,
Kieran MW and Mammoto A: Role of collagen matrix in tumor
angiogenesis and glioblastoma multiforme progression. Am J Pathol.
183:1293–1305. 2013. View Article : Google Scholar : PubMed/NCBI
|
|
45
|
Liu J, Li W, Liu S, Zheng X, Shi L, Zhang
W and Yang H: Knockdown of collagen triple helix repeat containing
1 (CTHRC1) inhibits epithelial-mesenchymal transition and cellular
migration in glioblastoma cells. Oncol Res. 25:225–232. 2017.
View Article : Google Scholar : PubMed/NCBI
|
|
46
|
Ng SW, Mitchell A, Kennedy JA, Chen WC,
McLeod J, Ibrahimova N, Arruda A, Popescu A, Gupta V, Schimme AD,
et al: A 17-gene stemness score for rapid determination of risk in
acute leukaemia. Nature. 540:433–437. 2016. View Article : Google Scholar : PubMed/NCBI
|
|
47
|
Lin B, Xue Y, Qi C, Chen X and Mao W:
Expression of transmembrane protein 41A is associated with
metastasis via the modulation of E-cadherin in radically resected
gastric cancer. Mol Med Rep. 18:2963–2972. 2018.PubMed/NCBI
|
|
48
|
Balbous A, Cortes U, Guilloteau K,
Villalva C, Flamant S, Gaillard A, Milin S, Wager M, Sorel N,
Guilhot J, et al: A mesenchymal glioma stem cell profile is related
to clinical outcome. Oncogenesis. 3:e912014. View Article : Google Scholar : PubMed/NCBI
|
|
49
|
Xie D, Yin D, Tong X, O'Kelly J, Mori A,
Miller C, Black K, Gui D, Said JW and Koeffler HP: Cyr61 is
overexpressed in gliomas and involved in integrin-linked
kinase-mediated akt and beta-catenin-TCF/Lef signaling pathways.
Cancer Res. 64:1987–1996. 2004. View Article : Google Scholar : PubMed/NCBI
|
|
50
|
Jeansonne D, Pacifici M, Lassak A, Reiss
K, Russo G, Zabaleta J and Peruzzi F: Differential effects of
microRNAs on glioblastoma growth and migration. Genes (Basel).
4:46–64. 2013. View Article : Google Scholar : PubMed/NCBI
|
|
51
|
Peñuelas S, Anido J, Prieto-Sánchez RM,
Folch G, Barba I, Cuartas I, Dorado DG, Poca MA, Sahuquillo J,
Baselga J and Seoane J: TGF-beta increases glioma-initiating cell
self-renewal through the induction of LIF in human glioblastoma.
Cancer Cell. 15:315–327. 2009. View Article : Google Scholar : PubMed/NCBI
|
|
52
|
Chi KC, Tsai WC, Wu CL, Lin TY and Hueng
DY: An adult drosophila glioma model for studying pathometabolic
pathways of gliomagenesis. Mol Neurobiol. 56:4589–4599. 2018.
View Article : Google Scholar : PubMed/NCBI
|
|
53
|
Xia L, Huang Q, Nie D, Shi J, Gong M, Wu
B, Gong P, Zha L, Zuo H, Ju S, et al: PAX3 is overexpressed in
human glioblastomas and critically regulates the tumorigenicity of
glioma cells. Brain Res. 1521:68–78. 2013. View Article : Google Scholar : PubMed/NCBI
|
|
54
|
Zhu H, Wang H, Huang Q, Liu Q, Guo Y, Lu
J, Li X, Xue C and Han Q: Transcriptional repression of p53 by PAX3
contributes to gliomagenesis and differentiation of glioma stem
cells. Front Mol Neurosci. 11:1872018. View Article : Google Scholar : PubMed/NCBI
|
|
55
|
Götze S, Wolter M, Reifenberger G, Müller
O and Sievers S: Frequent promoter hypermethylation of Wnt pathway
inhibitor genes in malignant astrocytic gliomas. Int J Cancer.
126:2584–2593. 2010.PubMed/NCBI
|
|
56
|
Stricker SH, Feber A, Engström PG, Carén
H, Kurian KM, Takashima Y, Watts C, Way M, Dirks P, Bertone P, et
al: Widespread resetting of DNA methylation in
glioblastoma-initiating cells suppresses malignant cellular
behavior in a lineage-dependent manner. Genes Dev. 27:654–669.
2013. View Article : Google Scholar : PubMed/NCBI
|
|
57
|
Martini M, Pallini R, Luongo G, Cenci T,
Lucantoni C and Larocca LM: Prognostic relevance of SOCS3
hypermethylation in patients with glioblastoma multiforme. Int J
Cancer. 123:2955–2960. 2008. View Article : Google Scholar : PubMed/NCBI
|
|
58
|
Wirsching HG, Galanis E and Weller M:
Glioblastoma. Handb Clin Neurol. 134:381–397. 2016. View Article : Google Scholar : PubMed/NCBI
|