Introduction
Edible fungi polysaccharides are a type of active
substances that are separated from fruiting bodies, mycelia and
fermentation broth of edible and medicinal fungi that serve a role
in cell metabolism (1,2). They are natural macromolecule polymers
composed of >10 monosaccharides linked by glycoside bonds
(3). Previous studies have
demonstrated that polysaccharides from edible fungi can have
biological activities, such as having antitumor, anti-viral,
anti-oxidation and anti-ageing functions, regulating the immune
function, improving myocardial protection and lowering blood sugar
and lipids (4–7).
Structure determines function, and therefore the
complexity of the polysaccharide structure poses a difficulty in
research. Polysaccharides can vary in the arrangement of
monosaccharides, which can be linked in numerous ways to form
polysaccharides. Additionally, there can be multiple branches at
different locations in the main polysaccharide chain, as well as
different monosaccharide compositions and connection types on
branches (8). Furthermore,
monosaccharides can form high-level spatial structures (9). Therefore, it is of great scientific
importance to analyze the structure and activity of
polysaccharides.
Ramaria flaccida (Fr.) Quél., also known as
broom fungi, is a common fungus, belongs to the Ramariaceae
family. The fruiting bodies are of medium size (height, 2–5 cm;
branch thickness, 0.3–0.5 cm), with branches forming dense twigs;
stems are short, usually branched from the base of the stipe, and
the fungi grow on the deciduous layer or dead branches of the
ground in broad-leaved or coniferous forests in summer and autumn
(10). The fungi contain a variety
of carbohydrates, amino acids and trace elements that are
beneficial to the human body (7).
However, research on Ramaria flaccida (Fr.) Quél. has been
limited to its resource investigation, identification and
classification, liquid culture, extraction technology of
macromolecule substances and chemical composition (11,12). The
fruiting bodies of Ramaria flaccida (Fr.) Quél are edible;
additionally, this fungus can be used as an indicator of air
pollution, which has a great economic value (11,12). To
the best of our knowledge, the structure analysis and antitumor
activity of pure polysaccharides from Ramaria flaccida (Fr.)
Quél. have not yet been reported.
In order to identify a novel polysaccharide with
good antitumor activity, in the present study purified
polysaccharides were obtained from Ramaria flaccida (Fr.)
Quél. (RF-1) by hot-water extraction, the Sevage method, and by
diethylaminoethyl (DEAE)-52 cellulose chromatography.
High-performance gel permeation chromatography (HPGPC), gas
chromatography-mass spectrometry (GC-MS) and nuclear magnetic
resonance (NMR) were used to identify the polysaccharide structure.
The antitumor activity of RF-1 was investigated by establishing an
in vivo S180 tumor model. The transcriptomes of tumor
tissues in the blank control group and RF-1 group were sequenced
using Illumina sequencing. The present study may help to exploit
and utilize the polysaccharide resources from Ramaria flaccida
(Fr.) Quél., and may provide a theoretical reference for
further study of its antitumor mechanism and economic value.
Materials and methods
Materials
The fruiting bodies of Ramaria flaccida (Fr.)
Quél. were collected from the Xiaojin County, Aba Tibetan and Qiang
Autonomous Prefecture, Sichuan, China, for which specific
permission was not required due to it being an open village in
China. The field studies did not involve endangered or protected
species, since the endangered or protected species protection zone
was not accessed for sampling. DEAE-52 Cellulose Column was
purchased from Shenyang Shengxing Biotechnology Co., Ltd. RIPA
lysis buffer was purchased from Beyotime Institute of
Biotechnology. Anhydrous sodium sulfate and potassium bromide were
purchased from Sangon Biotech Co., Ltd. Trifluoroacetic acid,
acetonitrile, methanol, iodomethane, chloroform and anhydrous
pyridine were purchased from Xuzhou Maoyang Chemical Co., Ltd. The
experimental reagents were all analytical reagents. Tumor necrosis
factor (TNF)α, interleukin (IL)-6, IL-1β, vascular endothelial
growth factor (VEGF) and VEGF receptor (VEGFR) enzyme-linked
immunosorbent assay (ELISA) kits were purchased from R&D
Systems China Co., Ltd. The signaling pathways were drawn using
Pathway Builder Tool 2.0 (http://www.proteinlounge.com/PathwayBuilder.aspx).
Isolation and extraction of
polysaccharides from Ramaria flaccida (Fr.) Quél
The fruiting bodies of Ramaria flaccida (Fr.)
Quél. were accurately weighed at 500 g. After being dried and
crushed, distilled water was added to the fruiting body powder at a
ratio of 1:30 (g/ml) and boiled for 3 h in a constant temperature
water bath at 100°C. After being centrifuged at 16,670 × g for 15
min at 4°C., the supernatant was collected and concentrated to 200
ml (13). Subsequently, the proteins
in the concentrated supernatant were removed by the Sevage method
(14). Finally, 3 times the volume
of anhydrous ethanol was added and stirred to produce flocculent
precipitates. The crude polysaccharide of Ramaria flaccida
(Fr.) Quél was obtained by precipitation and dissolved in 200
ml distilled water. A total of 3 ml crude polysaccharide solution
was added to a DEAE-52 cellulose column, and 150 ml distilled water
was used at a flow rate of 5 ml/min to obtain the eluent. The
eluent was concentrated to 5 ml and subsequently lyophilized, after
removing small-molecule compounds using dialysis bags (15). Finally, the purified polysaccharide
of Ramaria flaccida (Fr.) Quél was obtained and named
RF-1.
Determination of the molecular weight
of RF-1 using HPGPC
The molecular weight of RF-1 was determined using
HPGPC, as previously described (16). The data are analyzed using the GPC
software (Agilent Empower Pro GPC Data Analysis Software for
Agilent ChemStation; version B.01.02; Agilent Technologies Inc.).
The standard dextran with known molecular weight was used as the
molecular weight reference substance of polysaccharide.
Analysis of RF-1 structure by
GC-MS
Samples of polysaccharides were weighed at 25 mg,
and 2 ml anhydrous dimethyl sulfoxide was added to fully dissolve
them. Subsequently, 400 mg pre-dried sodium hydroxide powder was
added, dissolved under ultrasound for 10 min and stirred for 1 h at
room temperature. Finally, 1.5 ml iodomethane was added, and 5 ml
distilled water was added to terminate the reaction. The product
was extracted with chloroform. The methylated polysaccharides were
hydrolyzed using trifluoroacetic acid and washed 3 times to obtain
the products of complete acid hydrolysis of methylated
polysaccharides (17). A total of 2
ml anhydrous pyridine, 2 ml hexamethyl-disilazane and 1 ml
chlorotrimethylsilane were in turn added to the aforementioned
samples. The reaction time was 20 min at 50°C. After centrifugation
at 16,670 × g for 20 min at 4°C., the upper solution was used for
GC-MS analysis as previously described (18).
NMR analysis
Polysaccharide samples of 10 mg (for 1H
NMR) and 50 mg (for 13C NMR) were collected. After
dissolving the samples with 0.5 ml deuterium oxide, the spectra of
1H NMR, 13C NMR, 1H-1H
correlated spectrometry (1H-1H COSY),
heteronuclear multiple quantum correlation (HMQC) and heteronuclear
multiple bond correlation (HMBC) were measured using an NMR
spectrometer. Tetramethylsilane was used as an internal standard
(19). The novelty of polysaccharide
structure was analyzed by searching on the SciFinder database
(20).
Antitumor activity of RF-1 in
vivo
The mouse sarcoma S180 cell line was purchased from
The Cell Bank of Type Culture Collection of the Chinese Academy of
Sciences. S180 cells were cultured in RPMI-1640 medium (Thermo
Fisher Scientific, Inc.) supplemented with 10% inactivated FBS
(Invitrogen; Thermo Fisher Scientific, Inc.), 100 µg/ml penicillin
and 100 µg/ml streptomycin at 37°C with 5% CO2 and were
sub-cultured every 2 days. Kunming strain female mice obtained from
the Institute of Biochemistry and Molecular Immunology of North
Sichuan Medical College (Nanchong, China) were inoculated with 100
µl S180 tumor cells at a concentration of 3×10⁶ CFU/ml
under the left axillary skin. The Kunming strain mice (age, 4–6
weeks) weighed 25.0±1.0 g and were divided into three groups, with
5 mice in each group, and 5 mice were housed per plastic cage with
wood chip bedding in an animal room with a 12-h light and 12-h dark
cycle at room temperature (25±2°C), with free access to standard
laboratory diet. After 7 days, each mouse was treated with 20 mg/kg
RF-1 (RF-1 group) or 20 mg/kg mannatide (positive control group)
for 7 consecutive days (21). The
mice were sacrificed under anesthesia using 100 mg/kg ketamine and
15 mg/kg xylazine. The respiration, cardiac function, corneal
reflex, muscle tone and mucous membrane color were checked to
verify the death of the mice in the present study. The following
formula was used to calculate tumor volume: V=(length ×
width2)/2 (22). The
tumor inhibition rate was calculated as follows: Tumor inhibition
rate (%)=[(A-B)/A] ×100, with A and B being the average tumor
weight of the blank control group and treated group, respectively
(21). The animal experiments were
conducted according to the Guidelines for Animal Experimentation of
the North Sichuan Medical College of China, which were revised
according to the Regulations on the Administration of Experimental
Animals of the People's Republic of China (decree no. The Second
Commission of the People's Republic of China of Science and
Technology Commission). The experimental protocols were approved by
the North Sichuan Medical College of China.
RNA extraction, library preparation
and sequencing
Total RNA of tumor tissues was extracted using the
TRIzol® reagent kit (Invitrogen, Thermo Fisher
Scientific, Inc.), according to the manufacturer's protocol. After
the samples were quantified, the library was constructed and
checked, and subsequently sequenced using an Illumina Hiseq
platform (23,24). Genes with an adjusted P<0.05
identified by DESeq2 (25,26) were classified as differentially
expressed. Subsequently, the clusterProfiler R package (27) was used for Gene Ontology (GO)
analysis and Kyoto Encyclopedia of Genes and Genomes (KEGG)
pathways analysis (27,28). Differentially expressed genes were
analyzed using the edgeR program (version 3.11) (29).
Effect of RF-1 on the expression
levels of IL-1β, IL-6, TNFα, VEGFR and VEGF in mice tumor
tissues
Tumor tissues were cut and collected into 1.5 ml
Eppendorf tubes. After adding 300 µl cell lysis solution (Thermo
Fisher Scientific, Inc.) containing phosphatase inhibitors (Thermo
Fisher Scientific, Inc.) and phenylmethylsulfonyl fluoride to each
tube, tissues were ground on ice and beaten into homogenates at 0°C
for 30 min. After centrifugation at 16,670 × g at 4°C for 20 min,
the supernatant was collected into new tubes. The samples were
tested using the IL-1β (cat. no. MAB401), IL-6 (cat. no. DY206),
TNFα (cat. no. MAB6902), VEGFR (cat. no. DVR100C) and VEGF (cat.
no. 493-MV) ELISA kits.
Statistical analysis
All data are presented as the mean ± SD (n=5), and
SPSS v17 software (SPSS, Inc.) was used to analyze the differences
between the blank control group and the experimental groups using
one-way ANOVA followed by Dunnett's test. P<0.05 was considered
to indicate a statistically significant difference.
Results
Molecular weight analysis of RF-1
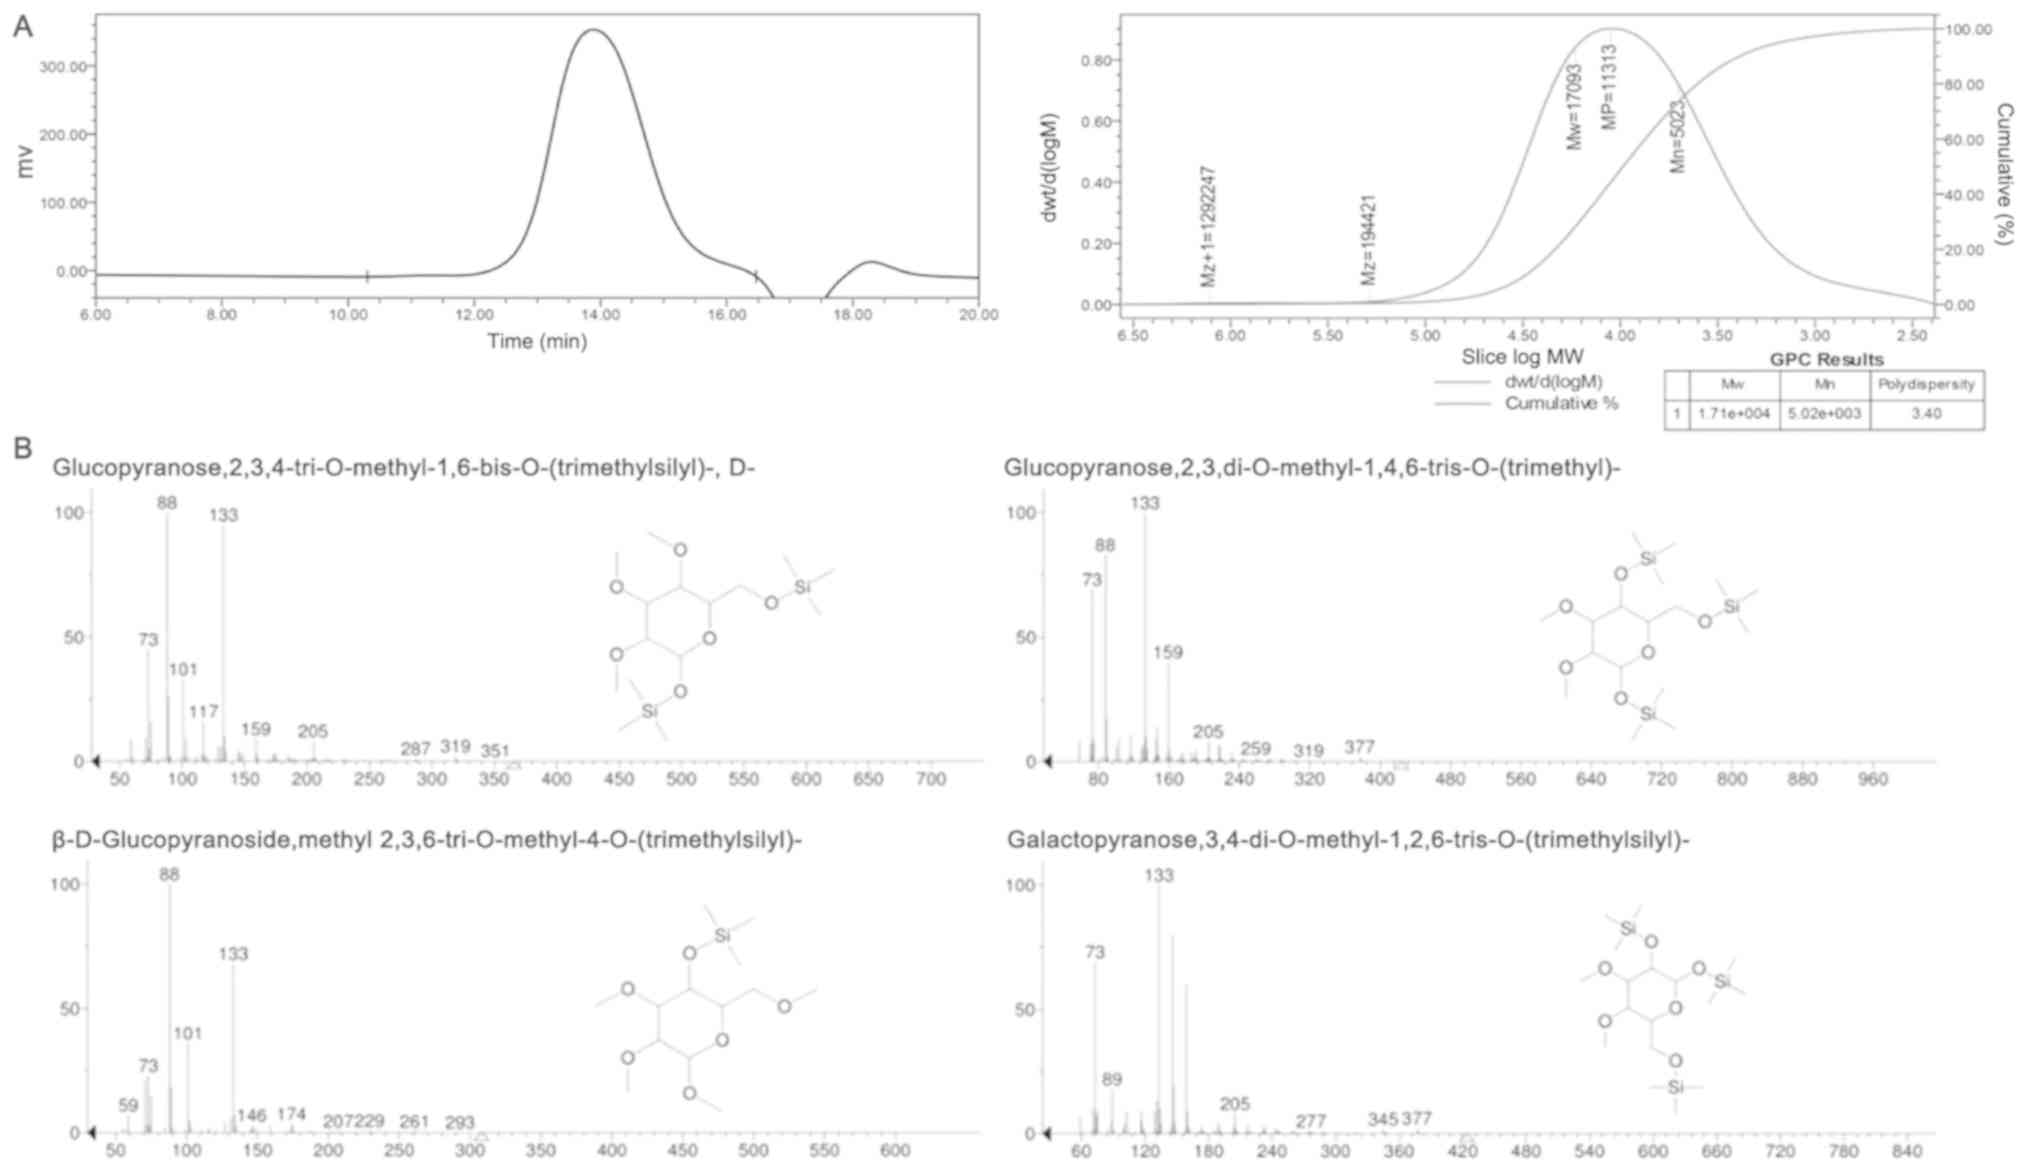
As shown in Fig. 1A,
the HPGPC elution curve of RF-1 displayed a symmetrical peak, and
the average molecular weight (Mw) of RF-1 was 17,093 Da, the
number-average Mw (Mn) was 5,023 Da, the peak Mw (Mp) was 11,313
Da, the Z average Mw (Mz) was 194,421 Da, the Z+1 average Mw (Mz+1)
was 129,247 Da and the polydispersity index (D=Mw/Mn) was 3.40 Da.
Therefore, the present data indicated that RF-1 is a homogeneous
polysaccharide.
Analysis of the GC-MS experiment
results
The GC-MS results of RF-1 (Table I and Fig.
1B) indicated that the glucopyranose residues were mainly
2,3,4-Me-1,6-substituted, 2,3-Me-1,4,6-substituted and
2,3,6-Me-4-substituted. The glucopyranose residues have 1,6- and
1,4,6-bonding modes and 4-terminal forms. The galactopyranose
residues are mainly 3,4-Me-1,2,6-substituted, indicating that
galactopyranose residues are 1,2,6-linked. According to the peak
area of each monosaccharide in GC-MS, it can be calculated that
1,6-Glu: 1,4,6-Glu: 4-Glu: 1,2,6-Gal=1:1:3:2.
 | Table I.Gas chromatography-mass spectrometry
results of methylation analysis of the Ramaria flaccida
(Fr.) Quél. polysaccharide. |
Table I.
Gas chromatography-mass spectrometry
results of methylation analysis of the Ramaria flaccida
(Fr.) Quél. polysaccharide.
| Methylated
sugar | Linkage | m/z |
|---|
|
2,3,4-Me-1,6-Glc | 1,6- | 59 73 88 101 117
133 159 185 205 229 265 287 319 351 |
|
2,3-Me-1,4,6-Glc | 1,4,6- | 73 88 103 133 146
159 191 205 217 247 259 319 361 377 435 |
| 2,3,6-Me-4-Glc | 4- | 59 73 88 101 133
146 174 207 229 261 293 |
|
3,4-Me-1,2,6-Gal | 1,2,6- | 73 89 103 133 146
159 205 232 277 317 345 377 |
Analysis of the NMR experiment
results
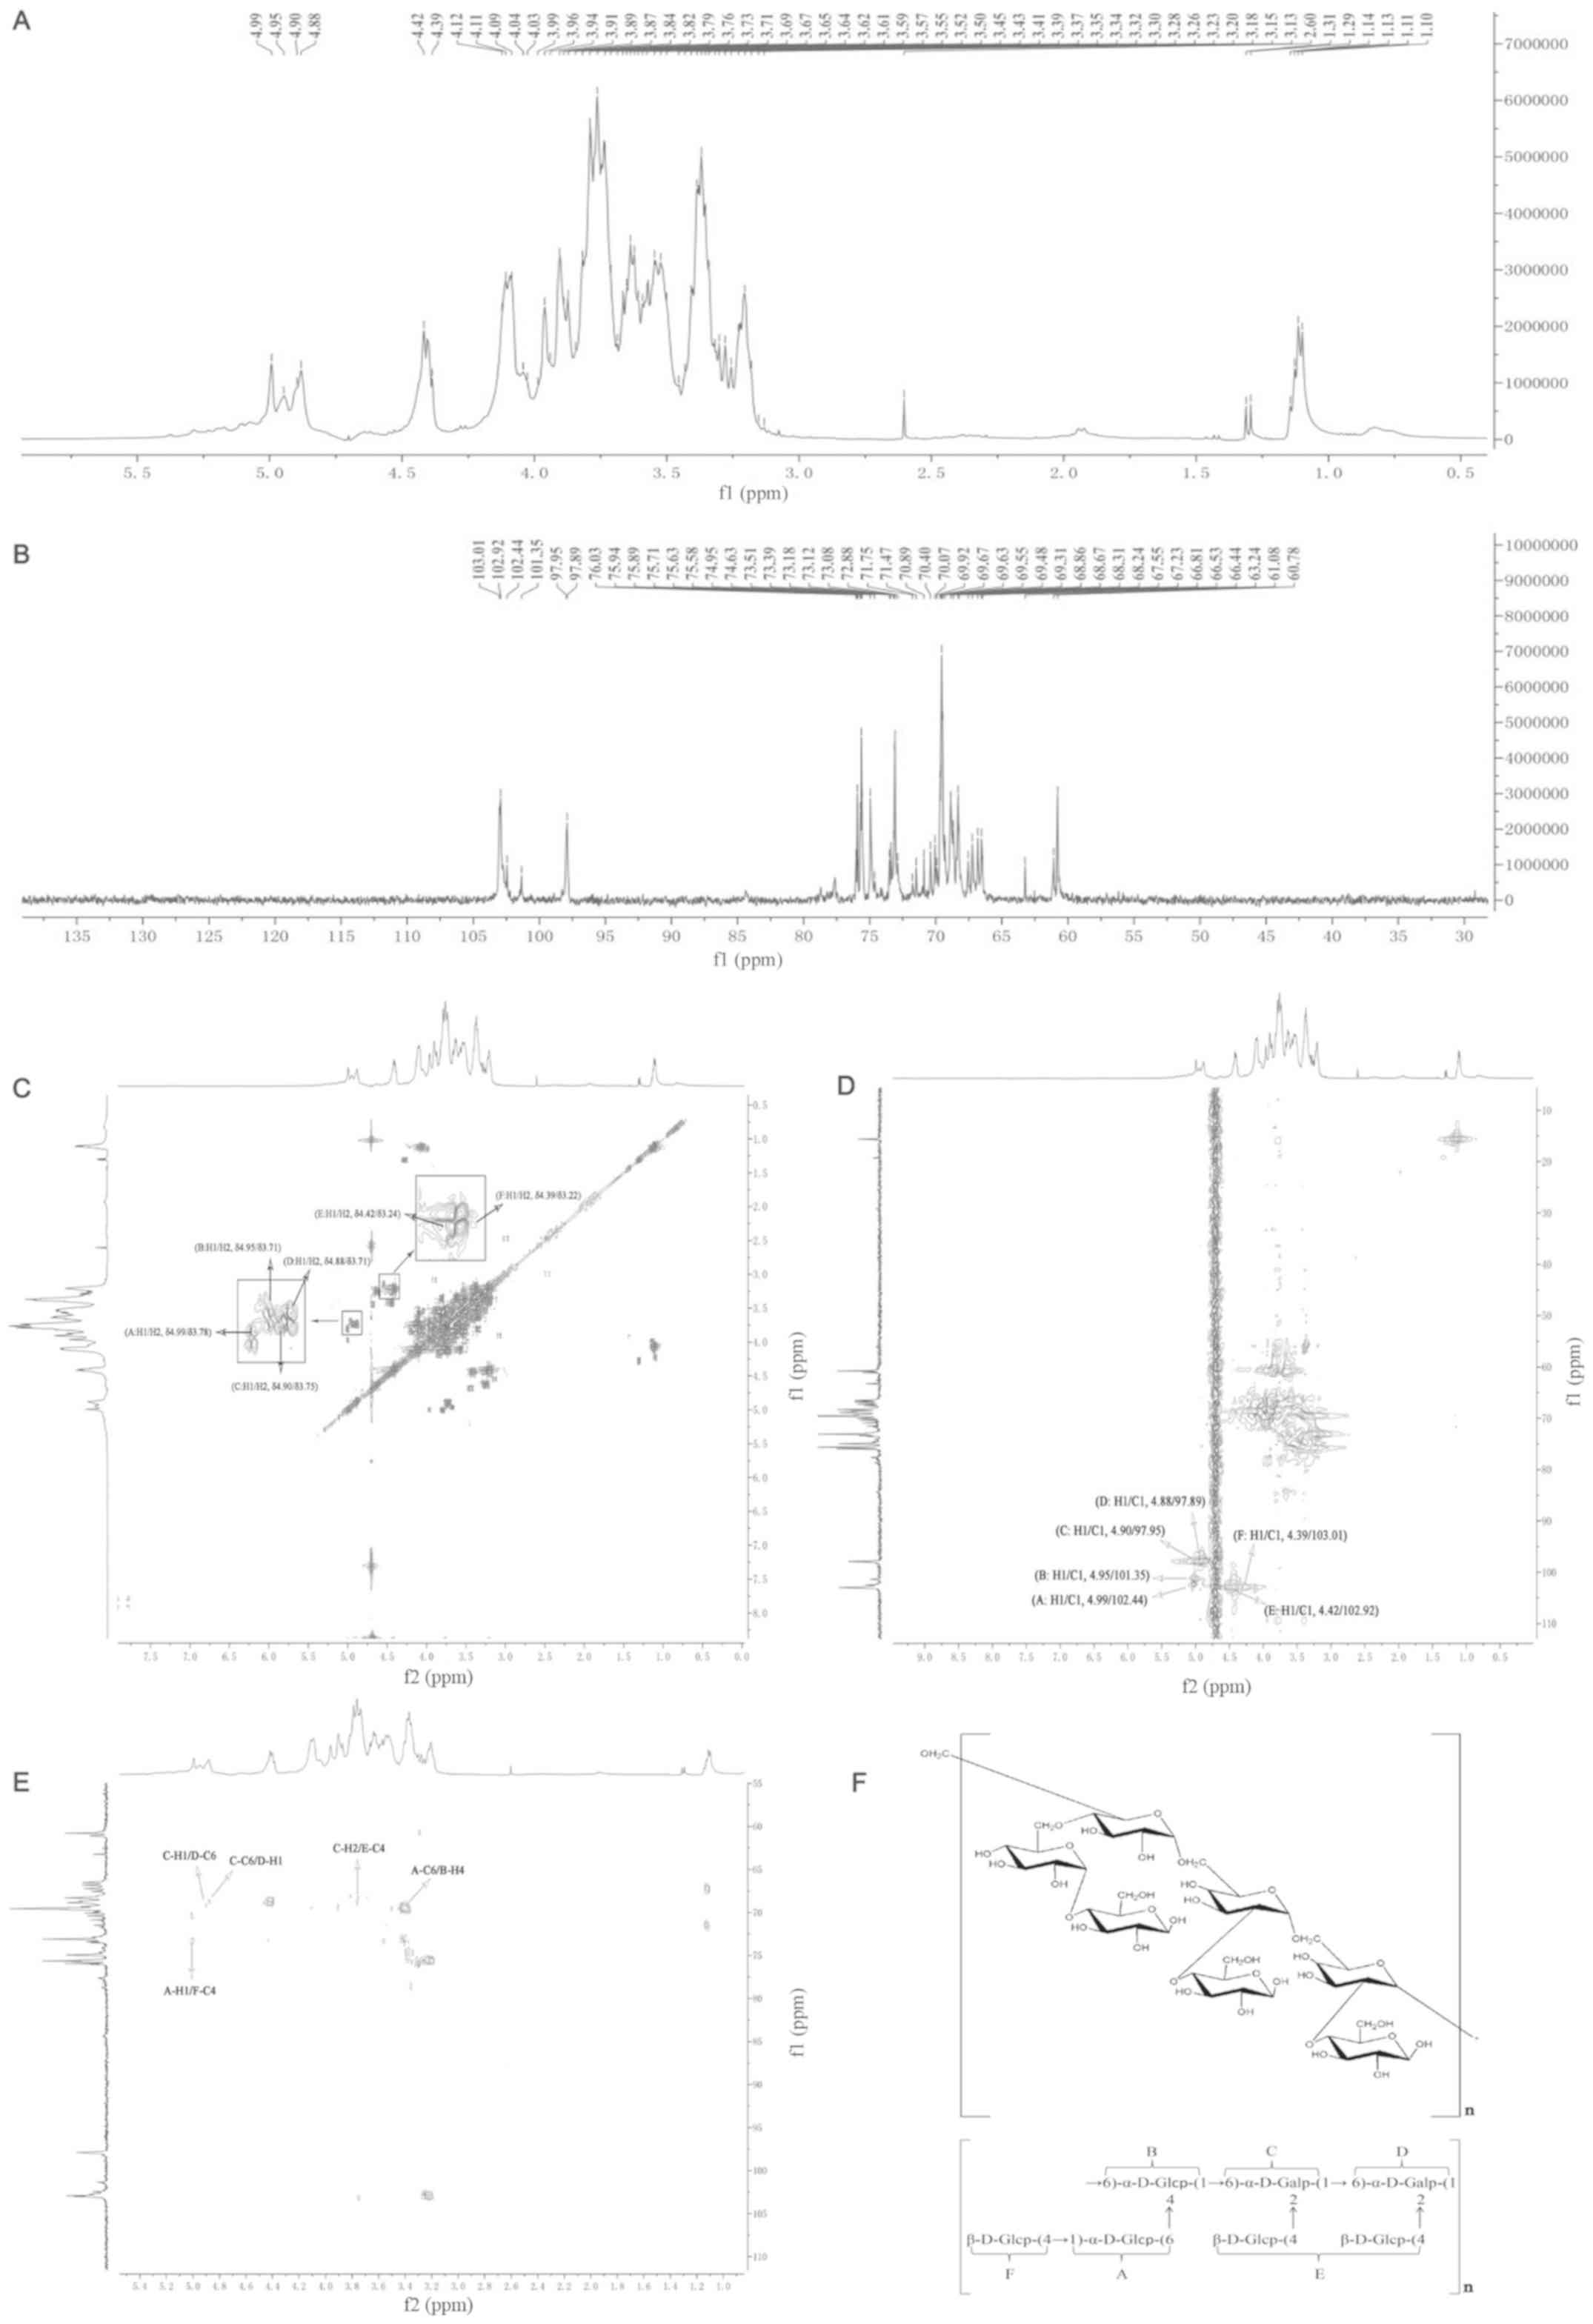
In 1H NMR (400 MHz), the chemical shifts
of most protons on C2-C6 were in the range of δ3.15-δ4.19, due to
the shielding effect of hydroxyl groups. The anomeric protons of
polysaccharide fell in the region of δ4.3–5.0 ppm. As shown in
Fig. 2A, RF-1 displayed six
heterologous hydrogen signals (δ4.99, δ4.95, δ4.90, δ4.88, δ4.42
and δ4.39). Among them, δ4.99, δ4.95, δ4.90 and δ4.88 were signals
of the α-pyranose unit, while the signals of δ4.42 and δ4.39 were
in the form of β-pyranose.
In the 95–105 ppm region of the 13C NMR
(400 MHz) of RF-1, the signal peaks of C1 were δ103.01,
δ102.92, δ102.44, δ101.35, δ97.95 and δ97.89 (Fig. 2B). The anomeric carbons in RF-1
displayed α and β heterochromatic configurations. Resonance in the
δ101–104 ppm region was attributed to the anomeric carbon atoms of
D-glucopyranose. The δ96–101 ppm region was the anomeric carbon
atom signal of D-galactopyranose. In the range of δ170–180 ppm,
there was no carboxyl resonance signal of alduronic acid, which
indicated that RF-1 is a neutral polysaccharide. There was no
resonance signal of a furan ring at δ106–109 ppm, suggesting that
all monosaccharide residues were in the pyranoid configuration.
1H-1H COSY is a kind of
homonuclear chemical shift correlation spectrum. It refers to the
coupling correlation spectrum among protons in the same coupling
system. It is mainly used to study the 1H homonuclear
coupling system (30). In the
1H-1H COSY spectrum of RF-1, there were cross
peaks at δ4.99/δ3.78, δ4.95/δ3.71, δ4.90/δ3.75, δ4.88/δ3.71,
δ4.42/δ3.24 and δ4.39/δ3.22 (Fig.
2C). The results of the present study indicated that the H2
shifts of RF-1 were 3.78, 3.71, 3.75, 3.71, 3.24 and 3.22 ppm.
According to the chemical shifts of H2, the chemical shifts of H3
can be identified to further detect the chemical shifts of H4-H6.
Based on the aforementioned results, the hydrogen signals of
monosaccharides in RF-1 in the 1H NMR spectra were
assigned and listed in Table
II.
| Table II.1H NMR and 13C
NMR chemical shifts in the Ramaria flaccida (Fr.) Quél.
polysaccharide. |
Table II.
1H NMR and 13C
NMR chemical shifts in the Ramaria flaccida (Fr.) Quél.
polysaccharide.
|
| Chemical shifts, δ,
ppm |
|---|
|
|
|
|---|
| Residue | H1/C1 | H2/C2 | H3/C3 | H4/C4 | H5/C5 | H6/C6 |
|---|
|
A→6)-α-D-Glcp-(1→ | 4.99/102.44 | 3.78/60.40 | 3.56/73.09 | 3.40/69.45 | 3.80/68.34 | 3.56/69.48 |
|
B→4,6)-α-D-Glcp-(1→ | 4.95/101.35 | 3.71/66.05 | 3.47/69.92 | 3.39/60.88 | 3.32/66.23 | 3.19/69.42 |
|
C→2,6)-α-D-Galp-(1→ | 4.90/97.95 | 3.75/71.47 | 3.41/69.20 | 3.64/67.23 | 3.52/74.63 | 3.75/68.65 |
|
D→2,6)-α-D-Galp-(1→ | 4.88/97.89 | 3.71/71.76 | 3.50/66.43 | 3.39/74.37 | 3.68/68.32 | 4.09/69.26 |
| E-β-D-Glcp-(4→ | 4.42/102.92 | 3.24/69.51 | 3.42/69.45 | 3.85/68.34 | 3.56/71.95 | 4.08/67.06 |
| F-β-D-Glcp-(4→ | 4.39/103.01 | 3.22/75.70 | 3.51/72.83 | 3.67/73.34 | 3.34/75.78 | 3.25/73.08 |
HMQC reflects the coupling association between
directly connected 1H and 13C nuclei
(31,32). After assigning the chemical shifts of
the hydrogen nuclei in RF-1 via the 1H-1H
COSY spectrum, the chemical shifts of the carbon nuclei can be
assigned via the HMQC spectra. In the HMQC spectrum of RF-1
(Fig. 2D), there were cross peaks at
H1/C1 (4.99/102.44), H1/C1 (4.95/101.35), H1/C1 (4.90/97.95), H1/C1
(4.88/97.89), H1/C1 (4.42/102.92) and H1/C1 (4.39/103.01).
Therefore, the chemical shifts of C1-C6 were identified in the HMQC
spectrum (Table II).
HMBC reflects information associated with carbon and
hydrogen remotely. By associating 1H with long-range
coupled 13C nuclei, structural information of the
molecular skeleton can be provided. According to the HMBC spectrum
of RF-1 (Fig. 2E) and the chemical
shift attribution table of hydrogen and carbon (Table II), it was identified that A-C6 and
B-H4, A-H1 and F-C4, C-H1 and D-C6, C-C6 and D-H1, and C-H2 and
E-C4 had correlative coupling associations. This indicated that A
and B were connected by 6→4, A and F by 1→4, C and D by 1→6, and C
and E by 2→4.
Based on the analysis of the aforementioned
experimental results, the RF-1 structure was identified and shown
in Fig. 2F. The main chain of RF-1
consisted of (1→6,2)-α-D-galactopyranose and
(1→6,4)-α-D-glucopyranose. One of the branched chains was linked to
4-O of the main glucose chain by (1→6)-α-D-glucopyranose and next
linked by one (→4)-β-D-glucopyranose. The other two branched chains
were both linked to 2-O of the main glucose chain by one
(→4)-β-D-glucopyranose. The structure of the polysaccharide
resulted novel by searching the SciFinder database.
Antitumor activity of RF-1 in
vivo
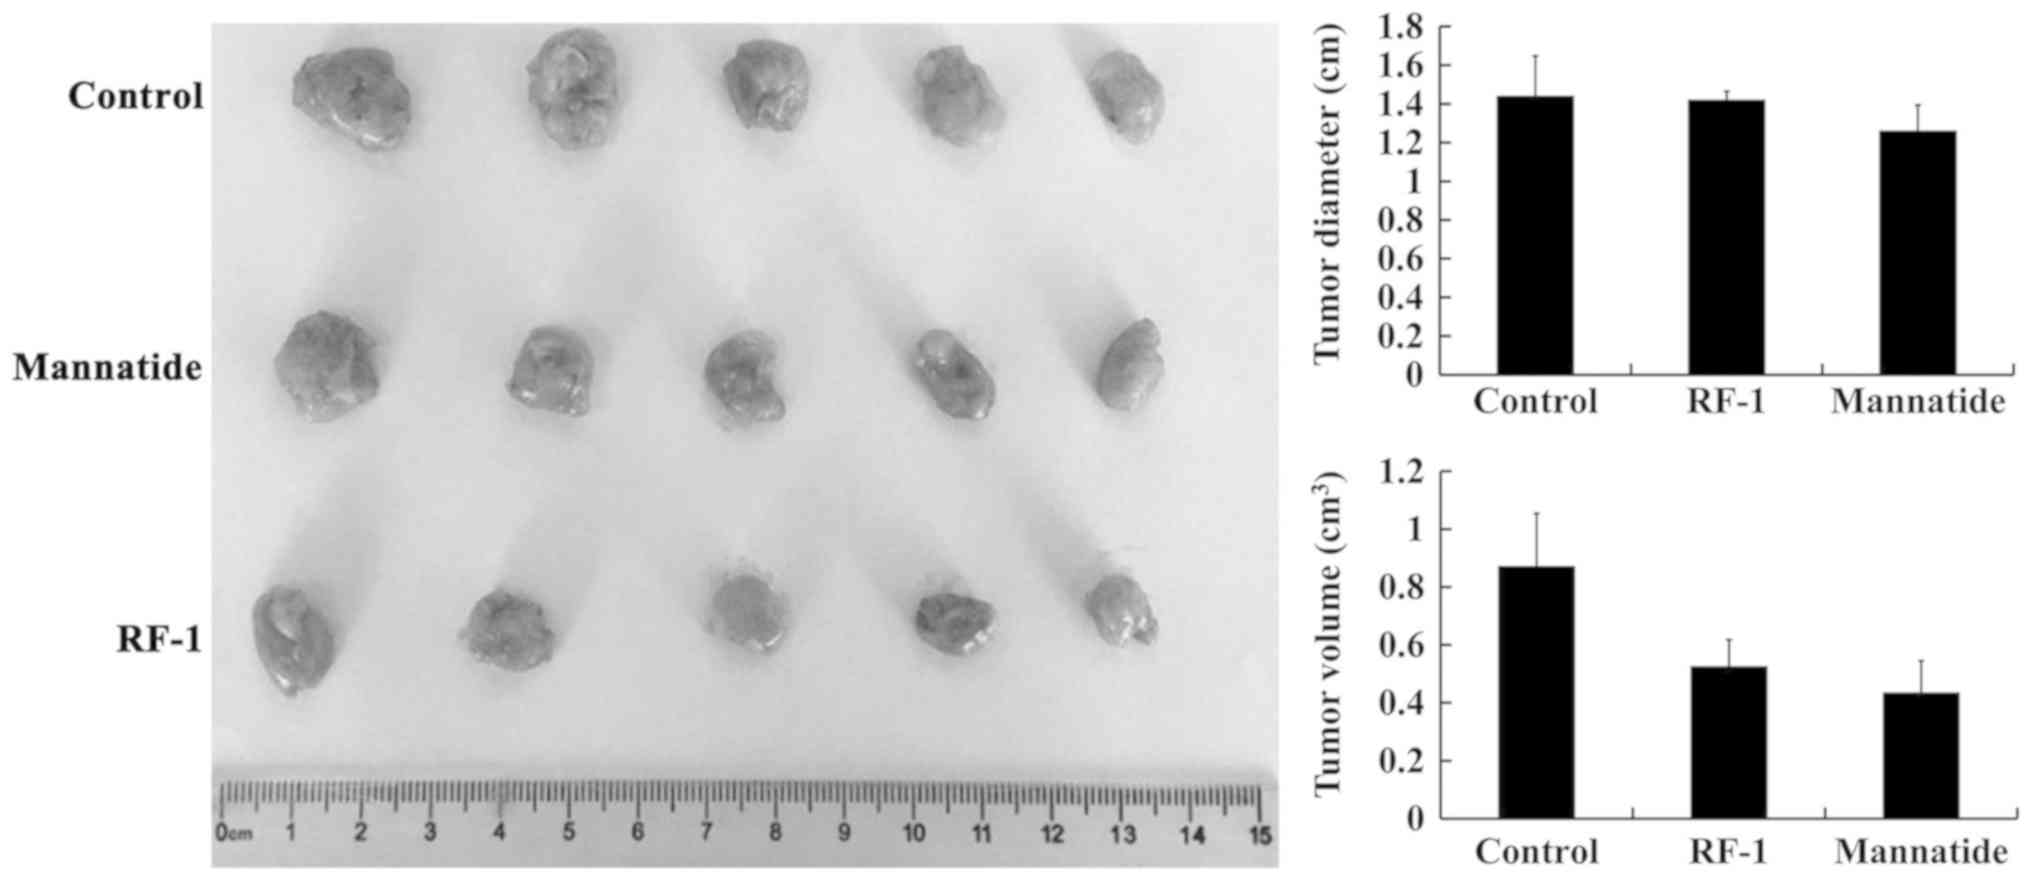
The inhibitory effect of a treatment on tumors is
usually judged by the tumor size and the inhibitory rate of the
treatment on the tumor. S180 cells are commonly used as cell lines
to detect the antineoplastic activity of treatment in vivo
(32). The results from the in
vivo experiments are shown in Fig.
3 and Table III. The maximum
tumor volume observed in the blank control, RF-1 and mannatide
groups was 1.054, 0.618 and 0.545 cm3, respectively. The
maximum diameter observed in the blank control, RF-1 and mannatide
groups was 1.687, 1.482 and 1.398 cm, respectively. Additionally,
there was almost no difference in the average liver weight, the
average spleen weight and the average thymus weight between the two
groups, which indicated that RF-1 did not damage the liver, spleen
and thymus (Table III). The
inhibition rate of the treatments in the mouse S180 tumors was
40.00% in the RF-1 group and 53.81% in the mannatide group. The
average weight of the tumors in the RF-1 group was 0.58±0.1 g,
which was lower than that in the blank control group (0.96±0.20 g),
and the average weight of the tumors in the mannatide group was
0.48±0.12 g (Table III). The
present results suggest that RF-1 may have a strong antitumor
effect in vivo.
| Table III.Antitumor activities of RF-1 on S180
tumor in vivo. |
Table III.
Antitumor activities of RF-1 on S180
tumor in vivo.
| Group | Average liver
weight, g | Average spleen
weight, g | Average thymus
weight, g | Average mouse
weight, g | Average tumor
diameter, cm | Average tumor
volume, cm3 | Average tumor
weight, g | Tumor inhibition
rate, % |
|---|
| Control | 1.99±0.25 | 0.20±0.02 | 0.15±0.02 | 29.33±1.93 | 1.44±0.21 | 0.87±0.18 | 0.96±0.20 | – |
| RF-1 (20
mg/kg) | 1.96±0.20 | 0.18±0.02 | 0.12±0.01 | 27.63±1.90 | 1.42±0.04 | 0.53±0.09 |
0.58±0.1a | 40.00 |
| Mannatide (20
mg/kg) | 2.25±0.29 | 0.26±0.05 | 0.19±0.09 | 30.70±2.75 | 1.26±0.13 | 0.44±0.11 |
0.48±0.12b | 53.81 |
Transcriptome sequencing data
Illumina sequencing technology was used to sequence
the transcriptomes of tumor tissues in the blank control and RF-1
groups. After original data filtering, sequence error rate checking
and detection of GC content distribution, the clean reads for
subsequent analysis were 599,771,500 and 59,981,170 bp in length,
respectively (data not shown). After quality control, two groups of
clean reads were compared with the reference genome, and the
percentage of total annotated genes was 94.51 and 94.3%,
respectively, which provides a good basis for the follow-up
analysis (data not shown).
Quantitative analysis of gene
expression
The sequencing results revealed that in the blank
control group, 12,203 genes were expressed [fragments per kilobase
million (FPKM)≥1], accounting for 23.18% of the total number of
genes, and 1,052 genes were upregulated (FPKM>60), accounting
for 2.00% of the total number of genes. In the RF-1 group, 12,155
genes were expressed, accounting for 23.09% of the total number of
genes, and 1,044 genes were upregulated, accounting for 1.98% of
the total number of genes. Additionally, there were upregulated
genes with different FPKM in the blank control and RF-1 groups. The
results revealed that 13 genes [cytochrome c oxidase subunit 1
(mt-Co1), ribosomal protein lateral stalk subunit P1 (Rplp1),
eukaryotic translation elongation factor 1 α 1 (Eef1a1), ribosomal
protein L36 (Rpl36), ribosomal protein L34-pseudogene 1
(Rpl34-ps1), galectin 1 (Lgals1), mitochondrion Cytochrome b
(mt-Cytb), predicted gene 12191 (Gm12191), NADH-ubiquinone
oxidoreductase chain 1 (mt-Nd1), Gm13394, Rpl13, Rpl8 and
Rps2-ps10] were markedly upregulated (FPKM>2,000) in the blank
control group compared with in the RF-1 group (Table IV), and 13 genes (mt-Co1, Rplp1,
Eef1a1, mt-Nd1, Lgals1, Rpl36, mt-Cytb, Gm13394, Gm12191,
Rpl34-ps1, Rpl8, Rpl13 and Rps2-ps10) were markedly upregulated
(FPKM>2,000) in the RF-1 group compared with in the blank
control group (Table V). Notably,
the FPKM of the Rplp1 gene was 4,231.249 in the blank control group
and 3,969.035 in the RF-1 group, the FPKM of the Rpl36 gene was
3,290.970 in the blank control group and 2,590.419 in the RF-1
group, and the FPKM of the Rpl34 gene was 2,824.368 in the blank
control group and 2,261.856 in the RF-1 group. The present results
indicated that Rplp1 was a key gene. RPLP1 interacts with the
conservative regions of RPLP0, RPLP2 and 28S rRNA, which forms the
main part of the ribosomal GTPase activity center, and can
covalently bind to ubiquitin to form fusion proteins and
participate in important biological activities (32), which was consistent with regulating
cell apoptosis and transcription in the RF-1 group of the present
study. The Rpl36 gene is directly involved in the synthesis of the
ribosomal protein 50S subunit, while the Rpl34 gene belongs to the
ribosomal protein L34E family, and is considered to serve an
important role in apoptosis, and in the occurrence and development
of various malignant tumors (33,34).
Previous studies demonstrated that the expression levels of Rpl34
and Rpl36 gene were downregulated in the RF-1 group, indicating
that cell mitosis was significantly slowed down, cell proliferation
was significantly inhibited, and cell apoptosis was promoted, and
that these genes could markedly affect physiological activities in
tumor cells (34,35). Although the expression levels of
these genes were upregulated in the RF-1 group in the present
study, these were lower than those in the blank control group,
suggesting that RF-1 may influence the function of some ribosomal
subunits in cancer cells, which is consistent with the inhibitory
effect of RF-1 on cancer cells in vivo.
| Table IV.Quantification of gene expression in
the blank control group (FPKM >2,000). |
Table IV.
Quantification of gene expression in
the blank control group (FPKM >2,000).
| Gene ID | FPKM | Gene name | Gene length,
bp | Gene biotype | Gene
description |
|---|
|
ENSMUSG00000064351 | 5108.05 | mt-Co1 | 1545 | Protein coding | Mitochondrially
encoded cytochrome c oxidase I |
|
ENSMUSG00000007892 | 4231.249 | Rplp1 | 499 | Protein coding | Ribosomal protein,
large, P1 |
|
ENSMUSG00000037742 | 3449.332 | Eef1a1 | 2493 | Protein coding | Eukaryotic
translation elongation factor 1 α 1 |
|
ENSMUSG00000057863 | 3290.97 | Rpl36 | 404 | Protein coding | Ribosomal protein
L36 |
|
ENSMUSG00000068396 | 2824.368 | Rpl34-ps1 | 354 | Processed
pseudogene | Ribosomal protein
L36 |
|
ENSMUSG00000068220 | 2782.246 | Lgals1 | 800 | Protein coding | Lectin, galactose
binding, soluble 1 |
|
ENSMUSG00000064370 | 2689.116 | mt-Cytb | 1144 | Protein coding | Mitochondrially
encoded cytochrome b |
|
ENSMUSG00000083061 | 2613.918 | Gm12191 | 348 | Processed
pseudogene | Predicted gene
12191 |
|
ENSMUSG00000064341 | 2495.384 | mt-Nd1 | 957 | Protein coding | Mitochondrially
encoded NADH dehydrogenase 1 |
|
ENSMUSG00000083773 | 2243.619 | Gm13394 | 1000 | Processed
pseudogene | Predicted gene
13394 |
|
ENSMUSG00000000740 | 2200.529 | Rpl13 | 2595 | Protein coding | ribosomal protein
L13 |
|
ENSMUSG00000003970 | 2166.688 | Rpl8 | 862 | Protein coding | ribosomal protein
L8 |
|
ENSMUSG00000091957 | 2162.028 | Rps2-ps10 | 965 | Transcribed
processed pseudogene | ribosomal protein
S2, pseudogene 10 |
| Table V.Quantification of gene expression in
the Ramaria flaccida (Fr.) Quél. polysaccharide group (FPKM
>2,000). |
Table V.
Quantification of gene expression in
the Ramaria flaccida (Fr.) Quél. polysaccharide group (FPKM
>2,000).
| Gene ID | FPKM | Gene name | Gene length,
bp | Gene biotype | Gene
description |
|---|
|
ENSMUSG00000064351 | 6474.749 | mt-Co1 | 1545 | Protein coding | Mitochondrially
encoded cytochrome c oxidase I |
|
ENSMUSG00000007892 | 3969.035 | Rplp1 | 499 | Protein coding | Ribosomal protein,
large, P1 |
|
ENSMUSG00000037742 | 3079.388 | Eef1a1 | 2493 | Protein coding | Eukaryotic
translation elongation factor 1 α 1 |
|
ENSMUSG00000064341 | 2940.164 | mt-Nd1 | 957 | Protein coding | Mitochondrially
encoded NADH dehydrogenase 1 |
|
ENSMUSG00000068220 | 2762.111 | Lgals1 | 800 | Protein coding | Lectin, galactose
binding, soluble 1 |
|
ENSMUSG00000057863 | 2590.419 | Rpl36 | 404 | Protein coding | Ribosomal protein
L36 |
|
ENSMUSG00000064370 | 2471.775 | mt-Cytb | 1144 | Protein coding | Mitochondrially
encoded cytochrome b |
|
ENSMUSG00000083773 | 2297.863 | Gm13394 | 1000 | Processed
pseudogene | Predicted gene
13394 |
|
ENSMUSG00000083061 | 2274.003 | Gm12191 | 348 | Processed
pseudogene | Predicted gene
12191 |
|
ENSMUSG00000068396 | 2261.856 | Rpl34-ps1 | 354 | Processed
pseudogene | Ribosomal protein
L34, pseudogene 1 |
|
ENSMUSG00000003970 | 2137.731 | Rpl8 | 862 | Protein coding | Ribosomal protein
L8 |
|
ENSMUSG00000000740 | 2122.002 | Rpl13 | 2595 | Protein coding | Ribosomal protein
L13 |
|
ENSMUSG00000091957 | 2051.634 | Rps2-ps10 | 965 | Transcribed
processed pseudogene | Ribosomal protein
S2, pseudogene 10 |
Differentially expressed genes between
the control and RF-1 groups
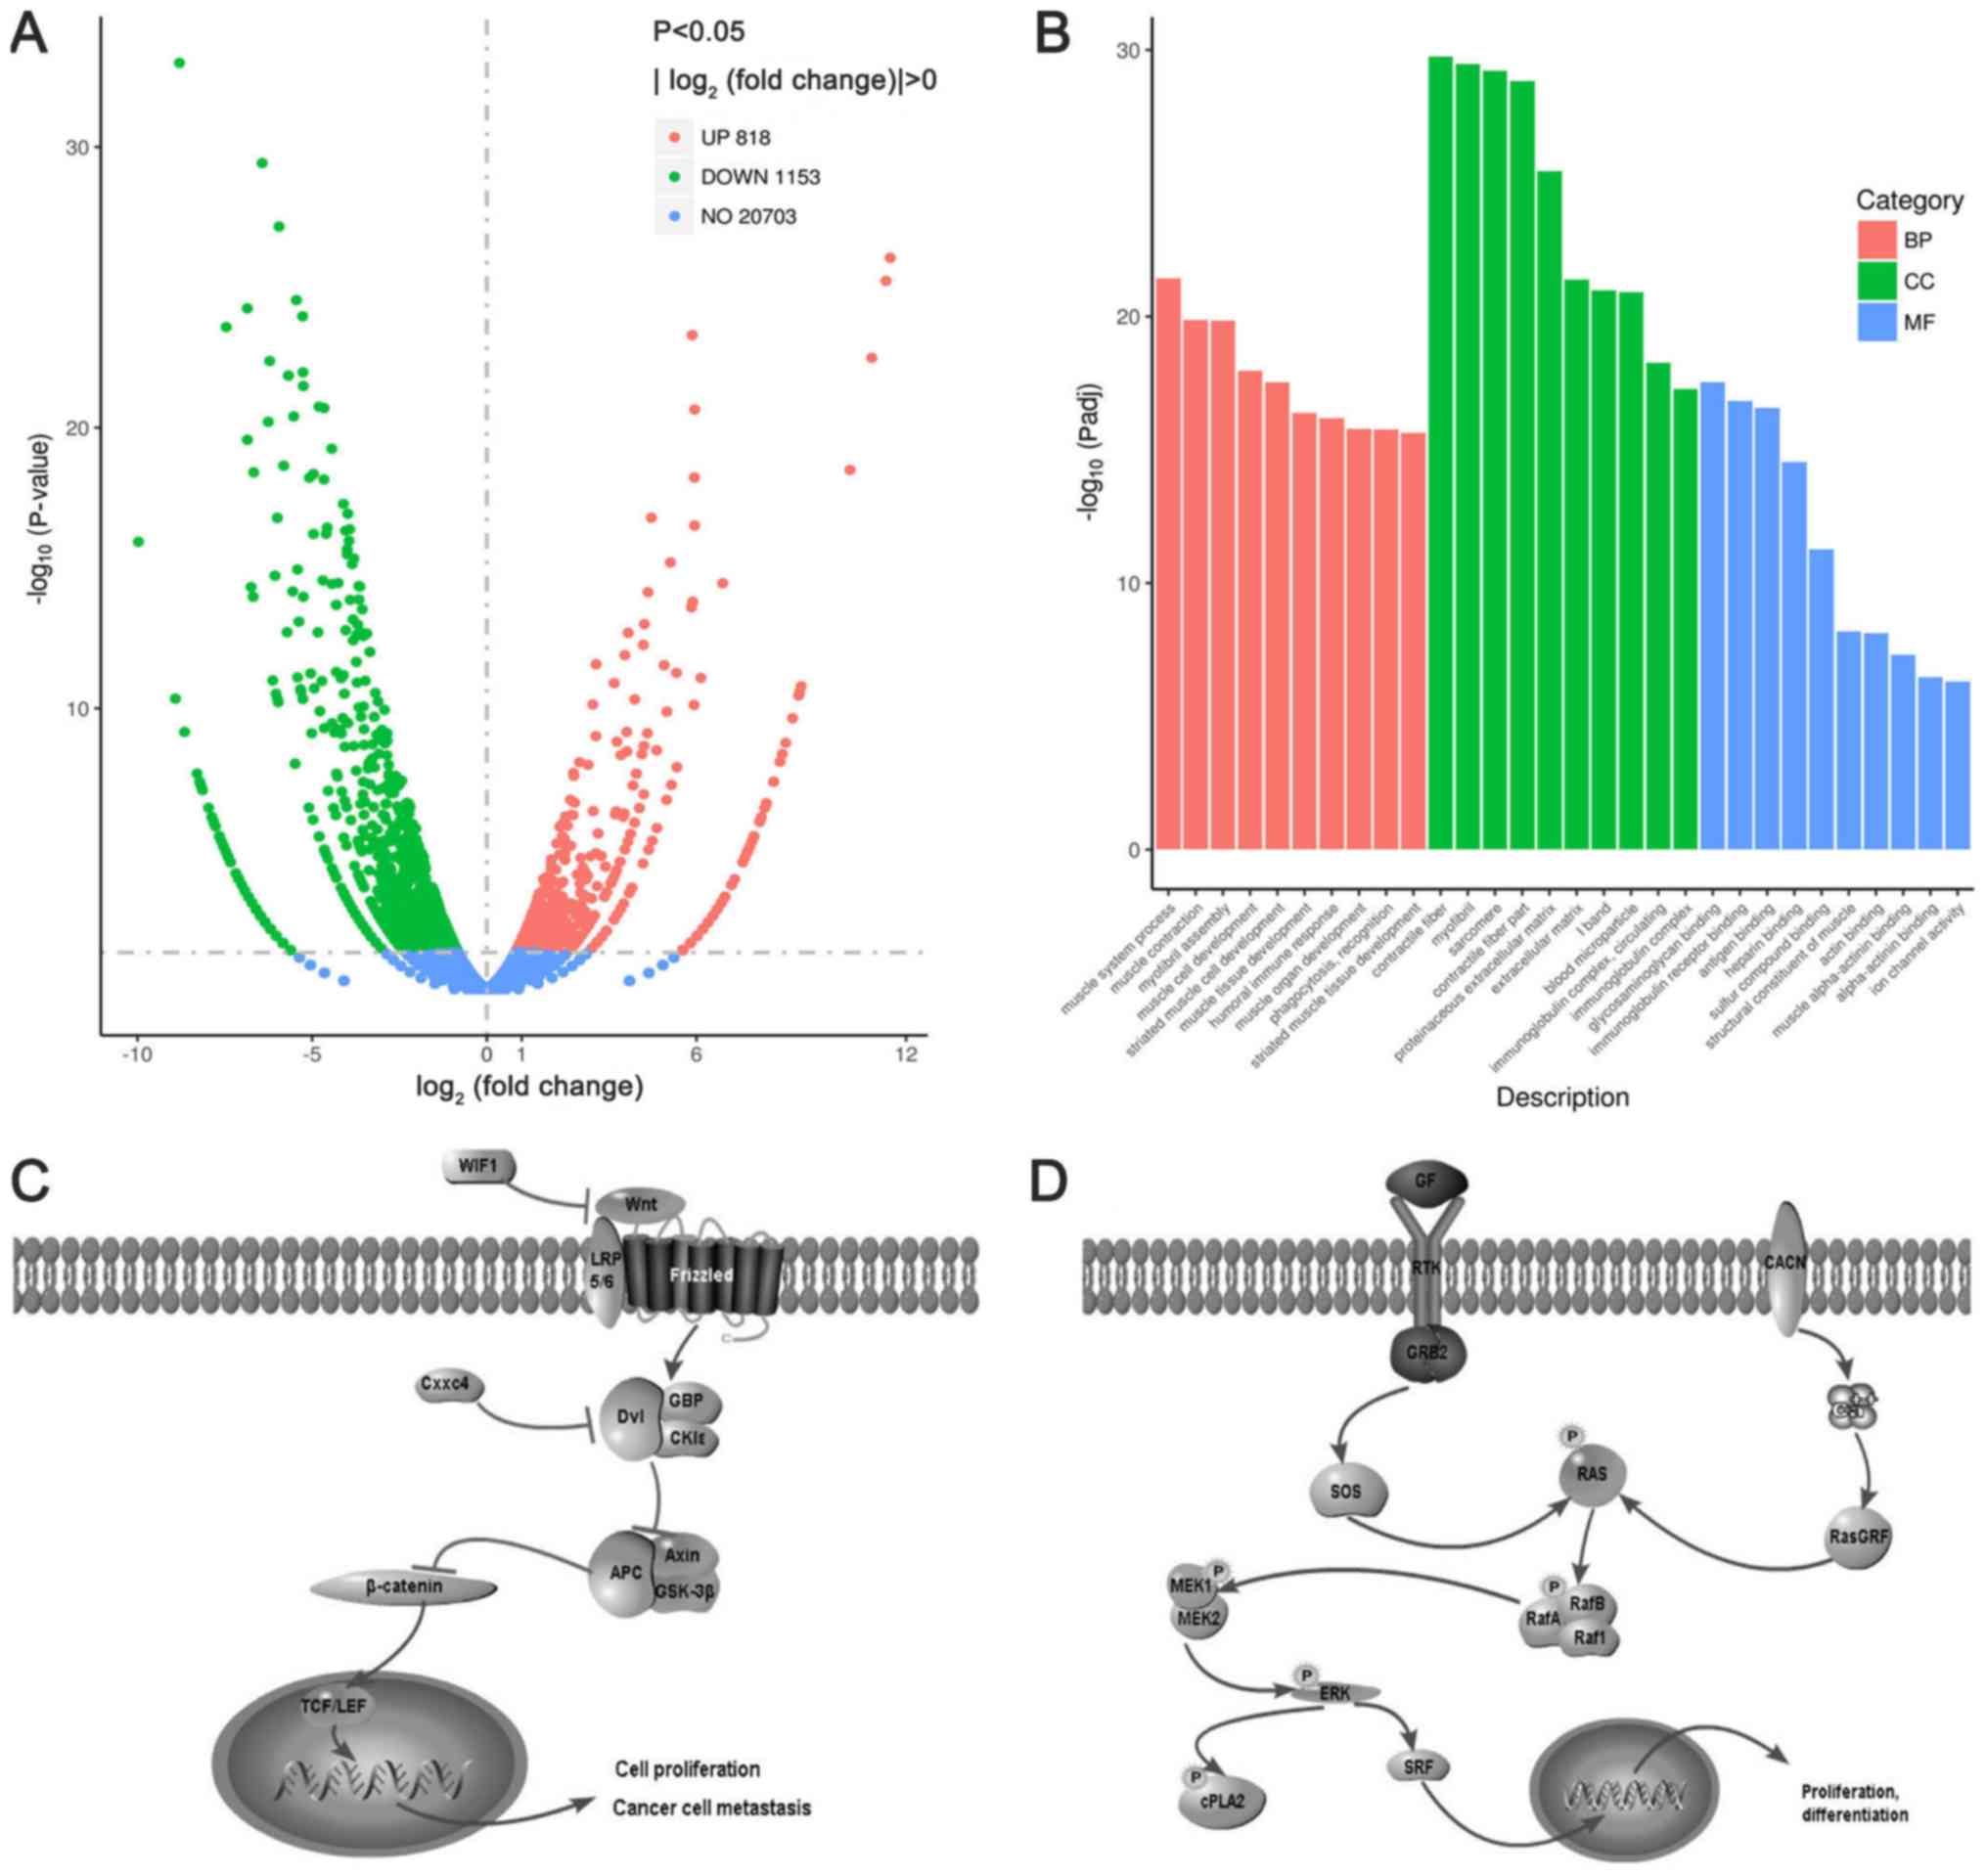
By using the edgeR program and using P<0.05 and
|log2 fold-change|>2 as the screening criteria
(29), 1,971 differentially
expressed genes were obtained comparing the blank control group
with the RF-1 group. Among these, 818 genes were upregulated,
whereas 1,153 genes were downregulated (Fig. 4A). Compared with the blank control
group, the top 13 upregulated genes (|log2
fold-change|>5) in the RF-1 group included endothelin 2, mucin
15, transcription factor AP-2 β, toll-like receptor 12, BAI1
associated protein 3, α tocopherol transfer protein, claudin 8,
TIMP metallopeptidase inhibitor 4, fucosyltransferase 7, hypocretin
receptor 1, solute carrier family 28 member 3 (Slc28a3), WNT
inhibitory factor 1 (Wif1) and CXXC finger protein 4 (Cxxc4)
(Table VI), while the top 15
downregulated genes (|log2 fold change|>6.9) included
myosin heavy chain 7 (Myh7), myosin light chain 2 (Myl2), Myh2,
Myl3, immunoglobulin heavy variable 3–6 (Ighv3-6), calcium
voltage-gated channel auxiliary subunit γ 6 (Cacng6), Slc8a3,
immunoglobulin like domain containing receptor 2, leucine rich
repeats and transmembrane domains 1, Ighv1-76, γ-aminobutyric acid
type A receptor subunit α3, Ighv2-9, Ighv1-72, phospholipase A2
group IVE (Pla2g4e) and immunoglobulin κ chain variable 8–24
(Table VII).
| Table VI.Differentially expressed
(upregulated) genes between the blank control group and the
Ramaria flaccida (Fr.) Quél. polysaccharide group
(|log2 fold-change|>5). |
Table VI.
Differentially expressed
(upregulated) genes between the blank control group and the
Ramaria flaccida (Fr.) Quél. polysaccharide group
(|log2 fold-change|>5).
| Gene ID | Log2
fold-change | Gene name | Gene length,
bp | Gene biotype | Gene
description |
|---|
|
ENSMUSG00000028635 | 8.997284 | Edn2 | 1462 | Protein coding | Endothelin 2 |
|
ENSMUSG00000050808 | 8.752694 | Muc15 | 3569 | Protein coding | Mucin 15 |
|
ENSMUSG00000025927 | 8.552894 | Tfap2b | 6338 | Protein coding | Transcription
factor AP-2 β |
|
ENSMUSG00000062545 | 8.208796 | Tlr12 | 3177 | Protein coding | Toll-like receptor
12 |
|
ENSMUSG00000047507 | 7.954483 | Baiap3 | 5112 | Protein coding | BAI1-associated
protein 3 |
|
ENSMUSG00000073988 | 7.645538 | Ttpa | 3488 | Protein coding | Tocopherol (α)
transfer protein |
|
ENSMUSG00000050520 | 7.092531 | Cldn8 | 2356 | Protein coding | Claudin 8 |
|
ENSMUSG00000030317 | 6.814687 | Timp4 | 5894 | Protein coding | Tissue inhibitor of
metalloproteinase 4 |
|
ENSMUSG00000036587 | 6.814687 | Fut7 | 2355 | Protein coding | Fucosyltransferase
7 |
|
ENSMUSG00000028778 | 6.814687 | Hcrtr1 | 2608 | Protein coding | Hypocretin (orexin)
receptor 1 |
|
ENSMUSG00000021553 | 6.814687 | Slc28a3 | 7902 | Protein coding | Solute carrier
family 28 (sodium-coupled nucleoside transporter), member 3 |
|
ENSMUSG00000020218 | 6.814687 | Wif1 | 2427 | Protein coding | Wnt inhibitory
factor 1 |
|
ENSMUSG00000044365 | 5.609282 | Cxxc4 | 13401 | Protein coding | CXXC finger 4 |
| Table VII.Differentially expressed
(downregulated) genes between the blank control group and the
Ramaria flaccida (Fr.) Quél. polysaccharide group
(|log2 fold-change|>6.9). |
Table VII.
Differentially expressed
(downregulated) genes between the blank control group and the
Ramaria flaccida (Fr.) Quél. polysaccharide group
(|log2 fold-change|>6.9).
| Gene ID | Log2
fold-change | Gene name | Gene length,
bp | Gene biotype | Gene
description |
|---|
|
ENSMUSG00000053093 | 9.972783629 | Myh7 | 8586 | Protein coding | Myosin, heavy
polypeptide 7, cardiac muscle, β |
|
ENSMUSG00000013936 | 8.915444458 | Myl2 | 1950 | Protein coding | Myosin, light
polypeptide 2, regulatory, cardiac, slow |
|
ENSMUSG00000033196 | 8.800023105 | Myh2 | 7137 | Protein coding | Myosin, heavy
polypeptide 2, skeletal muscle, adult |
|
ENSMUSG00000059741 | 8.653007497 | Myl3 | 2044 | Protein coding | Myosin, light
polypeptide 3 |
|
ENSMUSG00000076672 | 8.295564025 | Ighv3-6 | 350 | IG V gene | Immunoglobulin
heavy variable 3–6 |
|
ENSMUSG00000078815 | 8.219863343 | Cacng6 | 1977 | Protein coding | Calcium channel,
voltage-dependent, γ subunit 6 |
|
ENSMUSG00000079055 | 8.180469388 | Slc8a3 | 5332 | Protein coding | Solute carrier
family 8 (sodium/calcium exchanger), member 3 |
|
ENSMUSG00000040612 | 7.965542551 | Ildr2 | 8251 | Protein coding | Immunoglobulin-like
domain containing receptor 2 |
|
ENSMUSG00000045776 | 7.819319431 | Lrtm1 | 7939 | Protein coding | Leucine-rich
repeats and transmembrane domains 1 |
|
ENSMUSG00000093896 | 7.536914365 | Ighv1-76 | 368 | IG V gene | Immunoglobulin
heavy variable 1–76 |
|
ENSMUSG00000031343 | 7.473137098 | Gabra3 | 3924 | Protein coding | γ-aminobutyric acid
A receptor, subunit α 3 |
|
ENSMUSG00000096638 | 7.336445309 | Ighv2-9 | 362 | IG V gene | Immunoglobulin
heavy variable 2–9 |
|
ENSMUSG00000096074 | 7.103554472 | Ighv1-72 | 396 | IG V gene | Immunoglobulin
heavy variable 1–72 |
|
ENSMUSG00000050211 | 6.924380268 | Pla2g4e | 6960 | Protein coding | Phospholipase A2,
group IVE |
|
ENSMUSG00000076583 | 6.924380268 | Igkv8-24 | 365 | IG V gene | Immunoglobulin κ
chain variable 8–24 |
Wif1, which serves an antagonistic role in the WNT
signaling pathway (36), was
significantly upregulated in the RF-1 group compared with the blank
control group. By binding to the WNT ligand, the ligand cannot bind
to the cell surface receptor (37),
thus inhibiting WNT signal transduction. The Wif1 gene was
upregulated in the RF-1 group, suggesting that the WNT signaling
pathway was one of the key signal transduction pathways in the RF-1
group. At present, research has mainly focused on the antitumor
activity of this gene. Additionally, it has been reported that Wif1
can affect the growth of blood vessels and cells in liver tumors
(38). Cxxc4, another factor that
serves an antagonistic role in the WNT signaling pathway, was also
upregulated, suggesting that it may serve a key role in the
inhibition of tumorigenesis and growth. The protein encoded by this
gene binds to the PDZ region of disheveled segment polarity protein
1 (Dvl1), which prevents Dvl1 from forming a complex with Axin
(39). The aforementioned results
and the analysis of the differentially expressed genes suggest that
the antitumor activity of RF-1 in vivo may be associated
with the WNT signaling pathway.
GO analysis and KEGG analysis of
differentially expressed genes
GO is a comprehensive database describing gene
function. An adjusted P-value (Padj)<0.05 was used as the
threshold of significant enrichment for GO functional enrichment
(Fig. 4B). A total of 58,807 genes
were associated with GO terms; among them, 47,091 were associated
with biological processes, 5,250 with cellular components and 6,466
with molecular functions. In the biological processes category, the
three terms with the most significant enrichment were ‘myofibril
assembly’ (GO 0030239), ‘muscle contraction’ (GO 0008038) and
‘muscle system process’ (GO 0006936). The majority of the terms in
the cellular components category were associated with ‘contractile
fiber’ (GO 0043292), ‘myofibril’ (GO 0030016) and ‘sarcomere’ (GO
0030017). Under the molecular functions category, the majority of
the GO terms were grouped into ‘glycosaminoglycan binding’ (GO
0005539), ‘immunoglobulin receptor binding’ (GO 0034987) and
‘antigen binding’ (GO 0003823). The results indicated that the
cytokinetics and immune function of tumor cells in the RF-1 group
were different from those in the blank control group.
Padj<0.05 was used as the threshold of
significant enrichment for KEGG pathway enrichment. The results
revealed that the WNT (Fig. 4C) and
mitogen-activated protein kinase (MAPK) signaling pathways
(Fig. 4D) were significantly
enriched, and the number of differentially expressed genes
annotated in these two pathways was 19 and 33, respectively (data
not shown). The present result supports the hypothesis that the
antineoplastic activity of RF-1 in organisms may be achieved
through the WNT and MAPK signaling pathways.
The present analysis identified 19 differentially
expressed genes in the WNT signaling pathway, 9 of which were
upregulated in the RF-1 group, including Wif1, Cxxc4, Wnt family
member 7B (Wnt family member 7B), notum palmitoleoyl-protein
carboxylesterase, APC regulator of WNT signaling pathway 2,
frizzled class receptor 2, FRAT regulator of WNT signaling pathway
2 and Wnt6, while 10 were downregulated, including secreted
frizzled related protein 5 (Sfrp5), calcium/calmodulin dependent
protein kinase II α (Camk2a), Camk2b, Sfrp4, Wnt16, VANGL planar
cell polarity protein 2, Sfrp1, glypican 4, Sfrp2 and phospholipase
C β 1 (data not shown).
Furthermore, out of the 33 differentially expressed
genes in the MAPK signaling pathway, 11 were upregulated in the
RF-1 group compared with in the control group, including fibroblast
growth factor receptor 2, Ras protein specific guanine nucleotide
releasing factor 1 (Rasgrf1), Mapk13, calcium voltage-gated channel
subunit α1 H (Cacna1h), fibroblast growth factor 10 (Fgf10), growth
arrest and DNA damage inducible β (Gadd45b), neurotrophin 5, JunD
proto-oncogene AP-1 transcription factor subunit, KIT
proto-oncogene receptor tyrosine kinase, dual specificity
phosphatase 7 (Dusp7) and nerve growth factor receptor, whereas 22
were downregulated, including Cacng6, Pla2g4e, Cacna1s, Cacng1,
Cacna2d1, insulin like growth factor 1, angiopoietin 1, Fgf18,
myocyte enhancer factor 2C, Fgf7, TEK receptor tyrosine kinase,
Gadd45a, MDS1 and EVI1 complex locus, Vegfd, Cacnb1, interleukin 1
receptor type 1, platelet derived growth factor D (Pdgfd), RAS
guanyl releasing protein 3, transforming growth factor β receptor
2), Dusp8, Pdgf receptor α and ribosomal protein S6 kinase A2 (data
not shown).
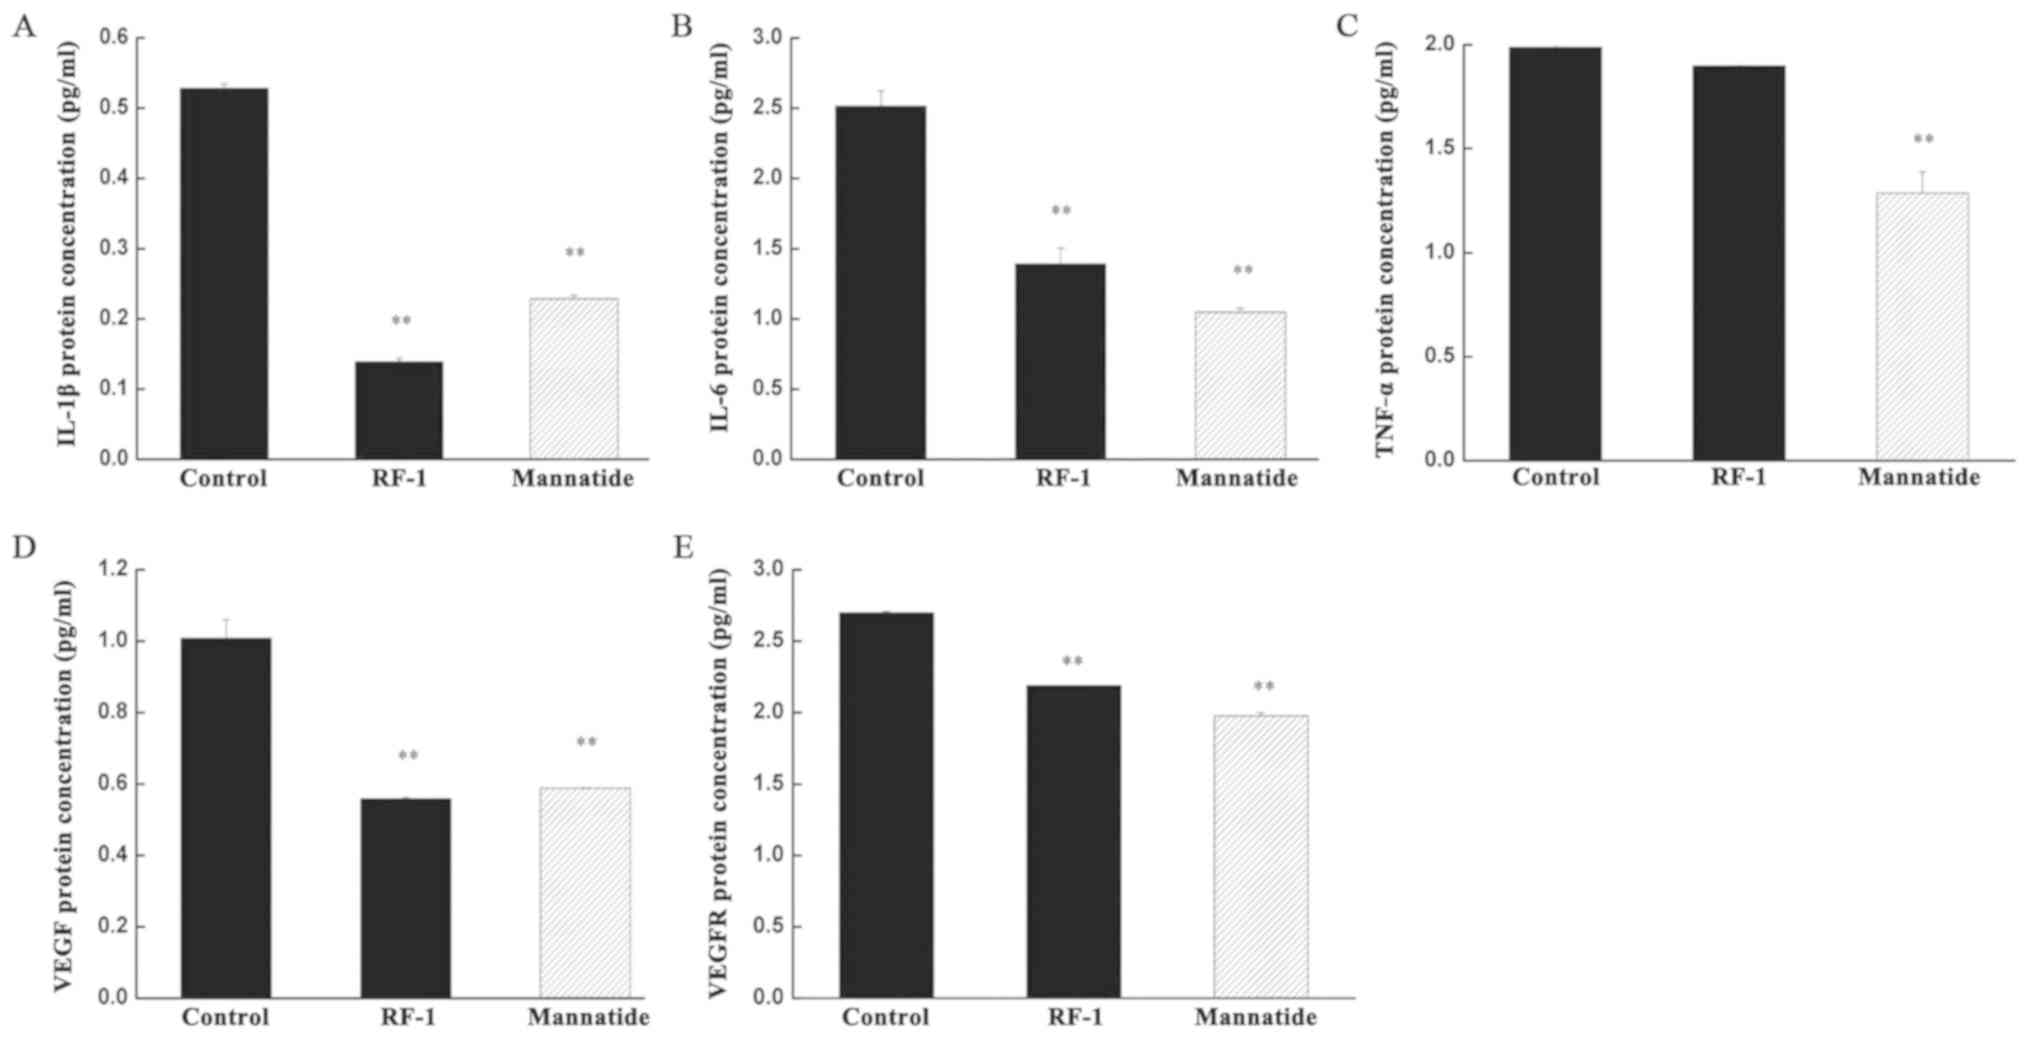
Expression levels of IL-1β, IL-6,
TNFα, VEGFR and VEGF in mice tumor tissues
The expression levels of IL-1β, IL-6, TNFα, VEGFR
and VEGF in the blank control group, positive control group and
RF-1 group were detected using ELISA kits. The expression levels of
IL-1β, IL-6, VEGFR and VEGF in the RF-1 group were significantly
downregulated compared with those in the control group (P<0.01;
Fig. 5).
Discussion
The WNT signaling pathway serves an important role
in cell growth, differentiation and apoptosis through classical and
non-classical signaling pathways, particularly in its state of
abnormal activation in tumor tissues (40). In the canonical pathway, the WNT
ligand binds to the Frizzled receptor, and the signal is
transmitted to the glycogen synthase kinase 3
(GSK-3)/β-Axin-adenomatosis polyposis coli complex, which leads to
the accumulation of β-catenin in the cytoplasm and subsequently in
the nucleus, resulting in the expression of the lymphoid
enhancer-binding factor/T-cell factor-related transcription
factors, such as cyclinD1 and c-myc (41). RF-1 increased Wif1 expression in the
present study. As a secretory antagonist of the WNT signaling
pathway, Wif1 can compete with the WNT ligand to bind to the
Frizzled receptor and block the WNT signaling pathway (42). The increase in Cccx4 expression in
the RF-1 group in the present study may inhibit the formation of
the complex of DVL1 and Axin by binding to the PDZ region of DVL1,
which leads to the continuous phosphorylation of β-catenin in the
cytoplasm and makes it difficult to accumulate, thus blocking the
activation of the WNT/β-catenin signaling pathway (43).
The MEK/ERK-associated intracellular signal
transduction pathway is considered to be a classical MAPK signal
transduction pathway, which serves a key role in tumorigenesis and
metastasis (44). Cacna2d1 is a
member of the family of α-2/δ subunits and serves important
physiological functions, such as contraction, secretion and nerve
transmission, by mediating Ca2+ into a polarized state
(45). In the present study,
Cacna2d1 expression was downregulated in the RF-1 group. Cacna2d1
expression may affect the state of Ca2+ and further
increase the expression of Ras protein specific guanine nucleotide
releasing factor 1 (RASGRF1) (46).
RASGRF1 can directly bind to Cdc42, inhibiting the binding of Cdc42
with other guanosine exchange factors, and thus preventing the
activation of Cdc42, and inhibiting the invasion and transformation
of cancer cells mediated by Cdc42 (46). The higher the expression levels of
RASGRF1, the stronger the anticancer effect and the lower the risk
of cancer growth (47).
In addition, phospholipase A2 (PLA2) represents a
large group of enzymes that can hydrolyze the structure and
function of Sn-2 lipid bonds; it is secreted and released by
activated monocytes, macrophages and neutrophils (48). In particular, cytoplasmic PLA2
(cPLA2) serves a key role in the network regulation of the
expression and activation of a number of inflammatory mediators
(49). Stimulation of PLA2
expression may serve an important role in reversing malignant
phenotypes and in the treatment of cancer. Therefore, the decrease
of cPLA2 in the RF-1 group suggests that RF-1 may have
anti-inflammatory and antitumor effects. The results of the present
study can fully explain the mechanism of the antitumor effect of
RF-1.
Finally, IL-1β and IL-6 are important
proinflammatory cytokines in inflammatory response (50,51). The
expression levels of both cytokines can be used as an index to
judge the severity of disease. The expression levels of IL-1β and
IL-6 in the RF-1 group were downregulated compared with those in
the control group, which indicated that RF-1 may inhibit
inflammatory injury in tumor tissues and decrease the levels of
IL-1β and IL-6. Neovascularization is an important structural basis
for the growth, invasion and metastasis of solid tumors. VEGF
mainly binds to VEGFR to activate downstream signaling pathways and
promote the growth of tumor vessels. The expression levels of VEGF
and VEGFR were downregulated in the RF-1 group, which indicated
that RF-1 may have anti-angiogenesis effects on tumors and may
therefore inhibit the proliferation of tumor cells.
The polysaccharide from Ramaria flaccida
(Fr.) Quél. was a homogeneous polysaccharide composed mainly of
glucose and galactose with a ratio of 2:1, and was named RF-1. The
main chain of RF-1 consisted of (1→6, 2)- α-D-galactopyranose and
(1→6, 4)-α-D-glucopyranose. One of the branched chains was linked
to 4-O of the main glucose chain by (1→6)-α-D-glucopyranose and
next linked by one (→4)-β-D-glucopyranose. The other two branched
chains were both linked to 2-O of the main glucose chain by one
(→4)-β-D-glucopyranose. RF-1 inhibited the growth of S180 tumors
in vivo. Using 20 mg/kg RF-1, the inhibition rate of mice
S180 tumors was 48.4%. Compared with the blank control group, 1,971
differentially expressed genes were identified, of which 818 were
upregulated and 1,153 were downregulated in the RF-1 group. KEGG
pathway enrichment analysis revealed that the WNT and MAPK
signaling pathways were significantly enriched. The numbers of
differentially annotated genes in these two pathways were 19 and
33, respectively. Additionally, ELISA results revealed that the
expression levels of IL-1β, IL-6, VEGFR and VEGF were significantly
downregulated in the RF-1 group compared with the blank control
group. The results of the present study provided a foundation for a
deeper investigation of the antitumor effect and mechanism of
Ramaria flaccida (Fr.) Quél. polysaccharides and a
theoretical basis for the research and development of the economic
value of Ramaria flaccida (Fr.) Quél.
Acknowledgements
Not applicable.
Funding
The present study was supported by the Science and
Technology Support Project of Sichuan Province (grant nos.
2018JY0087 and 2018NZ0055), the Cultivate Major Projects of Sichuan
Province (grant no. 16CZ0018), Nanchong Science and Technology
Bureau of Sichuan Province (grant no. 16YFZJ0043), Talent Program
of China West Normal University (grant nos. 17YC328, 17YC136 and
17YC329), National Training Project of China West Normal University
(grant no. 17c039) and the Innovative Team Project of China West
Normal University (grant no. CXTD2017-3).
Availability of data and materials
The datasets used and/or analyzed during the current
study are available from the corresponding author on reasonable
request.
Authors' contributions
The present study was designed and conceived by YH
and XD. The experimental procedures and data analysis were
performed by MD, XD and YH. The manuscript was prepared by all
authors, and all authors read and approved the final
manuscript.
Ethics approval and consent to
participate
The animal experiments were conducted according to
the Guidelines for Animal Experimentation of the North Sichuan
Medical College of China, which were revised according to the
Regulations on the Administration of Experimental Animals of the
People's Republic of China (decree no. The Second Commission of the
People's Republic of China of Science and Technology Commission).
The experimental protocols were approved by the North Sichuan
Medical College of China (Nanchong, China; approval no.
20180622).
Patient consent for publication
Not applicable.
Competing interests
The authors declare that they have no competing
interests.
References
|
1
|
Yang H, Guo S and Sagitov A: The
collection and separation of the special edible and medicinal
mushrooms in china and Kazakhstan and efficacy evaluation. Sci Tech
Infor Dev Economy. 23:132–136. 2013.
|
|
2
|
Zheng L, Chen XQ and Cheong KL: Current
trends in marine algae polysaccharides: The digestive tract,
microbial catabolism, and prebiotic potential. Int J Biol Macromol.
151:344–354. 2020. View Article : Google Scholar : PubMed/NCBI
|
|
3
|
Liu L, Cui Y, Pi F, Cheng Y, Guo Y and
Qian H: Extraction, purification, structural characteristics,
biological activities and pharmacological applications of
acemannan, a polysaccharide from aloe Vera: A review. Molecules.
24:15542019. View Article : Google Scholar
|
|
4
|
Ding X, Hou YL and Hou WR: Structure
feature and antitumor activity of a novel polysaccharide isolated
from Lactarius deliciosus Gray. Carbohydr Polym. 89:397–402. 2012.
View Article : Google Scholar : PubMed/NCBI
|
|
5
|
Yu Y, Shen MY, Song QQ and Xie JH:
Biological activities and pharmaceutical applications of
polysaccharide from natural resources: A review. Carbohydr Polym.
183:91–101. 2018. View Article : Google Scholar : PubMed/NCBI
|
|
6
|
Chen Q, Cao M, Xiang WL, Sun Q, Zhang J,
Hou RT, Yan ZY, Yang ZR, Liu J and Zhao J: Study on genes with
altered expression in alpha-amanitin poisoned mice and evaluation
antagonistic effects of traditional Chinese medicines against its
toxicity. Acta Biol Hung. 60:281–291. 2009. View Article : Google Scholar : PubMed/NCBI
|
|
7
|
Hou YL, Liu L, Ding X, Zhao DQ and Hou WR:
Structure elucidation, proliferation effect on macrophage and its
mechanism of a new heteropolysaccharide from Lactarius deliciosus
Gray. Carbohydr Polym. 152:648–657. 2016. View Article : Google Scholar : PubMed/NCBI
|
|
8
|
Zhang X, Aweya JJ, Huang ZX, Kang ZY, Bai
ZH, Li KH, He XT, Liu Y, Chen XQ and Cheong KL: In vitro
fermentation of Gracilaria lemaneiformis sulfated polysaccharides
and its agaro-oligosaccharides by human fecal inocula and its
impact on microbiota. Carbohydr Polym. 234:1158942020. View Article : Google Scholar : PubMed/NCBI
|
|
9
|
Song G and Du Q: Structure
characterization and antitumor activity of an α β-glucan
polysaccharide from auricularia polytricha. Food Res Int.
45:381–387. 2012. View Article : Google Scholar
|
|
10
|
Kumar S and Gautam N: Chemical and
bioactive profiling, and biological activities of coral fungi from
northwestern Himalayas. Sci Rep. 7:465702017. View Article : Google Scholar : PubMed/NCBI
|
|
11
|
Su S, Yang Q and Li C: Parameter
optimization of extraction technology of polysaccharides from
Ramaria flaccida. Nat Prod Res Dev. 23:751–754. 2011.
|
|
12
|
Li H, Dou X and Lu Q: Optimization of
selected parameters affecting the extraction of DPPH
radical-scavenging polysaccharide from Ramaria botrytis fruit
bodies. Acta Edulis Fungi. 19:69–72. 2012.
|
|
13
|
Ruthes AC, Smiderle FR and Iacomini M:
D-glucans from edible mushrooms: A review on the extraction,
purification and chemical characterization approaches. Carbohydr
Polym. 117:753–761. 2015. View Article : Google Scholar : PubMed/NCBI
|
|
14
|
Bin Y, Ying Y, Xuefei W, Yanqing HU,
Linlin F and Dandan L: Optimization of deproteinized process from
echinops latifolius tausch polysaccharide by response surface
methodology. Sci Technol Food Industry. 35:287–291. 2014.
|
|
15
|
Plancot B, Gügi B, Mollet JC,
Loutelier-Bourhis C, Ramasandra GS, Lerouge P, Follet-Gueye ML,
Vicré M, Alfonso C, Nguema-Ona E, et al: Desiccation tolerance in
plants: Structural characterization of the cell wall hemicellulosic
polysaccharides in three Selaginella species. Carbohydr Polym.
208:180–190. 2019. View Article : Google Scholar : PubMed/NCBI
|
|
16
|
Pandya U, Dhuldhaj U and Sahay NS:
Bioactive mushroom polysaccharides as antitumor: An overview. Nat
Prod Res. 33:2668–2680. 2019. View Article : Google Scholar : PubMed/NCBI
|
|
17
|
Mohan M, Achary A, Mani V, Cicinskas E,
Kalitnik AA and Khotimchenko M: Purification and characterization
of fucose-containing sulphated polysaccharides from Sargassum
tenerrimum and their biological activity. J App Phycol. 1:1–13.
2019.
|
|
18
|
Mannino MR and Orecchio S: Polycyclic
aromatic hydrocarbons (PAHs) in indoor dust matter of Palermo
(Italy) area: Extraction, GC-MS analysis, distribution and sources.
Atmospheric Environment. 42:1801–1817. 2008. View Article : Google Scholar
|
|
19
|
Sathivel A, Raghavendran HB, Srinivasan P
and Devaki T: Anti-peroxidative and anti-hyperlipidemic nature of
Ulva lactuca crude polysaccharide on D-Galactosamine induced
hepatitis in rats. Food Chem Toxicol. 46:3262–3267. 2008.
View Article : Google Scholar : PubMed/NCBI
|
|
20
|
Šilhánek J: Comparisons of the most
important chemistry databases-Scifinder program and reaxys database
system. Chemicke Listy. 108:81–106. 2014.
|
|
21
|
Gao B and Yang GZ: Effects of Ganoderma
applanatum polysaccharide on cellular and humoral immunity in
normal and sarcoma 180 transplanted mice. Phytotherapy Res.
5:134–138. 1991. View Article : Google Scholar
|
|
22
|
Duan DP, Dang XQ, Wang KZ, Wang YP, Zhang
H and You WL: The cyclooxygenase-2 inhibitor NS-398 inhibits
proliferation and induces apoptosis in human osteosarcoma cells via
downregulation of the survivin pathway. Oncol Rep. 28:1693–1700.
2012. View Article : Google Scholar : PubMed/NCBI
|
|
23
|
Parkhomchuk D, Borodina T, Amstislavskiy
V, Banaru M, Hallen L, Krobitsch S, Lehrach H and Soldatov A:
Transcriptome analysis by strand-specific sequencing of
complementary DNA. Nucleic Acids Res. 37:e1232009. View Article : Google Scholar : PubMed/NCBI
|
|
24
|
Daehwan K, Ben L and Steven LS: HISAT: A
fast spliced aligner with low memory requirements. Nat Methods.
12:357–360. 2015. View Article : Google Scholar : PubMed/NCBI
|
|
25
|
Trapnell C, Roberts A, Goff L, Pertea G,
Kim D, Kelley DR, Pimentel H, Salzberg SL, Rinn JL and Pachter L:
Differential gene and transcript expression analysis of RNA-seq
experiments with TopHat and Cufflinks. Nat Protoc. 7:562–578. 2012.
View Article : Google Scholar : PubMed/NCBI
|
|
26
|
Anders S and Huber W: Differential
expression analysis for sequence count data. Genome Biol.
11:R1062010. View Article : Google Scholar : PubMed/NCBI
|
|
27
|
Gao X, Wang J and Zhang S: Integrated
bioinformatics analysis of Hub genes and pathways in anaplastic
thyroid carcinomas. Int J Endocrinol. 2019:96513802019. View Article : Google Scholar : PubMed/NCBI
|
|
28
|
Kanehisa M and Goto S: KEGG: Kyoto
encyclopedia of genes and genomes. Nucleic Acids Res. 28:27–30.
2000. View Article : Google Scholar : PubMed/NCBI
|
|
29
|
Robinson MD, McCarthy DJ and Smyth GK:
edgeR: A Bioconductor package for differential expression analysis
of digital gene expression data. Bioinformatics. 26:139–140. 2010.
View Article : Google Scholar : PubMed/NCBI
|
|
30
|
Martineau E, Khantache KE, Pupier M,
Sepulcric P, Akoka S and Giraudeau P: Non-linear effects in
quantitative 2D NMR of polysaccharides: Pitfalls and how to avoid
them. J Pharm Biomed Anal. 108:78–85. 2015. View Article : Google Scholar : PubMed/NCBI
|
|
31
|
Jahanbin K, Abbasian A and Ahang M:
Isolation, purification and structural characterization of a new
water-soluble polysaccharide from Eremurus stenophyllus (boiss.
& buhse) baker roots. Carbohydrate Polymers. 178:386–393.
2017. View Article : Google Scholar : PubMed/NCBI
|
|
32
|
Santos G, Oliveira ES, Pinheiro ADN, da
Costa PM, de Freitas JCC, de Araújo Santos FG, Maia FMM, de Morais
SM and Nunes-Pinheiro DCS: Himatanthus drasticus (Apocynaceae)
latex reduces oxidative stress and modulates CD4+,
CD8+, FoxP3+ and HSP-60+
expressions in Sarcoma 180-bearing mice. J Ethnopharmacol.
220:159–168. 2018. View Article : Google Scholar : PubMed/NCBI
|
|
33
|
David B, Edward H, Nick A, Takeshi K, Udo
O, Simon H, Daniel S, Dietrich L, John A and Hassan AB: A germline
mutation of CDKN2A and a novel RPLP1-C19MC fusion detected in a
rare melanotic neuroectodermal tumor of infancy: A case report. BMC
Cancer. 16:629–639. 2016. View Article : Google Scholar : PubMed/NCBI
|
|
34
|
Derenzini M, Montanaro L and Trerè D:
Ribosome biogenesis and cancer. Acta Histochem. 119:190–197. 2017.
View Article : Google Scholar : PubMed/NCBI
|
|
35
|
Michael GK, Jill AI, Smrithi MP, Alex SC
and Vassie CW: RpL22e, but not RpL22e-like-PA, is SUMOylated and
localizes to the nucleoplasm of Drosophila meiotic spermatocytes.
Nucleus. 4:241–258. 2013. View Article : Google Scholar : PubMed/NCBI
|
|
36
|
Shimomura T, Kawakami M, Tatsumi K, Tanaka
T, Morita-Takemura S, Kirita T and Wanaka A: The role of the Wnt
signaling pathway in upper jaw development of chick embryo. Acta
Histochem Cytochem. 52:19–26. 2019. View Article : Google Scholar : PubMed/NCBI
|
|
37
|
Young BK, Boh-Ram K, Kyungsil Y, Choi EK,
Seo SH, Yeonah L, Min AL, Jung BY, Mi SP and Seung BR: WIF1 can
effectively co-regulate pro-apoptotic activity through the
combination with DKK1. Cell Signal. 26:2562–2572. 2014. View Article : Google Scholar : PubMed/NCBI
|
|
38
|
Li C, Wang Z, Chen S, Zhang J, Qu K and
Liu C: MicroRNA-552 promotes hepatocellular carcinoma progression
by downregulating WIF1. Int J Mol Med. 42:3309–3317.
2018.PubMed/NCBI
|
|
39
|
Kojima T, Shimazui T, Hinotsu S, Joraku A,
Oikawa T, Kawai K, Horie R, Suzuki H, Nagashima R, Yoshikawa K, et
al: Decreased expression of CXXC4 promotes a malignant phenotype in
renal cell carcinoma by activating Wnt signaling. Oncogene.
28:297–305. 2009. View Article : Google Scholar : PubMed/NCBI
|
|
40
|
Chiurillo M: Role of the Wnt/β-catenin
pathway in gastric cancer: An in-depth literature review. World J
Exp Med. 5:84–102. 2015. View Article : Google Scholar : PubMed/NCBI
|
|
41
|
Hino S, Kishida S, Michiue T, Fukui A,
Sakamoto I, Takada S, Asashima M and Kikuchi A: Inhibition of the
Wnt signaling pathway by Idax, a novel Dvl-binding protein. Mol
Cell Biol. 21:330–342. 2001. View Article : Google Scholar : PubMed/NCBI
|
|
42
|
Wissmann C, Wild PJ, Kaiser S, Roepcke S,
Stoehr R, Woenckhaus M, Kristiansen G, Hsieh JC, Hofstaedter F,
Hartmann A, et al: WIF1, a component of the Wnt pathway, is
down-regulated in prostate, breast, lung, and bladder cancer. J
Pathol. 201:204–212. 2003. View Article : Google Scholar : PubMed/NCBI
|
|
43
|
White JJ, Mazzeu JF, Coban-Akdemir Z,
Bayram Y, Bahrambeigi V, Hoischen A, van Bon BWM, Gezdirici A,
Gulec EY, Ramond F, et al: WNT signaling perturbations underlie the
genetic heterogeneity of Robinow syndrome. Am J Hum Genet.
102:27–43. 2018. View Article : Google Scholar : PubMed/NCBI
|
|
44
|
Zhang T, Chen H, Zhou Y, Dong W, Cai H and
Tan W: Cooperation of FGF/MEK/ERK and Wnt/β-catenin pathway
regulators to promote the proliferation and pluripotency of mouse
embryonic stem cells in serum- and feeder-free conditions.
Bioresources Bioprocessing. 6:122019. View Article : Google Scholar
|
|
45
|
Dolphin AC: Calcium channel auxiliary
α-2/δ and β subunits: Trafficking and one step beyond. Nat Rev
Neurosci. 13:542–555. 2012. View Article : Google Scholar : PubMed/NCBI
|
|
46
|
Fernando C, Victoria S, Lorena A, Fredrik
W, Erik S, Christopher JM and Piero C: RasGRF suppresses
Cdc42-mediated tumour cell movement, cytoskeletal dynamics and
transformation. Nat Cell Bio. 13:819–826. 2011. View Article : Google Scholar
|
|
47
|
Elena S, David M, Michela S, Romilde M,
Maria S, Rita G, Andrea M, Silvio T, Lilia A and Marco V: Novel
RasGRF1-derived Tat-fused peptides inhibiting Ras-dependent
proliferation and migration in mouse and human cancer cells.
Biotechnol Adv. 30:233–243. 2012. View Article : Google Scholar : PubMed/NCBI
|
|
48
|
James DC, Lin LL, Ronald WK and Clark JD:
A novel arachidonic acid-selective cytosolic PLA2 contains a
Ca2+-dependent translocation domain with homology to PKC
and GAP. Cell. 65:1043–1051. 1991. View Article : Google Scholar : PubMed/NCBI
|
|
49
|
Faure G, Corringer PJ and Edelman A:
Therapeutic potential of rattlesnake PLA2: Impact in Cystic
Fibrosis. Toxicon. 149:93–94. 2018. View Article : Google Scholar
|
|
50
|
Jaworska J and Janowski T: Expression of
proinflammatory cytokines IL-1β, IL-6 and TNFα in the retained
placenta of mares. Theriogenology. 126:1–7. 2018. View Article : Google Scholar : PubMed/NCBI
|
|
51
|
Rostami H and Gharibzahedi S:
Cellulase-assisted extraction of polysaccharides from Malva
sylvestris: Process optimization and potential functionalities. Int
J Biol Macromol. 101:196–206. 2017. View Article : Google Scholar : PubMed/NCBI
|